Abstract
Aim
The objective of the study was to identify the association if any, of inflammatory markers (adiponectin and IL-6) with fasting glucose in normoglycemic (healthy), prediabetic (impaired fasting glucose), and hyperglycemic (diabetic) people in Indian population.
Methods
Total 162 volunteers were distributed into 3 groups (normoglycemic, individuals with impaired fasting glucose, and hyperglycemic) as per ADA criterion. The blood chemistry parameters were analyzed and serum adiponectin and IL-6 levels were measured by ELISA.
Results
Significant reduction was observed in serum adiponectin level in hyperglycemic and impaired fasting glucose population compared with normoglycemic population. Significant reduction in adiponectin was also observed in impaired fasting glucose group compared with hyperglycemic group. Similarly significant increase was also observed in IL-6 level in hyperglycemic and impaired fasting glucose groups compared with normoglycemic group.
Conclusions
From our data it can be summarized that there is a significant change in both adiponectin (reduction) and IL-6 (increase) levels in normoglycemic (healthy), prediabetic (impaired fasting glucose), and hyperglycemic (diabetic) population in Indian population. There is a significant but gradual change during the progression of healthy toward diabetic population via pre-diabetic condition.
Keywords: inflammation, adipokines, prediabetic, biomarker
Inflammation plays a significant role in human health.1,2 Optimal level of inflammation is required for immunity enhancement while chronic inflammation is associated with several metabolic disorders like type 2 diabetes, obesity, cardiovascular disease, etc. Though inflammation and type 2 diabetes are directly associated, the cause and effect is not well defined. Several reports have indicated that the progression and severity of the metabolic disorders are well correlated with increased level of inflammatory parameters.3,4 It has also been demonstrated both in animals models and human studies that lowering of end point markers (e.g., HbA1c) using pharmaceutical drugs like Thiazolidinediones and GLP 1 analogs also reduced the levels of inflammatory markers (e.g., IL-6, TNF α etc).5-7
It may be hypothesized that in healthy population, change in pro-inflammatory markers should be compensated by altered anti-inflammatory markers. Any deviation from this profile would lead to systemic disorder. The two important regulators in this context of metabolic disorders are adiponectin and IL6. Adiponectin is a 244 amino acid long protein that is secreted from adipocytes with anti-inflammatory and insulin-sensitizing property.8,9 The other member is pro-inflammatory cytokine, IL-6 which is known to be elevated in diabetes.10,11 These markers though well understood in terms of their regulation in diabetes population are still lacking acceptance as clinical markers due to the variation of levels among various ethnic groups.12,13
In recent times, the number of diabetic and obese people has increased significantly in developing and emerging countries like India and China. Various metagenomic studies indicated the association of common gene variants encoding adipokines and inflammatory markers with adiposity in Asian Indians and role of truncal obesity accounting for the 2-fold excess incidence of diabetes in Asian Indians.14,15 Unfortunately, two main factors are not reported in these meta-genomic studies, i.e., gene function manifestations in pre-diabetic population and comparison of gene function with other ethnic groups.16 In this study, we focused on the importance of inflammation on type 2 diabetes and investigated its association with the progression from normoglycemic to hyperglycemic (type 2 diabetes) via pre-diabetic stage (impaired fasting glucose specifically) in Indian population. In addition, currently limited information is available on inflammatory parameters in type 2 diabetes and people with impaired fasting glucose in Indian population. In this manuscript we highlighted the role of balance of inflammatory regulators (adiponectin and IL 6) in progression of type 2 diabetes in Indian population.
Results
Table 1 lists the clinical and biochemical parameters of the three groups. Total cholesterol, triglycerides, LDL contents increased significantly and HDL content decreased significantly in serum of diabetic and pre-diabetic groups compared with the normoglycemic individuals. In addition, the liver function enzymes also increased significantly in pre-diabetic and hyperglycemic groups compared with normoglycemic individuals.
Table 1. Clinical and biochemical characteristics of the study groups.
| Normoglycemia (n = 81) | Impaired fasting glucose (n = 49) | Hyperglycemia (n = 32) | |
|---|---|---|---|
| Age (y) | 46.53 ± 0.89 | 46.22 ± 1.06 | 47.66 ± 1.51 |
| Gender | M-39, F-42 | M-25, F- 24 | M-14, F-18 |
| Height (m) | 1.58 ± 0.01 | 1.59 ± 0.01 | 1.6 ± 0.01 |
| Weight (kg) | 59.68 ± 1.18 | 65.75 ± 1.22b | 65.83 ± 1.54a |
| BMICal (kg/m2) | 23.72 ± 0.36 | 25.92 ± 0.35b | 25.85 ± 0.57a |
| Waist (cm) | 83.49 ± 1.06 | 91.21 ± 1.06b | 90.78 ± 1.48b |
| Hip (cm) | 97.20 ± 0.82 | 102.56 ± 0.9b | 104.05 ± 1.25b |
| Waist-to-hip ratio | 0.86 ± 0.01 | 0.89 ± 0.01a | 0.87 ± 0.01 |
| Cholesterol (mmol/L) | 4.63 ± 0.1 | 5.22 ± 0.15a | 5.14 ± 0.21 |
| Triglyceride (mmol/L) | 1.52 ± 0.09 | 2.30 ± 0.17b | 2.75 ± 0.35a |
| High density lipoprotein cholesterol (mmol/L) | 1.05 ± 0.03 | 0.93 ± 0.03a | 0.87 ± 0.03b |
| Low density lipoprotein cholesterol (mmol/L) | 2.99 ± 0.08 | 3.39 ± 0.14a | 3.21 ± 0.21 |
| Very low density lipoprotein (mmol/L) | 0.68 ± 0.04 | 1.04 ± 0.08b | 1.24 ± 0.16a |
| TC/ HDL | 4.65 ± 0.13 | 5.78 ± 0.22b | 6.08 ± 0.31b |
| Bilirubin (μmol/L) | 10.3 ± 0.63 | 9.15 ± 0.7 | 10.9 ± 1.09 |
| Aspartate aminotransferase (AST) (U/L) | 21.03 ± 1 | 25.92 ± 3.7 | 23.4 ± 1.84 |
| Alanine aminotransferase (ALT) (U/L) | 18.69 ± 0.86 | 28.38 ± 4.77a | 26.04 ± 3.11 |
| AST/ ALT | 1.2 ± 0.04 | 1.03 ± 0.04a | 1.01 ± 0.05a |
| Alkaline Phosphatase (ALP) (U/L) | 81.22 ± 2.5 | 91.93 ± 4.3a | 104.40 ± 4.51b |
| Gamma-glutamyl transpeptidase (GGTLI) (U/L) | 22.92 ± 2.14 | 34.36 ± 4.6a | 39.18 ± 5.06a |
| High sensitivity C reactive protein (mg/L) | 0.30 ± 0.05 | 0.39 ± 0.04 | 0.53 ± 0.07a |
| Glucose (mmol/L) | 4.98 ± 0.04 | 6.25 ± 0.06b | 10.42 ± 0.79b, c |
| HbA1c mmol/mol; (%) | 36 ± 0.5; (5.42 ± 0.05) | 44 ± 0.9; (6.14 ± 0.08b) | 65 ± 4.3; (8.1 ± 0.39b, c) |
Data are represented as mean ± SE. aP < 0.05 compared with normoglycemia, bP < 0.001 compared with normoglycemia, cP < 0.001 compared with impaired fasting glucose.
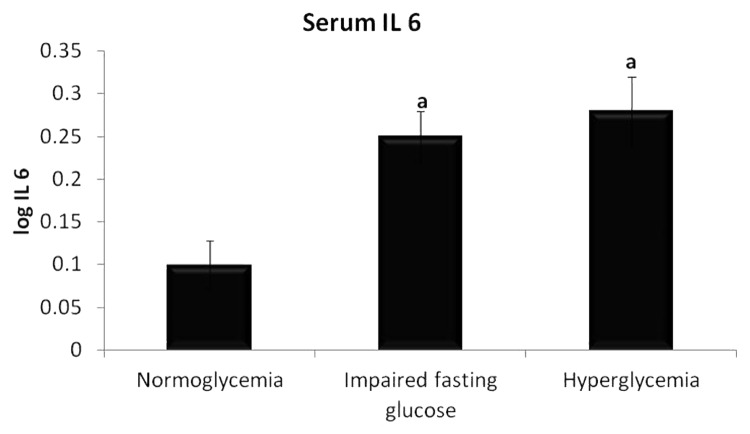
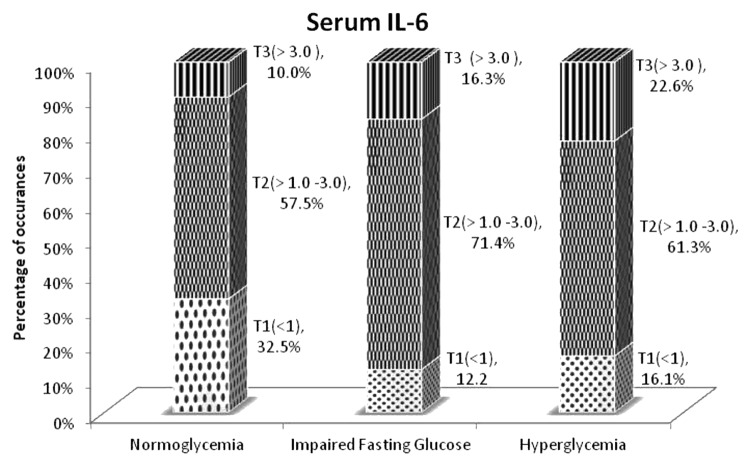
Serum IL 6 levels were significantly higher in IFG population compared with normoglycemic population (2.00 ± 0.14 pg/ml vs 1.77 ± 0.23 pg/ml, P < 0.05). On comparing the hyperglycemic population with normoglycemic population, the increase was statistically significant (2.84 ± 0.62 pg/ml vs 1.77 ± 0.23 pg/ml, P < 0.01). No significant difference was observed between IFG and hyperglycemic groups. The result is as shown in Figure 1.
Figure 1. Levels of serum IL 6 in three groups of individuals. Data are represented as mean ± SE. aP < 0.05 compared with normoglycemic group.
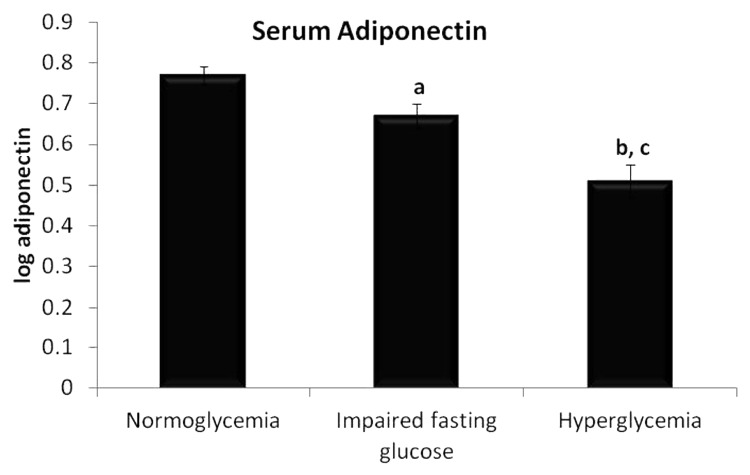
Significant difference was observed in serum adiponectin levels as shown in Figure 2. The level was highest in the normoglycemic population (6.9 ± 0.45 μg/ml) and found to be lesser in the remaining 2 groups as per disease progression. Significant lowering in the adiponectin levels in serum was observed in IFG (5.57 ± 0.53 μg/ml) and hyperglycemic group (4.0 ± 0.42 μg/ml) compared with normoglycemic group (P < 0.05 and P < 0.001 respectively). In addition, the adiponectin levels in serum reduced significantly in hyperglycemic group when compared with IFG group (P < 0.05).
Figure 2. Levels of serum adiponectin in three groups of individuals. Data are represented as mean ± SE. aP < 0.05 and cP < 0.001 compared with normoglycemic group, and bP < 0.05 compared with Impaired fasting glucose group.
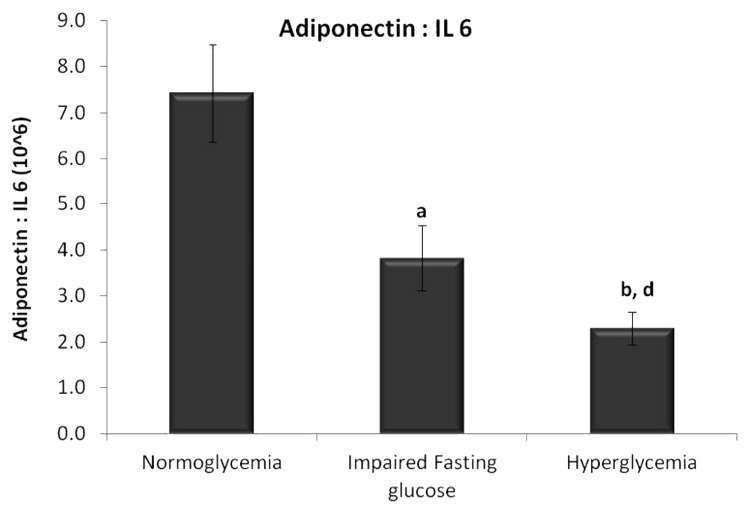
Diabetes is an inflammatory disease and when the ratios of adiponectin (anti-inflammatory adipokine) to IL 6 (pro inflammatory cytokine) were compared among the three groups, there was a significant decrease in the ratio (Fig. 3) with progression from normoglycemia to IFG (P < 0.005) to hyperglycemia (P < 0.001). The decrease in the ratio with the progression of IFG to hyperglycemia is a statistically significant (P < 0.05) change.
Figure 3. Ratio of adiponectin to IL 6 levels in serum. Data are represented as mean ± SE. aP < 0.005, bP < 0.001 compared with normoglycemic group, dP < 0.05 compared with impaired fasting glucose group.
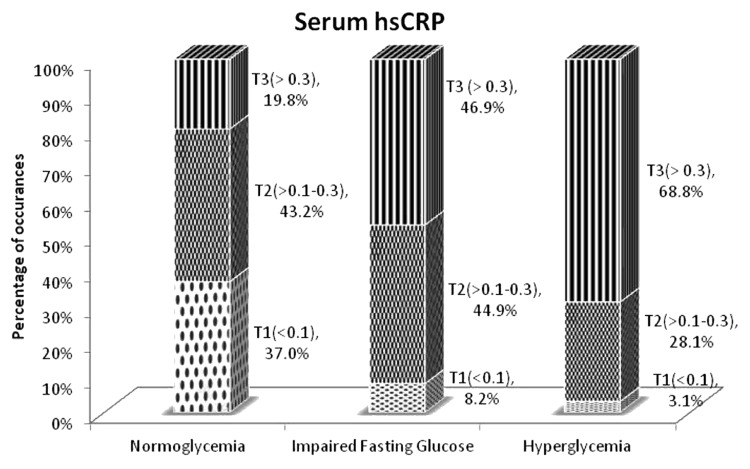
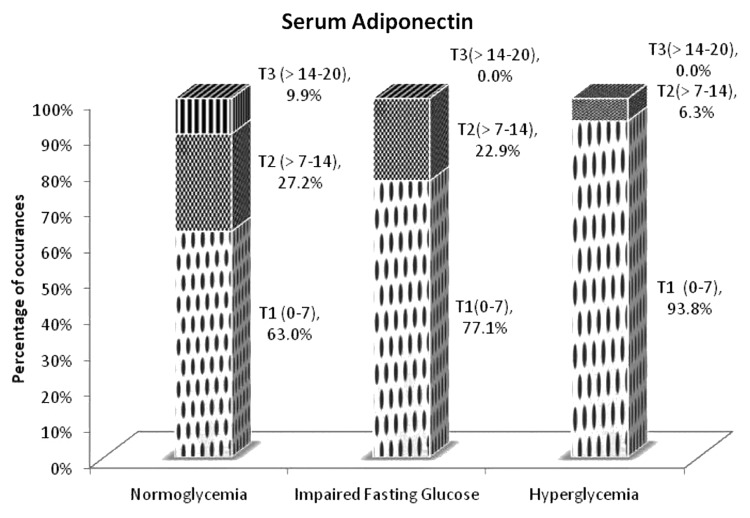
In addition, when the levels of inflammatory markers, i.e., high sensitivity C reactive protein and IL 6 were divided into tertiles, the largest proportion of normoglycemia individuals were in the first tertile of these markers (which is the normal physiological range) whereas the larger proportion of the IFG and hyperglycemia when compared with normoglycemia individuals were in the third tertile of the markers (higher level of inflammation) (Figs. 4 and 5).
Figure 4. Proportion of group in each tertile of serum high sensitivity C reactive protein in three groups of individuals. Dots, Tertile 1 (T1) represents hsCRP levels < 0.1 mg/L; checkerboard, Tertile 2 (T2) represents hsCRP levels 0.1–0.3 mg/L; stripes, Tertile 3 (T3) represents hsCRP levels > 0.3 mg/L.
Figure 5. Proportion of group in each tertile of serum IL-6 in three groups of individuals. Dots, Tertile 1 (T1) represents IL-6 levels < 1.0 pg/ml; checkerboard, Tertile 2 (T2) representing represents IL-6 levels 1.0–3.0 pg/ml; stripes, Tertile 3 (T3) represents IL-6 levels > 3.0 pg/ml.
In case of adiponectin, as expected, the reverse was observed with the largest proportion of normoglycemia individuals in the third tertile (maximum level of anti-inflammation) and larger proportion of the IFG and hyperglycemic individuals in the first tertile of serum adiponectin levels, which means higher level of inflammation (i.e., lowest anti-inflammation or adiponectin level) (Fig. 6).
Figure 6. Proportion of group in each tertile of serum adiponectin in three groups of individuals. Dots, Tertile 1 (T1) represents adiponectin levels 0–7.0 μg/ml; checkerboard, Tertile 2 (T2) represents adiponectin levels 7.0–14.0 μg/ml; stripes, Tertile 3 (T3) represents adiponectin levels 14.0–21.0 μg/ml.
Discussion
The adipose tissue mass increase occurs by the expansion of pre-existing adipocytes (adipocye hypertrophy) or by generating new small adipocytes. Chronic overfeeding results in adipocyte hypertrophy and is associated with decreased adiponectin levels and increased IL-6, and TNF-α production. In addition, the abnormal functioning of adipocytes like lipodystrophy and inability to store triglycerides and fatty acids may result in ectopic fat storage in liver, skeletal muscle etc., thus causing dyslipidemia and insulin resistance. This condition may also play an important role in the development of a chronic low-grade pro-inflammatory state associated with adipose tissue dysfunction and diabetes. Enlarged adipocytes commonly associated with South Asian population appear to lead to an imbalance between pro- and anti-inflammatory adipokines.15,16 The secretions of pro-inflammatory cytokines IL-6, IL-8, MCP-1, and GM-CSF have been positively correlated with adipocyte size.17
Significant correlation with insulin resistance makes adiponectin a powerful prognostic marker for diabetic risk in patients who do not yet manifest T2DM. The protective effects of adiponectin in prevention of progression of insulin resistance and in cardiovascular events, and its potent influence in components of the metabolic syndrome, have made it a highly promising therapeutic target.18-21 Numerous clinical studies have reported the inverse relationship between adiponectin and insulin resistance.12 Low circulating adiponectin levels is associated with a decrease in whole body insulin sensitivity in humans and has been shown to be predictive of future development of diabetes in few studies.12 In diabetes prevention program studies, subjects who are at the risk of type 2 diabetes were followed up for the progression to type 2 diabetes. Low levels of baseline adiponectin had a strong correlation with the onset of T2DM. The subjects who progressed to T2DM within one year had very low baseline value of adiponectin. This study concluded adiponectin as a powerful marker of diabetes risk in subjects at high risk for diabetes, even after adjustment for weight. An increase in adiponectin in the lifestyle and placebo groups was associated with a reduction in diabetes risk.22
The populations where adiponectin as marker were investigated were from various ethnic groups.12,23-25 There is a need to evaluate adiponectin levels in Indian population as there is limited population based evidence among Indians during the progression of normoglycemic to hyperglycemic condition. A recent study done by Mohan et al. indicated profiling of serum adiponectin in healthy, IGT, and diabetic individuals.26 Adiponectin levels in IFG individuals were not evaluated in that study.
IL-6 is a major pro-inflammatory cytokine, secreted from leucocytes, adipocytes, skeletal muscle and endothelial cells. In vitro studies have shown that IL-6 treatment downregulates adiponectin mRNA suggesting a negative role of IL-6 in adiponectin regulation.27 Experimental studies and cross-sectional analyses have shown that circulating IL-6 is associated with hyperglycemia and insulin resistance. It has also been shown that circulating IL-6 increases with the degree of insulin resistance.28,29 Though these studies evaluated the levels of the cytokine in healthy, IGT, and diabetic individuals, individuals with impaired fasting glucose were not considered. The level of CRP and IL-6 reported is approximately 10-fold higher than what we have observed in our study population.26 It has been reported in German populations that serum adiponectin, hsCRP, and IL-6 levels were not significantly different between IFG and IGT individuals30 but no information is available from other ethnic groups.
We also found metabolic dyslipidemia characterized by high circulating cholesterol, triglycerides, LDL, and low circulating HDL in our study. The increase in the lipid parameters during transition from pre-diabetes (IFG) to hyperglycemia clearly indicates that hepatic metabolism of cholesterol, triglycerides, and lipoprotein metabolism is impaired and hepatic insulin sensitivity is compromised which would definitely contribute to impaired fasting glucose.31
Our results also indicate that the levels of liver enzymes increase significantly during disease progression. Various other studies have shown that increase in the levels of these hepatic enzymes is associated with later development of type 2 diabetes.32,33 Both adipocyte hypertrophy and lipodystrophy results in increase in inflammatory cytokines like IL-6 and release of fatty acids into the circulation. The excessive deposition of triglycerides inside the liver along with the inflammatory cytokines could induce hepatocellular damage which may lead to an increase in high levels of circulating liver enzymes.34 It is also hypothesized that elevation in ALT, a gluconeogenic enzyme whose gene transcription is suppressed by insulin could indicate impairment in insulin signaling rather than hepatocyte injury.35 The ratio of AST to ALT showed a decreasing trend along with the disease progression. This is in congruence with similar study done in Thailand population where ALT levels were strongly indicative of future risk of developing IFG and type 2 diabetes.36
Another observation in our study was the increase in the high sensitivity C-reactive protein (hsCRP) in diabetics. High sensitivity CRP is synthesized in hepatocytes and is widely recognized as a marker for subclinical inflammation. Prospective studies have shown that high hsCRP is predictive of metabolic syndrome, type 2 diabetes, and coronary heart disease. Studies have also shown positive correlation with abdominal obesity and CRP in Asian Indians.37,38 In Japanese populations high levels of hsCRP was a strong predictor of non-alcoholic fatty liver disease.39 Recently increased levels of hsCRP have been reported in Indian population.40 In case of individuals with impaired glucose tolerance, the levels of hsCRP were higher than that of individuals with impaired fasting glucose. In addition it was also observed in that study that there were gender based differences in the levels of hsCRP across all groups. Similarly, we have observed that there are significant gender based differences in normoglycemic individuals both in the case of hsCRP and adiponectin levels (P < 0.05); in IFG, this was observed only in the case of adiponectin (P < 0.005) whereas in hyperglycemic condition, this was observed only in the hsCRP levels (P < 0.05). The gender-specific differences (increased levels in females) observed in this group of people are in line with a study conducted on a Finnish population.41 This study did not note any significant difference in the levels of hsCRP as in the case of our study. Similar to the Finnish study, we observed that adiponectin concentrations in women decreased relatively more compared with men across individuals with normoglycemia, IFG, and type 2 diabetes, whereas inflammatory markers increased relatively more in women.
In the case of IL 6, there was no significant difference between genders across all groups (Table 2).
Table 2. Gender based differences in the levels of inflammatory markers.
| Normoglycemia | IFG | Hyperglycemia | ||
|---|---|---|---|---|
| hsCRP (mg/L) | M | 0.19 ± 0.05 | 0.34 ± 0.05 | 0.35 ± 0.1 |
| F | 0.41 ± 0.09a | 0.44 ± 0.07 | 0.67 ± 0.08a | |
| IL 6 (pg/ml) | M | 1.41 ± 0.17 | 2.11 ± 0.25 | 1.94 ± 0.39 |
| F | 1.71 ± 0.13 | 1.89 ± 0.14 | 2.5 ± 0.26 | |
| Adiponectin (μg/ml) | M | 5.82 ± 0.48 | 4.05 ± 0.5 | 4.29 ± 0.82 |
| F | 8.26 ± 0.78a | 7.17 ± 0.85b | 3.74 ± 0.42c,d |
Data are represented as mean ± SE. aP < 0.05 and bP < 0.005 when the two genders are compared. cP < 0.005 when compared with corresponding normoglycemic group, dP < 0.05 when compared IFG group.
From our data it can be summarized that there is a significant change in both adiponectin and IL-6 levels in healthy, prediabetic, and diabetic population in Indian population. There is a significant but gradual change during the progression of healthy toward diabetic population via pre-diabetic condition. This is a pilot study and needs to be validated in larger cohort.
Materials and Methods
The study was approved by the Unilever Independent Research Ethics Committee (UIEC), India. Pregnant or lactating females, subjects with renal diseases, smokers, and subjects consuming more than 60 ml alcohol/week or exercising more than 10 h/week were excluded from the study. Diagnosis of Type 2 diabetes was based on fasting blood glucose and American Diabetes Association guidelines. The cohort consisted of 162 volunteers (78 males, 84 females) aged between 28–60 y (mean age 46 y) and of Indian origin. Diabetic (n = 32) and prediabetic (n = 49) volunteers were gender and age matched with volunteers who are normoglycemic (n = 81). Informed consent was obtained from all the volunteers before initiation of the study.
The groups were classified as per ADA norm: Normoglycemia or healthy (fasting glucose < 100 mg/dl), impaired fasting glucose or pre-diabetes (fasting glucose > 100 mg/dl to < 126 mg/dl), and hyperglycemia or diabetes (fasting glucose > 126 mg/dl).
Physical examination included height and weight measurements, and the body mass index (BMI) was calculated using the formula: weight (kg) divided by height in meters squared. Waist and hip measurements were made in the standing position using standard techniques. A fasting blood sample was taken and the serum was separated and used for the assay. Clinical measurements: total cholesterol, low density lipoprotein cholesterol (LDL-C), high density lipoprotein cholesterol (HDL-C), triglycerides (TG), blood urea, glycated hemoglobin (HbA1c), blood glucose, creatinine, serum bilirubin, aspartate aminotransferase (ASAT), alanine aminotransferase (ALAT), glutamyl transferase (GGT), alkaline phosphatase (ALP), and high sensitivity creactive protein (hsCRP) were measured using Roche Hitachi 912 automatic analyzer. Serum adiponectin and serum IL-6 levels were quantified using ELISA kits (R&D Systems).
Data Analysis
As mentioned earlier, the volunteers were classified into 3 groups, namely normoglycemia or healthy, impaired fasting glucose (IFG) or prediabetes, and hyperglycemic or type 2 diabetes. The range of serum high sensitivity CRP, IL-6, and adiponectin quantified in our study samples were divided into tertiles and the proportion of individuals from the three groups falling in each of the tertiles were analyzed.
Data were assessed for normality and skewed data were logarithmically transformed before statistical analysis.
ANOVA adjusting for the effects of gender and age was performed to compare normoglycemia or healthy, impaired fasting glucose (IFG) or pre-diabetes and hyperglycemic or type 2 diabetes. All statistical analyses were performed using SAS software version 9.3.
Tables and graphs represents mean ± SE of absolute values and log transformed units respectively.
Disclosure of Potential Conflicts of Interest
No potential conflicts of interest were disclosed.
Acknowledgments
We are thankful to Prof P.R. Krishnaswamy and Dr Vilas Sinkar for providing critical inputs and suggestions during the planning and execution of this study.
Footnotes
Previously published online: www.landesbioscience.com/journals/adipocyte/article/26553
References
- 1.Nikolajczyk BS, Jagannathan-Bogdan M, Shin H, Gyurko R. State of the union between metabolism and the immune system in type 2 diabetes. Genes Immun. 2011;12:239–50. doi: 10.1038/gene.2011.14. [DOI] [PMC free article] [PubMed] [Google Scholar]
- 2.Mathis D, Shoelson SE. Immunometabolism: an emerging frontier. Nat Rev Immunol. 2011;11:81–3. doi: 10.1038/nri2922. [DOI] [PMC free article] [PubMed] [Google Scholar]
- 3.Donath MY, Shoelson SE. Type 2 diabetes as an inflammatory disease. Nat Rev Immunol. 2011;11:98–107. doi: 10.1038/nri2925. [DOI] [PubMed] [Google Scholar]
- 4.Eizirik DL, Colli ML, Ortis F. The role of inflammation in insulitis and β-cell loss in type 1 diabetes. Nat Rev Endocrinol. 2009;5:219–26. doi: 10.1038/nrendo.2009.21. [DOI] [PubMed] [Google Scholar]
- 5.Schmidt MI, Duncan BB, Sharrett AR, Lindberg G, Savage PJ, Offenbacher S, Azambuja MI, Tracy RP, Heiss G. Markers of inflammation and prediction of diabetes mellitus in adults (Atherosclerosis Risk in Communities study): a cohort study. Lancet. 1999;353:1649–52. doi: 10.1016/S0140-6736(99)01046-6. [DOI] [PubMed] [Google Scholar]
- 6.Klempfner R, Leor J, Tenenbaum A, Fisman EZ, Goldenberg I. Effects of a vildagliptin/metformin combination on markers of atherosclerosis, thrombosis, and inflammation in diabetic patients with coronary artery disease. Cardiovasc Diabetol. 2012;11:60. doi: 10.1186/1475-2840-11-60. [DOI] [PMC free article] [PubMed] [Google Scholar]
- 7.Sharma PK, Bhansali A, Sialy R, Malhotra S, Pandhi P. Effects of pioglitazone and metformin on plasma adiponectin in newly detected type 2 diabetes mellitus. Clin Endocrinol (Oxf) 2006;65:722–8. doi: 10.1111/j.1365-2265.2006.02658.x. [DOI] [PubMed] [Google Scholar]
- 8.Kadowaki T, Yamauchi T, Kubota N, Hara K, Ueki K, Tobe K. Adiponectin and adiponectin receptors in insulin resistance, diabetes, and the metabolic syndrome. J Clin Invest. 2006;116:1784–92. doi: 10.1172/JCI29126. [DOI] [PMC free article] [PubMed] [Google Scholar]
- 9.Villarreal-Molina MT, Antuna-Puente B. Adiponectin: anti-inflammatory and cardioprotective effects. Biochimie. 2012;94:2143–9. doi: 10.1016/j.biochi.2012.06.030. [DOI] [PubMed] [Google Scholar]
- 10.Rotter V, Nagaev I, Smith U. Interleukin-6 (IL-6) induces insulin resistance in 3T3-L1 adipocytes and is, like IL-8 and tumor necrosis factor-α, overexpressed in human fat cells from insulin-resistant subjects. J Biol Chem. 2003;278:45777–84. doi: 10.1074/jbc.M301977200. [DOI] [PubMed] [Google Scholar]
- 11.Spranger J, Kroke A, Möhlig M, Hoffmann K, Bergmann MM, Ristow M, Boeing H, Pfeiffer AF. Inflammatory cytokines and the risk to develop type 2 diabetes: results of the prospective population-based European Prospective Investigation into Cancer and Nutrition (EPIC)-Potsdam Study. Diabetes. 2003;52:812–7. doi: 10.2337/diabetes.52.3.812. [DOI] [PubMed] [Google Scholar]
- 12.Li S, Shin HJ, Ding EL, van Dam RM. Adiponectin levels and risk of type 2 diabetes: a systematic review and meta-analysis. JAMA. 2009;302:179–88. doi: 10.1001/jama.2009.976. [DOI] [PubMed] [Google Scholar]
- 13.Mente A, Razak F, Blankenberg S, Vuksan V, Davis AD, Miller R, Teo K, Gerstein H, Sharma AM, Yusuf S, et al. Study of the Health Assessment And Risk Evaluation. Study of the Health Assessment And Risk Evaluation in Aboriginal Peoples Investigators Ethnic variation in adiponectin and leptin levels and their association with adiposity and insulin resistance. Diabetes Care. 2010;33:1629–34. doi: 10.2337/dc09-1392. [DOI] [PMC free article] [PubMed] [Google Scholar]
- 14.Tabassum R, Mahendran Y, Dwivedi OP, Chauhan G, Ghosh S, Marwaha RK, Tandon N, Bharadwaj D. Common variants of IL6, LEPR, and PBEF1 are associated with obesity in Indian children. Diabetes. 2012;61:626–31. doi: 10.2337/db11-1501. [DOI] [PMC free article] [PubMed] [Google Scholar]
- 15.Tillin T, Hughes AD, Godsland IF, Whincup P, Forouhi NG, Welsh P, Sattar N, McKeigue PM, Chaturvedi N. Insulin resistance and truncal obesity as important determinants of the greater incidence of diabetes in Indian Asians and African Caribbeans compared with Europeans: the Southall And Brent REvisited (SABRE) cohort. Diabetes Care. 2013;36:383–93. doi: 10.2337/dc12-0544. [DOI] [PMC free article] [PubMed] [Google Scholar]
- 16.Ramachandran A, Snehalatha C, Viswanathan V, Viswanathan M, Haffner SM. Risk of noninsulin dependent diabetes mellitus conferred by obesity and central adiposity in different ethnic groups: a comparative analysis between Asian Indians, Mexican Americans and Whites. Diabetes Res Clin Pract. 1997;36:121–5. doi: 10.1016/S0168-8227(97)00040-5. [DOI] [PubMed] [Google Scholar]
- 17.Esteve E, Ricart W, Fernández-Real JM. Adipocytokines and insulin resistance: the possible role of lipocalin-2, retinol binding protein-4, and adiponectin. Diabetes Care. 2009;32(Suppl 2):S362–7. doi: 10.2337/dc09-S340. [DOI] [PMC free article] [PubMed] [Google Scholar]
- 18.Skurk T, Alberti-Huber C, Herder C, Hauner H. Relationship between adipocyte size and adipokine expression and secretion. J Clin Endocrinol Metab. 2007;92:1023–33. doi: 10.1210/jc.2006-1055. [DOI] [PubMed] [Google Scholar]
- 19.Tschritter O, Fritsche A, Thamer C, Haap M, Shirkavand F, Rahe S, Staiger H, Maerker E, Häring H, Stumvoll M. Plasma adiponectin concentrations predict insulin sensitivity of both glucose and lipid metabolism. Diabetes. 2003;52:239–43. doi: 10.2337/diabetes.52.2.239. [DOI] [PubMed] [Google Scholar]
- 20.Zoccali C, Mallamaci F, Tripepi G, Benedetto FA, Cutrupi S, Parlongo S, Malatino LS, Bonanno G, Seminara G, Rapisarda F, et al. Adiponectin, metabolic risk factors, and cardiovascular events among patients with end-stage renal disease. J Am Soc Nephrol. 2002;13:134–41. doi: 10.1681/ASN.V131134. [DOI] [PubMed] [Google Scholar]
- 21.Kazumi T, Kawaguchi A, Sakai K, Hirano T, Yoshino G. Young men with high-normal blood pressure have lower serum adiponectin, smaller LDL size, and higher elevated heart rate than those with optimal blood pressure. Diabetes Care. 2002;25:971–6. doi: 10.2337/diacare.25.6.971. [DOI] [PubMed] [Google Scholar]
- 22.Mather KJ, Funahashi T, Matsuzawa Y, Edelstein S, Bray GA, Kahn SE, Crandall J, Marcovina S, Goldstein B, Goldberg R, Diabetes Prevention Program Adiponectin, change in adiponectin, and progression to diabetes in the Diabetes Prevention Program. Diabetes. 2008;57:980–6. doi: 10.2337/db07-1419. [DOI] [PMC free article] [PubMed] [Google Scholar]
- 23.Gardener H, Crisby M, Sjoberg C, Hudson B, Goldberg R, Mendez AJ, Wright CB, Rundek T, Elkind MS, Sacco RL. Serum adiponectin in relation to race-ethnicity and vascular risk factors in the Northern Manhattan Study. Metab Syndr Relat Disord. 2013;11:46–55. doi: 10.1089/met.2012.0065. [DOI] [PMC free article] [PubMed] [Google Scholar]
- 24.Xu MT, Chen XC, Jin LZ, Chen WQ. [A Meta-analysis on the association between adiponectin gene 45T/G/276G/T polymorphisms and type 2 diabetes in Chinese population] Zhonghua Liu Xing Bing Xue Za Zhi. 2008;29:1132–6. [PubMed] [Google Scholar]
- 25.Rasmussen-Torvik LJ, Wassel CL, Ding J, Carr J, Cushman M, Jenny N, Allison MA. Associations of body mass index and insulin resistance with leptin, adiponectin, and the leptin-to-adiponectin ratio across ethnic groups: the Multi-Ethnic Study of Atherosclerosis (MESA) Ann Epidemiol. 2012;22:705–9. doi: 10.1016/j.annepidem.2012.07.011. [DOI] [PMC free article] [PubMed] [Google Scholar]
- 26.Indulekha K, Anjana RM, Surendar J, Mohan V. Association of visceral and subcutaneous fat with glucose intolerance, insulin resistance, adipocytokines and inflammatory markers in Asian Indians (CURES-113) Clin Biochem. 2011;44:281–7. doi: 10.1016/j.clinbiochem.2010.12.015. [DOI] [PubMed] [Google Scholar]
- 27.Fasshauer M, Kralisch S, Klier M, Lossner U, Bluher M, Klein J, Paschke R. Adiponectin gene expression and secretion is inhibited by interleukin-6 in 3T3-L1 adipocytes. Biochem Biophys Res Commun. 2003;301:1045–50. doi: 10.1016/S0006-291X(03)00090-1. [DOI] [PubMed] [Google Scholar]
- 28.Pradhan AD, Manson JE, Rifai N, Buring JE, Ridker PM. C-reactive protein, interleukin 6, and risk of developing type 2 diabetes mellitus. JAMA. 2001;286:327–34. doi: 10.1001/jama.286.3.327. [DOI] [PubMed] [Google Scholar]
- 29.Deepa R, Velmurugan K, Arvind K, Sivaram P, Sientay C, Uday S, Mohan V. Serum levels of interleukin 6, C-reactive protein, vascular cell adhesion molecule 1, and monocyte chemotactic protein 1 in relation to insulin resistance and glucose intolerance--the Chennai Urban Rural Epidemiology Study (CURES) Metabolism. 2006;55:1232–8. doi: 10.1016/j.metabol.2006.05.008. [DOI] [PubMed] [Google Scholar]
- 30.Tönjes A, Fasshauer M, Kratzsch J, Stumvoll M, Blüher M. Adipokine pattern in subjects with impaired fasting glucose and impaired glucose tolerance in comparison to normal glucose tolerance and diabetes. PLoS One. 2010;5:e13911. doi: 10.1371/journal.pone.0013911. [DOI] [PMC free article] [PubMed] [Google Scholar]
- 31.Meshkani R, Adeli K. Hepatic insulin resistance, metabolic syndrome and cardiovascular disease. Clin Biochem. 2009;42:1331–46. doi: 10.1016/j.clinbiochem.2009.05.018. [DOI] [PubMed] [Google Scholar]
- 32.Porter SA, Pedley A, Massaro JM, Vasan RS, Hoffmann U, Fox CS. Aminotransferase levels are associated with cardiometabolic risk above and beyond visceral fat and insulin resistance: the Framingham Heart Study. Arterioscler Thromb Vasc Biol. 2013;33:139–46. doi: 10.1161/ATVBAHA.112.300075. [DOI] [PMC free article] [PubMed] [Google Scholar]
- 33.Anand SS, Tarnopolsky MA, Rashid S, Schulze KM, Desai D, Mente A, Rao S, Yusuf S, Gerstein HC, Sharma AM. Adipocyte hypertrophy, fatty liver and metabolic risk factors in South Asians: the Molecular Study of Health and Risk in Ethnic Groups (mol-SHARE) PLoS One. 2011;6:e22112. doi: 10.1371/journal.pone.0022112. [DOI] [PMC free article] [PubMed] [Google Scholar]
- 34.Barzilay JI, Abraham L, Heckbert SR, Cushman M, Kuller LH, Resnick HE, Tracy RP. The relation of markers of inflammation to the development of glucose disorders in the elderly: the Cardiovascular Health Study. Diabetes. 2001;50:2384–9. doi: 10.2337/diabetes.50.10.2384. [DOI] [PubMed] [Google Scholar]
- 35.O’Brien RM, Granner DK. Regulation of gene expression by insulin. Biochem J. 1991;278:609–19. doi: 10.1042/bj2780609. [DOI] [PMC free article] [PubMed] [Google Scholar]
- 36.Jiamjarasrangsi W, Sangwatanaroj S, Lohsoonthorn V, Lertmaharit S. Increased alanine aminotransferase level and future risk of type 2 diabetes and impaired fasting glucose among the employees in a university hospital in Thailand. Diabetes Metab. 2008;34:283–9. doi: 10.1016/j.diabet.2008.01.009. [DOI] [PubMed] [Google Scholar]
- 37.Ridker PM, Buring JE, Cook NR, Rifai N. C-reactive protein, the metabolic syndrome, and risk of incident cardiovascular events: an 8-year follow-up of 14 719 initially healthy American women. Circulation. 2003;107:391–7. doi: 10.1161/01.CIR.0000055014.62083.05. [DOI] [PubMed] [Google Scholar]
- 38.Vikram NK, Misra A, Dwivedi M, Sharma R, Pandey RM, Luthra K, Chatterjee A, Dhingra V, Jailkhani BL, Talwar KK, et al. Correlations of C-reactive protein levels with anthropometric profile, percentage of body fat and lipids in healthy adolescents and young adults in urban North India. Atherosclerosis. 2003;168:305–13. doi: 10.1016/S0021-9150(03)00096-0. [DOI] [PubMed] [Google Scholar]
- 39.Kogiso T, Moriyoshi Y, Shimizu S, Nagahara H, Shiratori K. High-sensitivity C-reactive protein as a serum predictor of nonalcoholic fatty liver disease based on the Akaike Information Criterion scoring system in the general Japanese population. J Gastroenterol. 2009;44:313–21. doi: 10.1007/s00535-009-0002-5. [DOI] [PubMed] [Google Scholar]
- 40.Jaiswal A, Tabassum R, Podder A, Ghosh S, Tandon N, Bharadwaj D. Elevated level of C-reactive protein is associated with risk of prediabetes in Indians. Atherosclerosis. 2012;222:495–501. doi: 10.1016/j.atherosclerosis.2012.02.034. [DOI] [PubMed] [Google Scholar]
- 41.Saltevo J, Kautiainen H, Vanhala M. Gender differences in adiponectin and low-grade inflammation among individuals with normal glucose tolerance, prediabetes, and type 2 diabetes. Gend Med. 2009;6:463–70. doi: 10.1016/j.genm.2009.09.006. [DOI] [PubMed] [Google Scholar]


