

Abstract
Increases in drug abuse, injection, and opioid overdoses in suburban communities led us to study injectors residing in suburban communities in southwestern Connecticut, US. We sought to understand the influence of residence on risk and injection-associated diseases. Injectors were recruited by respondent-driven sampling and interviewed about sociodemographics, somatic and mental health, injection risk, and interactions with healthcare, harm reduction, substance abuse treatment, and criminal justice systems. HIV, hepatitis B and C (HBV and HCV) serological testing was also conducted. Our sample was consistent in geographic distribution and age to the general population and to the patterns of heroin-associated overdose deaths in the suburban towns. High rates of interaction with drug abuse treatment and criminal justice systems contrasted with scant use of harm reduction services. The only factors associated with both dependent variables—residence in less disadvantaged census tracts and more injection risk—were younger age and injecting in one’s own residence. This contrasts with the common association among urban injectors of injection-associated risk behaviors and residence in disadvantaged communities. Poor social support and moderate/severe depression were associated with risky injection practices (but not residence in specific classes of census tracts), suggesting that a region-wide dual diagnosis approach to the expansion of harm reduction services could be effective at reducing the negative consequences of injection drug use.
Keywords: Injection drug use, Suburbs, Injection risk, Community disadvantage index, Harm reduction, Substance abuse treatment, Criminal justice
Introduction
National data concerning the abuse of illicit drugs and the provision of substance abuse treatment have revealed declines in the levels of abuse of injectable drugs among urban populations with concomitant increases among suburban and rural populations [1]. The number of young suburban drug users has increased in many US regions including those surrounding Chicago, Baltimore, Boston, and New York [2–5]. The recent addition of illicit drug use by county type to SAMHSA’s National Survey of Drug Use and Health has identified increases of 10–15 % in the percentage of people using illicit drugs in counties classified as small metropolitan and non-metropolitan, highly urbanized counties (i.e., counties likely to contain suburban communities) between 2007 and 2010 [6]. Monitoring the Future, which conducts high school drug use surveys [7], has reported increases in heroin and pharmaceutical opioid use over the past two decades, but these may be low-end prevalence estimates since the reporting of stigmatized behaviors like hard drug use are likely to be under-reported. Despite statistical evidence for these trends, we could identify only three recently published quantitative studies on factors associated with suburban drug use, and two of the three focused on teenagers [8–10].
Data on opioid poisonings suggest similar increases in drug abuse and injection drug use in southwestern Connecticut suburbs. Between 1997 and 2007, 794 overdose deaths attributed to heroin or other opioids were reported in Fairfield and New Haven Counties. Approximately 40 % of these occurred among residents in 35 small cities and towns, with particularly high rates (>30 per 100,000 residents) in several smaller communities [11].
Despite these geographic trends nationally and regionally, little research has been conducted to understand the experiences and perceptions of drug injectors who reside in suburban environments. One study conducted in the late 1990s in the Chicago metropolitan area included 38 % suburban residents among the 700 study participants [5]. This study reached participants willing to travel to low income, urban locations; the resultant publications compared urban to suburban participants and did not explore differences within the suburban subsample. Thus, little is known about differences within populations of suburban injectors. We, therefore, undertook a study that sampled injectors residing in suburban towns in Fairfield and New Haven Counties.
In this manuscript we describe the study sample, their geographic distribution, self-reported drug use and injection histories and practices, self-reported physical and mental health status, and interactions with the substance abuse treatment or criminal justice systems. We hypothesized that neighborhood disadvantage, whose influence on drug problems is well documented in urban areas [12–17], is associated with increased risk of viral transmission and prevalence among suburban injectors. It is important that in Connecticut we undertook the geographic analysis at the census tract level data since poorer, disadvantaged neighborhoods are often contained within towns with very high median incomes. We therefore explored the influence of geography by comparing participants based on measures of sociodemographic status of the census tracts in which they resided to negative consequences of injection drug use and access to prevention and treatment services.
Methods
The study was designed as a longitudinal study with semi-annual contact between study personnel and participants. The methods and informed consent process used in this study were approved by the Yale University Human Investigation Committee. This manuscript describes the collection and interim analysis of baseline data.
Sample
The sample was accrued using respondent-driven sampling (RDS) [18–20]. Participants were required to meet the following inclusion criteria before providing informed consent: (1) self-reported injection drug use within the past 30 days or evidence of injection stigmata, (2) ≥18 years of age, (3) proof of residence for at least 6 months in a Fairfield or New Haven County town, excluding the urban centers of Bridgeport, Danbury, New Haven, Norwalk, Stamford, or Waterbury, (4) willingness to participate in a longitudinal study, to answer questions on a survey, and provide a blood specimen for serological testing, and (5) competence to provide informed consent. RDS seeds were recruited from drug treatment programs, by referral from community social service providers, and fliers posted within communities (e.g., convenience and grocery stores, pawn shops). Each seed and subsequent participant was given four coupons to distribute to people whom he or she felt would meet the inclusion criteria. Recruitment began in November 2008, and this report covers individuals recruited through May 2011.
Data Collection
All study participants completed a quantitative survey that was conducted in part by interviewer elicitation (to establish rapport) and in part by direct participant input into laptop computers using QDS™ (Nova Research, Bethesda, MD) proprietary software for programming the audio-computer assisted self-interview (A-CASI). The survey covered sociodemographics, drug use history, current injection behaviors, medical history, clinical screening measures, assessment of HIV, hepatitis, and overdose knowledge, and involvement with substance abuse treatment, harm reduction, and/or criminal justice systems. Questions covering sociodemographics, drug use history, current injection behaviors, medical history, and interactions between participants and substance abuse treatment and harm reduction services were adapted from our previous studies of urban injection drug users [21–26]. Clinical screening measures included the addiction severity index (ASI) [27, 28], Center for Epidemiological Studies Depression Scale (CES-D) [29], Beck Anxiety Inventory [30, 31], Alcohol Use Disorders Identification Test (AUDIT-C) [32, 33], and Brief Pain Inventory [34, 35]. The interview also included items assessing participants’ perceived level of social support [36] and one item concerning spirituality. Questions on interactions with the criminal justice system were developed especially for this study. Because we employed RDS as a recruitment tool, we collected the standard social network data at baseline and collected additional data on coupon distribution when participants returned to claim recruitment bonuses [37, 38]. The baseline interview took 90–120 min to complete.
All participants agreed to provide a blood sample for serological testing to determine HIV, HBV, and HCV serostatus. A total of 4–6 ml of blood was collected by phlebotomy, and serum was prepared and stored at −20 °C until thawed for testing using serological test kits (Bio-Rad Laboratories, Hercules, CA). No confirmatory testing was conducted, but individuals who tested positive on an initial screen were informed and referred to services providing confirmatory testing, instructed to assume that they were positive until receiving a negative confirmatory test, and counseled on how to avoid transmitting the virus. Testing for HBV included screening for antibodies to core and surface antibodies (HBcAb and HBsAb, respectively) and for surface antigen (HBsAg). Individuals who tested negative for all three HBV serological tests were informed that they were susceptible and advised to receive vaccination. Individuals who tested HBcAb-positive, regardless of the test results for HBsAb were informed that they had been previously infected. Individuals who tested HBsAb-positive but negative on the other tests were informed that they had been previously successfully vaccinated. Individuals who tested HBsAg-positive, regardless of the results of any other test were informed that they were likely to be actively infected, instructed to seek medical care, and advised on how to avoid transmitting the virus.
Data Analysis
We analyzed the data in three steps. First, we examined our sample to assess its potential generalizability and then described its characteristics, collapsing some categories to simplify analysis. In the case of injection frequency the number of injections in the last 30 days was censored at 360. A composite variable of injection risk during the 30 days prior to interview was created by identifying any individual who engaged in any of the following unsafe injection practices:
distributive or receptive sharing of syringes,
sharing of cookers, drug-mixing water, and rinse water, and
sharing of drugs once they had been dissolved.
The injection risk score is therefore a count of how many of these behaviors each participant had engaged in during the past 30 days. Although the HIV/Hepatitis C transmission risk for each of these behaviors may not be the same, each poses a substantial risk of infection for both viruses, so we did not weight the behaviors by risk.
Finally, we assessed the influences of geography and injection risks. Given the large income disparities within some of the wealthier towns, we conducted our analysis at the census tract level, using the community disadvantage index (CDI) to achieve appropriate geographic granularity. The CDI is a commonly used metric adapted by the US Department of Justice to summarize the general socioeconomic conditions of a census tract, has been proven reliable (α = 0.89), and is generally considered to be more reliable than any single indicator used by itself [39, 40]. Such metrics are well established in the literature on drug use [12–15]. It combines several US Census measures—the percent of persons living below the federal poverty line, the percent of persons receiving public assistance, and the percent of families with minor children that are female-headed.
We note that the CDI does not include minority density or over-representation as is found in other attempts to quantify neighborhood disadvantage. This is particularly advantageous in this study since the low numbers of non-white participants merit the use of a non-racially defined metric of neighborhood disadvantage. The CDI scores are normalized to reflect the distribution of community disadvantage across census tracts in the US and range from 1 to 10, where a score of 10 indicates that 10 % of tracts are the most disadvantaged in the country and a score of 9 suggests that the tract is more disadvantaged than 90 % of tracts not included in group 10 [41]. In our catchment area, tracts with scores of 1–9 are represented.
Following the determination of bivariate associations of CDI and injection risks with other factors, two models were constructed. First, we used ordinal logistic regression with census tract CDI as the dependent variable to identify behavioral, medical, and social factors associated with residence in different classes of census tracts. We entered all variables that were associated (at p ≤ 0.10) with higher CDI into the model which was then run in a backward, stepwise fashion, removing independent variables to produce a final model that minimized the Akaike information criterion (AIC), a measure of goodness-of-fit [42].
Second, given the strong associations with classes of census tracts found in the ordinal regression, we modeled injection risk scores as the dependent variable using generalized estimating equations (GEE) where the CDI category was used as a clustering factor. This method of clustering provides statistical power by grouping similar census tracts and thereby reducing the influence of tracts with few or no observations [43, 44]. Within the GEE model, the count of risk behaviors was modeled as a Poisson distribution. The model included all variables that were associated (at p ≤ 0.10) with higher injection risk and optimized in a backward, stepwise fashion removing independent variables using the quasi-likelihood information criteria (QIC) [45] contained within the geepack add-on package for R software [46].
Results
Analysis of the Sampling to Recruit Study Participants
A total of 454 participants were enrolled in the study during the period under consideration. This recruitment required the identification of 82 seeds, of whom 46 (56.1 %) proved non-productive (Fig. 1). Because of the large number of seeds and participants’ self-reported small network sizes (mean of 9.4 and median of 6, indicating skewness towards small networks), the assumptions required of RDS in order to attempt population estimates were not met [18, 20]. Nonetheless, we investigated the representativeness of the sample by four methods: two indirect approaches and two direct comparisons to available data.
Fig. 1.
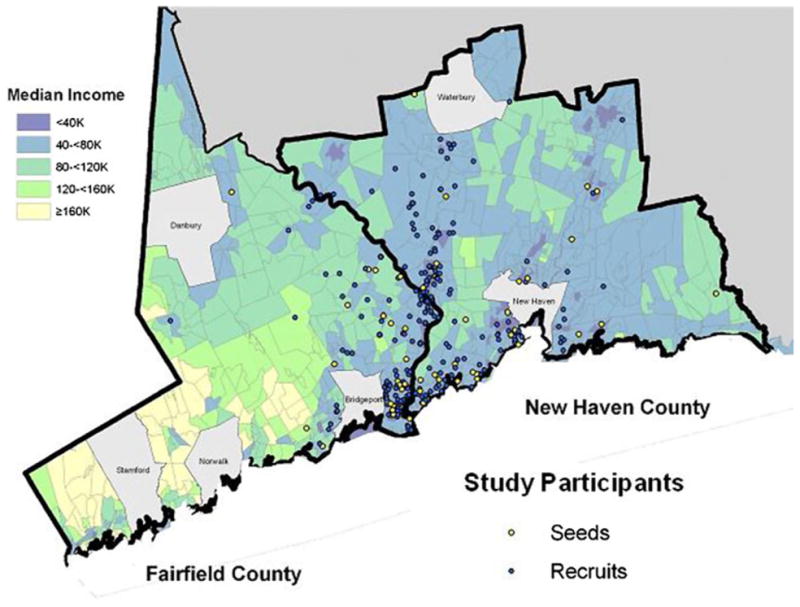
Spatial distribution of study participants—seeds and subsequent recruits. The location of residence for the 454 participants (82 seeds and 372 subsequent recruits) was plotted on a map of Fairfield and New Haven Counties after the validated residence was randomly moved 200 yards. Map displays towns and census tracts divided into five categories based on median household income
First, we compared the longest chain of participants (n = 219) to the rest of the sample based on the assumption in RDS that, as chains elongate, their approximation of the underlying population from which the sample is drawn improves. We considered 12 variables covering demographics (four variables), injection behaviors (three variables), health problems (three variables), and interaction with criminal justice and substance abuse treatment systems (two variables). There was no difference on ten of these variables, but we did detect differences in educational level and wealth of town of residence. Those in the longest chain were more likely to have no more than a high school education (p = 0.001) and to reside in towns below the state’s median income (p <0.001), and these two variable are correlated (p = 0.04). Neither of these factors could be considered directly associated with injection risk behaviors, which is the focus of this analysis.
In the second indirect analysis, we calculated the population proportions relative to the CDI categories for all of the suburban census tracts where recruitment took place. Although participants were under-represented in the most privileged census tracts and over-represented in tracts with greater disadvantage, participant proportions in the nine CDI categories were not significantly different from the suburban population as a whole when measured by ANOVA.
We then did a direct comparison of the place of residence and ages of the study participants with data from the Connecticut Office of the Chief Medical Examiner from 2002 to 2010 for individuals who, upon autopsy, were found to have died from heroin-associated overdoses. The geographic distribution of participants’ residences and their mean age were comparable to those of the heroin-associated overdose decedents (Fig. 2).
Fig. 2.

Spatial distribution of heroin overdose deaths and study participants. Maps display the proportion of a the Connecticut Office of the Chief Medical Examiner census of heroin-associated accidental deaths and b the study participants who were residents in each town in the two counties (excluding the six cities)
Characteristics of the Study Participants
Sociodemographic data appear in Table 1. The sample was 62.1 % male (n = 282), with a mean age of 35.0 ± 10.9 years and median age of 34. The sample was overwhelmingly Caucasian. More than four in five (n = 365, 80.4 %) had completed high school. Only 33 (7.3 %) had served in the military. The majority was single. Just more than one-quarter (n = 131, 28.9 %) reported being employed with mean and median monthly income of $1,589 ± $1,807 and $1,100 (25, 75 %: $600, $2100), respectively. More than one-quarter (n = 133) also reported receiving illegal income, but only 218 people responded to this question. Nearly half the sample received money through disability or governmental assistance (n = 223, 49.1 %). Most had government-supported health insurance (n = 272, 59.9 %), although many had no health insurance (n = 120, 26.4 %).
Table 1.
Participant sociodemographic Characteristics (N = 454 unless otherwise noted)
| Age (in years) | Mean ± SD = 35.0 ± 10.9 Median = 34 (25, 75 %: 25, 45) |
|
|---|---|---|
| Number | % | |
| Male | 282 | 62.1 |
| Race/ethnicity (n = 443) | ||
| White, non-Hispanic | 363 | 81.9 |
| Hispanic | 43 | 9.7 |
| African-American | 28 | 6.3 |
| Other/bi-racial | 9 | 2.0 |
| Marital status | ||
| Single | 301 | 66.3 |
| Married | 55 | 12.1 |
| Separated | 19 | 4.2 |
| Divorced/widowed | 79 | 17.4 |
| Educational attainment | ||
| Less than high school | 89 | 19.6 |
| High school diploma | 190 | 41.9 |
| Graduate of tech school | 16 | 3.5 |
| More than high school | 159 | 35.0 |
| Employment status (n = 453) | ||
| Unemployed | 322 | 71.1 |
| Part-time/seasonal | 74 | 16.3 |
| Full-time | 57 | 12.6 |
| Illegal income, past 30 days | 133/218 | 61.0 |
| Health insurance | ||
| Private | 37 | 8.1 |
| Government | 272 | 59.9 |
| None | 120 | 26.4 |
| Other | 25 | 5.5 |
Participants typically initiated injection drug use in their mid-20s, with mean and median durations of 10.8 ± 10.3 and 7 (25, 75 %: 3, 16) years, respectively. The predominant drug of choice for injection was heroin (n = 408, 89.9 %), with 27 (5.9 %) reporting cocaine (Table 2). Reports of preference for methamphetamine or pharmaceutical opioids were rare, but polydrug use was common, with 138 individuals (31.3 %) reporting injecting more than one kind of drug during the previous 30 days.
Table 2.
Drug use, injection risks, protective factors, and risk reduction knowledge (N = 454 except where noted)
| Number | % | |
|---|---|---|
| Drug use and protective factors | ||
| Drug of choice, past 30 days | ||
| Heroin | 408 | 89.9 |
| Cocaine/crack | 27 | 5.9 |
| Other (other opioids or speedball) | 19 | 4.2 |
| Injected >1 type of drug, past 30 days (n = 441) | 138 | 31.3 |
| Injection frequency, past 30 days | Mean ± SD = 55.1 ± 73.2 Median = 30 (25, 75 %: 10, 65) |
|
| Usual place drugs purchased, past 30 days (n = 436) | ||
| Within town of residence | 145 | 33.3 |
| In another town/city where I work | 25 | 5.7 |
| In another town/city | 266 | 61.0 |
| Usual site acquiring syringes, past 30 days (n = 449) | ||
| Pharmacy | 333 | 74.2 |
| Syringe exchange program | 15 | 3.3 |
| Diabetic | 60 | 13.4 |
| Other | 41 | 9.1 |
| Usual locale of injection, past 30 days | ||
| Own residence | 259 | 57.0 |
| Residence of friend/relative | 56 | 12.3 |
| Car | 88 | 19.4 |
| Public locale | 38 | 8.4 |
| Other | 13 | 2.9 |
| Injection risk practices | ||
| Shared drugs, past 30 days (N = 453) | ||
| Never | 218 | 48.1 |
| At least once, less than always | 139 | 30.7 |
| Always | 96 | 21.2 |
| Shared syringes, past 30 days (N = 453) | ||
| Never | 360 | 79.5 |
| At least once, less than always | 81 | 17.9 |
| Always | 12 | 2.6 |
| Shared cookers, past 30 days | ||
| Never | 373 | 82.2 |
| At least once, less than always | 66 | 14.5 |
| Always | 15 | 3.3 |
| Shared rinse water, past 30 days | ||
| Never | 318 | 70.0 |
| At least once, less than always | 94 | 20.7 |
| Always | 42 | 9.3 |
| Shared water to dissolve drugs, past 30 days | ||
| Never | 296 | 65.2 |
| At least once, less than always | 108 | 23.8 |
| Always | 50 | 11.0 |
| Risk reduction knowledge | ||
| HIV knowledge—13 questions | Mean ± SD = 66.8 ± 18.8 Median = 69.2 (25, 75 %: 53.8, 76.9) |
|
| Hepatitis knowledge—15 questions | Mean ± SD = 54.2 ± 19.2 Median = 60 (25, 75 %: 45, 66.7) |
|
| Overdose knowledge—21 questions | Mean ± SD = 54.4 ± 18.4 Median = 55 (25, 75 %: 45, 65) |
|
| Syringe access knowledge—2 questions | ||
| None correct | 116 | 25.6 |
| One correct | 244 | 53.7 |
| Both correct | 94 | 20.7 |
The majority of individuals reported obtaining their drugs from locations outside rather than within their town of residence (Table 2). Syringes were most commonly obtained from pharmacies (n = 333, 74.2 %) and mostly without prescription. Use of one of the state’s four syringe exchange programs was rare (n = 15, 3.3 %). The majority injected most often at their own residence (n = 259, 57.0 %) or in the residence of a friend or relative (n = 56, 12.3 %). With respect to self-reported risky injection practices during the last 30 days, 93 participants (20.5 %) reported sharing syringes, but only 12 (2.6 %) reported sharing every time they injected. Sharing of vessels for dissolving drugs (“cookers”) was reported by 81 participants (17.8 %), sharing of rinse water by 136 (30.0 %), and sharing of water to dissolve drugs by 158 (34.8 %).
Participants knew slightly more about HIV transmission and prevention than about hepatitis transmission and prevention or overdose prevention and response (Table 2). Mean score on the 13-item HIV knowledge test was 66.8 % compared to 54.2 % for the 15-item hepatitis knowledge test and 54.4 % on the 21-item overdose knowledge test. However, scores for all three tests were not statistically different from 50 %, which would be obtained if answers were provided at random. Most participants knew that it is legal in Connecticut to purchase syringes in pharmacies (67.0 % correct); fewer were aware that it is legal in Connecticut to carry used syringes (28.2 % correct). Only 94 individuals (20.7 %) correctly answered both questions.
The prevalence of syringe-borne infections (Table 3) was lower than that previously reported for urban IDU populations in CT [22, 47, 48]. Only 14 people (3.2 %) tested positive for HIV, and only four of the 14 had known they were positive prior to testing in our study. Nearly half (n = 180, 41.0 %) tested positive for HCV, but only 73 (40.6 % of the 180) had known they were positive. Of the 113 (25.8 %) who had been exposed to HBV, 20 (17.7 %) had known they had been infected. A larger number (n = 137, 31.3 %) had been successfully immunized, but a plurality (n = 188, 42.9 %) remained susceptible to infection.
Table 3.
Seroprevalence of HIV, hepatitis C virus (HCV), and hepatitis B virus (HBV) and prevalence of overdoses (N = 454 unless otherwise indicated)
| Number | % | |
|---|---|---|
| Serology test results | ||
| HIV seropositive (N = 439) | 14 | 3.2 |
| HCV seropositive (N = 439) | 180 | 41.0 |
| HBV serostatus (N = 438) | ||
| Previously infected | 92 | 21.0 |
| Currently infected | 21 | 4.8 |
| Previously vaccinated | 137 | 31.3 |
| Susceptible | 188 | 42.9 |
| Awareness of positive serostatus at enrollment | ||
| HIV | 4/14 | 28.6 |
| HCV | 73/180 | 40.6 |
| HBV | 20/113 | 17.7 |
| Overdoses | ||
| Any reported | 140 | 30.8 |
| >1 reported | 93/140 | 66.4 |
| Reported in the last year | 18/134 | 13.4 |
Opioid overdose had been experienced by 140 (30.8 %) individuals (Table 3). For these individuals, repeated overdoses were the norm (mean = 2.8 ± 2.4 events, median = 2 events), and 18 (13.4 %) of the 134 who responded reported one in the past year.
The majority of respondents reported their current health status as good to excellent (Table 4). Nevertheless, somatic and mental health problems were common. More than one-third (n = 206, 35.4 %) were classified with moderate to severe depression. Nearly one-quarter (n = 110, 24.2 %) was classified with moderate to severe anxiety. About two-thirds (n = 236, 64.3 %) reported some level of risky alcohol use. Most participants perceived themselves to receive social support from family, friends, and significant others. The mean injection network size reported as part of RDS data collection—the number of individuals who the participant knew to be injectors and had seen in the past 6 months—was 9.4 ± 15.1 (median = 6), and respondents reported that they injected with an average of 2.2 ± 3.0 people during the past 30 days.
Table 4.
Depression, anxiety, chronic pain, and social support characteristics (N = 454)
| Number | % | |
|---|---|---|
| Self-reported health status | ||
| Excellent/very good | 150 | 33.0 |
| Good | 174 | 38.3 |
| Fair/poor | 130 | 28.6 |
| Experience of recurrent pain (N = 452) | 147 | 32.5 |
| Overall pain subscalea | Mean = 6.3 (1.5) Median = 6.2 (25, 75 %: 5.2, 7.4) |
|
| Interference subscalea | Mean = 6.8 (1.8) Median = 6.9 (25, 75 %: 5.9, 8.3) |
|
| CESD score | ||
| Normal | 145 | 31.9 |
| Mild | 103 | 22.7 |
| Moderate | 78 | 17.2 |
| Severe | 128 | 28.2 |
| Beck anxiety inventorya | ||
| None | 250 | 55.1 |
| Mild | 94 | 20.7 |
| Moderate | 70 | 15.4 |
| Severe | 40 | 8.8 |
| Social supportb | Mean = 64.4 (15.8) Median = 67 (25, 75 %: 57, 76) |
|
Possible range of 0–10 on the chronic pain scales, with higher numbers denoting more pain
Possible range 12–84 on the social support scale, with higher numbers denoting more social support
Most individuals reported prior interaction with both the substance abuse treatment and criminal justice systems (Table 5). More than three-quarters (n = 351, 77.5 %) reported ever receiving some form of substance abuse treatment, with detoxification the most common modality (n = 300, 85.5 % of those ever in treatment) and, of these, one-quarter (n = 76, 25.3 %) had entered a detoxification program in the past year. In terms of longer-term substance abuse treatment, the most common modality was opioid substitution therapy, with 289 participants (63.7 %) having ever received substitution therapy. At the time of interview, 208 participants (77.0 % of those ever receiving substitution therapy) were currently receiving some form of opioid substitution treatment. Only eight were receiving suboxone, and the remainder (n = 200) received methadone.
Table 5.
Interactions with substance abuse treatment and criminal justice systems
| Number | % | |
|---|---|---|
| Substance abuse treatment | ||
| Any substance abuse treatment program, ever | 351/454 | 77.5 |
| Detoxification program | ||
| Ever | 300/351 | 85.5 |
| Last 6 months | 76/300 | 25.3 |
| Out-patient abstinence-based program | ||
| Ever | 243/351 | 69.2 |
| Last 6 months | 57/242 | 23.6 |
| Residential program | ||
| Ever | 182/350 | 52.0 |
| Last 6 months | 31/182 | 17.0 |
| Opioid substitution treatment | ||
| Ever | 289/350 | 82.6 |
| Last 6 months | 226/289 | 78.2 |
| At time of interview | 208/289 | 77.0 |
| Methadone maintenance program | ||
| Ever | 264/350 | 75.4 |
| Last 6 months | 214/264 | 81.1 |
| At time of interview | 200/264 | 75.8 |
| Prescribed suboxone/buprenorphine | ||
| Ever | 77/350 | 22.0 |
| Last 6 months | 22/77 | 28.6 |
| At time of interview | 8/77 | 10.4 |
| Twelve-step program | ||
| Ever | 296/454 | 65.2 |
| Criminal justice system | ||
| Ever arrested | 404/454 | 89.0 |
| Total times arresteda | Mean ± SD = 9.0 ± 11.6 Median = 5 (25, 75 %: 2.25, 10) |
|
| For sale or possession of drugsa | Mean ± SD = 3.0 ± 5.1 Median = 2 (25, 75 %: 0, 4) |
|
| Drug-related arrestsa | Mean ± SD = 4.5 ± 7.8 Median = 2 (25, 75 %: 0, 5) |
|
| Ever convicted (n = 404) | 272 | 67.3 |
| Ever sentenced (n = 271) | 252 | 93.0 |
| Ever jailed or imprisoned (n = 404) | 318 | 78.7 |
| Number of times jailedb | Mean ± SD = 7.4 ± 8.9 Median = 4 (25, 75 %: 2, 9) |
|
| Number of times imprisonedb | Mean ± SD = 3.8 ± 7.0 Median = 2 (25, 75 %: 0, 4) |
|
| Cumulative incarceration time, in daysb | Mean ± SD = 1,294 ± 1,630 Median = 730 (25 %, 75 %: 182, 1460) |
|
| On probation/parolec | 96/272 | 35.4 |
Numbers are for those ever arrested
Among those ever sentenced or imprisoned
Among those ever convicted
Even more common than engagement with substance abuse treatment was engagement with the criminal justice system (Table 5). The majority (n = 404, 89.0 %) reported at least one arrest, and the average number of times arrested was 9.0 ± 11.6. Nearly eight in ten of those arrested had spent time in jail (n = 318, 78.7 %), and among these participants the mean number of times jailed was 7.4 ± 8.9. About one-third of those detained (n = 108, 34.0 %) reported being detained only briefly before release. Two-thirds (n = 272, 67.3 %) had been convicted at least once, and 93.0 % (n = 252) of those convicted received a prison sentence. For those sentenced, the mean number of times in prison was 3.8 ± 7.0. One-third of those convicted was currently on probation or parole (n = 96, 35.4 %).
Associations with Place of Residence
Most participants (64.8 %) resided in towns with median household incomes below that for the state as a whole. In Fairfield County, this was 153 of 195 (78.5 %) participants; in New Haven County, this was 141 of 259 (54.4 %) participants. In total, approximately one-third of participants (n = 160, 35.2 %) resided in towns with median incomes at or above the state median. However, most participants resided in census tracts with high CDI scores (more disadvantaged neighborhoods) regardless of the town’s median income. In the ordinal logistic model, higher CDI was significantly associated with older age, government health insurance, purchasing drugs in one’s hometown, injecting in one’s own residence, and not currently receiving opioid substitution treatment (Table 6A).
Table 6.
Multivariate models: (A) ordinal regression of factors significantly associated with residence by nine categories of community disadvantage index (CDI), (B) generalized estimating equation model of factors associated with higher injection risk scores
| Variable | (A) Census tracts ranked by CDI
|
(B) Injection risk scores
|
|||||
|---|---|---|---|---|---|---|---|
| Ordinal regression model
|
Generalized estimating equations
|
||||||
| OR | 95 % CI | p value | Estimate | Std. error | Wald | p value | |
| Age, above the median of 34 | 2.167 | 1.51–3.12 | <0.0001 | −0.3578 | 0.1212 | 8.72 | 0.0031 |
| CES-D depression score norm or mild | −0.4285 | 0.1034 | 17.17 | <0.0001 | |||
| Health insurance | |||||||
| Private | 0.461 | 0.25–0.86 | 0.015 | ||||
| None | 0.823 | 0.55–1.24 | 0.354 | ||||
| Other | 0.354 | 0.16–0.78 | 0.010 | ||||
| Government (referent) | 1 | ||||||
| Drugs purchased in town of residence | 1.702 | 1.17–2.49 | 0.006 | ||||
| Inject in own residence | 1.508 | 1.06–2.15 | 0.024 | −0.3436 | 0.1656 | 4.31 | 0.0380 |
| Injection network size, last 30 days, >mean (2.2) | 0.1065 | 0.0221 | 23.24 | <0.0001 | |||
| Social support score | −0.1373 | 0.0498 | 7.60 | 0.0058 | |||
| Current opioid substitution | 0.635 | 0.45–0.90 | 0.012 | ||||
| Hepatitis knowledge score | 0.1883 | 0.1062 | 3.15 | 0.076 | |||
| Model fitting criterion | AIC = 1838 | QIC = 540 | |||||
In the GEE model clustered by CDI of residence, a higher injection risk score was associated with younger age, injecting with more people, less likelihood of injecting most often at participants’ current residence, and moderate to severe depressive symptoms (Table 6B). Those with higher injection risk scores were also less likely to perceive themselves as receiving social support from family, friends, or significant others, despite the fact that they also reported having larger drug using networks.
Discussion
This report describes a sample of suburban drug injectors and identifies differences within this population. The sample is younger and appears to have smaller social networks than those found in most current studies of IDUs in large cities of the U.S. Northeast [49–52]. Their experiences with the different systems with which they interact as drug users—criminal justice, substance abuse treatment, and harm reduction services—reveal near universal engagement with the police and the courts, less (but still considerable) experience with substance abuse treatment services, and almost no contact with harm reduction services. Injectors’ knowledge about HIV is poor and statistically no better than it is regarding either hepatitis or overdose, which differs from findings from studies of urban injectors in Connecticut [22]. This suggests that the HIV-centric prevention messages targeted to urban injectors have failed to reach their suburban counterparts. Furthermore, individuals seem to have limited awareness of their HIV or hepatitis infection status. But the most striking difference between our results and studies of urban injectors is the lack of association between residing in areas of poverty and disadvantage and injection risk behaviors.
Despite the lack of association between disadvantage and injection risk, the potential for negative health consequences in this population is substantial. Although it seems safe to conclude that this population of injectors is shielded from HIV by virtue of their small injection networks, low HIV prevalence, and the levels of unsafe injection practices [53–56], the situation is different for hepatitis. For HCV, serological testing revealed that almost half had been infected. For HBV, one-fifth of those infected with HBV remained carriers, and two in five injectors remained susceptible. Given the ease of HBV and HCV transmission [57–59] further epidemic spread is likely. Drug overdoses, another major cause of morbidity and mortality among drug injectors, were commonplace. These data reveal an ongoing need for expansion to non-urban areas of a broad range of programs, especially those that incorporate harm reduction approaches to promote safe injection, hepatitis testing and vaccination against HBV, and overdose prevention and response trainings.
A large proportion of the participants may have been simultaneously receiving substitution therapy for opioid addiction and injecting. It is unclear if this represents treatment failure or a strategy employed by drug users to modulate their drug use or that they entered treatment within the month prior to enrolment. Few injectors report injecting pharmaceutical opioids. It may be that by the time people switch to injection, even if they initiated opioid abuse with pharmaceuticals, they have already replaced more expensive, diverted pharmaceuticals with relatively less expensive heroin [60, 61]. This situation parallels what we and other researchers have found in looking at transitions to injection in other non-urban communities [62, 63]. We plan to explore these possibilities through subsequent qualitative data collection and analysis.
Our assumption that suburban residence would shield individuals from the threats to health and liberty led us to hypothesize that residence in wealthier or less disadvantaged communities would be more protective against the negative consequences of their drug use. While this hypothesis did not hold for hepatitis prevalence, aspects of the risks for contracting or transmitting virus, or lack of involvement with the criminal justice system, there were interesting differences based on residence that warrant discussion. First, both models found that poorer, more disadvantaged communities, older age, and local purchase of drugs were correlated. In contrast to an association between older age and higher CDI found for our sample, the opposite is found for the general population. A review of census data revealed that the older one is (at least up to age 50), the less likely one is to live in a disadvantaged community [64]. The strong association between local drug purchase and poorer, less advantaged community of residence supports the common sense notion that drug sales are more likely to occur in these communities. These relationships demonstrate the utility of using the compound variable CDI for analyzing the influences of place of residence on health.
The different factors associated with the two models reveal other aspects about our population of suburban injectors. In terms of overall health, the ordinal regression model suggests that poorer health status and reliance on government-subsidized insurance such as Medicare and Medicaid are more common among those residing in poorer, more disadvantaged communities. However, the GEE model demonstrates that younger age, higher level of depression, injecting outside one’s home, reporting low social support, and larger reported injection networks are all associated with greater levels of risky injection, irrespective of residence.
There are several limitations to the work presented in this report. Three are related to the process of accruing the sample. First, because there is no known sampling frame for active suburban injectors and because the sample accrued by RDS contained so many seeds, the sample is best considered one of convenience. Improvements to RDS that require additional information on recruitment failure were not available at the time our study was designed [65]. As a result there is little point in applying RDS-derived algorithms to estimate the underlying population. Second, our reliance on recruitment of seeds from among entrants into substance abuse treatment might have resulted in oversampling from treatment-experienced segments of the population of interest. Third, we recruited few participants either of high socio-economic status or who resided in the wealthier towns. We do not know if this is because such individuals do not exist or if they do but our social network approach could not reach them. It is possible that they were given a coupon, but declined to contact the study. However, we did undertake four analyses of the sample to explore the spatial distribution of our participants’ place of residence: (1) comparing those recruited into the longest chain to the other recruits, (2) comparing the entire sample to the geographic distribution of the general population in CDI groups within the eligible towns, and (3–4) comparing place of residence and age of the sample to the corresponding data on heroin-associated deaths from the Office of the Chief Medical Examiner. These analyses suggest that, although the sample cannot be analyzed using traditional measures associated with RDS, there is reason to think that the sample is broadly representative of the underlying population. Comparisons to databases of those seeking addiction treatment might shed some light on the existence of individuals in high-income communities, but these databases do not have data on whether or not the individual injected. In any event, it is not appropriate to try to generalize our findings to people who inject drugs in other suburban localities.
An additional limitation is that much of the data were obtained by self-report. We do not know the extent to which response biases influenced answers. It is felt that using computer-assisted interviewing reduces under-reporting of risky or stigmatized behaviors [66, 67], and for that reason we chose this method for collecting data. However, we cannot rule out inaccurate self-reporting or recall bias. Despite these limitations, this report does constitute the first quantitative presentation on a wide range of sociodemographic, behavioral, health, and system interaction data from the understudied population of suburban residents who inject drugs.
Conclusion
This report suggests that a common observation about urban injection use—that injectors living in economically disadvantaged neighbors engage in greater HIV risk—does not extend to their suburban counterparts. This finding, combined with the low access to harm reduction services, the lack of knowledge about HIV, hepatitis, drug overdoses, and the poor awareness of viral infection status, reveals the need for greatly expanded harm reduction services targeting suburbanites who inject drugs regardless of their neighborhood of residence. The results also suggest the intersection of numerous serious health problems, including addiction, depression, hepatitis C infection, and incarceration will require comprehensive, integrated programs to improve public health responses for this population perhaps through a dual-diagnosis approach to providing harm reduction services.
Acknowledgments
This study was supported by a grant from the National Institute on Drug Abuse (1R01DA023408). Dr. Palacios was supported by a diversity supplement awarded to this Grant. The authors would especially like to thank John Hamilton, Joann Montgomery, and the staff at the Center for Human Services, part of the Recovery Network of Programs, who arranged for many of the seeds to contact our study. The authors also wish to thank Amisha Patel who performed the serological testing.
Footnotes
Conflict of interest The authors declare no competing interests.
Contributor Information
Robert Heimer, Email: robert.heimer@yale.edu, Department of Epidemiology of Microbial Diseases and the Center for Interdisciplinary Research on AIDS, Yale University School of Public Health, 60 College St., New Haven, CT 06510, USA.
Russell Barbour, Email: russellbarbour@gmail.com, The Center for Interdisciplinary Research on AIDS, Yale University School of Public Health, 135 College St., Suite 200, New Haven, CT, USA.
Wilson R. Palacios, Email: wpalacio@usf.edu, Department of Criminology, College of Arts and Sciences, University of South Florida, 4202 E. Fowler Ave., Tampa, FL 33620, USA
Lisa G. Nichols, Email: lisa.nichols@yale.edu, Department of Internal Medicine, Yale School of Medicine, 15 York St., New Haven, CT 06510, USA
Lauretta E. Grau, Email: lauretta.grau@yale.edu, Department of Epidemiology of Microbial Diseases and the Center for Interdisciplinary Research on AIDS, Yale University School of Public Health, 60 College St., New Haven, CT 06510, USA
References
- 1.Cicero TJ, Surratt H, Inciardi JA, Munoz A. Relationship between therapeutic use and abuse of opioid analgesics in rural, suburban, and urban locations in the United States. Pharmaco-epidemiol Drug Saf. 2007;16:827–40. doi: 10.1002/pds.1452. [DOI] [PubMed] [Google Scholar]
- 2.Calefati J. Heroin hits the suburbs-hard. A sad trail of abuse is spreading beyond the Northeast’s inner cities. US News World Rep. 2008;145:27–8. [PubMed] [Google Scholar]
- 3.Kline A, Mammo A, Culleton R, et al. Trends in injection drug use among persons entering addiction treatment—New Jersey, 1992–1999. MMWR. 2001;50:378–81. [PubMed] [Google Scholar]
- 4.Subramaniam GA, Stitzer MA. Clinical characteristics of treatment-seeking prescription opioid vs. heroin-using adolescents with opioid use disorder. Drug Alcohol Depend. 2009;101:13–9. doi: 10.1016/j.drugalcdep.2008.10.015. [DOI] [PMC free article] [PubMed] [Google Scholar]
- 5.Thorpe LE, Bailey SL, Huo D, Monterosso ER, Ouellet LJ. Injection-related risk behaviors in young urban and suburban injection drug users in Chicago (1997–1999) J AIDS. 2001;27:71–8. doi: 10.1097/00126334-200105010-00012. [DOI] [PubMed] [Google Scholar]
- 6.National Survey on Drug Use & Health. U. S. Department of Health & Human Services; 2011. [Accessed 27 Sept 2011]. http://www.oas.samhsa.gov/nsduh/reports.htm. [Google Scholar]
- 7.Johnston LD, O’Malley PM, Bachman JG, Schulenberg JE. Monitoring the future: national survey results on drug use, 1975–2010. Ann Arbor: Institute for Social Research, The University of Michigan; 2011. [Google Scholar]
- 8.Luthar SS, Goldstein AS. Substance use and related behaviors among suburban late adolescents: the importance of perceived parent containment. Dev Psychopathol. 2008;20:591–614. doi: 10.1017/S0954579408000291. [DOI] [PMC free article] [PubMed] [Google Scholar]
- 9.McMahon TJ, Luthar SS. Patterns and correlates of substance use among affluent, suburban high school students. J Clin Child Adolesc Psychol. 2006;35:72–89. doi: 10.1207/s15374424jccp3501_7. [DOI] [PMC free article] [PubMed] [Google Scholar]
- 10.Watson CA, Weng CX, French T, et al. Substance abuse treatment utilization, HIV risk behaviors, and recruitment among suburban injection drug users in Long Island, New York. AIDS Behav. 2013 doi: 10.1007/s10461-013-0512-2. [DOI] [PubMed] [Google Scholar]
- 11.Green TC, Grau LE, Colon N, Carver HW, Kinzly ML, Heimer R. Trends in fatal opioid intoxications in Connecticut: 1997–2007. Drug Alcohol Depend. 2011;115:221–8. doi: 10.1016/j.drugalcdep.2010.11.007. [DOI] [PMC free article] [PubMed] [Google Scholar]
- 12.Boardman JD, Finch BK, Ellison CG, Williams DR, Jackson JS. Neighborhood disadvantage, stress, and drug use among adults. J Health Soc Behav. 2001;42:151–65. [PubMed] [Google Scholar]
- 13.Ford JM, Beveridge AA. Varieties of substance use and visible drug problems: individual and neighborhood factors. J Drug Issues. 2006;36:377–92. [Google Scholar]
- 14.Galea S, Rudenstine S, Vlahov D. Drug use, misuse, and the urban environment. Drug Alcohol Rev. 2005;24:127–36. doi: 10.1080/09595230500102509. [DOI] [PubMed] [Google Scholar]
- 15.Pratt TC, Cullen FT. Assessing macro-level predictors and theories of crime: a meta-analysis. Crime Justice Rev Res. 2005;32:373–450. [Google Scholar]
- 16.Bluthenthal RN, Do DP, Finch B, Martinez A, Edlin BR, Kral AH. Community characteristics associated with HIV risk among injection drug users in the San Francisco Bay Area: a multilevel analysis. J Urban Health. 2007;84:653–66. doi: 10.1007/s11524-007-9213-3. [DOI] [PMC free article] [PubMed] [Google Scholar]
- 17.Watters JK, Bluthenthal RN, Kral AH. HIV seroprevalence in injection drug users. JAMA. 1995;273:1178. [PubMed] [Google Scholar]
- 18.Heckathorn D. Respondent driven sampling II: deriving valid population estimates from chain-referral samples of hidden populations. Soc Probl. 2002;49:11–34. [Google Scholar]
- 19.Heckathorn DD. Respondent-driven sampling; a new approach to the study of hidden populations. Soc Probl. 1997;44:174–99. [Google Scholar]
- 20.Salganik MJ, Heckathorn DD. Sampling and estimation in hidden populations using respondent-driven sampling. Sociol Methodol. 2004;34:193–240. [Google Scholar]
- 21.National Institute on Drug Abuse. Risk behavior assessment. Rockville: NIDA; 1991. [Google Scholar]
- 22.Heimer R, Clair S, Grau LE, Bluthenthal RN, Marshall PA, Singer M. Hepatitis-associated knowledge is low and risks are high among HIV-aware injection drug users in three US cities. Addiction. 2002;97:1277–87. doi: 10.1046/j.1360-0443.2002.t01-1-00211.x. [DOI] [PubMed] [Google Scholar]
- 23.Heimer R, Grau LE, Curtin E, Khoshnood K, Singer M. Should HIV testing programs for urban injection drug users be expanded? Am J Public Health. 2006;97:110–6. doi: 10.2105/AJPH.2005.078105. [DOI] [PMC free article] [PubMed] [Google Scholar]
- 24.Heimer R, Khoshnood K, Bigg D, Guydish J, Junge B. Syringe use and re-use: effects of syringe exchange programs in four cities. J AIDS. 1998;18(suppl 1):S37–44. doi: 10.1097/00042560-199802001-00008. [DOI] [PubMed] [Google Scholar]
- 25.Niccolai LM, Toussova OV, Verevochkin SV, Barbour R, Heimer R, Kozlov AP. High HIV prevalence, suboptimal HIV testing, and low knowledge of HIV-positive serostatus among injection drug users in St. Petersburg, Russia. AIDS Behav. 2010;14:932–41. doi: 10.1007/s10461-008-9469-y. [DOI] [PMC free article] [PubMed] [Google Scholar]
- 26.Niccolai LM, Verevochkin SV, Toussova OV, et al. Estimates of HIV incidence among drug users in St. Petersburg, Russia: continued growth of a rapidly expanding epidemic. Eur J Pub Health. 2011;21:613–9. doi: 10.1093/eurpub/ckq115. [DOI] [PMC free article] [PubMed] [Google Scholar]
- 27.McLellan AT, Luborsky L, O’Brien CP, Woody GE. An improved diagnostic instrument for substance abuse patients, the addiction severity index. J Nerv Ment Dis. 1980;168:26–33. doi: 10.1097/00005053-198001000-00006. [DOI] [PubMed] [Google Scholar]
- 28.Stoffelmayr BE, Mavis BE, Kasim RM. The longitudinal stability of the addiction severity index. J Subst Abuse Treat. 1994;11:373–8. doi: 10.1016/0740-5472(94)90048-5. [DOI] [PubMed] [Google Scholar]
- 29.Radloff LS. The CES-D scale: a self-report depression scale for research in the general population. Appl Psychol Meas. 1977;1:385–401. [Google Scholar]
- 30.Beck AT, Epstein N, Brown G, Steer RA. An inventory for measuring anxiety: psychometric properties. J Consult Clin Psychol. 1988;56:893–7. doi: 10.1037//0022-006x.56.6.893. [DOI] [PubMed] [Google Scholar]
- 31.Beck AT, Steer RA. Beck anxiety inventory manual. San Antonio: The Psychological Corp., Harcourt Brace & Co; 1993. [Google Scholar]
- 32.Bradley KA, DeBenedetti AF, Volk RJ, Williams EC, Frank D, Kivlahan DR. AUDIT-C as a brief screen for alcohol misuse in primary care. Alcohol Clin Exp Res. 2007;31:1208–17. doi: 10.1111/j.1530-0277.2007.00403.x. [DOI] [PubMed] [Google Scholar]
- 33.Bush K, Kivlahan DR, McDonnell MB, Fihn SD, Bradley KA. The AUDIT alcohol consumption questions (AUDIT-C): an effective brief screening test for problem drinking. Arch Intern Med. 1998;158:1789–95. doi: 10.1001/archinte.158.16.1789. [DOI] [PubMed] [Google Scholar]
- 34.Cleeland CS. Measurement of pain by subjective report. In: Chapman CR, Loeser JD, editors. Advances in pain research and therapy: issues in pain management. Vol. 12. New York: Raven Press; 1989. pp. 391–403. [Google Scholar]
- 35.Keller S, Bann CM, Didd SL, Schein J, Mendoza TR, Cleeland CS. Validity of the brief pain inventory for use in documenting the outcomes of patients with noncancer pain. Clin J Pain. 2004;20:309–18. doi: 10.1097/00002508-200409000-00005. [DOI] [PubMed] [Google Scholar]
- 36.Zimet GD, Dahlem NW, Zimet SG, Farley GK. The multidimensional scale of perceived social support. J Pers Assess. 1988;52:30–41. doi: 10.1080/00223891.1990.9674095. [DOI] [PubMed] [Google Scholar]
- 37.Iguchi M, Ober A, Berry S, et al. Simultaneous recruitment of drug users and men who have sex with men in the United States and Russia using respondent driven sampling: sampling methods and implications. J Urban Health. 2009;86(Suppl 1):5–31. doi: 10.1007/s11524-009-9365-4. [DOI] [PMC free article] [PubMed] [Google Scholar]
- 38.Volz E, Heckathorn DD. Probability based estimation theory for respondent-driven sampling. J Off Stat. 2008;24:79–97. [Google Scholar]
- 39.Lauritsen JL. The social ecology of violent victimization: individual and contextual effects in the NCVS. J Quant Criminol. 2001;17:3–32. [Google Scholar]
- 40.Office of Juvenile Justice and Delinquency Prevention. The Socioeconomic Mapping and Resource Topography (SMART) System. Washington, D.C: U. S. Department of Justice; 2010. [Accessed 26 June, 2013]. http://www.smartgis.info/smart/About.aspx. [Google Scholar]
- 41.Lauritsen JL, Heimer K. Violent victimization among males and economic conditions: the vulnerability of race and ethnic minorities. Criminol Public Policy. 2010;9:665–92. [Google Scholar]
- 42.Akaike H. A new look at the statistical model identification. IEEE Trans Autom Control. 1974;19:716–23. [Google Scholar]
- 43.Galbraith S, Daniel JA, Vissel B. A study of clustered data and approaches to its analysis. J Neurosci. 2010;30:10601–8. doi: 10.1523/JNEUROSCI.0362-10.2010. [DOI] [PMC free article] [PubMed] [Google Scholar]
- 44.Hardin J, Hibble J. Generalized estimating equations. New York: Chapman & Hall/CRC; 2003. [Google Scholar]
- 45.Pan W. Akaike’s information criterion in generalized estimating equations. Biometrics. 2001;57:120–5. doi: 10.1111/j.0006-341x.2001.00120.x. [DOI] [PubMed] [Google Scholar]
- 46.Hocking D. [Last Accessed 25 June 2013];R script to calculate QIC for Generalized Estimating Equation (GEE) Model Selection. 2012 http://danieljhocking.wordpress.com/2012/03/24/r-script-to-calculate-qic-for-generalized-estimating-equation-gee-model-selection/
- 47.Buchanan D, Tooze JA, Shaw S, Kinzly M, Heimer R, Singer M. Demographic, HIV risk behavior, and health status characteristics of “crack” cocaine injectors compared to other injection drug users in three New England cities. Drug Alcohol Depend. 2006;81:221–9. doi: 10.1016/j.drugalcdep.2005.07.011. [DOI] [PubMed] [Google Scholar]
- 48.Heimer R, Grau LE, Singer M, et al. Hepatitis B virus prevalence and vaccination rates among Hispanic injection drug users participating in a vaccination campaign operated at syringe exchange programs. J Drug Issues. 2008;38:335–50. [Google Scholar]
- 49.Des Jarlais DC, Arasteh K, Friedman SR. HIV among drug users at Beth Israel Medical Center, New York City, the first 25 years. Subst Use Misuse. 2011;46:131–9. doi: 10.3109/10826084.2011.521456. [DOI] [PubMed] [Google Scholar]
- 50.Mark HD, Nanda J, Davis-Vogel A, et al. Profiles of self-reported HIV-risk behaviors among injection drug users in methadone maintenance treatment, detoxification, and needle exchange programs. Public Health Nurs. 2006;23:11–9. doi: 10.1111/j.0737-1209.2006.230103.x. [DOI] [PubMed] [Google Scholar]
- 51.Fuller CM, Galea S, Caceres W, Blaney S, Sisco S, Vlahov D. Multilevel community-based intervention to increase access to sterile syringes among injection drug users through pharmacy sales in New York City. Am J Public Health. 2007;97(1):117–24. doi: 10.2105/AJPH.2005.069591. [DOI] [PMC free article] [PubMed] [Google Scholar]
- 52.Mitty JA, Bazerman LB, Selwyn K, Beckwith CG, Zaller ND, Rich JD. Decrease in the proportion of injecting drug use-related HIV/AIDS in Massachusetts, New York, Connecticut, and Rhode Island. AIDS Read. 2008;18:596–600. [PMC free article] [PubMed] [Google Scholar]
- 53.Kaplan E. Needles that kill: modeling human immuno-deficiency virus transmission via shared drug injection equipment in shooting galleries. Rev Infect Dis. 1989;11:289–98. doi: 10.1093/clinids/11.2.289. (erratum Rev Infect Dis 211:672) [DOI] [PubMed] [Google Scholar]
- 54.Kaplan EH, Heimer R. A circulation theory of needle exchange. AIDS. 1994;8:567–74. doi: 10.1097/00002030-199405000-00001. [DOI] [PubMed] [Google Scholar]
- 55.Mills S, Saidel T, Magnani R, Brown T. Surveillance and modelling of HIV, STI, and risk behaviours in concentrated HIV epidemics. Sex Transm Infect. 2004;80(Suppl 2):ii57–ii62. doi: 10.1136/sti.2004.011916. [DOI] [PMC free article] [PubMed] [Google Scholar]
- 56.Perucci CA, Abeni D, Arca M, Davoli M, Pugliese A. Modelling the HIV and AIDS epidemic among drug injectors. In: Ball A, Stimson GV, Des Jarlais DC, editors. Drug injecting and HIV infection: global dimensions and local responses. London: UCL Press; 1998. [Google Scholar]
- 57.Short LJ, Bell DM. Risk of occupational infection with blood-borne pathogens in operating and delivery room settings. Am J Infect Control. 1993;21:343–50. doi: 10.1016/0196-6553(93)90400-x. [DOI] [PubMed] [Google Scholar]
- 58.Pollack HA, Heimer R. The impact and cost-effectiveness of methadone maintenance treatment in preventing HIV and hepatitis C. In: Weissing L, Jager JC, editors. Impact and costs of hepatitis C in injecting drug users in the European Union. Chapter 17. Lisbon: European Monitoring Centre for Drugs and Drug Addiction; 2003. pp. 345–67. [Google Scholar]
- 59.Vickerman P, Hickman M, Judd A. Modelling the impact on HCV transmission of reducing syringe sharing: London case study. Int J Epidemiol. 2007;36:396–405. doi: 10.1093/ije/dyl276. [DOI] [PubMed] [Google Scholar]
- 60.The Ohio Substance Abuse Monitoring Network. Highlights of Statewide Drug Use Trends: January 2005–June 2005. Columbus, OH: Wright State University, University of Akron; 2005. [Last Accessed 25 June 2013]. http://www.odadas.state.oh.us/public/OsamHome.aspx. [Google Scholar]
- 61.Young AM, Havens JR. Transition from first illicit drug use to first injection drug use among rural Appalachian drug users: a cross-sectional comparison and retrospective survival analysis. Addiction. 2012;107:597–8. doi: 10.1111/j.1360-0443.2011.03635.x. [DOI] [PMC free article] [PubMed] [Google Scholar]
- 62.Grau LE, Dasgupta N, Phinney A, et al. Illicit use of opiates: is OxyContin® a “gateway drug”? Am J Addict. 2007;16:166–73. doi: 10.1080/10550490701375293. [DOI] [PubMed] [Google Scholar]
- 63.Meade CS, McDonald LJ, Weiss RD. HIV risk behavior in opioid dependent adults seeking detoxification treatment: an exploratory comparison of heroin and oxycodone users. Am J Addict. 2009;18:289–93. doi: 10.1080/10550490902925821. [DOI] [PMC free article] [PubMed] [Google Scholar]
- 64.U. S. Census Bureau. Census 2000 summary file 3. Washington, DC: U.S. Census Bureau; 2000. [Google Scholar]
- 65.Gile KJ, Johnston LG, Salganik M. Diagnostics for respondent-driven sampling. arXiv. 2012:1–41. doi: 10.1111/rssa.12059. [DOI] [PMC free article] [PubMed] [Google Scholar]
- 66.Newman JC, Des Jarlais DC, Turner CF, Gribble J, Cooley P, Paone D. The differential effects of face-to-face and computer interview modes. Am J Public Health. 2002;92:294–7. doi: 10.2105/ajph.92.2.294. [DOI] [PMC free article] [PubMed] [Google Scholar]
- 67.Turner CF, Ku L, Rogers SM, Lindberg LD, Pleck JH, Sonenstein FL. Adolescent sexual behavior, drug use, and violence: increased reporting with computer survey technology. Science. 1998;280:867–73. doi: 10.1126/science.280.5365.867. [DOI] [PubMed] [Google Scholar]