

Abstract
Human mesenchymal progenitor cells (MPCs) are considered to be of great promise for use in tissue repair and regenerative medicine. MPCs represent multipotent adherent cells, able to give rise to multiple mesenchymal lineages such as osteoblasts, adipocytes or chondrocytes. Recently, we identified and characterized human second trimester amniotic fluid (AF) as a novel source of MPCs. Herein, we found that early colonies of AF-MPCs consisted of two morphologically distinct adherent cell types, termed as spindle-shaped (SS) and round-shaped (RS). A detailed analysis of these two populations showed that SS-AF-MPCs expressed CD90 antigen in a higher level and exhibited a greater proliferation and differentiation potential. To characterize better the molecular identity of these two populations, we have generated a comparative proteomic map of SS-AF-MPCs and RS-AF-MPCs, identifying 25 differentially expressed proteins and 10 proteins uniquely expressed in RS-AF-MPCs. Furthermore, SS-AF-MPCs exhibited significantly higher migration ability on extracellular matrices, such as fibronectin and laminin in vitro, compared to RS-AF-MPCs and thus we further evaluated SS-AF-MPCs for potential use as therapeutic tools in vivo. Therefore, we tested whether GFP-lentiviral transduced SS-AF-MPCs retained their stem cell identity, proliferation and differentiation potential. GFP-SS-AF-MPCs were then successfully delivered into immunosuppressed mice, distributed in different tissues and survived longterm in vivo. In summary, these results demonstrated that AF-MPCs consisted of at least two different MPC populations. In addition, SS-AF-MPCs, isolated based on their colony morphology and CD90 expression, represented the only MPC population that can be expanded easily in culture and used as an efficient tool for future in vivo therapeutic applications.
Keywords: amniotic fluid, MPCs, migration, proteomic analysis, in vivo properties
Introduction
Adult bone marrow (BM) mesenchymal progenitors cells (MPCs) or mesenchymal stem cells (MSCs), initially described as precursors of fibroblasts or stromal cells, can be isolated taking advantage of their adhesive properties and can be further expanded in culture. Previous studies demonstrated that MPC populations derived from BM are heterogeneous and contain at least two morphologically distinct subpopulations of cells: (a) spindle-shaped (SS), rapidly self-renewing MPCs and (b) flattened-shaped slowly self-renewing MPCs [1–4]. More interestingly, this subset of SS MPCs is able to preferentially engraft in mice; thus, they appear more promising tools for clinical applications [5]. Similarly, SS and flattened-shaped MPCs were also isolated from umbilical cord blood (UCB) at clonal level [6], with SS subpopulation exhibiting high expression levels of CD90, whereas the flattened was negative for the same antigen [6].
Recently, our group and others [7–9] have isolated MPCs from an alternative source, the second trimester amniotic fluid (AF), which can be obtained during routine amniocentesis without any ethical concerns [7, 10–12]. We characterized these cells based on their phenotype, multipotency, differentiation potential and on their proteomic profile, constructing a two-dimensional electrophoresis (2-DE) proteomic database of AF-MPCs [7]. Most importantly, AF-MPCs were easily isolated and grew more rapidly under the appropriate culture conditions compared to BM-MPCs [7]. In addition, concurrent studies showed that AF-MPCs, seeded in a scaffold and exposed to osteogenic-inducing medium, were able to form bone after subcutaneous implantation in vivo, demonstrating an important role in pre-clinical studies [9].
However, AF-MPCs represent a heterogeneous population composed of multiple categories of adherent cells based on morphological, biochemical and growth characteristics [13–16]. Until now, there is no surface epitope or proposed protocol that can distinguish MPCs in vitro and in vivo [2]. Therefore, most experiments have been carried out with heterogenous populations of AF-MPCs [7, 8, 11, 12, 16]. Questions regarding the heterogeneity, the mobilization and homing properties of these cells in vitro and in vivo, as well as their use as carriers of therapeutic agents are still undetermined.
Therefore, a large number of parameters must be taken under consideration in isolating the rapidly expanding MPCs from AF. First, an important determinant of successful stem cell therapeutic transplantation is the ability of the transplanted cells to home, migrate, efficiently engraft and repair damaged tissues. Various molecules have been shown to regulate these processes in MPCs. Among these are the VLA-5 integrin, which comprises of α5 (CD49e) and β1 (CD29) subunits and plays key role in migration [7, 8, 11, 17] and the adhesion molecule CD44, which is highly expressed in most of the mesenchymal cell types [18, 19].
Another parameter involves the feasibility of employing genetic modifications on AF-MPCs by introducing therapeutic genes of interest. For these manipulations, apart from adenoviruses, that have been previously utilized in AF-MPCs [20], lentiviral vectors represent a highly efficient and long-term infection system for transducing stem cells, without the presence of silencing effects during multiple divisions [21–23].
Herein, we have extended our previous findings [7], by isolating and characterizing two different types of AF-MPCs at passage 0 based on their shape, antigen expression levels and functional properties. We named these cells according to their morphology as SS and round-shaped (RS) AF-MPCs. SS-AF-MPCs are characterized by a greater proliferation and multilineage differentiation potential, while they are exhibiting higher levels of CD90 compared to RS-AF-MPCs. Therefore, in the current experiments, we compared their molecular identity, the differentiation capacity and the in vitro adhesion properties of both subpopulations. We further analysed the migratory ability, the efficient gene modification and the perspective utilization of SS-AF-MPCs in pre-clinical studies in vivo.
Material and methods
Isolation and culture of MPCs from human AF
Human AF-MPCs were isolated from 95 AF samples, collected during scheduled amniocentesis between the 15th and 18th week of gestation [7]. Briefly, second trimester AF samples were obtained, following a written informed consent, approved by the Ethical Committee of the Alexandra Hospital, Athens and the Bioethics Committee of the University of Athens School of Medicine, during scheduled amniocenteses between the 15th and 18th week of gestation. Amniocentesis was performed under aseptic conditions. Using a 22G needle and under ultrasonographic control, 10–15 ml of AF was aspirated for each sample. The procedure-related spontaneous abortion rate ranges from 0.06% to 0.5% [24, 25]. Samples were collected and 10 ml of each were centrifuged at 1300 rpm for 10 min. The pellet was resuspended in DMEM (Sigma-Aldrich, St. Louis, MO, USA) supplemented with 20% (v/v) foetal bovine serum (FBS) (Gibco-BRL, Paisley, Scotland, UK), in a 25 cm2 tissue culture-treated flask and incubated at 37°C in a 5% humidified CO2 chamber for approximately 20 days, where the first colonies appeared. The medium was then changed every five days. The cells were expanded into higher passages and frozen until use.
Colony forming unit-fibroblast (CFU-F) assay
The CFU-F assay was performed by plating 1 × 10⁵ AF cells/well into six-well plates from six randomly selected samples, in the presence of DMEM (Sigma-Aldrich) supplemented with 20% (v/v) FBS (Gibco-BRL). After 18–20 days of culture, CFUs were formed, mechanically selected and subcultured separately [26]. The cells from each colony were expanded into higher passages and frozen until use.
Karyotyping
For karyotyping, RS-AF-MPCs and SS-AF-MPCs from four different samples each, grown in log phase, were harvested and karyotyped using Giemsa stain GTG banding, at passage 5. For SS-AF-MPCs, karyotype was examined at passage 32 as well. Forty metaphase spreads were fully analysed and karyotyped in each case.
Antibodies and flow cytometry analysis (FACS)
RS-AF-MPCs and SS-AF-MPCs of passage 3–17 were characterized by FACS analysis using CD90, CD166, CD73, CD105, CD44, c-kit, CD34, CD133, CD31, CD29, CD49e, CD45, CD50, CD106, CD11a, CD62P, CD1a, CD13, CD14, CD62E and CD146 [Becton Dickinson (BD), San Jose, CA, USA], SSEA-4 (Abcam, Cambridge, UK), HLA-ABC and HLA-DR (BD) mouse anti-human monoclonal antibodies or appropriate isotype controls (BD). The latter reactions were developed with fluorescein isothiocyanate (FITC)-conjugated goat anti-mouse IgG secondary antibody (DAKO DakoCytomation Ltd., Cambridgeshire, UK). For apoptosis detection, cells were stained with Annexin V-PE (BD) according to manufacturer’s instructions. Cells were analysed using a Beckman Coulter Cytomics FC 500 flow cytometer (Beckman Coulter Ltd., Palo Alto, CA, USA). For immunofluores cent staining, anti-collagen type I (Sigma-Aldrich), anti-E-cadherin (Abcam), anti-N-cadherin (Santa Cruz Biotechnology Inc. Santa Cruz, CA, USA) and anti-Vimentin (Thermo Scientific, Fremont, CA, USA) antibodies were used in fixed cells with 4% paraformaldehyde (Sigma-Aldrich). The latter reactions were developed with FITC-conjugated goat anti-mouse IgG (DAKO DakoCytomation Ltd.) or Alexa-488-conjugated goat anti-rabbit (Invitrogen Ltd., Paisley, UK) secondary antibodies, where appropriate. Isotype-matched antibodies were used as negative control. For Oct-4 and Sox-2 nuclear immunofluorescent staining, cells were permeabilized in 0.2% (v/v) Triton-X (Sigma-Aldrich) for 30 min at room temperature after fixation as described above. Cells were then stained with rabbit anti-human Oct-3/4 (Santa Cruz Biotechnology Inc.) or rabbit anti-human Sox-2 (Millipore, CA, USA) antibodies. The latter reactions were developed with Alexa-488-conjugated goat anti-rabbit (Invitrogen Ltd.) secondary antibody. Slides were mounted with Vectashield mounting medium (Vector Laboratories Inc., CA, USA) containing DAPI solution. Cells were visualized and photographed on a Leica CTR-MIC Fluorescent microscope.
MTS proliferation assay
MTS assay was performed to estimate the proliferation rate of SS-AF-MPCs, RS-AF-MPCs or GFP-SS-AF-MPCs. Cells were plated at a density of 103 per well in a 96-well plate and cultured for 6–7 days in the presence of DMEM (20% FBS) in five replicates. Appropriate amount of MTS (Promega Ltd, Madison, WI, USA) was added to each well and incubated for three hrs. The absorbance was recorded at 490 nm using an ELISA plate reader (ELX 800; Biotek Instruments Inc, VT, USA). The percentage increase of proliferation was calculated using the following formula: [(ODdayx−ODday0)/ODday0× 100)]. Statistical analysis was performed using the Student’s t-test. Three individual samples from each cell type were analysed.
For conditioned medium (CM) preparation, SS-AF-MPCs were cultured until 80% confluency and further allowed to grow in a medium containing 20% FBS for 48 hrs. CM was collected, filtered and stored at −20°C until use. RS-AF-MPCs were cultured in CM derived from SS-AF-MPCs for six days. CM was changed every day.
For temperature proliferation analysis, SS-AF-MPCs at passage 15–20 were cultured for 1 and 6 days in DMEM (20% FBS) at 37°C and 33°C, respectively.
Transwell migration assay
SS-AF-MPCs (passage 5–15) and RS-AF-MPCs (passage 2–5) were cultured for 48 hrs in DMEM (2% FBS) and then were transferred to the insert of a 8 mm pore size transwell plate, at 5×10⁴/100 μl density (Corning-Costar, Cambridge, MA, USA). The cells were then allowed to migrate for 16 hrs across the pore membrane, towards human plasma fibronectin (20 μg/ml; Sigma-Aldrich), laminin I (20 μg/ml; Sigma-Aldrich) or DMEM (2% FBS). The non-migrated cells were removed from the top of the insert with a cotton swab. The migrated cells were then fixed with 4% paraformaldehyde (Sigma-Aldrich) on the membrane and stained using the Ral Kit (Ral Reactif, Paris, France). For migration blocking experiment, cells were pre-incubated with CD44 (clone 515, BD). Migration was quantified by counting the stained nuclei that passed through the filter. Photographs were taken from a minimum of 10 fields of view (20×) for each membrane and then counted by using Image J software. Three independent experiments were performed each including three replicates. Statistical analysis was performed using the Student’s t-test.
Adhesion assay
SS-AF-MPCs (passage 5–15) and RS-AF-MPCs (passage 2–5) were pre-incubated either with CD44 (clone 515, BD), CD49e (blocking antibody, BD) or IgG1 isotype control (BD) and then transferred to a 24-well plate, coated with fibronectin (Sigma-Aldrich) or hyaluronic acid (Sigma-Aldrich). Non-treated SS-AF-MPCs and RS-AF-MPCs were used as positive controls. Cells were let to adhere for 2 hrs and then the supernatant was removed. The adherent cells to the bottom of the well were fixed with 4% (w/v) paraformaldehyde (Sigma-Aldrich), stained using the Ral Kit (Ral Reactif). Photographs were taken from a minimum of 10 fields of view (20×) for each membrane and then counted by using Image J software. Three independent experiments were performed, each including three replicates. Statistical analysis was performed using the Student’s t-test.
RT-PCR procedure
Total RNA was extracted from the cells using the Tri Reagent (Sigma-Aldrich) according to the manufacturer’s instructions. The mRNA was reverse transcribed to cDNA using the M-MLV Reverse Transcriptase-RNase H Minus kit (Promega Ltd.).
Real-time quantitative PCR and semi-quantitative PCR
Real-time quantitative PCR was conducted on an ABI Prism 7700 apparatus [Applied Biosystems (ABI), Foster City, CA, USA]. Each cDNA sample was mixed with specific primer sets and PCR master mix (No. 4312704; Applied Biosystems). TaqMan RT-PCR was used for oct-4, nanog and sox-2 gene expression analysis with primers and conditions designated by Assays on Demand™, Gene Expression Products [ABI Hs00742896_s1 (oct-4), Hs02387400_s1 (nanog), Hs01053049_s1 9 (sox-2), respectively]. Data were analysed with the ABI Prism 7700 SDS software (ABI). The expression of oct-4, nanog and sox-2 was normalized to GAPDH internal control (No. 433764T; GAPDH; ABI), as described by Zannettino et al. [27]. The levels of gene expression were normalized after subtracting the Ct value of the GAPDH internal control from that of the x (x = oct-4, nanog or sox-2) Ct value for SS-AF-MPCs and RS-AF-MPCs (ΔCt = |CtX (SS-AF-MPCs or RS-AF-MPCs)−Ct GAPDH|). To compare the levels of oct-4, nanog and sox-2 expression between SS-AF-MPCs and RS-AF-MPCs, the ΔΔCt value was determined using the formula (ΔΔCt =ΔCt X(SS-AF-MPCs)−ΔCt X(RS-AF-MPCs)). Then, the relative level of oct-4, nanog and sox-2 in SS-AF-MPCs was compared to RS-AF-MPCs by setting the oct-4, nanog and sox-2 expression in RS-AF-MPCs value to 1 and determining the fold change in expression against this value using the following formula: 2ΔΔCt.
PCR reaction for albumin was performed using cDNA, primer pairs and Go Taq® Green master mix (Promega Ltd.). The primers used were: F: 5’-AGATGACAACCCAAACCTCCC-3’ and R: 5’-CAGCAGCACGACAGAGTAATC-3’. The semi-quantitative PCR analysis was determined by using the Image J software after normalization to the β-actin endogenous control (F: 5’-TCTACAATGAGCTGCGTGTG-3’ and R: 5’-CAACTAAGTCATAGTCCGCC-3’).
Differentiation assays
Osteogenic differentiation
To induce osteogenic differentiation SS-AF-MPCs or RS-AF-MPCs of passage 5–7 were cultured to 60–70% confluency in osteogenic medium for 3 weeks, as described previously [7]. The differentiation potential for osteogenesis was assessed by alkaline phosphatase staining using BCIP/NBT reagent (Sigma-Aldrich), according to the manufacturer’s instructions.
Adipogenic differentiation
SS-AF-MPCs or RS-AF-MPCs of passage 5–13, grown as described above, were treated with adipogenic medium for 3 weeks, as described previously [7]. Medium changes were carried out twice weekly. For the determination of adipogenic differentiation, formation of intracellular lipid droplets was monitored under microscope and was confirmed by Oil Red O staining (Sigma-Aldrich).
Chondrogenic differentiation
To induce chondrogenic differentiation, SS-AF-MPCs or RS-AF-MPCs, of passage 5–10, were cultured in high-density pellet mass cultures. Briefly, 2.5 × 10⁵ cells were placed into a conical polypropylene tube with 0.5 ml of defined medium, consisting of DMEM (Sigma-Aldrich) supplemented with 5.33 μg/ml linoleic acid (Sigma-Aldrich), insulintransferrin-selenium+ (ITS+) (Sigma-Aldrich), 1.25 mg/ml bovine serum albumin (Sigma-Aldrich), 10 ng/ml transforming growth factor β3 (TGF-β3) (Peprotech), 10−7M dexamethasone (Sigma-Aldrich), 0.17 mM ascorbate acid (Sigma-Aldrich) and 0.35 mM L-Proline (Sigma-Aldrich). Cells were centrifuged at 2000 rpm for 5 min and maintained at 37°C for 21 days. Medium was changed twice a week. After 21 days of pellet mass culture, the pellets were fixed in 10% formalin (Sigma-Aldrich), paraffin embedded, sectioned and stained with Alcian Blue (Sigma-Aldrich) and haematoxylin and eosin (Sigma-Aldrich).
Hepatogenic differentiation
For hepatogenic differentiation, SS-AF-MPCs or RS-AF-MPCs of passage 5–13, at 1.0–1.3 × 10⁴/cm2 density, were treated with appropriate hepatogenic medium, as described previously [7]. Hepatogenesis was assessed after 3 weeks by periodic acid-Schiff (PAS) staining (Sigma-Aldrich), measurement of urea concentration (Urea UV Liquid, Technologia Diagnostics, Greece) using the Chemwell 2910 autoanalyzer (Awareness Technology Inc., Palm City, FL, USA) and determination of albumin expression by semi-quantitative PCR.
Osteogenic, adipogenic and PAS hepatogenic differentiation assays were quantified by microscopic analyses of 10 fields per image using the Image J software.
Proteomic analysis–mass spectrometry (MS)
Three samples of SS-AF-MPCs or RS-AF-MPCs of passage 5–10 were analysed by 2D-gel electrophoresis in duplicate each, as described before [7]. Protein spots were manually excised, tryptic digested and Peptide Mass Fingerprinted [7]. Stringent criteria were used for protein identification with a maximum allowed mass error of 25 ppm (parts per million) and a minimum of five matching peptides [29]. Notably, a high percentage of the proteins were identified based on 10 matches. The probability of a false identity was usually lower than 10−5. All selected proteins were identified and further analysed for their functional properties by the Swiss-Prot (http://expasy.org/sprot/) and Human Protein Reference Databases (http://www.hprd.org/). 2DE image analysis was performed by the use of the PD-Quest 8.0 (BioRad, Hercules, CA, USA) software package. Protein expression was shown as a ratio of the intensity of protein spots in SS-AF-MPCs to RS-AF-MPCs or vice versa in ppm. Comparison of the expression level of the various protein spots was conducted by the use of Student’s t-test and Mann-Whitney test. In all cases, P < 0.05 (95% confidence levels) was considered statistically significant.
Western blot
Total proteins of SS-AF-MPCs and RS-AF-MPCs were separated by 10% SDS-PAGE and electroblotted to Hybond-ECL NC membrane (Amersham Biosciences, Sweden). Protein extracts were derived from a pool of three SS-AF-MPCs or RS-AF-MPCs individual samples of different passages, respectively. After blocking, membranes were incubated overnight at 4°C with the primary antibodies: mouse anti-human CK18 (DakoCytomation), mouse anti-human Cathepsin (BD) or mouse anti-human CK19 (DakoCytomation). Mouse anti-human β-actin antibody (Sigma-Aldrich) was used as a control of equal loading. Membranes were then incubated with anti-mouse HRP-conjugated secondary antibody (Santa Cruz Biotechnology Inc.) and developed by ECL (Perkin-Elmer, MA, USA) detection system. Films were scanned and images were analysed using Quantity One software (BioRad).
Lentiviral vector generation, production and transduction of SS-AF-MPCs
The four plasmid expression lentiviral system containing the pCCLsin.PPT.hPGK.GFP plasmid used for enhanced GFP expression [28]. Virus was produced by transient transfection into 293T cells, as previously described [29], and collected by ultracentrifugation using an Ultracentrifuge Discovery 100 Sorvall (Thermo Fisher Scientific Inc., Waltham, MA, USA). The concentrated virus was resuspended in PBS supplemented with 0.5% BSA (Sigma-Aldrich). The lentiviral titres were determined by infection of HT1080 cells with serial dilutions of the concentrated viral stock. GFP fluorescent cells were identified by fluorescent microscopy and FACS analysis. Titers ranged from 5 × 10⁸ to 3 × 10⁹ infectious units (IU)/ml. Approximately, 5 × 10⁴ per well SS-AF-MPCs were seeded in a six-well plate 1 day in advance. Virus was added in a multiplicity of infection (MOI) of 10–100.
In vivo engraftment of GFP-SS-AF-MPCs
NOD-SCID mice were housed and maintained at the Animal Facility of the Biomedical Research Foundation of the Academy of Athens (BRFAA). The procedures for the care and treatment of animals were performed according to the institutional guidelines, which follow the guidelines of the Association for Assessment and Accreditation of Laboratory Animal Care (AAALAC) and the recommendations of the Federation of European Laboratory Animal Science Associations (FELASA) and approved by the Institutional (BRFAA) Animal Care and Use Committee. Six to eight weeks old animals (n = 8) received intravenously (i.v.) by tail vein injection 1 × 10⁶ GFP-SS-AF-MPCs (passages 15–40). The animals were sacrificed 4 and 10 days later and the tissues were analysed by immunohistochemistry, FACS and RT-PCR. For the detection of GFP transgene, genomic DNA was isolated from each organ/tissue collected, using Proteinase K (Sigma-Aldrich), followed by phenol–chloroform extraction. RT-PCR analysis was carried out using primers designed on the WPRE sequence of the lentiviral vector present only in the infused GFP-SS-AF-MPCs (F: 5’-TTCTCCTCCTTGTATAAATCCTGGTT-3’ and R: 5’-CGCCACGTTGCCTGACA-3’) and SYBR master mix (Roche Applied Sciences, Indianapolis, IN, USA), according to manufacturer’s protocol.
Further, to assess SS-AF-MPCs viability in matrigel in vivo, NOD/SCID mice of the same age (n = 6) received subcutaneously 1×10⁶ SS-AF-MPCs in 200 μl of matrigel (Sigma-Aldrich) into the tail base. As negative control, 1×10⁶ SS-AF-MPCs in 200 μl of PBS were used. The animals were sacrificed 1 and 10 days later and the matrigel mass was excised and photographed. Cells were then disassociated by the use of 2% (w/v) collagenase (Sigma-Aldrich) for 2 hrs at 37°C and analysed by FACS.
Immunohistochemistry
At 4 and 10 days after i.v. injection of GFP-SS-AF-MPCs, animals were sacrificed and analysed by immunohistochemistry for GFP or CD90 expression. Tissues were fixed in 10% formalin (Sigma-Aldrich) and embedded in paraffin. Non-specific binding was blocked using 10% donkey serum in PBS. Five-micrometre sections were subsequently incubated with eGFP (Chemicon, Temecula, CA, USA), CD90 (BD) or appropriate isotype control antibodies. The reaction was developed with biotinylated goat anti-mouse secondary antibody (DakoCytomation), followed by ABC-complex-HRP (DakoCytomation) and DAB (Vector Laboratories Inc.). Slides were counterstained in Gill’s haematoxylin (Sigma-Aldrich).
Results
Phenotypic characterization of two different AF-MPC populations
As reported previously, BM-MSC and UCB-MSC cultures contained distinct cell types differing at shape and size [4, 6]. In this study, cell pellets from 95 second trimester AF samples were plated according to previous protocols [7] and then plastic adherent cells were isolated. Microscopic analysis led to the identification of two morphological different adherent MPC types in AF, termed as SS-AF-MPCs (6%, five established cell lines) and RS-AF-MPCs (94%) (Fig. 1A and B). We initially noticed that the percentage of proliferation increase in SS-AF-MPCs and RS-AF-MPCs differed during passages 5–7. A more detailed analysis revealed that SS-AF-MPCs exhibited high proliferative capacity and were passed over 45 passages to date, whereas RS-AF-MPCs exhibited a significantly lower proliferative potential and reached up to passage 4–7 (Fig. 1C). More importantly, RS-AF-MPCs when cultured in CM derived from SS-AF-MPCs exhibited a statistically significant increased proliferative potential (Fig. 1C), suggesting that these cells may require paracrine factors derived from the SS-AF-MPCs for expanding. The identification of these two different AF populations is of great importance for potential use of SS-AF-MPCs in pre-clinical applications and for this reason we attempted to investigate their characteristics in more detail.
Fig 1.
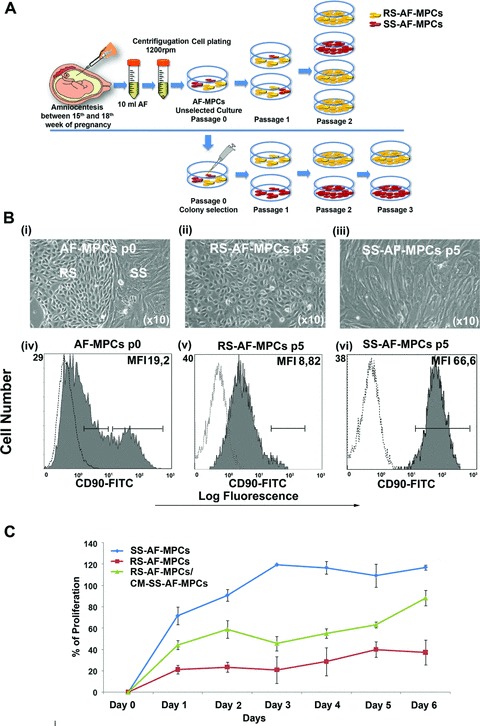
Spindle- and round-shaped amniotic fluid mesenchymal progenitor cells. (A) Schematic representation of unselected AF-MPCs and mechanically selected colonies in an in vitro culture. (B) (i) AF-MPCs colonies morphology at p0, (ii) RS-AF-MPCs (p5) and (iii) SS-AF-MPCs (p5) morphology. Representative FACS histograms of (iv) AF-MPCs at p0, gated for CD90 expression (grey filled histograms), prior to analysis with the isotype-matched negative control (open histograms) at p0, (v) homogenous RS-AF-MPC at p5 and (vi) homogenous SS-AF-MPCs at p5 populations, respectively. (C) Comparative analysis of the percentage of proliferation of SS-AF-MPCs (blue line), RS-AF-MPCs (red line) and RS-AF-MPCs cultured in CM derived from SS-AF-MPCs (green line), during 6 days of culture by MTS assay. Values are mean ± S.D. for three independent samples from each MPC population.
We first observed that unselected cultures at passage 0–1 contained a mixture of SS and RS cells (Fig. 1B, i). However, at two to three passage in 94% of the sample cases of unselected cells, the RS cells were more abundant, overtaking the culture (Fig. 1B, ii). The rest 6% of the samples represented a SS cell population (Fig. 1B, iii) that can be expanded up to 30–50 passages to date with normal karyotype (Fig. S1E, i and iii) and high proliferation capacity (Fig. 1C). The reason why the SS-AF-MPCs were the predominant and the only population at passages 2–3 onwards in the 6% of the AF samples only, is still undetermined. In an attempt to characterize better these two subpopulations, we randomly chose six AF samples at passage 0, where a mixture of both cell types existed at almost equal frequency. We then mechanically isolated 20 individual CFUs, 10 with RS and 10 with SS morphology in total (Fig. 1A). The clonal SS-AF-MPCs and RS-AF-MPCs were further expanded in vitro and retained their morphological characteristics during culture.
The cell surface antigenic characteristics of these two types of AF-MPCs were examined by FACS analysis. Both types of AF-MPCs were negative for CD34, CD133, CD31, CD45, CD14 and HLA-DR. SS-AF-MPCs and RS-AF-MPCs were positive for MSC markers CD73, CD105 and CD166, adherent molecules CD29, CD44 and CD49e and HLA-ABC (Fig. 2). The surface marker profiles were consistent with previously reported BM, AF and UCB heterogeneous populations of MSCs [7, 9, 30, 31]. c-kit was expressed in similar very low/undetectable levels in both SS-AF-MPCs and RS-AF-MPCs populations, whereas CD146 was expressed in higher levels in RS-AF-MPCs compared to SS-AF-MPCs (Fig. 2). However, we observed that SS-AF-MPCs expressed high levels of CD90 [median fluorescent intensity (MFI): 58.33 ± 9.68)] (Fig. 1B, vi), whereas RS-AF-MPCs showed lower expression (MFI: 7.43±6.53) (Fig. 1B, v). We further noticed that unselected cultures at passage 0 exhibited heterogeneous expression for CD90, low (MFI 1.6 ± 1.45) and high (MFI 53.4 ± 4.14), which may indicated the initial co-existence of the two different populations (Fig. 1B, iv). More interestingly, the expression profile of SS-AF-MPCs and RS-AF-MPCs remained the same during culture, with stable CD90 expression for each population, irrelevant to the culture passages and to the in vitro MPCs aging (data not shown). Another important observation was that SS-AF-MPCs exhibited high expression levels of CD44 adhesion molecule (MFI: 58.95 ± 8.91) compared to RS-AF-MPCs (MFI: 37.4 ± 10.46). We additionally examined the expression of MSC markers such as Vimentin and N-cadherin and also the epithelial marker E-cadherin. Both cell types were positive for Vimentin, whereas SS-AF-MPCs expressed E- and N-cadherin in a higher level (Fig. S1A).
Fig 2.
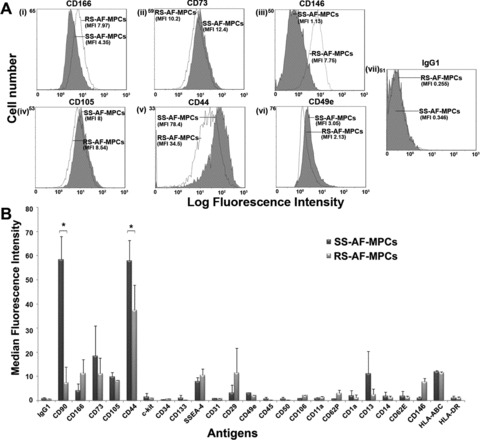
Comparison of SS-AF-MPCs and RS-AF-MPCs expression patterns. (A) Representative FACS histograms of SS-AF-MPCs (grey filled histograms) and RS-AF-MPCs (opened histograms) gated for (i) CD166, (ii) CD73, (iii) CD146, (iv) CD105, (v) CD44 and (vi) CD49e markers, prior to analysis with (vii) the isotype-matched negative control. (B) SS- and RS-AF-MPCs analysed for different antigens expression by FACS analysis. The statistics were made on the mean MFI for each antigen. Isotype matched negative controls were used. Values are shown as mean ± S.D. for three independent samples from each type. Statistical analysis was performed using the Student’s t-test (*P < 0.05).
CD90 expression altered according to the proliferation rate of SS-AF-MPCs
In an attempt to examine a potential relation of the enhanced expression levels of CD90 in SS-AF-MPCs with the high proliferation capacity they exhibit, we performed an in vitro proliferation assay at different temperature culture conditions. It is known from classical studies that when fibroblast-like cells are cultured at lower temperature (i.e. 33°C), they exhibit a lower proliferation rate [32]. Therefore, we performed proliferation analysis assay for SS-AF-MPCs at 37°C (normal temperature conditions) and 33°C (low temperature conditions), respectively. The proliferation rate of SS-AF-MPCs dramatically decreased when cultured at 33°C for 6 days (Fig. 3A), compared to those cultured at 37°C for the same period. When we examined the expression of mesenchymal-related antigens at these time points, we observed that CD73 and CD105 levels were not altered when SS-AF-MPCs were cultured at 33°C (Fig. 3B). However, CD90 expression was decreased to 60.08%± 26.4 for day 1 (Fig. 3B, i) and 62.09%± 3.65 for day 6 (Fig. 3B, ii), respectively when the proliferation rate of SS-AF-MPCs was reduced because of temperature change. These results showed that CD90 antigen expression might be related to the growth rate of AF-MPCs and may in turn explain the difference of proliferation between the SS-AF-MPCs (CD90high) and RS-AF-MPCs (CD90low) subpopulations.
Fig 3.
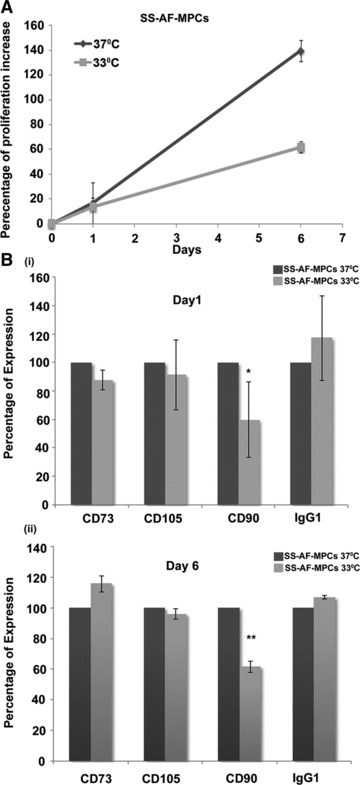
CD90 expression alteration according to the proliferation rate of SS-AF-MPCs. (A) Comparative analysis of the percentage of proliferation increase of SS-AF-MPCs at 37°C (grey line) and 33°C (light grey line), respectively during 6 days of culture. (B) Comparison of the percentage of expression of CD73, CD105 and CD90 (i) at day 1 and (ii) day 6 of culture at 37°C (grey bars) and 33°C (light grey bars) by FACS analysis, respectively. MFI values were normalized for each marker against the level of expression determined at 37°C, which was set to 100%. Values are shown as mean ± S.D. for three independent experiments. Statistical analysis was performed using the Student’s t-test (*P < 0.05; **P < 0.001).
CD44 neutralizing antibody inhibited SS-AF-MPCs migration on fibronectin
Initially, a transwell migration assay was developed to determine the migration potential of SS-AF-MPCs and RS-AF-MPCs to fibronectin and laminin. Interestingly, SS-AF-MPCs migrated approximately 7.59- and 7.79-fold faster towards fibronectin and laminin, respectively, than RS-AF-MPCs (Fig. 4A, i) (P < 0.001, Student’s t-test).
Fig 4.
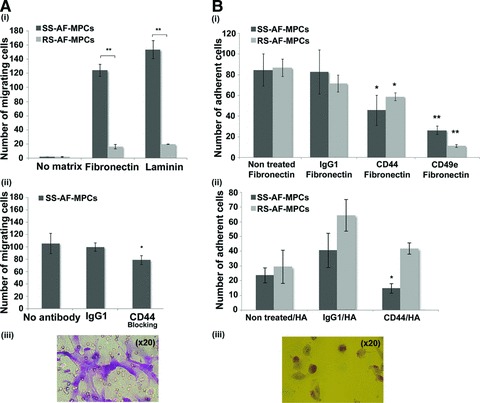
Migration and adhesion properties of SS-AF-MPCs and RS-AF-MPCs. (A) (i) SS-AF-MPCs showed higher motility (**P < 0.001) on fibronectin and laminin, respectively compared to RS-AF-MPCs. (ii) Number of migrated SS-AF-MPCs to fibronectin in presence of CD44 neutralizing antibody or isotype matched non-specific antibody IgG1. (iii) Representative image (20×) of migrated SS-AF-MPCs fixed and stained using the Ral staining kit on the transwell membrane. (B) (i) Number of adherent SS-AF-MPCs and RS-AF-MPCs to fibronectin, treated with CD44, CD49e neutralizing antibodies or isotype matched non-specific antibody IgG1 in comparison to non treated SS-AF-MPCs and RS-AF-MPCs, respectively. (ii) Number of adherent SS-AF-MPCs and RS-AF-MPCs to hyalouronic acid, treated with CD44 neutralizing antibody or isotype matched non-specific antibody IgG1 in comparison to non treated SS-AF-MPCs and RS-AF-MPCs, respectively. (iii) Representative image (20×) of adherent cells fixed and stained using the Ral staining kit on the plastic vessel. Values are shown as mean ± S.D. for three independent experiments. Statistical analysis was carried out using the Student’s t-test (*P < 0.05; **P < 0.001).
Taking under consideration that CD44 represented an adhesion molecule, binding on fibronectin and was expressed in SS-AF-MPCs in a higher level than RS-AF-MPCs according to FACS analysis (Fig. 2), we further investigated whether this elevated expression has a functional role in migration of SS-AF-MPCs. We therefore performed the same transwell migration assay after pre-incubating SS-AF-MPCs with a neutralizing antibody for CD44. Isotype non-binding antibody (IgG1) was used as a negative control. A significant decrease of 31.05%±12.13 (P < 0.05, Student’s t-test) in migration capacity of SS-AF-MPCs was observed in the presence of CD44 blocking antibody (Fig. 4A, ii).
CD44 neutralizing antibody inhibited SS-AF-MPCs and RS-AF-MPCs adhesion on fibronectin and hyalouronic acid
SS-AF-MPCs and RS-AF-MPCs when tested in an in vitro adhesion assay on fibronectin and hyalouronic acid, exhibited similar adhesion properties on both matrices (Fig. 4B, i and ii non-treated cells). To analyse in detail the role of CD44 adhesion molecule, which binds to fibronectin and also to hyalouronic acid [33], we examined whether CD44 controlled not only the high migration capacity of SS-AF-MPCs as shown before, but also the adhesion of both populations to the respective binding matrices. Blocking of CD44 resulted in lower adhesion of both SS-AF-MPCs and RS-AF-MPCs on fibronectin at approximately 48% (P < 0.05, Student’s t-test) and 31.3% (P < 0.05, Student’s t-test), respectively (Fig. 4B, i). However, only SS-AF-MPCs exhibited impaired adhesion on hyaluronic acid in the presence of CD44 blocking antibody, (37.9%, P < 0.05, Student’s t-test). There was no significant effect on cell adhesion using the IgG1 antibody compared to the non treated cells in both matrices (Fig. 4B, i and ii).
CD49e modulated SS-AF-MPCs and RS-AF-MPCs adhesion properties
Both cell types express the CD49e molecule which binds to fibronectin, as determined by FACS analysis (Fig. 2). For examining the role of CD49e on fibronectin-mediated adhesion, we analysed SS-AF-MPCs and RS-AF-MPCs in an in vitro adhesion assay. We observed an approximately 87% (P < 0.001, Student’s t-test) and 68.9% (P < 0.001, Student’s t-test) reduction on adhesion ability of SS-AF-MPCs and RS-AF-MPCs, respectively, in the presence of CD49e blocking antibody, compared to non-treated cells (Fig. 4B, i).
SS-AF-MPCs expressed oct-4, nanog and sox-2 in higher levels than RS-AF-MPCs
We next examined the expression of the oct-4, sox-2 and nanog transcripts, key markers in embryonic stem cells and responsible for the maintenance of pluripotency of mammalian stem cells in vivo and in vitro, in SS-AF-MPCs and RS-AF-MPCs of passages 5–7 [34, 35]. Oct-4, nanog and sox-2 exhibited a 2.6 ± 1.38, 10.41 ± 3.38 and 15.18 ± 3.92 fold higher expression respectively, in SS-AF-MPCs compared to RS-AF-MPCs, by RT-PCR analysis after normalization to GAPDH endogenous control (Fig. 5A). However, both AF-MPCs types expressed Oct-4 and Sox-2 at protein level, as demonstrated by nuclear immunofluorescent staining (Fig. 5B). In all samples examined, the majority of the cells were positive for Oct-4 and Sox-2.
Fig 5.
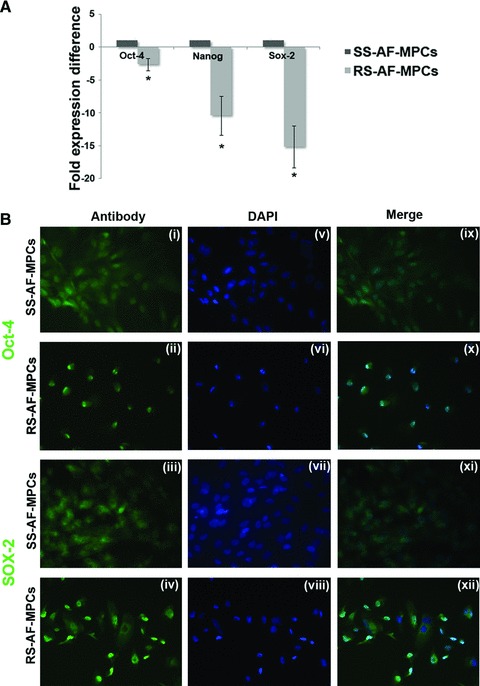
Embryonic stem cell marker expression and differentiation potential of SS-AF-MPCs and RS-AF-MPCs. (A) Comparative analysis for the expression of oct-4, nanog and sox-2 in three SS-AF-MPCs and RS-AF-MPCs samples, respectively, analysed by RT-PCR. Results were first normalized to human GAPDH positive control and then to SS-AF-MPCs expression levels for each marker, respectively. Statistical analysis was performed using the Student’s t-test. (B) Immunofluorecent nuclear staining for (i–ii) Oct-4, (iii–iv) Sox-2 and (v–viii) DAPI (ix–xii) of SS-AF-MPCs and RS-AF-MPCs. Merge of DAPI staining and antibody staining. Original magnifications, 40×.
SS-AF-MPCs exhibited different differentiation properties compared to RS-AF-MPCs
SS-AF-MPCs and RS-AF-MPCs were cultured under appropriate conditions that induce adipocytes, osteocytes, chondrocytes (mesoderm-derived) and hepatocytes (endoderm-derived), to evaluate their in vitro differentiation properties (Fig. 6). Results showed that RS-AF-MPCs exhibited an enhanced adipogenic (1.6 ± 0.4 fold times increase) (Fig. 6A, iii) and reduced osteogenic (4.6 ± 1.0 fold times decrease) (Fig. 6B, iii) differentiating capacity compared to SS-AF-MPCs, as determined by oil red O and alkaline phosphatase staining and quantified by Image J analysis, respectively. Interestingly enough, under chondrogenic and hepatogenic inducing conditions, RS-AF-MPCs failed to form chondrocytes and hepatocyte-like cells respectively, in contrast to SS-AF-MPCs (Fig. 6C and D). Chondrogenesis, was determined by Alcian Blue staining of pellets (Fig. 6C). Hepatogenesis was verified by PAS staining, where hepatocyte-like cells derived from SS-AF-MPCs exhibited a 73.07 ± 5.2 fold times increase in PAS staining compared to SS-AF-MPCs (Fig. 6D, ii), urea production (46.5 mg/dl ± 10.2) compared to SS-AF-MPCs (9.6 mg/ dl ± 6.4) (Fig. 6D, iii) and high albumin expression level (12.5 ± 2.4 fold expression difference compared to SS-AF-MPCs) (Fig. 6D, iv).
Fig 6.
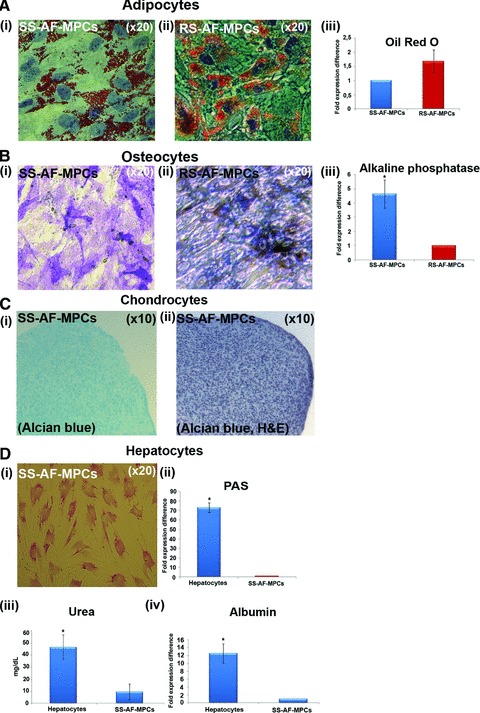
(A) Oil Red O staining for adipocyte differentiation properties of (i) SS-AF-MPCs and (ii) RS-AF-MPCs respectively, followed by (iii) quantitation analysis. (B) Alkaline phosphatase staining for osteocyte differentiation for (i) SS-AF-MPCs and (ii) RS-AF-MPCs respectively, followed by (iii) quantitation analysis. (C) (i) Alcian Blue and (ii) haematoxylin and eosin staining of SS-AF-MPCs, cultured under chondrogenic inducing conditions in pellet mass cultures. (D) PAS staining for hepatocyte differentiation for (i) SS-AF-MPCs induced to hepatocytes. (ii) Quantitation analysis for PAS staining, (iii) determination of the secreted Urea and (iv) albumin expression were shown. Quantitation of the respective differentiation assays was performed by using the Image J analysis software on 10 fields per image. For each sample, four images were taken. For adipogenic and osteogenic differentiation values were normalized in each case against the AF-MPC type with the lower differentiation capacity, which was set to 1, whereas for hepatogenic differentiation, values were normalized in each case against non-induced to differentiation SS-AF-MPCs. Values are mean ± S.D. from three samples from each type. Statistical analysis was performed using the Student’s t-test, *P < 0.05.
Differentially expressed proteins identified in SS-AF-MPCs and RS-AF-MPCs
To further characterize the AF-MPCs subpopulations, proteins differentially expressed in SS-AF-MPCs and RS-AF-MPCs were identified by 2D-gel electrophoreses and MS. Total protein extracts of three different SS-AF-MPCs and RS-AF-MPCs preparations were analysed in duplicate by 2DE in 4–7 pH gradient strips. The derived pattern of resolved protein spots for each cell type was highly consistent and a comparison of the expression levels of the respective proteins was established using PDQuest 8 software (Fig. 7A and B). Protein spots that were found to be more than 1.5 times fold differentially expressed and at statistically significant levels (P < 0.05 according to Student’s t-test and/or Mann-Whitney test) in the two subpopulations, are described in detail in Tables S1 and S2. Specifically, proteins up-regulated in SS-AF-MPCs compared to RS-AF-MPCs included reticulocalbin-3 precursor, collagen α1 (I) chain precursor, FK506-binding protein 9 precursor, Rho GDP-dissociation inhibitor 1, chloride intracellular channel protein 4, tryptophanyl-tRNA synthetase and heat shock proteins 1 70 kD and β1. On the other hand, proteins such as peroxiredoxin-2, 60 kD heat shock protein, glutathione S-transferase P and annexin A4, were up-regulated in RS-AF-MPCs. Proteins identified only in RS-AF-MPCs included cytokeratin 8, 18 and 19, cathepsin B, coactosin-like protein and integrin α-V protein (Table S3).
Fig 7.
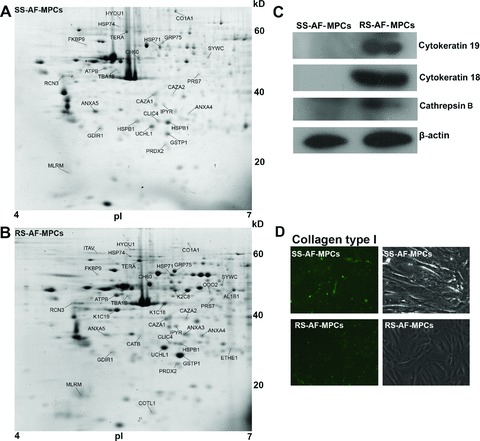
Two-dimensional gel electrophoretic analysis of AF-MPCs. (A) Representative 2D-gel electrophoresis image of proteins extracted from SS-AF-MPCs and (B) RS-AF-MPCs. The differentially and unique expressed protein spots in each population are indicated with their abbreviated names and listed in Tables S1–3, respectively. (C) Confirmation of the cytoskeratin 19 and 18 and cathepsin B expression by Western blot analysis with the respective antibodies in cell extracts from SS-AF-MPCs (lanes 1) and RS-AF-MPCs (lanes 2). Protein bands of 40, 54 and 38 kD corresponding to cytoskeratin 19 and 18 and cathepsin B heavy chain were detected. Immunoblotting for b-actin has been conducted to ensure the comparable loading of proteins in each lane. (D) Confirmation of the higher expression of collagen α1 (I) protein in SS-AF-MPCs compared to RS-AF-MPCs by immunofluorescent staining.
Among the proteins overexpressed in SS-AF-MPCs, collagen α1 (I), a major extracellular matrix molecule responsible for directing the fate of MSCs into osteogenic lineages [36], was the most abundant. This finding may in turn explain the enhanced differentiation potential of SS-AF-MPCs to osteoblastic lineages, as observed in our in vitro studies. Proteins facilitating cell migration, such as Rho GDP-dissociation inhibitor 1 [37] and tryptophanyl-tRNA synthetase [38] are expressed in higher levels in SS-AF-MPCs, reflecting their enhanced motility in vitro. On the other hand, the high proliferation rate of SS-AF-MPCs might be explained by the presence of proteins such as chloride intracellular channel protein 4, found to promote endothelial cell proliferation and cell survival [39]. Similarly, heat shock protein β1, exhibiting an anti-apoptotic role by former studies, was also highly expressed in SS-AF-MPCs [40, 41].
Confirmation of the differentially expressed proteins CK18, CK19, cathepsin B and collagen α1 (I)
RS-AF-MPCs exhibited a more complicated protein profile compared to SS-AF-MPCs, including 10 uniquely expressed proteins, supporting the indication of an earlier developmental stage of the SS population. To verify the 2DE results and confirm the differential expression, cytokeratin 18, cytokeratin 19 and cathepsin B were further analysed by Western blotting. It was demonstrated that bands of 40, 54 and 28 kD, corresponding to CK19, CK18 and cathepsin B, respectively were only detected in RS-AF-MPCs (Fig. 7C). Furthermore, collagen α1 (I) was expressed in higher levels in SS-AF-MPCs than in RS-AF-MPCs again in agreement to the 2DE results (Fig. 7D).
Lentivirus-mediated gene transfer of AF-MPCs
Taking under consideration the successful, easy and rapid expansion of SS-AF-MPCs in culture, as well as the high passage they reach compared to RS-AF-MPCs, we further investigated whether they can be efficiently transduced with lentiviral vectors for further potential use in in vivo therapeutic applications. For this reason, SS-AF-MPCs were transduced with GFP third generation lentivirus [28]. The experimental procedure was focused on three parameters: first, the efficiency of same passage SS-AF-MPCs transduction by a virus dose-depended manner; secondly, the efficiency of GFP expression in different passages and thirdly, the long-term maintenance of GFP expression in culture. An increase in fluorescence of GFP positive SS-AF-MPCs was shown, when the cells, at passage 16, were transduced with rising doses of virus, MOI from 10 to 100, as determined by FACS analysis four days post-transduction
(Fig. 8A and B). The transduction with an MOI of 60 led to a 98–100% efficiency of infection. A very small percentage of cells were positive for Annexin V staining only in virus dosages higher than MOI 60 (Fig. 8C). The expression levels of mesenchymal markers (CD90, CD105 and CD73) in SS-AF-MPCs remained the same after transduction (data not shown).
Fig 8.
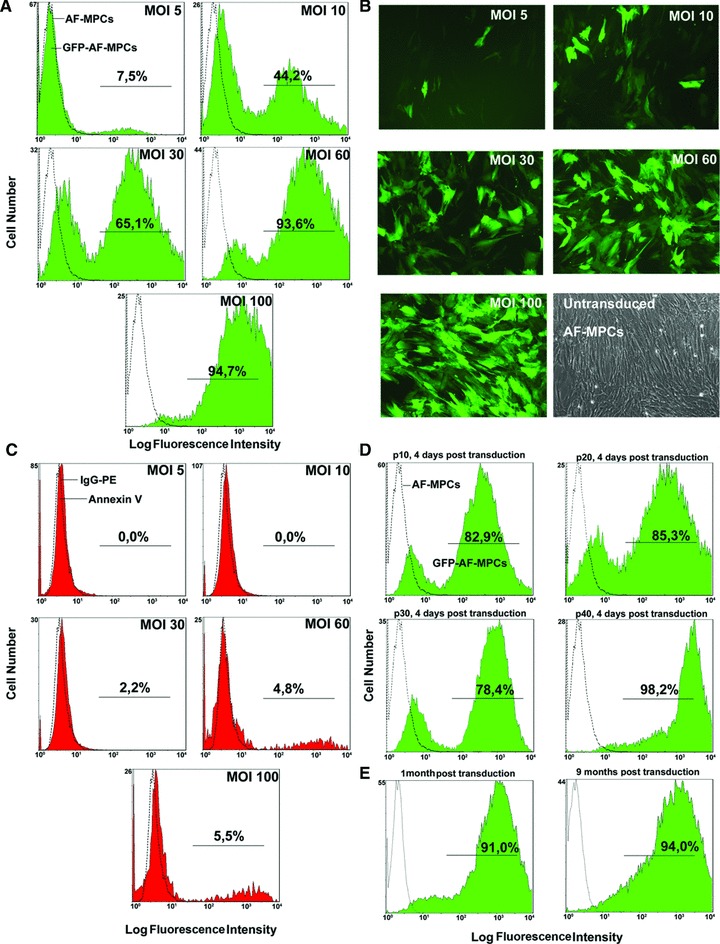
Transduction of SS-AF-MPCs with the pCCLsin.PPT.hPGK.GFP lentiviral system. (A) Flow cytometric analysis, (B) microscopic evaluation (20×) and (C) evaluation of apoptosis by Annexin V staining by FACS analysis of SS-AF-MPCs at MOI 5–100 and passage 16 (D) GFP efficiency of SS-AF-MPCs determined 4 days post-transduction at passages 10, 20, 30 and 40 by FACS analysis of MOI 60. (E) Stability of GFP expression 1 and 9 months post-transduction by FACS analysis at MOI 60.
Furthermore, we performed a different passage expression analysis using SS-AF-MPCs of passages 10–40, transduced with an MOI of 60 (Fig. 8D). Interestingly enough, the passage did not affect the expression of GFP. In addition, the expression of GFP was maintained at the same high levels 4 weeks and 9 months post-transduction (Fig. 8E). By series of freezing and thawing cycles we observed that the expression of GFP remained constant. In addition, GFP-SS-AF-MPCs (MOI 60) exhibited high proliferation capacity (Fig. S1B) and were still capable to differentiate into adipogenic, osteogenic and hepatogenic lineages in vitro, as shown in Figure S1C.
In vivo engraftment of left ventricular transduced SS-AF-MPCs
The high proliferation rate of SS-AF-MPCs and the fact that they exhibit normal karyotype at high passages, allowed the use of these cells in vivo. RS-AF-MPCs were not efficient in number to be used in in vivo experiments.
Thus, we further investigated the in vivo survival, migration and engraftment of GFP-SS-AF-MPCs in non-damaged immunosupressed mice. GFP-SS-AF-MPCs were i.v. injected into NOD/SCID mice and then analyses involving FACS, immunohistochemistry and RT-PCR for the WPRE gene were used, to follow the distribution of donor cells 4 and 10 days post-injection at different tissues (Fig. 9). For immunohistochemistry anti-human CD90 antibody, which does not cross-react with mouse MSCs and tissue (Fig. S1D) was also used. We were able to detect GFP-SS-AF-MPCs at liver, spleen, lung, gut and kidney at these time points. However, similarly to previous studies with MSCs [42], we could not detect SS-AF-MPCs in the BM as confirmed by FACS analysis (data not shown). No tumours were detected even after 3 months post-SS-AF-MPCs transplantation in NOD/SCID animals, which may indicate non-tumorigenic properties of these cells.
Fig 9.
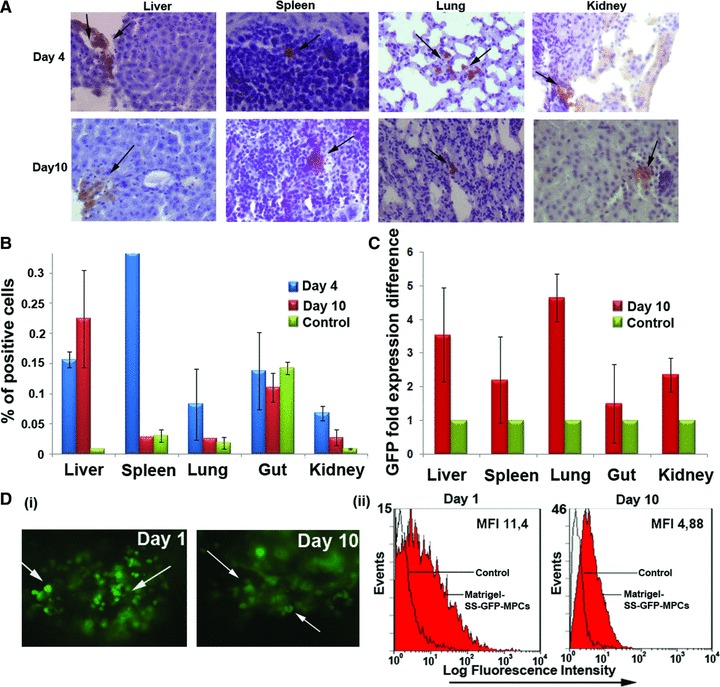
In vivo engraftment of GFP transduced SS-AF-MPCs. (A) GFP-SS-AF-MPCs were trapped in different tissues as evaluated by immunohistochemistry, 4 and 10 days after transplantation. GFP-SS-AF-MPCs were found in liver, spleen, lung and kidney at low frequency. Immunohistochemistry was performed by using anti-GFP antibody. Quantitation of GFP cells was determined by (B) FACS analysis and (C) RT-PCR in the respective tissues 4 or 10 days post-injection where percentage of positive cells and GFP fold expression difference is presented, respectively. As negative controls, non-injected mice were used. Values are shown as mean ± S.D. for four mice in each group. (D) (i) Representative post-mortem fluorescent microscopy image of SS-AF-MPCs within the matrigel revealed a robust engraftment. (ii) FACS analysis of the disassociated matrigel area in presence of GFP transduced SS-AF-MPCs (red filled histogram) or GFP transduced SS-AF-MPCs in PBS (open histogram) 1 and 10 days post-transplantation.
Furthermore, we tested the viability of SS-AF-MPCs supported by matrigel and transplanted subcutaneously into the tail bases of NOD/SCID mice. It was demonstrated by fluorescent microscopy and FACS analyses that matrigel succeeded in supporting SS-AF-MPCs engraftment for at least 10 days without losing the GFP expression (Fig. 9D). This finding proved that extracellular components provided by matrigel were needed to improve SS-AF-MPCs survival and engraftment in vivo.
Discussion
Recent interest is focused on AF as a valuable source of MPCs [7–9, 11, 12]. Culture of AF-MPCs, as previously reported from our group and others, yielded in an adherent heterogenic cell population with diverse morphology [7, 8, 11]. The expression analysis, determined by FACS analysis, documented the presence of CD44, CD90, CD73 and CD105 and the absence of haematopoietic-related CD-antigens [7, 8, 11], resembling to the phenotype of MSC-like cells according to standard criteria [43].
In our previous studies, we successfully isolated and expanded karyotypically normal MSCs from 80 samples of second trimester AF and performed a systematic phenotypic, molecular and proteomic analysis [7]. The main characteristic of the AF-MSCs was the high number of isolated cells and their rapid expansion in vitro compared to BM-MSCs. More importantly, these cells when exposed to appropriate differentiation media in vitro, showed a multilineage differentiation potential and ability to overcome the mesodermal commitment, by differentiating into cell types derived from all three germ layers [7].
In this study, we focused on the detailed investigation of different populations of AF-MPCs. We initially observed that unselected cultures contained, at passage 0–1, two morphologically distinct populations, SS-AF-MPCs and RS-AF-MPCs, whereas at passage 2–3 the RS cells were more abundant in 94% of the samples. The rest 6% of the samples represented a SS cell population that can be expanded up to 40–50 passages to date. In an attempt to characterize better these two subpopulations, we randomly chose six AF samples at passage 0, where a mixture of both cell types existed at almost equal frequency. Then, we mechanically isolated SS or RS colonies and successfully expanded them under the same culture conditions.
Although cultures of MPCs have been studied extensively the last decades, standard criteria for isolating and expanding these cells have not been developed [4]. Several protocols have been established for isolating human MPCs from different sources by using staining with different antibodies [3, 4, 6–9, 11, 13, 16, 44]. Other groups have reported that the existence of morphologically distinct MPC subpopulations is related to the plating density of the sample [1, 4, 44]. However, in this study, we observed the presence of both RS-AF-MPCs and SS-AF-MPCs at passage 0 despite the initial plating density.
A detailed examination of the phenotype of SS-AF-MPCs and RS-AF-MPCs showed that SS-AF-MPCs expressed higher levels of CD90. However, the unselected AF-MPCs cultures at passage 0–1 exhibited a mixed expression of CD90 revealing the initial co-existence of both SS and RS cells. This observation was consistent with older reports on murine lung fibroblasts and UCB-MPCs, in which two morphologically different populations were identified, one SS and CD90 positive, and the other one RS and CD90 negative. Furthermore, it has been shown that CD90 expression affected the morphology, proliferation and differentiation of fibroblasts [45]. RS-AF-MPCs shared similar morphological characteristics to human amniotic membrane epithelial cells (hAEC), which express stem cell markers and have the ability to differentiate to multiple cell lineages [46]. However, hAEC differentiate successfully to hepatocytes and exhibit increased expression of CD90 after second passage in culture, in contrast to RS-AF-MPCs [46]. In addition, SS-AF-MPCs shared the rapid expansion and the multi-lineage differentiation potential of human umbilical cord perivascular cells (HUCPVCs), whereas they exhibited low expression of CD146, a marker characteristic for circulating endothelial cells [47].
We further decided to study in more detail the molecular identity and specific properties of the SS-AF-MPC population. We observed that CD90 expression was decreased when the proliferation rate of SS-AF-MPCs was reduced because of temperature change. These results showed that CD90 antigen expression could be related to the growth rate of AF-MPCs and may in turn explain the difference of proliferation between SS-AF-MPCs (CD90high) and RS-AF-MPCs (CD90low) subpopulations. However, temperature change may also affect other biological parameters and for this reason further investigation is needed to explore the signaling pathway that is possibly related to this observation.
Furthermore, despite the similar stem cell features of SS-AF-MPCs and RS-AF-MPCs, the first ones possess a significantly higher migration capacity, compared to RS-AF-MPCs. This finding provided a basis for a more extended investigation of the migration mechanism of SS-AF-MPCs, involving a variety of adhesion molecules such as VLA-4, VLA-5, CD29 or CD44 [48]. For example, blocking studies by using CD44 neutralizing antibody showed impaired migration properties of SS-AF-MPCs on fibronectin.
SS-AF-MPCs and RS-AF-MPCs expressed the pluripotency markers Oct-4 and Sox-2, indicating a possible primitive phenotype and stem cell potential of these cells. Similar findings by Guillot et al. [7, 49] for MSCs isolated from first-trimester foetal blood, liver and BM confirmed that MSCs derived from neonatal and mid-gestational foetal tissues also expressed pluripotency markers, such as Oct-4 and Sox-2. In parallel, comparative studies by Greco et al. [50], showed that MSCs and embryonic stem cells (ESCs) shared similar expression of the embryonic transcription factors Oct-4, Sox-2 and Nanog, both at RNA and protein levels.
In addition, by the use of proteomic analysis, 25 proteins were found differentially expressed among the two subpopulations, which might explain the discrepancy in their proliferation, migration and differentiation properties. The differentially expressed proteins between SS-AF-MPCs and RS-AF-MPCs did not include any of the proteins highly expressed in MSCs from various sources such as Vimentin, Galectin, Gelsolin and Prohibitin [7, 47].
Our data indicated for the first time that SS-AF-MPCs are highly susceptible to lentiviral transduction, with no silencing effects over the multiple culture passaging. Moreover, GFP expression was retained through in vitro differentiation of SS-AF-MPCs, indicating the prospective utilization of this type of MPCs in gene therapy applications. Previous studies showed that human AF stem cells, seeded in a scaffold and exposed to osteogenic-inducing medium, can form bone in vivo [9]. However, up to date there have been no conclusive reports demonstrating the in vivo contribution of AF-MPCs upon intravenous delivery without tissue damage of the recipient animals. Here, we report that the SS-AF-MPCs can home into several tissues, at low frequency, after systemic infusion into recipient animals and can be tracked in lung, liver or spleen after several days. More importantly, we have demonstrated that matrigel supported SS-AF-MPCs engraftment is superior to cells alone. This can be explained by the specific properties of the matrigel basement, providing growth factors and structural support to the cells [6, 45, 51–53].
Therefore, we succeeded in mechanically isolating and expanding two mesenchymal origin populations of AF (SS-AF-MPCs and RS-AF-MPCs) that co-exist at early passage. SS-AF-MPCs are characterized by higher CD90 antigen expression than RS-AF-MPCs. The ease with which SS-AF-MPCs can be expanded in culture represents a marked contrast to the difficulties that have been encountered in expanding MPCs derived from sources such as BM, AF or UCB [6, 7, 9, 11, 31]. The specific properties of SS-AF-MPCs related to migration ability, differentiation capacity, lentiviral transduction efficiency and long-term survival in vivo will be of great importance in their use for cell and gene therapy. Under the conditions developed in this study, from a 10 ml AF sample we can mechanically isolate SS-AF-MPCs colonies that can generate millions of cells in culture in a short period of time, enough for future clinical applications.
Acknowledgments
This research was supported by Grant PENED No. 03ED 652 from the Greek Secretariat of Research and Technology and the European Union to N.P.A. Partial support was provided by Iaso Hospital, Athens, Greece. We would like to thank Professor Luigi Naldini for the generous donation of the pCCLsin.PPT.hPGK.GFP plasmid, Drs G. Vassilopoulos and E Siapati for kindly providing us with NOD/SCID mice and Dr PK Politis for donation of a number of antibodies. We would like also to thank K. Vougas for his help on the proteomic analysis. Finally, we would like to thank Professor Thalia Papayannopoulou for her scientific advices and critical review of the paper.
Conflict of interest
The authors confirm that there are no conflicts of interest.
Supporting Information
Immunofluorecent nuclear staining forE-cadherin, N-cadherin and Vimentin proteins merged with DAPIstaining of SS- and RS- AF-MPCs. Original magnifications,40×. (B) Comparative analysis of the percentage ofproliferation of SS-AF-MPCs (blue line) and GFP-SS-AF-MPCs (redline) during 7 days of culture. (C) GFP transducedSS-AF-MPCs differentiation to adipocyte, osteocytes andhepatocytes. (D) Representative FACS histograms ofSS-AF-MPCs (black filled histograms) and mouse BM-MSCs (grey filledhistograms) gated for CD90, prior to analysis with theisotype-matched negative controls (blue and red open histograms),respectively. (E) Normal karyotype of (i) SS-AF-MPCs and(ii) RS-AF-MPCs from two representative samples derived from male[46XY(20)] and female embryo[46XX(20)], respectively at passage 5. (iii)Normal karyotype of SS-AF-MPCs from 1 representative sample derivedfrom female embryo [46XX(20)], at passage 32.Forty metaphase spreads were fully analysed and karyotyped in eachcase.
Proteins up-regulated in SS-AF-MPCs
Table S2 Proteins up-regulated in RS-AF-MPCs
Table S3 Proteins expressed in RS-AF-MPCs only
References
- 1.Smith JR, Pochampally R, Perry A, et al. Isolation of a highly clonogenic and multipotential subfraction of adult stem cells from bone marrow stroma. Stem Cells. 2004;22:823–31. doi: 10.1634/stemcells.22-5-823. [DOI] [PubMed] [Google Scholar]
- 2.Sekiya I, Larson BL, Smith JR, et al. Expansion of human adult stem cells from bone marrow stroma: conditions that maximize the yields of early progenitors and evaluate their quality. Stem Cells. 2002;20:530–41. doi: 10.1634/stemcells.20-6-530. [DOI] [PubMed] [Google Scholar]
- 3.Prockop DJ, Sekiya I, Colter DC. Isolation and characterization of rapidly self-renewing stem cells from cultures of human marrow stromal cells. Cytotherapy. 2001;3:393–6. doi: 10.1080/146532401753277229. [DOI] [PubMed] [Google Scholar]
- 4.Colter DC, Sekiya I, Prockop DJ. Identification of a subpopulation of rapidly self-renewing and multipotential adult stem cells in colonies of human marrow stromal cells. Proc Natl Acad Sci U S A. 2001;98:7841–5. doi: 10.1073/pnas.141221698. [DOI] [PMC free article] [PubMed] [Google Scholar]
- 5.Lee RH, Hsu SC, Munoz J, et al. A subset of human rapidly self-renewing marrow stromal cells preferentially engraft in mice. Blood. 2006;107:2153–61. doi: 10.1182/blood-2005-07-2701. [DOI] [PubMed] [Google Scholar]
- 6.Chang YJ, Tseng CP, Hsu LF, et al. Characterization of two populations of mesenchymal progenitor cells in umbilical cord blood. Cell Biol Int. 2006;30:495–9. doi: 10.1016/j.cellbi.2005.12.009. [DOI] [PubMed] [Google Scholar]
- 7.Roubelakis MG, Pappa KI, Bitsika V, et al. Molecular and proteomic characterization of human mesenchymal stem cells derived from amniotic fluid: comparison to bone marrow mesenchymal stem cells. Stem Cells Dev. 2007;16:931–52. doi: 10.1089/scd.2007.0036. [DOI] [PubMed] [Google Scholar]
- 8.In ‘t Anker PS, Noort WA, Scherjon SA, et al. Mesenchymal stem cells in human second-trimester bone marrow, liver, lung, and spleen exhibit a similar immunophenotype but a heterogeneous multilineage differentiation potential. Haematologica. 2003;88:845–52. [PubMed] [Google Scholar]
- 9.De Coppi P, Bartsch G, Jr, Siddiqui MM, et al. Isolation of amniotic stem cell lines with potential for therapy. Nat Biotechnol. 2007;25:100–6. doi: 10.1038/nbt1274. [DOI] [PubMed] [Google Scholar]
- 10.In ‘t Anker PS, Scherjon SA, Kleijburg-van der Keur C, et al. Amniotic fluid as a novel source of mesenchymal stem cells for therapeutic transplantation. Blood. 2003;102:1548–9. doi: 10.1182/blood-2003-04-1291. [DOI] [PubMed] [Google Scholar]
- 11.Tsai MS, Lee JL, Chang YJ, et al. Isolation of human multipotent mesenchymal stem cells from second-trimester amniotic fluid using a novel two-stage culture protocol. Hum Reprod. 2004;19:1450–6. doi: 10.1093/humrep/deh279. [DOI] [PubMed] [Google Scholar]
- 12.Tsai MS, Hwang SM, Tsai YL, et al. Clonal amniotic fluid-derived stem cells express characteristics of both mesenchymal and neural stem cells. Biol Reprod. 2006;74:545–51. doi: 10.1095/biolreprod.105.046029. [DOI] [PubMed] [Google Scholar]
- 13.Prusa AR, Hengstschlager M. Amniotic fluid cells and human stem cell research: a new connection. Med Sci Monit. 2002;8:RA253–7. [PubMed] [Google Scholar]
- 14.Hoehn H, Salk D. Morphological and biochemical heterogeneity of amniotic fluid cells in culture. Methods Cell Biol. 1982;26:11–34. doi: 10.1016/s0091-679x(08)61362-x. [DOI] [PubMed] [Google Scholar]
- 15.Gosden CM. Amniotic fluid cell types and culture. Br Med Bull. 1983;39:348–54. doi: 10.1093/oxfordjournals.bmb.a071847. [DOI] [PubMed] [Google Scholar]
- 16.Fauza D. Amniotic fluid and placental stem cells. Best Pract Res Clin Obstet Gynaecol. 2004;18:877–91. doi: 10.1016/j.bpobgyn.2004.07.001. [DOI] [PubMed] [Google Scholar]
- 17.Meirelles Lda S, Nardi NB. Murine marrow-derived mesenchymal stem cell: isolation, in vitro expansion, and characterization. Br J Haematol. 2003;123:702–11. doi: 10.1046/j.1365-2141.2003.04669.x. [DOI] [PubMed] [Google Scholar]
- 18.Zhu H, Mitsuhashi N, Klein A, et al. The role of the hyaluronan receptor CD44 in mesenchymal stem cell migration in the extracellular matrix. Stem Cells. 2006;24:928–35. doi: 10.1634/stemcells.2005-0186. [DOI] [PubMed] [Google Scholar]
- 19.Yang MC, Chi NH, Chou NK, et al. The influence of rat mesenchymal stem cell CD44 surface markers on cell growth, fibronectin expression, and cardiomyogenic differentiation on silk fibroin – Hyaluronic acid cardiac patches. Biomaterials. 2009;31:854–62. doi: 10.1016/j.biomaterials.2009.09.096. [DOI] [PubMed] [Google Scholar]
- 20.Grisafi D, Piccoli M, Pozzobon M, et al. High transduction efficiency of human amniotic fluid stem cells mediated by adenovirus vectors. Stem Cells Dev. 2008;17:953–62. doi: 10.1089/scd.2007.0188. [DOI] [PubMed] [Google Scholar]
- 21.Boker W, Yin Z, Drosse I, et al. Introducing a single-cell-derived human mesenchymal stem cell line expressing hTERT after lentiviral gene transfer. J Cell Mol Med. 2008;12:1347–59. doi: 10.1111/j.1582-4934.2008.00299.x. [DOI] [PMC free article] [PubMed] [Google Scholar]
- 22.Meyerrose TE, Roberts M, Ohlemiller KK, et al. Lentiviral-transduced human mesenchymal stem cells persistently express therapeutic levels of enzyme in a xenotransplantation model of human disease. Stem Cells. 2008;26:1713–22. doi: 10.1634/stemcells.2008-0008. [DOI] [PMC free article] [PubMed] [Google Scholar]
- 23.Piersanti S, Sacchetti B, Funari A, et al. Lentiviral transduction of human postnatal skeletal (stromal, mesenchymal) stem cells: in vivo transplantation and gene silencing. Calcif Tissue Int. 2006;78:372–84. doi: 10.1007/s00223-006-0001-y. [DOI] [PubMed] [Google Scholar]
- 24.Leschot NJ, Verjaal M, Treffers PE. Risks of midtrimester amniocentesis; assessment in 3000 pregnancies. Br J Obstet Gynaecol. 1985;92:804–7. doi: 10.1111/j.1471-0528.1985.tb03049.x. [DOI] [PubMed] [Google Scholar]
- 25.Eddleman KA, Malone FD, Sullivan L, et al. Pregnancy loss rates after midtrimester amniocentesis. Obstet Gynecol. 2006;108:1067–72. doi: 10.1097/01.AOG.0000240135.13594.07. [DOI] [PubMed] [Google Scholar]
- 26.Buhring HJ, Battula VL, Treml S, et al. Novel markers for the prospective isolation of human MSC. Ann N Y Acad Sci. 2007;1106:262–71. doi: 10.1196/annals.1392.000. [DOI] [PubMed] [Google Scholar]
- 27.Zannettino AC, Roubelakis M, Welldon KJ, et al. Novel mesenchymal and haematopoietic cell isoforms of the SHP-2 docking receptor, PZR: identification, molecular cloning and effects on cell migration. Biochem J. 2003;370:537–49. doi: 10.1042/BJ20020935. [DOI] [PMC free article] [PubMed] [Google Scholar]
- 28.Dull T, Zufferey R, Kelly M, et al. A third-generation lentivirus vector with a conditional packaging system. J Virol. 1998;72:8463–71. doi: 10.1128/jvi.72.11.8463-8471.1998. [DOI] [PMC free article] [PubMed] [Google Scholar]
- 29.Siapati EK, Bigger BW, Miskin J, et al. Comparison of HIV- and EIAV-based vectors on their efficiency in transducing murine and human hematopoietic repopulating cells. Mol Ther. 2005;12:537–46. doi: 10.1016/j.ymthe.2005.01.022. [DOI] [PubMed] [Google Scholar]
- 30.Goodwin HS, Bicknese AR, Chien SN, et al. Multilineage differentiation activity by cells isolated from umbilical cord blood: expression of bone, fat, and neural markers. Biol Blood Marrow Transplant. 2001;7:581–8. doi: 10.1053/bbmt.2001.v7.pm11760145. [DOI] [PubMed] [Google Scholar]
- 31.Pittenger MF, Mackay AM, Beck SC, et al. Multilineage potential of adult human mesenchymal stem cells. Science. 1999;284:143–7. doi: 10.1126/science.284.5411.143. [DOI] [PubMed] [Google Scholar]
- 32.Jensen PK, Therkelsen AJ. Cultivation at low temperature as a measure to prevent contamination with fibroblasts in epithelial cultures from human skin. J Invest Dermatol. 1981;77:210–2. doi: 10.1111/1523-1747.ep12479920. [DOI] [PubMed] [Google Scholar]
- 33.Maier KG, Sadowitz B, Cullen S, et al. Thrombospondin-1-induced vascular smooth muscle cell migration is dependent on the hyaluronic acid receptor CD44. Am J Surg. 2009;198:664–9. doi: 10.1016/j.amjsurg.2009.07.018. [DOI] [PubMed] [Google Scholar]
- 34.Niwa H, Miyazaki J, Smith AG. Quantitative expression of Oct-3/4 defines differentiation, dedifferentiation or self-renewal of ES cells. Nat Genet. 2000;24:372–6. doi: 10.1038/74199. [DOI] [PubMed] [Google Scholar]
- 35.Trosko JE. From adult stem cells to cancer stem cells: Oct-4 Gene, cell-cell communication, and hormones during tumor promotion. Ann N Y Acad Sci. 2006;1089:36–58. doi: 10.1196/annals.1386.018. [DOI] [PubMed] [Google Scholar]
- 36.Huang CH, Chen MH, Young TH, et al. Interactive effects of mechanical stretching and extracellular matrix proteins on initiating osteogenic differentiation of human mesenchymal stem cells. J Cell Biochem. 2009;108:1263–73. doi: 10.1002/jcb.22356. [DOI] [PubMed] [Google Scholar]
- 37.Abramovici H, Mojtabaie P, Parks RJ, et al. Diacylglycerol kinase zeta regulates actin cytoskeleton reorganization through dissociation of Rac1 from RhoGDI. Mol Biol Cell. 2009;20:2049–59. doi: 10.1091/mbc.E07-12-1248. [DOI] [PMC free article] [PubMed] [Google Scholar]
- 38.Ivakhno SS, Kornelyuk AI. Cytokine-like activities of some aminoacyl-tRNA synthetases and auxiliary p43 cofactor of aminoacylation reaction and their role in oncogenesis. Exp Oncol. 2004;26:250–5. [PubMed] [Google Scholar]
- 39.Tung JJ, Hobert O, Berryman M, et al. Chloride intracellular channel 4 is involved in endothelial proliferation and morphogenesis in vitro. Angiogenesis. 2009;12:209–20. doi: 10.1007/s10456-009-9139-3. [DOI] [PMC free article] [PubMed] [Google Scholar]
- 40.Davidson SM, Morange M. Hsp25 and the p38 MAPK pathway are involved in differentiation of cardiomyocytes. Dev Biol. 2000;218:146–60. doi: 10.1006/dbio.1999.9596. [DOI] [PubMed] [Google Scholar]
- 41.Park SH, Cho HN, Lee SJ, et al. Hsp25-induced radioresistance is associated with reduction of death by apoptosis: involvement of Bcl2 and the cell cycle. Radiat Res. 2000;154:421–8. doi: 10.1667/0033-7587(2000)154[0421:hiriaw]2.0.co;2. [DOI] [PubMed] [Google Scholar]
- 42.Anjos-Afonso F, Siapati EK, Bonnet D. In vivo contribution of murine mesenchymal stem cells into multiple cell-types under minimal damage conditions. J Cell Sci. 2004;117:5655–64. doi: 10.1242/jcs.01488. [DOI] [PubMed] [Google Scholar]
- 43.Dominici M, Le Blanc K, Mueller I, et al. Minimal criteria for defining multipotent mesenchymal stromal cells. The International Society for Cellular Therapy position statement. Cytotherapy. 2006;8:315–7. doi: 10.1080/14653240600855905. [DOI] [PubMed] [Google Scholar]
- 44.Colter DC, Class R, DiGirolamo CM, et al. Rapid expansion of recycling stem cells in cultures of plastic-adherent cells from human bone marrow. Proc Natl Acad Sci U S A. 2000;97:3213–8. doi: 10.1073/pnas.070034097. [DOI] [PMC free article] [PubMed] [Google Scholar]
- 45.Rege TA, Hagood JS. Thy-1 as a regulator of cell-cell and cell-matrix interactions in axon regeneration, apoptosis, adhesion, migration, cancer, and fibrosis. FASEB J. 2006;20:1045–54. doi: 10.1096/fj.05-5460rev. [DOI] [PubMed] [Google Scholar]
- 46.Parolini O, Alviano F, Bagnara GP, et al. Concise review: isolation and characterization of cells from human term placenta: outcome of the first international Workshop on Placenta Derived Stem Cells. Stem Cells. 2008;26:300–11. doi: 10.1634/stemcells.2007-0594. [DOI] [PubMed] [Google Scholar]
- 47.Sarugaser R, Lickorish D, Baksh D, et al. Human umbilical cord perivascular (HUCPV) cells: a source of mesenchymal progenitors. Stem Cells. 2005;23:220–9. doi: 10.1634/stemcells.2004-0166. [DOI] [PubMed] [Google Scholar]
- 48.Mostafavi-Pour Z, Askari JA, Parkinson SJ, et al. Integrin-specific signaling pathways controlling focal adhesion formation and cell migration. J Cell Biol. 2003;161:155–67. doi: 10.1083/jcb.200210176. [DOI] [PMC free article] [PubMed] [Google Scholar]
- 49.Guillot PV, Gotherstrom C, Chan J, et al. Human first-trimester fetal MSC express pluripotency markers and grow faster and have longer telomeres than adult MSC. Stem Cells. 2007;25:646–54. doi: 10.1634/stemcells.2006-0208. [DOI] [PubMed] [Google Scholar]
- 50.Greco SJ, Liu K, Rameshwar P. Functional similarities among genes regulated by OCT4 in human mesenchymal and embryonic stem cells. Stem Cells. 2007;25:3143–54. doi: 10.1634/stemcells.2007-0351. [DOI] [PubMed] [Google Scholar]
- 51.Bieback K, Kern S, Kluter H, et al. Critical parameters for the isolation of mesenchymal stem cells from umbilical cord blood. Stem Cells. 2004;22:625–34. doi: 10.1634/stemcells.22-4-625. [DOI] [PubMed] [Google Scholar]
- 52.Erices A, Conget P, Minguell JJ. Mesenchymal progenitor cells in human umbilical cord blood. Br J Haematol. 2000;109:235–42. doi: 10.1046/j.1365-2141.2000.01986.x. [DOI] [PubMed] [Google Scholar]
- 53.Phipps RP, Penney DP, Keng P, et al. Characterization of two major populations of lung fibroblasts: distinguishing morphology and discordant display of Thy 1 and class II MHC. Am J Respir Cell Mol Biol. 1989;1:65–74. doi: 10.1165/ajrcmb/1.1.65. [DOI] [PubMed] [Google Scholar]
Associated Data
This section collects any data citations, data availability statements, or supplementary materials included in this article.
Supplementary Materials
Immunofluorecent nuclear staining forE-cadherin, N-cadherin and Vimentin proteins merged with DAPIstaining of SS- and RS- AF-MPCs. Original magnifications,40×. (B) Comparative analysis of the percentage ofproliferation of SS-AF-MPCs (blue line) and GFP-SS-AF-MPCs (redline) during 7 days of culture. (C) GFP transducedSS-AF-MPCs differentiation to adipocyte, osteocytes andhepatocytes. (D) Representative FACS histograms ofSS-AF-MPCs (black filled histograms) and mouse BM-MSCs (grey filledhistograms) gated for CD90, prior to analysis with theisotype-matched negative controls (blue and red open histograms),respectively. (E) Normal karyotype of (i) SS-AF-MPCs and(ii) RS-AF-MPCs from two representative samples derived from male[46XY(20)] and female embryo[46XX(20)], respectively at passage 5. (iii)Normal karyotype of SS-AF-MPCs from 1 representative sample derivedfrom female embryo [46XX(20)], at passage 32.Forty metaphase spreads were fully analysed and karyotyped in eachcase.
Proteins up-regulated in SS-AF-MPCs
Table S2 Proteins up-regulated in RS-AF-MPCs
Table S3 Proteins expressed in RS-AF-MPCs only