

Abstract
Alzheimer's disease (AD) is a complex disease, with no definitive biomarkers available that allow clinical diagnosis; this represents a major problem for the advance of efficient drug discovery programs. A successful approach towards the understanding and treatment of AD should take into consideration this complex nature. In this sense, metabolic networks are subject to severe stoichiometric restrictions. Metabolomics amplifies changes both in the proteome and the genome, and represents a more accurate approximation to the phenotype of an organism in health and disease. In this article, we will examine the current rationale for metabolomics in AD, its basic methodology and the available data in animal models and human studies. The discussed topics will highlight the importance of being able to use the metabolomic information in order to understand disease mechanisms from a systems biology perspective as a non-invasive approach to diagnose and grade AD. This could allow the assessment of new therapies during clinical trials, the identification of patients at risk to develop adverse effects during treatment and the final implementation of new tools towards a more personalized medicine.
Keywords: Alzheimer's Disease, metabolomics, metabonomics, 1H-NMR, pattern recognition, systems biology, neurodegenerative disease, biomarkers
Introduction
Alzheimer's disease (AD) is characterized by adult-onset progressive dementia associated with cerebral cortical atrophy, β-amy-loid plaque formation and intraneuronal neurofibrillary tangles [1, 2]. About 75% of AD cases are classified as sporadic, which means they occur in people with no history of the condition in their family. All sporadic AD begins after age 65, and the risk of developing this condition increases as a person gets older. Although AD usually appears in people older than age 65, less common forms of the disease appear earlier in adulthood and are familial [3]. Familial AD can be divided into early-onset disease (symptoms begin before age 65) and late-onset disease (symptoms begin after age 65). The different early-onset AD subtypes are clinically indistinguishable and can be classified on the basis of underlying genetic mechanisms as: AD type 1, 3 and 4 [3]. The human mutations associated with familial AD are strongly correlated to dysfunctional metabolism of β-amyloid precursor protein (APP) in the brain of affected individuals to produce an accumulation of amyloid-β peptide (Aβ peptide) and soluble amyloid precursor protein (sAPP) leading to the formation of amyloid plaques. Thus, amyloid-β (A4) precursor protein (APP) gene mutations cause type 1 AD (10–15% of all early-onset familial AD cases) while mutations in two processing APP genes, called pre-senilin 1 and 2, account for type 3 AD (70% of all early-onset AD) and for type 4 (5% of all early-onset AD), respectively. Type 2 is classified as late-onset familial AD. Although the cause of these cases is unknown, genetic changes are likely to play a role [3]. In this sense, there are hints of a genetic association of type 2 AD with polymorphisms in the ɛ4 allele, of the apoliprotein E gene (ApoE), linking Aβ accumulation and deposition with the function of very low-density lipoproteins (VLDLs) [4–7]. For ApoE-ɛ4, odds ratios were 11.8 and 21.8 for Caucasian and Asian population-based data on systematic meta-analysis of genetic association studies [8]. This ‘late-onset familial’ classification is to some extent arbitrary. Thus, late-onset (or sporadic) form may also include cases with a family history of AD that are not related to known genetic origins. It is clear that lifestyles and other conditions including neuroimmune alterations or cardiovascular diseases make AD a complex disease, with no available definitive bio-markers that allow us clinical diagnosis – nowadays diagnosis of AD is only possible postmortem – and this is a major problem for the advance of efficient drug discovery programs [1, 9, 10]. We will summarize some of the main features and advantages of metabolomics over other ‘omic’ approaches such as transcriptomics and proteomics at assisting etiology, progression, clinical assessment and evaluation of potential therapeutic treatments of AD.
Rationale for metabolomics in Alzheimer's disease
Metabolomics (also known as metabonomics) can be defined as an attempt to measure all the metabolites that are present within a cell, tissue or organism and to assess their changes during physiological stimuli or genetic modification [11–13]. To date, the most successful applications of metabolomics have been obtained in the area of functional genomics, where it involves the understanding of gene function in different organisms including yeast [14, 15], plants [16] and mice [17] where phenotypes associated to given mutants have been distinguished. It is interesting to point out that small changes in the concentrations of enzymes have only small effects on the metabolic fluxes but can induce substantial changes on the concentrations of metabolic intermediates. Because the metabolome is a downstream of the proteome and transcriptome, it has been shown to be amplified, theoretically [18] and experimentally [14, 19] and represents a more sensitive level of organization than the proteome or transcriptome do for understanding a complex biological outcome such as the one represented by AD or other neurodegenerative diseases.
When we deal with translational medicine issues, cost assessments should be taken into account. In this sense, metabolomic approaches are cheap on a per-sample basis and therefore they have been widely used in toxicology screening [20]. Although there are several reports using metabolomic approaches as diagnostic tools both in biological fluids [21] and human beings in vivo[22, 23], it is still an area that needs to be expanded. Metabolism is conserved during evolution; metabolic networks are essentially very similar in rodents and human beings. Therefore, a further advan-tage of metabolomics over other ‘omics' is that it is transferable from one species to another. Thus, it suits a major requirement for becoming an ideal tool for translational research; metabolic patterns associated to pathology or therapeutic responses in animal models could be directly transferred to the clinical setting.
Magnetic resonance spectroscopy (MRS) evaluation techniques of metabolic parameters are safe and non-invasive, providing an excellent opportunity to perform in vivo studies in AD mouse models and human patients. In this sense, longitudinal studies are obviously of particular interest. MRS is also very versatile. It is possible to measure several different molecules and parameters by using either endogenous (for example, brain function could be related to the redox state of iron in deoxyhemoglo-bin) or exogenous contrast agents (31P-, 13C-, 1H-MRS) [24]. It is worth noting that MRS-based metabolomics is more reliable compared to currently used neuropathological protocols in AD diagnosis, which are highly observer- and protocol-dependent. Finally, MRS-based metabolomics is able to tackle a single problem at both the molecular and systems level.
Although nuclear magnetic resonance (NMR)-based metabolomics profiling offers evident advantages, the number of MRS studies focused in AD is still rather limited. Some key issues could explain that: (1) It is necessary to develop new analytical and data-handling techniques, as we will see later on; (2) To allow applications for clinical studies, in particular phase II studies, we need to set a degree of standardization and consensus guidelines in the experimental procedures. Very recently, pioneering work by Beckonert and collaborators addressed questions in this sense [25], and finally; (3) It is important to aim at using a common language, as friendly as possible, among NMR biophysicists, biochemists, biologists and clinical scientists, to steer translational research projects in the field. In this sense, this review will try to fill this gap among physicians and clinical scientists in relation with our present understanding, overall working philosophy, and limitations, of NMR-based metabolomics in AD. Being able to use a non-invasive approach to diagnose and grade AD would be of greatest importance when assessing new therapies during clinical trials.
Metabolomics of Alzheimer's disease
In the last few years, there have been a few reports about the use of NMR spectroscopy in the study of AD diseases in both human beings [26] and animal models of AD [27]. 1H-MRS is the most common NMT technique, because of its wide availability on clinical settings. In the in vivo spectra at low field (1.5 T of most reports in human beings) a few metabolites can be easily detected (Fig. 1). These include N-acetylaspartate (NAA) considered as a marker of neuronal density and integrity [28, 29]. NAA is synthesized under normal conditions in the mitochondria of neurons, but not in glial cells [30]. NAA is early detected and therefore it might be useful for the assessment of neuroprotective treatment in AD [24]. However, the experimental design should be carefully established to ensure that NAA levels are not affected by unspecific interactions of the tested drug with NAA metabolism. Although NAA fulfils most of the key criteria to be a reliable marker of neuronal loss or dysfunction, it is interesting to note that its biological function in the brain is not well understood. NAA is not a neurotransmitter, and it is reasoned that it could be involved in lipid synthesis into myelin, as a storage form of aspartate, or involved in osmoregu-lation, similar to taurine [31]. Glial cells contain higher concentrations of myo-inositol compared to neurons, and therefore is considered a marker of gliosis [32]. Compounds containing choline (named as tri-methyl amine) have been reported to change; they also include ethanolamine-containing compounds [32]. Total (phosphorilated and unphosphorilated) creatine is regarded as being relatively stable and often used as an internal concentration reference. Further details about the biological function of these metabolites are out of the scope of the present review but can be found elsewhere [31, 33].
1.
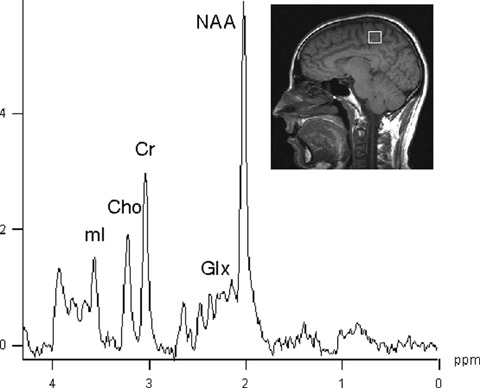
1H-MRS spectrum from a healthy volunteer obtained at 1.5 T from a 8 cm3 (2 × 2 × 2 cm) volume of interest within the brain with a PRESS sequence TR 1600 msec, TE 30 msec. Assignments are as follows: N-acetylaspartate, NAA; Creatine plus phosphocreatine, Cr; Choline, Cho; myo-inositol, mI; Glutamate plus glutamine, Glx.
Applying biofluid metabolomic analysis in AD studies is a big challenge mainly because the brain is encapsulated within the blood-brain barrier, a membrane that limits the passage of many metabolites. However, recent work by Karrenbauer and coworkers should be encouraging in the AD field, as it is possible to find a single metabolite with biomarker capabilities. They have found that cerebrosterol (a brain-specific cholesterol metabolite) levels in plasma are negatively correlated with the size of multiple sclerosis lesions [34]. Based on these, and other findings, it has been suggested that ‘the application of biofluid based metabolomics in neuroscience will provide many opportunities to produce real benefit for sufferers of neurological disorders' [35]. While it may prove tricky to apply biofluid-based metabolomic analysis to neu-rosciences in a general manner, the brain remains the most accessible organ for application of MRS in vivo.
Studies in animal models of AD
The development of transgenic mouse models for AD enables the controlled study of disease physiopathology, biomarkers studies, therapeutic strategies and the evaluation of treatment effects by NMR spectroscopy. Indeed, there are a few mouse models of AD that have been used for NMR spectroscopy studies. These include mice that express mutant amyloid precursor protein (APPtg2576) that at 19 months were found to have reduced NAA, glutamate and glutathione in vivo as well as in spectra from tissue extract [27, 36]. Marjanska and collaborators [36] working with APP-PS1 mice (which co-express mutated human presenilin 1 and APP) also found a reduction in NAA and glutamate and an increase in myo-inositol with age in the mutant mice. These authors take into account the metabolic changes that occur during normal aging [37], which should not be neglected.
The only work using pattern recognition techniques is the one by von Kienlin and collaborators based on the transgenic mouse line PS2APP [38]. This mouse model overexpresses mutant forms of human presenilin 2 (PS2) and APP, developing an amyloidosis exclusively in the neocortex and the limbic cortex at 8 months. These authors reported a decrease in the amount of NAA in PS2APP mice compared to control mice. When spectra were fed into a Support Vector Machine to be analyzed, wild-type animals could be differentiated with a sensitivity of 92% and a specificity of 82%[38].
Cheng and collaborators showed that HR-MAS has potential applications in experimental and clinical neuropathological investigations and that it could provide with a rational basis for the interpretation of in vivo MRS [39]. Since then, numerous papers have been published using this technique but, to the best of our knowledge, the only work using HR-MAS spectroscopy to study AD showed a correlation between neuronal density and NAA in the superior temporal sulcus [40] (the review by Choi and collaborators [31] shows an AD HR-MAS spectra of mice brain but no reference is given).
While there is scarce data regarding pattern recognition in AD, the group of Griffin has done extensive work by applying metabolomics to neurodegenerative diseases in animal models such as spinocerebellar ataxia 3 [41], Batten disease [42] and Parkinson's disease [43]. It is worth to mention here the enormous potential of the new AD model developed in Drosophila melanogaster by Crowther and collaborators [44] for NMR studies. These transgenic flies express toxic β-amyloid peptides exhibiting a clear phenotype from a few days of age, including reduced loco-motor function, impaired olfactory memory and shortened lifes-pan. Therapeutic agents that interfere with the generation of toxic aggregates of β-amyloid peptides have been shown to rescue the flies [44]. The Drosophila model of AD will take advantage of the previous knowledge, speed and statistical advantages of genetic screens in flies. In addition, the shorter animal cycles of flies and the absence of problems due to variability of metabolite concentrations that often is reported in different strains of mice will accelerate our understanding of AD.
Human studies
As early as 1995, pioneering work by Ross and collaborators reported that AD patients had lower levels of NAA [26]. This has been confirmed since by several groups in different brain regions [45–47], although this feature is not specific of AD, as in almost every neurodegenerative disease examined to date there is extensive NAA loss in the region of the brain affected by the pathology [31]. NAA myo-inositol (mI) ratio is able to differentiate AD from non-AD patients [48], this being related to a decrease in NAA but also to an increase in myo-inositol in AD post-mortem analysis [49, 50]. The biological significance of these myo-inositol changes is unknown so far. Kantarci and collaborators showed an increase in choline to creatine ratios in AD patients compared to controls [37]. This could be explained as an increase in the membrane turnover due to neuronal degeneration or to the increased demand of free choline to counterbalance the deficient acetylcholine production in AD. On the other hand, other authors failed to detect such an increase [47, 51].
An important issue is whether AD could be differentiated from other neuropathologies, especially mild cognitive impairment (MCI). The MCI patients present with cognitive impairment beyond the one expected at their age and education and progress to AD with a rate of 10–15% per year. In this sense, Martinez-Bisbal and collaborators could differentiate between AD, vascular dementia, depression and MCI [51]. In longitudinal studies it has been reported that metabolite annual percent change was able to differentiate control, MCI and AD patients [37]; moreover, they could predict which patients with MCI would evolve to AD based on the metabolite annual percent change [37]. Other longitudinal studies have shown that MRS of occipital cortex is a valuable tool in predicting the conversion of MCI patients to AD [52] while presymptomatic mutation carriers of PS1 or APP showed metabolic changes before the expected onset of AD [53]. Contrary to the results obtained in human studies in AD [49, 50], myo-inosi-tol concentrations are not affected in Huntington's disease patients [26, 31].
Reproducibility of metabolite ratios may depend on physiological conditions and acquisition-related factors such as voxel positioning, but it has been suggested that metabolite ratio changes observed in longitudinal studies represent true changes over time [37]. Because metabolomics does not rely on the measure of individual peaks but rather analyzes the whole of the spectra dataset and does not depend on any internal reference, it may actually improve the test–retest reproducibility of MRS.
MRS changes associated to AD vary in different brain regions. According to Modrego and collaborators spectra from occipital regions were able to predict conversion from MCI to probable AD, while differences in spectra from hypocampus or parietal cortex were not statistically significant [52]. Rami and collaborators obtained single voxel spectra from the posterior cingulate, the left temporal pole and the left posterior tempoparietal region, and they only found metabolic differences between MCI and AD in the left temporal pole [47].
Chemical shift imaging allows researchers to obtain spectra simultaneously from various locations, making it ideal for studies involving regional differences. A standard MRS study on patients should include the acquisition of images to guide placing the voxels into the appropriate anatomic regions. It has been shown that the use of MRS combined with image analysis improves the classification of AD [54]. Using this approach it was found that NAA reduction in AD patients as compared to controls, is more severe in the medial temporal and parietal lobes while it was not changed in white matter or frontal lobe gray matter [54]. In the same article, these authors showed that by using MR imaging alone, they were able to classify AD from control with 89% accuracy, that increased up to 95% when adding spectroscopy (NAA), while no data were provided about the accuracy of spectroscopy alone [54].
MRS can be used to evaluate treatments both for AD and other neurodegenerative diseases and it may be important in phase II clinical studies for the evaluation of AD treatment [24]. This topic goes beyond the scope of this review; the interested reader is directed to an excellent work by Mueller and colleagues [24].
Regarding the approaches involving pattern recognition studies, they have yet to be performed on MRS data from AD patients, although there is extensive data in brain tumour classification [22, 55] reviewed in [56]. Despite the fact that MRS is a relatively insensitive technique compared to others, such as positron emission tomography (PET), MRS can measure a variety of factors such as neuronal loss (NAA reduction), cellularity or membrane turnover. The ability to measure a large set of parameters is essential to perform metabolomic studies that are based on the analysis of large data arrays. Therefore, it is expected as a likely theme for expansion in the near future.
Methodology: NMR metabolomics at work
Mass spectrometry (MS) coupled with chromatography (either gas or liquid) or NMR spectroscopy are the two main methodologies used in metabolomic studies, although other approaches have been used such as Fourier transform infra red (FTIR) spectroscopy or high-performance liquid chromatography (HPLC). MS is a very sensitive technique, and therefore ideal to find biomarkers of disease. However, it requires the manipulation of the sample and a previous chromatography step before the MS determination, introducing a bias towards which metabolites can be detected. On the other hand, although high resolution 1H-NMR spectroscopy is not a high sensitivity approach, by using this simple, one-dimensional technique, it is possible to measure up to 100 metabolites, without requiring any further sample manipulation and having the potential of being used in vivo, even in patients. Extensive work has been done in trying large-scale reconstruction of biological systems mainly using mass spectroscopy; readers are directed to excellent recent reviews in the field [57–59].
Despite the low sensitivity of NMR spectroscopy, it has been successful in distinguishing mutants in yeast [14], mouse models of neurodegenerative disease [42] or myocardial infarction in swine [60] among others. This may be due to the fact that metabolic networks are dominated by a few highly connected nodes or metabolites [61, 62]. In those systems, perturbations will be rapidly and widely spread throughout the network and thus many metabolites may be affected. Also, it may help that NMR is able to detect the most highly connected metabolites [62].
NMR spectroscopy can be applied directly onto biofluids such as plasma [14] or urine [63] with little or no manipulation of the sample. In tissues, both dipolar coupling and diamagnetic susceptibility anisotropy are significant, giving rise to large line widths that reduce the quality of the spectra. This can be greatly improved by spinning the samples at the ‘magic angle’ (54.7) at which dipolar coupling is averaged to zero producing NMR spectra with line widths close to those obtainable in liquid samples [64]. Figure 2 shows a Magic Angle Spinning (MAS) spectra of mouse brain tissue.
2.
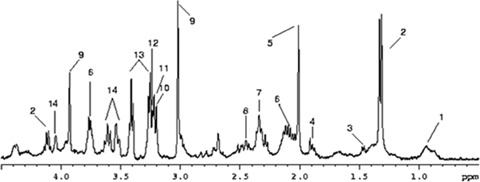
1H-MAS spectra of mouse brain cortex obtained at 400 MHz (9.4 T). Each resonance corresponds to a chemical moiety within a particular metabolite, with the intensity being proportional to the concentration of that metabolite. Tentative assignments based only on a chemical shift are as follows: 1, methyl group of lipids; 2, lactate; 3, alanine; 4, Acetate/γ-amino butiric acid; 5, N-acetylaspartate; 6, Glutamate/Glutamine; 7, Glutamate; 8, Glutamine; 9, Creatine; 10, Choline; 11, Phosphocholine; 12, Glicerophosphocholine; 13, Taurine; 14, myo-inositol.
How does a basic data handling in NMR-based metabolomics work? Metabolomic studies comprise large datasets and pattern recognition tools to decipher the changes associated with AD processes from those associated with normal physiological variation. To investigate the innate variation of the dataset, unsupervised techniques such as principal component analysis (PCA) could be used [65]. However, specific questions are being posed, for example: Is it possible to differentiate healthy from pathological samples? Supervised methods such as prediction to latent structures through partial least squares (PLS) may be more appropriate [66]. Supervised classification consists in creating models that maximize the difference between groups, while minimizing at the same time intra-group variation by providing a priori information.
For all the supervised classification methods, it is necessary to test the robustness and predictability of the models, because of the risk of spuriousness, i.e. the model fits the training set well but does not accurately predict new observations. When possible and datasets are large enough, this test has to be carried out using an independent set of observations, one that has not been used to create the model. Otherwise, it can be done by the leave-one-out approach, where one sample of the dataset is tested against the model created with the others; this process is repeated as many times as samples are in the dataset.
Results of a pattern recognition analysis should provide two distinct but interlinked informational sets. On the one hand, the ability to differentiate between groups of samples is relevant by itself, especially in the clinical or pre-clinical environment [21]. On the other hand, they also provide with metabolic and functional information, and this information can be related to particular metabolic disorders [42]. Figure 3 shows a schematic representation of the main steps in any metabolomic analysis. Once the dataset is acquired, it is usually normalized within each spectrum and scaled along each variable [67]. Afterwards, unsupervised classification method(s) can be applied in order to view the general trend of the dataset variance; this can be extended to discriminant analysis that emphasizes any differences between known groups of samples. Group differences can be identified in Cooman's plot (Fig. 3D), showing separation of the two groups with confidence intervals built in. In all models created, supervised and unsuper-vised, information about which metabolites are more relevant can be obtained.
3.
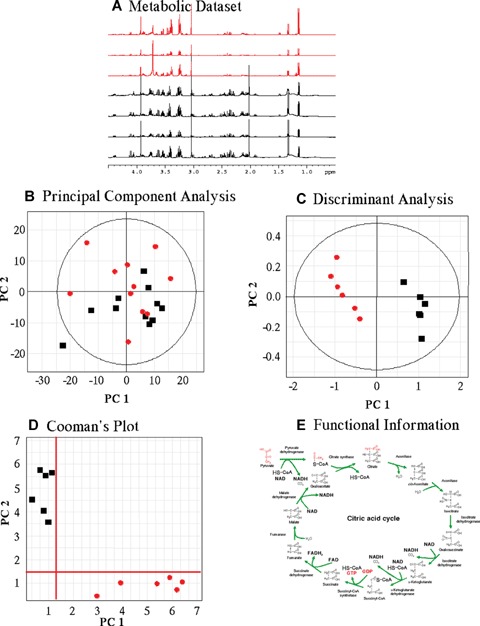
Flow chart of the chemometric approach used to cluster NMR data. (A) Raw data are organized as a dataset that it is pruned, scaled and normalized. (B) Unsupervised classification methods (Principal component analysis) allow to see any major trends in the dataset variation and to detect any outlayers. (C) Supervised classification (Discriminant Analysis) allows detecting variation related to a variable of interest. (D) Cooman's plot shows the separation of two different groups. Axes represent a measure of the distance the data are from an ideal model. In this manner confidence intervals can be built. (E) Metabolic data can be derived for any classification models created, both supervised and unsupervised.
Conclusions
Even in situations where a small number of metabolites can be measured robustly, such as in the actual MRS settings, clinically relevant models can be built using metabolomic data. While biofluid-based metabolomic studies present special challenges, the application of biofluid and in vivo metabolomics will provide many opportunities to produce real benefits for sufferers of neurological disorders. The nature of metabolomics eases the transfer between animal experiments and the clinical setting; it is then and ideal approach for translational research. Moreover, the increase in magnetic field from clinical scanners will allow obtaining spectra, very similar to the ones actually obtained from research animals. The tools to implement metabolomics on AD are present and, when tested, proved to be useful [38]. Due to the main features of NMR spectroscopy, it would be an ideal approach in the growing field of human pharmacogenomics. Thus, it would be possible to identify NMR profiles which may predict the response of a treatment in the individual patient so that the treatment with the highest prospect for success can be chosen from the beginning. Thus, we have now the opportunity to implement those techniques both in the experimental settings to understand the pathology of the disease and its evolution and in the clinical (AD diagnosis and treatment follow-up) environments.
Acknowledgments
Authors would like to thank Dr. J. Alonso for providing the image and spectra shown in Figure 1. This work was supported by grants from the Spanish Ministry of Health (PI052056; PI061641 to D.P) and the Spanish Ministry of Science (SAF2007–29418-E to D.P). DP's laboratory is part of the national cooperative research network in multiple sclerosis RETIC-REEM, Spanish Ministry of Health. IB's and DGD's laboratory is part of the national cooperative research network in cardiovascular diseases RETIC-RECAVA, Spanish Ministry of Health.
References
- 1.Popescu BO. Still debating a cause and diagnostic criteria for Alzheimer's disease. J Cell Mol Med. 2007;11:1225–6. doi: 10.1111/j.1582-4934.2007.00149.x. [DOI] [PMC free article] [PubMed] [Google Scholar]
- 2.Bird TD. Genetic factors in Alzheimer's disease. N Engl J Med. 2005;352:862–4. doi: 10.1056/NEJMp058027. [DOI] [PubMed] [Google Scholar]
- 3.Bird TD. Genetic aspects of Alzheimer disease. Genet Med. 2008;10:231–9. doi: 10.1097/GIM.0b013e31816b64dc. [DOI] [PMC free article] [PubMed] [Google Scholar]
- 4.Blair CK, Folsom AR, Knopman DS, Bray MS, Mosley TH, Boerwinkle E. ApoE genotype and cognitive decline in a middle-aged cohort. Neurology. 2005;64:268–76. doi: 10.1212/01.WNL.0000149643.91367.8A. [DOI] [PubMed] [Google Scholar]
- 5.Kozauer NA, Mielke MM, Chan GK, Rebok GW, Lyketsos CG. Apolipoprotein E genotype and life-time cognitive decline. Int Psychogeriatr. 2008;20:109–23. doi: 10.1017/S104161020700587X. [DOI] [PubMed] [Google Scholar]
- 6.Cosentino S, Scarmeas N, Helzner E, Glymour MM, Brandt J, Albert M, Blacker D, Stern Y. ApoE epsilon 4 allele predicts faster cognitive decline in mild Alzheimer disease. Neurology. 2008;70:1842–9. doi: 10.1212/01.wnl.0000304038.37421.cc. [DOI] [PMC free article] [PubMed] [Google Scholar]
- 7.Brickell KL, Steinbart EJ, Rumbaugh M, Payami H, Schellenberg GD, Van Deerlin V, Yuan W, Bird TD. Early-onset Alzheimer disease in families with late-onset Alzheimer disease: a potential important subtype of familial Alzheimer disease. Arch Neurol. 2006;63:1307–11. doi: 10.1001/archneur.63.9.1307. [DOI] [PubMed] [Google Scholar]
- 8.Bertram L, McQueen MB, Mullin K, Blacker D, Tanzi RE. Systematic meta-analyses of Alzheimer disease genetic association studies: the ALZgene database. Nat Genet. 2007;39:17–23. doi: 10.1038/ng1934. [DOI] [PubMed] [Google Scholar]
- 9.Jellinger KA, Janetzky B, Attems J, Kienzl E. Biomarkers for early diagnosis of Alzheimer disease: “Alzheimer associated gene”—a new blood biomarker? J Cell Mol Med. 2008 doi: 10.1111/j.1582-4934.2008.00313.x. DOI: 10.1111/j.1582-4934.2008.00313.x. [DOI] [PMC free article] [PubMed] [Google Scholar]
- 10.Shaw LM, Korecka M, Clark CM, Lee VM, Trojanowski JQ. Biomarkers of neurode-generation for diagnosis and monitoring therapeutics. Nat Rev Drug Discov. 2007;6:295–303. doi: 10.1038/nrd2176. [DOI] [PubMed] [Google Scholar]
- 11.Oliver SG, Winson MK, Kell DB, Baganz F. Systematic functional analysis of the yeast genome. Trends Biotechnol. 1998;16:373–8. doi: 10.1016/s0167-7799(98)01214-1. [DOI] [PubMed] [Google Scholar]
- 12.Nicholson JK, Holmes E, Wilson ID. Gut microorganisms, mammalian metabolism and personalized health care. Nat Rev Microbiol. 2005;3:431–8. doi: 10.1038/nrmicro1152. [DOI] [PubMed] [Google Scholar]
- 13.Griffin JL. Understanding mouse models of disease through metabolomics. Curr Opin Chem Biol. 2006;10:309–15. doi: 10.1016/j.cbpa.2006.06.027. [DOI] [PubMed] [Google Scholar]
- 14.Raamsdonk LM, Teusink B, Broadhurst D, Zhang N, Hayes A, Walsh MC, Berden JA, Brindle KM, Kell DB, Rowland JJ, Westerhoff HV, Van Dam K, Oliver SG. A functional genomics strategy that uses metabolome data to reveal the phenotype of silent mutations. Nat Biotechnol. 2001;19:45–50. doi: 10.1038/83496. [DOI] [PubMed] [Google Scholar]
- 15.Allen J, Davey HM, Broadhurst D, Heald JK, Rowland JJ, Oliver SG, Kell DB. High-throughput classification of yeast mutants for functional genomics using metabolic footprinting. Nat Biotechnol. 2003;21:692–6. doi: 10.1038/nbt823. [DOI] [PubMed] [Google Scholar]
- 16.Fiehn O, Kopka J, Dormann P, Altmann T, Trethewey RN, Willmitzer L. Metabolite profiling for plant functional genomics. Nat Biotechnol. 2000;18:1157–61. doi: 10.1038/81137. [DOI] [PubMed] [Google Scholar]
- 17.Jones GL, Sang E, Goddard C, Mortishire-Smith RJ, Sweatman BC, Haselden JN, Davies K, Grace AA, Clarke K, Griffin JL. A functional analysis of mouse models of cardiac disease through metabolic profiling. J Biol Chem. 2005;280:7530–9. doi: 10.1074/jbc.M410200200. [DOI] [PubMed] [Google Scholar]
- 18.Mendes P, Kell DB, Westerhoff HV. Why and when channelling can decrease pool size at constant net flux in a simple dynamic channel. Biochim Biophys Acta. 1996;1289:175–86. doi: 10.1016/0304-4165(95)00152-2. [DOI] [PubMed] [Google Scholar]
- 19.Urbanczyk-Wochniak E, Luedemann A, Kopka J, Selbig J, Roessner-Tunali U, Willmitzer L, Fernie AR. Parallel analysis of transcript and metabolic profiles: a new approach in systems biology. EMBO Rep. 2003;4:989–93. doi: 10.1038/sj.embor.embor944. [DOI] [PMC free article] [PubMed] [Google Scholar]
- 20.Coen M, Holmes E, Lindon JC, Nicholson JK. NMR-based metabolic profiling and metabolonomic approaches to problems in molecular toxicology. Chem Res Toxicol. 2008;21:9–27. doi: 10.1021/tx700335d. [DOI] [PubMed] [Google Scholar]
- 21.Sabatine MS, Liu E, Morrow DA, Heller E, McCarroll R, Wiegand R, Berriz GF, Roth FP, Gerszten RE. Metabolomic identification of novel biomarkers of myocar-dial ischemia. Circulation. 2005;112:3868–75. doi: 10.1161/CIRCULATIONAHA.105.569137. [DOI] [PubMed] [Google Scholar]
- 22.Preul MC, Caramanos Z, Collins DL, Villemure JG, Leblanc R, Olivier A, Pokrupa Rarnold DL. Accurate, noninva-sive diagnosis of human brain tumors by using proton magnetic resonance spec-troscopy. Nat Med. 1996;2:323–5. doi: 10.1038/nm0396-323. [DOI] [PubMed] [Google Scholar]
- 23.Majos C, Julia-Sape M, Alonso J, Serrallonga M, Aguilera C, Acebes JJ, Arus C, Gili J. Brain tumor classification by proton MR spectroscopy: comparison of diagnostic accuracy at short and long TE. AJNR Am J Neuroradiol. 2004;25:1696–704. [PMC free article] [PubMed] [Google Scholar]
- 24.Mueller SG, Schuff N, Weiner MW. Evaluation of treatment effects in Alzheimer's and other neurodegenerative diseases by MRI and MRS. NMR Biomed. 2006;19:655–68. doi: 10.1002/nbm.1062. [DOI] [PMC free article] [PubMed] [Google Scholar]
- 25.Beckonert O, Keun HC, Ebbels TM, Bundy J, Holmes E, Lindon JC, Nicholson JK. Metabolic profiling, metabolomic and metabonomic procedures for NMR spec-troscopy of urine, plasma, serum and tissue extracts. Nat Protoc. 2007;2:2692–703. doi: 10.1038/nprot.2007.376. [DOI] [PubMed] [Google Scholar]
- 26.Shonk TK, Moats RA, Gifford P, Michaelis T, Mandigo JC, Izumi J, Ross BD. Probable Alzheimer disease: diagnosis with proton MR spectroscopy. Radiology. 1995;195:65–72. doi: 10.1148/radiology.195.1.7892497. [DOI] [PubMed] [Google Scholar]
- 27.Dedeoglu A, Choi JK, Cormier K, Kowall NW, Jenkins BG. Magnetic resonance spectroscopic analysis of Alzheimer's disease mouse brain that express mutant human APP shows altered neurochemical profile. Brain Res. 2004;1012:60–5. doi: 10.1016/j.brainres.2004.02.079. [DOI] [PubMed] [Google Scholar]
- 28.Moffett JR, Namboodiri MA, Cangro CB, Neale JH. Immunohistochemical localization of n-acetylaspartate in rat brain. Neuroreport. 1991;2:131–4. doi: 10.1097/00001756-199103000-00005. [DOI] [PubMed] [Google Scholar]
- 29.Simmons ML, Frondoza CG, Coyle JT. Immunocytochemical localization of n-acetyl-aspartate with monoclonal antibodies. Neuroscience. 1991;45:37–45. doi: 10.1016/0306-4522(91)90101-s. [DOI] [PubMed] [Google Scholar]
- 30.Baslow M. N-acetylaspartate in the vertebrate brain: metabolism and function. Neurochem Res. 2003;28:941–53. doi: 10.1023/a:1023250721185. [DOI] [PubMed] [Google Scholar]
- 31.Choi JK, Dedeoglu A, Jenkins BG. Application of MRS to mouse models of neurodegenerative illness. NMR Biomed. 2007;20:216–37. doi: 10.1002/nbm.1145. [DOI] [PubMed] [Google Scholar]
- 32.Brand A, Richter-Landsberg C, Leibfritz D. Multinuclear NMR studies on the energy metabolism of glial and neuronal cells. Dev Neurosci. 1993;15:289–98. doi: 10.1159/000111347. [DOI] [PubMed] [Google Scholar]
- 33.Firbank MJ, Harrison RM, O’Brien JT. A comprehensive review of proton magnetic resonance spectroscopy studies in dementia and Parkinson's disease. Dement Geriatr Cogn Disord. 2002;14:64–76. doi: 10.1159/000064927. [DOI] [PubMed] [Google Scholar]
- 34.Karrenbauer VD, Leoni V, Lim ET, Giovannoni G, Ingle GT, Sastre-Garriga J, Thompson AJ, Rashid W, Davies G, Miller DH, Bjorkhem I, Masterman T. Plasma cerebrosterol and magnetic resonance imaging measures in multiple sclerosis. Clin Neurol Neurosurg. 2006;108:456–60. doi: 10.1016/j.clineuro.2005.07.010. [DOI] [PubMed] [Google Scholar]
- 35.Griffin JL, Salek RM. Metabolomic applications to neuroscience: more challenges than chances? Expert Rev Proteomics. 2007;4:435–7. doi: 10.1586/14789450.4.4.435. [DOI] [PubMed] [Google Scholar]
- 36.Marjanska M, Curran GL, Wengenack TM, Henry PG, Bliss RL, Poduslo JF, Jack CR, Jr, Ugurbil K, Garwood M. Monitoring disease progression in transgenic mouse models of Alzheimer's disease with proton magnetic resonance spectroscopy. Proc Natl Acad Sci USA. 2005;102:11906–10. doi: 10.1073/pnas.0505513102. [DOI] [PMC free article] [PubMed] [Google Scholar]
- 37.Kantarci K, Weigand SD, Petersen RC, Boeve BF, Knopman DS, Gunter J, Reyes D, Shiung M, O’Brien PC, Smith GE, Ivnik RJ, Tangalos EG, Jack CR., Jr Longitudinal 1H-MRS changes in mild cognitive impairment and Alzheimer's disease. Neurobiol Aging. 2007;28:1330–39. doi: 10.1016/j.neurobiolaging.2006.06.018. [DOI] [PMC free article] [PubMed] [Google Scholar]
- 38.Von Kienlin M, Kunnecke B, Metzger F, Steiner G, Richards JG, Ozmen L, Jacobsen H, Loetscher H. Altered metabolic profile in the frontal cortex of PS2APP trans-genic mice, monitored throughout their life span. Neurobiol Dis. 2005;18:32–9. doi: 10.1016/j.nbd.2004.09.005. [DOI] [PubMed] [Google Scholar]
- 39.Cheng LL, Ma MJ, Becerra L, Ptak T, Tracey I, Lackner A, Gonzalez RG. Quantitative neuropathology by high resolution magic angle spinning proton magnetic resonance spectroscopy. Proc Natl Acad Sci USA. 1997;94:6408–13. doi: 10.1073/pnas.94.12.6408. [DOI] [PMC free article] [PubMed] [Google Scholar]
- 40.Cheng LL, Newell K, Mallory AE, Hyman BT, Gonzalez RG. Quantification of neurons in Alzheimer and control brains with ex vivo high resolution magic angle spinning proton magnetic resonance spec-troscopy and stereology. Magn Reson Imaging. 2002;20:527–33. doi: 10.1016/s0730-725x(02)00512-x. [DOI] [PubMed] [Google Scholar]
- 41.Griffin JL, Cemal CK, Pook MA. Defining a metabolic phenotype in the brain of a transgenic mouse model of spinocerebel-lar ataxia 3. Physiol Genomics. 2004;16:334–40. doi: 10.1152/physiolgenomics.00149.2003. [DOI] [PubMed] [Google Scholar]
- 42.Pears MR, Cooper JD, Mitchison HM, Mortishire-Smith RJ, Pearce DA, Griffin JL. High resolution 1H NMR-based metabolomics indicates a neurotransmitter cycling deficit in cerebral tissue from a mouse model of batten disease. J Biol Chem. 2005;280:42508–14. doi: 10.1074/jbc.M507380200. [DOI] [PubMed] [Google Scholar]
- 43.Salek RM, Colebrooke RE, Macintosh R, Lynch PJ, Sweatman BC, Emson PC, Griffin JL. A metabolomic study of brain tissues from aged mice with low expression of the vesicular monoamine transporter 2 (VMAT2) gene. Neurochem Res. 2008;33:292–300. doi: 10.1007/s11064-007-9542-3. [DOI] [PubMed] [Google Scholar]
- 44.Crowther DC, Page R, Chandraratna D, Lomas DA. A Drosophila model of Alzheimer's disease. Methods Enzymol. 2006;412:234–55. doi: 10.1016/S0076-6879(06)12015-7. [DOI] [PubMed] [Google Scholar]
- 45.Adalsteinsson E, Sullivan EV, Kleinhans N, Spielman DM, Pfefferbaum A. Longitudinal decline of the neuronal marker n-acetyl aspartate in Alzheimer's disease. Lancet. 2000;355:1696–7. doi: 10.1016/s0140-6736(00)02246-7. [DOI] [PubMed] [Google Scholar]
- 46.Block W, Jessen F, Traber F, Flacke S, Manka C, Lamerichs R, Keller E, Heun R, Schild H. Regional n-acetylaspartate reduction in the hippocampus detected with fast proton magnetic resonance spectroscopic imaging in patients with Alzheimer disease. Arch Neurol. 2002;59:828–34. doi: 10.1001/archneur.59.5.828. [DOI] [PubMed] [Google Scholar]
- 47.Rami L, Gomez-Anson B, Bosch B, Sanchez-Valle R, Monte GC, Villar A, Molinuevo JL. Cortical brain metabolism as measured by proton spectroscopy is related to memory performance in patients with amnestic mild cognitive impairment and Alzheimer's disease. Dement Geriatr Cogn Disord. 2007;24:274–9. doi: 10.1159/000107487. [DOI] [PubMed] [Google Scholar]
- 48.Miller BL, Moats RA, Shonk T, Ernst T, Woolley S, Ross BD. Alzheimer disease: depiction of increased cerebral myo-inosi-tol with proton MR spectroscopy. Radiology. 1993;187:433–7. doi: 10.1148/radiology.187.2.8475286. [DOI] [PubMed] [Google Scholar]
- 49.Klunk W, Xu C, Panchalingam K, McClure R, Pettegrew J. Quantitative 1H and 31P MRS of PCA extracts of postmortem Alzheimer's disease brain. Neurobiol Aging. 1996;17:349–57. doi: 10.1016/0197-4580(96)00035-8. [DOI] [PubMed] [Google Scholar]
- 50.Pettegrew J, Klunk W, Panchalingam K, McClure R, Stanley J. Magnetic resonance spectroscopic changes in Alzheimer's disease. Ann NY Acad Sci. 1997;826:282–306. doi: 10.1111/j.1749-6632.1997.tb48480.x. [DOI] [PubMed] [Google Scholar]
- 51.Martinez-Bisbal MC, Arana E, Marti-Bonmati L, Molla E, Celda B. Cognitive impairment: classification by 1H magnetic resonance spectroscopy. Eur J Neurol. 2004;11:187–93. doi: 10.1046/j.1468-1331.2003.00746.x. [DOI] [PubMed] [Google Scholar]
- 52.Modrego PJ, Fayed N, Pina MA. Conversion from mild cognitive impairment to probable Alzheimer's disease predicted by brain magnetic resonance spec-troscopy. Am J Psychiatry. 2005;162:667–75. doi: 10.1176/appi.ajp.162.4.667. [DOI] [PubMed] [Google Scholar]
- 53.Godbolt AK, Waldman AD, MacManus DG, Schott JM, Frost C, Cipolotti L, Fox NC, Rossor MN. MRS shows abnormalities before symptoms in familial Alzheimer disease. Neurology. 2006;66:718–22. doi: 10.1212/01.wnl.0000201237.05869.df. [DOI] [PubMed] [Google Scholar]
- 54.Schuff N, Capizzano AA, Du AT, Amend DL, O’Neill J, Norman D, Kramer J, Jagust W, Miller B, Wolkowitz OM, Yaffe K, Weiner MW. Selective reduction of n-acetylaspartate in medial temporal and parietal lobes in ad. Neurology. 2002;58:928–35. doi: 10.1212/wnl.58.6.928. [DOI] [PMC free article] [PubMed] [Google Scholar]
- 55.Usenius JP, Tuohimetsa S, Vainio P, Ala-Korpela M, Hiltunen Y, Kauppinen RA. Automated classification of human brain tumours by neural network analysis using in vivo1H magnetic resonance spectro-scopic metabolite phenotypes. Neuroreport. 1996;7:1597–600. doi: 10.1097/00001756-199607080-00013. [DOI] [PubMed] [Google Scholar]
- 56.Griffin JL, Kauppinen RA. A metabolomics perspective of human brain tumours. FEBS J. 2007;274:1132–9. doi: 10.1111/j.1742-4658.2007.05676.x. [DOI] [PubMed] [Google Scholar]
- 57.Kell DB. Metabolomics and systems biology: making sense of the soup. Curr Opin Microbiol. 2004;7:296–307. doi: 10.1016/j.mib.2004.04.012. [DOI] [PubMed] [Google Scholar]
- 58.Kell DB. Systems biology, metabolic modelling and metabolomics in drug discovery and development. Drug Discov Today. 2006;11:1085–92. doi: 10.1016/j.drudis.2006.10.004. [DOI] [PubMed] [Google Scholar]
- 59.Oliver SG. From genomes to systems: the path with yeast. Philos Trans R Soc Lond B Biol Sci. 2006;361:477–82. doi: 10.1098/rstb.2005.1805. [DOI] [PMC free article] [PubMed] [Google Scholar]
- 60.Barba I, Jaimez-Auguets E, Rodriguez-Sinovas A, Garcia-Dorado D. (1)H NMR-based metabolomic identification of at-risk areas after myocardial infarction in swine. Magma. 2007;20:265–71. doi: 10.1007/s10334-007-0097-8. [DOI] [PubMed] [Google Scholar]
- 61.Jeong H, Tombor B, Albert R, Oltvai ZN, Barabasi AL. The large-scale organization of metabolic networks. Nature. 2000;407:651–4. doi: 10.1038/35036627. [DOI] [PubMed] [Google Scholar]
- 62.Brindle JT, Antti H, Holmes E, Tranter G, Nicholson JK, Bethell HW, Clarke S, Schofield PM, McKilligin E, Mosedale DE, Grainger DJ. Rapid and noninvasive diagnosis of the presence and severity of coronary heart disease using 1H-NMR-based metabonomics. Nat Med. 2002;8:1439–44. doi: 10.1038/nm1202-802. [DOI] [PubMed] [Google Scholar]
- 63.Holmes E, Nicholls AW, Lindon JC, Ramos S, Spraul M, Neidig P, Connor SC, Connelly J, Damment SJ, Haselden J, Nicholson JK. Development of a model for classification of toxin-induced lesions using 1H NMR spectroscopy of urine combined with pattern recognition. NMR Biomed. 1998;11:235–44. doi: 10.1002/(sici)1099-1492(199806/08)11:4/5<235::aid-nbm507>3.0.co;2-v. [DOI] [PubMed] [Google Scholar]
- 64.Cheng LL, Lean CL, Bogdanova A, Wright SC, Jr, Ackerman JL, Brady TJ, Garrido L. Enhanced resolution of proton NMR spectra of malignant lymph nodes using magic-angle spinning. Magn Reson Med. 1996;36:653–8. doi: 10.1002/mrm.1910360502. [DOI] [PubMed] [Google Scholar]
- 65.Ebbels TM, Keun HC, Beckonert OP, Bollard ME, Lindon JC, Holmes E, Nicholson JK. Prediction and classification of drug toxicity using probabilistic modeling of temporal metabolic data: the consortium on metabonomic toxicology screening approach. J Proteome Res. 2007;6:4407–22. doi: 10.1021/pr0703021. [DOI] [PubMed] [Google Scholar]
- 66.Eriksson L, Antti H, Gottfries J, Holmes E, Johansson E, Lindgren F, Long I, Lundstedt T, Trygg J, Wold S. Using chemometrics for navigating in the large data sets of genomics, proteomics, and metabonomics (gpm) Anal Bioanal Chem. 2004;380:419–29. doi: 10.1007/s00216-004-2783-y. [DOI] [PubMed] [Google Scholar]
- 67.Craig A, Cloarec O, Holmes E, Nicholson JK, Lindon JC. Scaling and normalization effects in NMR spectroscopic metabonomic data sets. Anal Chem. 2006;78:2262–7. doi: 10.1021/ac0519312. [DOI] [PubMed] [Google Scholar]