Abstract
The anatomy of the larynx and trachea is well described in literature, however the intraluminal dimensions and contour of the subglottis has not been well documented. Subglottis and trachea are dynamic structures and the internal dimensions and contours have been studied only on cadavers or by plain radiograph which has many technical and measurement errors. No data is available about the internal dimensions of the subglottic and trachea in Indian population. This is the first documented study to measure the dimensions of the trachea and subglottis in Indian population. The aim of this study is to measure the internal dimensions and contour of the subglottis and upper trachea of adult Indian population. We conducted cross-sectional, observational study in a university hospital in south India to measure the dimensions of the internal subglottic and upper tracheal lumen. CT scan with 3D reconstruction with multiplanar sections was used for precise measurements. Forty-eight subjects (30 male and 18 female) who had undergone CT scan of the neck and thorax for reasons other than airway compromise were included in the study. The internal coronal diameter (CD), sagittal diameter (SD), and circumference was measured at various levels from 5 to 70 mm below the level of glottis, in the subglottis and upper trachea. Measurements of the scan for each subject were done independently by a radiologist and ENT surgeon and average of the two were documented values of each subject. These measurements were then statistically analyzed using SSPS software. The mean CD of adult Indian male ranged from 13.18 to 17.68 mm. The average intraluminal circumference ranged from 48.82 mm at the subglottis 5 mm from the glottis to a maximum of 54.96 at 30 mm. The mean CD of adult Indian female ranged from 8.7 to 15.34 mm The average intraluminal circumference ranged from 36.5 at 5 mm and a maximum of 43.05 at 70 mm. The 95% CI for the coronal, sagittal and circumference of the subglottis and upper trachea for both genders have been calculated and discussed. We have observed that the average intraluminal dimensions of the subglottis and upper trachea in south Indian population is less than that reported in western literature and earlier studies.
Keywords: Subglottis, Upper trachea, Dimensions
Introduction
In a prospective study on endotracheal intubation and laryngeal injuries done in a south Indian hospital, Rangachari et al. [1] reported an incidence of 80% having a temporary laryngeal injury and 20% having permanent sequelae. The size of the endotracheal tube has been reported to be one of the major determining factors leading to laryngotracheal injuries [1, 2]. In order to determine the endotracheal tube size to be used for intubation, first the intraluminal dimension of the subglottis and upper trachea (S&T) should be known.
X-rays and post-mortem cadaveric studies have been used in the past to measure the dimensions of the S&T, but the precise measurement of the internal dimensions and contours are difficult by these techniques. The use of CT scans with its multiplanar sections, reformats, and 3D rendering enables exact anatomical measurements of trachea and subglottis. This is the first documented study of the subglottis and upper trachea in Indian population using CT scan.
Aim
The aim of this study is to measure the internal dimension and contour of the subglottis and upper trachea of adult Indian population.
Materials and Methods
This prospective study was undertaken in a university hospital in south India after obtaining the approval of institutional ethics committee. Study was conducted over a period of 6 months from April 2009 to October 2009. Fifty-two subjects aged 18–60 years, who were advised CT scan neck and thorax, for reasons other than airway problems were included in the study. Four subjects of which three scans showed changes of COPD and one had a thyroid swelling indenting on to the trachea were excluded from the study. All scans were done in a standardized supine position during breath holding after maximum inspiration.
The following S&T measurements were done for each subject.
Coronal diameter (transverse diameter)
Sagittal diameter (anteroposterior diameter)
These measurements were done at 5, 10, 20, 30, 40, 50, 60, and 70 mm below the level of the free margins of the vocal cords.
The circumference was calculated using the formula:
 |
where r1, r2 = radii.
These measures were done independently by a radiologist and an otorhinolaryngologist using the 3D-multiplanar software which allowed accurate measurements. The average of the two measurements was taken for further statistical analysis. The age, height, and weight of each subject were also recorded. Statistical analysis was done using Microsoft excel 2007 and SSPS software.
Results and Discussion
CT scans of the neck and thorax of subjects (30 male and 18 female) were included in the study. Table 1 shows the average age, height, and weight for both males and females. All subjects were more than 18 years of age with an average of 42.7 ± 14.61 for males and 38.24 ± 14.21 for females.
Table 1.
The mean and standard deviation of height, weight, and age for both male and female subjects
| Male | Female | ||||
|---|---|---|---|---|---|
| Mean | Standard deviation | Mean | Standard deviation | ||
| Age | 42.7 | 14.613 | Age | 38.24 | 14.21 |
| Weight | 74.70 | 15.461 | Weight | 61.70 | 11.36 |
| Height | 171 | 10.09 | Height | 150.05 | 11.19 |
Table 2 shows the coronal and sagittal diameter, standard deviation, 95% confidence interval (CI) and circumference of the subglottis and upper trachea.
Table 2.
The average diameter, standard deviation, 95% CI, upper and lower limit of CI for both coronal and sagittal plane and circumference in both male and female subject
| Distance from the glottis* | Male | Female | |||||||||||||||
|---|---|---|---|---|---|---|---|---|---|---|---|---|---|---|---|---|---|
| 5 mm | 10 mm | 20 mm | 30 mm | 40 mm | 50 mm | 60 mm | 70 mm | 5 mm | 10 mm | 20 mm | 30 mm | 40 mm | 50 mm | 60 mm | 70 mm | ||
| Coronal | Diameter | 13.18 | 15.24 | 16.81 | 17.68 | 16.46 | 17.28 | 17.35 | 17.35 | 11.54 | 12.64 | 12.47 | 12.07 | 12.52 | 12.74 | 13.08 | 13.33 |
| Standard deviation | 2.30 | 2.13 | 1.50 | 2.64 | 2.48 | 2.25 | 2.34 | 3.03 | 1.97 | 1.59 | 2.51 | 1.84 | 1.73 | 2.63 | 3.37 | 2.86 | |
| 95% CI | 0.82 | 0.76 | 0.68 | 0.94 | 0.89 | 0.80 | 0.83 | 1.08 | 0.93 | 0.75 | 1.19 | 0.87 | 0.82 | 1.25 | 1.60 | 1.36 | |
| Upper limit of CI | 13.8 | 15.8 | 17.3 | 18.3 | 17.9 | 18.05 | 18.09 | 18.2 | 12.80 | 12.72 | 13.30 | 13.68 | 14.35 | 15.34 | 14.82 | 15.03 | |
| Lower limit of CI | 11.4 | 13.2 | 14.5 | 15.2 | 14.2 | 14.6 | 14.4 | 14.4 | 8.7 | 8.9 | 9.6 | 9.9 | 10.8 | 10.7 | 10.3 | 10.4 | |
| Sagittal | Diameter | 15.87 | 17.29 | 17.24 | 17.36 | 17.01 | 18.02 | 17.99 | 17.03 | 11.70 | 11.81 | 12.60 | 12.97 | 14.14 | 14.50 | 13.97 | 14.10 |
| Standard deviation | 4.43 | 3.56 | 3.04 | 3.14 | 3.53 | 3.99 | 3.85 | 2.9 | 3.56 | 2.90 | 1.96 | 1.91 | 1.68 | 2.02 | 2.18 | 2.57 | |
| 95% CI | 1.5 | 1.2 | 1.09 | 1.12 | 1.26 | 1.42 | 1.37 | 1.05 | 1.69 | 1.38 | 0.93 | 0.91 | 0.80 | 0.96 | 1.03 | 1.22 | |
| Upper limit of CI | 17.43 | 18.14 | 18.07 | 18.12 | 17.96 | 19.20 | 19.13 | 17.86 | 12.18 | 13.20 | 13.25 | 12.75 | 13.24 | 13.71 | 14.1 | 14.33 | |
| Lower limit of CI | 13.65 | 14.63 | 14.73 | 14.75 | 14.48 | 14.50 | 14.64 | 13.87 | 8.98 | 9.81 | 9.68 | 9.43 | 9.82 | 9.68 | 9.84 | 9.9 | |
| Circumference** | 45.82 | 51.19 | 53.48 | 54.98 | 52.58 | 55.46 | 55.52 | 55.22 | 36.5 | 38.1 | 38.6 | 40.2 | 42.9 | 42.8 | 42.9 | 43.05 | |
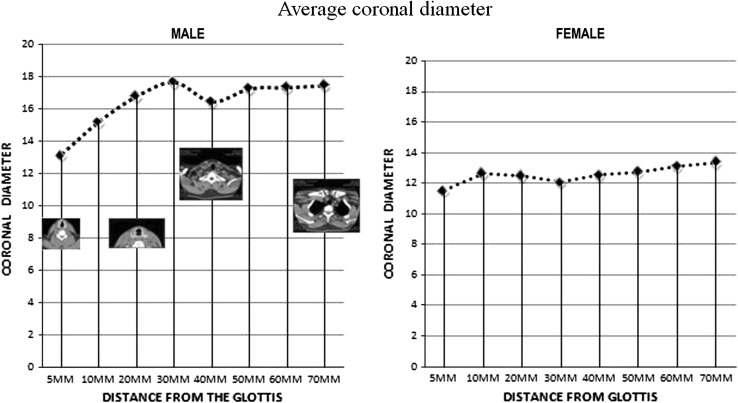
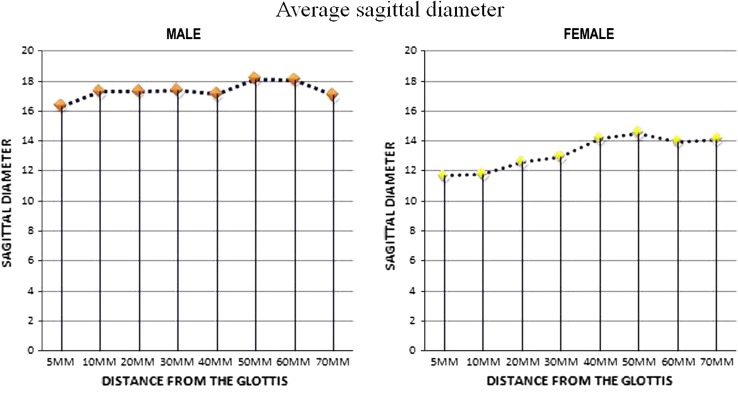
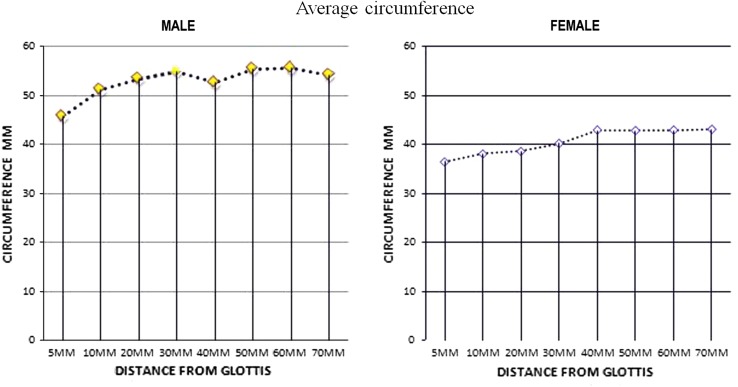
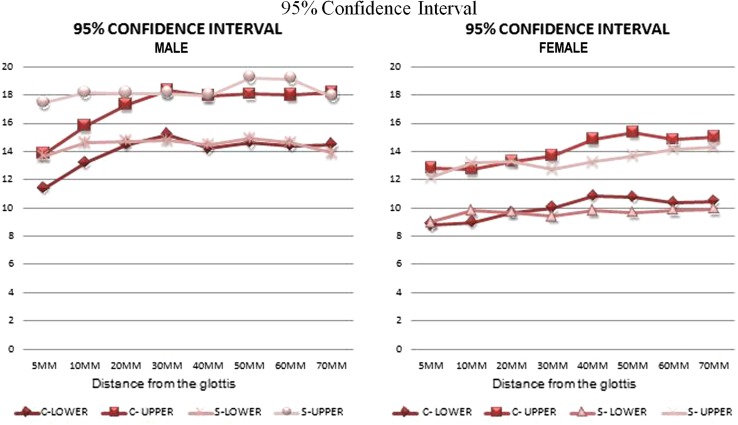
The mean CD of adult Indian male ranged from 13.18 to 17.68 mm. The minimum CD recorded was 9.3 at 5 mm below the level of glottis and a maximum of 22.8 at 30 mm. The mean SD ranged from 15.87 to 18.02 mm. The minimum SD recorded was 10.1 at 5 mm and 26.1 at 50 mm (Figs. 1, 2). The average intraluminal circumference (Fig. 3) ranged from 48.82 mm at the subglottis 5 mm from the glottis to a maximum of 54.96 at 30 mm. Assuming the normative range at two standard deviation of the normal the upper and lower limit of both the CD and SD is shown in Table 2; Fig. 4. It has been observed that the diameter and circumference is least at the subglottis which increases up to the level of 30 mm from the glottis followed by a marginal narrowing at 40 mm both in the coronal and sagittal plane. The level of 40 mm below the glottis is approximately at the thoracic inlet and during deep inspiration there is maximum pressure in this area and hence the narrowing.
Fig. 1.
Graph showing the average coronal diameter of subglottis and trachea at various distance from the glottis in both male and female subject
Fig. 2.
Graph showing the average sagittal diameter of subglottis and trachea at various distance from the glottis in both male and female subject
Fig. 3.
Graph showing the average circumference of subglottis and trachea at various distance from the glottis in both male and female subject
Fig. 4.
Graph showing the upper and lower limit of 95% confidence interval of subglottis and trachea at various distance from the glottis in both male and female subject
The mean CD of adult Indian female (Figs. 1, 2) ranged from 8.7 to 15.34 mm, with a minimum recording of 8.2 at 5 mm and a maximum of 21 at 70 mm from the glottis. The mean SD ranged from 8.3 to 14.33 mm, a minimum SD recorded was 7.7 at 5 mm from the glottis and a maximum of 19.8 at 70 mm. The average intraluminal circumference (Fig. 3) ranged from 36.5 at 5 mm and a maximum of 43.05 at 70 mm. The normative range for two standard deviation and the 95% CI is shown in Table 2.
On review of the data available on tracheal diameters[3–8]; Table 3 we found that most of the earlier studies have used three methods for measurements. First, cadaver studies using less standardized and detailed measurements have been performed. Jesseph and Merendino [4] measured the external transverse diameter of hemi-sectioned cadaver tracheas at a point ‘‘just proximal to the bifurcation’’ yielding values of 22 and 17 mm in male and female specimens, respectively. Second, studies of plain radiographs account for most of the data quoted in reference texts. Breatnach et al. [6] measured internal AP and transverse tracheal diameters on postero-anterior and lateral chest radiographs at maximal inspiration at a point 2 cm above the aortic arch. These dimensions were significantly greater in men than women. No statistically significant correlation was found between mean tracheal diameter and body weight and height.
Table 3.
Review of literature and comparison with other study
| Ref No. | Authors | No of sub | Age range | Tracheal diameter (coronal) | Tracheal diameter (sagittal) |
|---|---|---|---|---|---|
| [3] | Katz et al. | 50 | – | 13–25 | – |
| [4] | Jesseph et al. | 21 (M) | 13–86 | 15–27 | – |
| 26 (F) | 13–25 | ||||
| [5] | Greene | 60 (M) | 66.4 | 15–26 (19.7 ± 2) | 18–32 (22.5 ± 2.4) |
| [6] | Breatnach et al. | 430 (M) | 20–79 | 13–25 | 10–23 |
| 378 (F) | |||||
| [7] | Brown et al. | 40 | 18.4 | 20.1 | |
| [8] | Kamel et al. | 40 (M) | 22–88 | 20.1–34.5 (27.1 ± 3.4) | 16.8–28.6 (22.6 ± 2.9) |
| 20 (F) | 17.3–27.8 (22.9 ± 2.6) | 12.7–23.8 (19.2 ± 2.6) | |||
| Our study | – | 30 (M) | 16–60 | 11.4–18.2 (16.5 ± 2.38) | 13.6–19.2 (12.55 ± 2.31) |
| 18 (F) | 8.7–15.34 (17.34 ± 3.5) | 8.3–14.33 (13.05 ± 2.35) |
In our study, we have used CT scan as the primary modality of measuring the tracheal dimensions which has several advantages. CT Images are not magnified by divergence of the X-ray beam, the technique of acquiring the scan and measuring is more easily standardized (supine position, head in neutral position, breath-hold at maximum normal respiration, etc.), and scans can be viewed in multiple planes which further help in precise measurements. Unlike the other studies, we have measured the subglottis and upper trachea at different levels from the glottis which has enabled us to plot the contours of the subglottis and trachea. We could not find any references in literature which documented the measurements of the internal diameters of the subglottis. In Table 3 we have shown the comparison of the measurements of our study to earlier studies [3–8]. It is found that the average internal diameter in the south Indian population is less than that reported in literature. Trachea being dynamic the diameter varies with inspiration and expiration [9], the diameters is maximum during deep inspiration. Hence, in our study we have recorded the maximum diameters in all subjects. As in earlier studies [6], we found no statistically significant association between the diameter and height, weight or age of the adult subject (Table 4). Stern et al. [9] and Effmann et al. [10] have reported a definitive correlation between the tracheal diameter and height in children. Griscom et al. [11] have suggested that male trachea continues to enlarge even after the growth in height ceases.
Table 4.
Showing no correlation between height and sagittal and coronal diameter in males and female subject
| Male | Female | ||||||
|---|---|---|---|---|---|---|---|
| Height | Coronal | Sagittal | Height | Coronal | Sagittal | ||
| Height Pearson correlation sing (two-tailed) | 1 | 0.326 | 0.134 | Height Pearson correlation sing (two-tailed) | 1 | 0.194 | 0.209 |
| 0.456 | 0.401 | ||||||
| 0.079 | 0.481 | ||||||
| Coronal Pearson correlation sing (two-tailed) | 0.326 | 1 | 0.460 | Coronal Pearson correlation sing (two-tailed) | 0.194 | 1 | 0.253 |
| 0.456 | 0.328 | ||||||
| 0.079 | 0.110 | ||||||
| Sagittal Pearson correlation sing (two-tailed) | 0.134 | 0.460 | 1 | Sagittal Pearson correlation sing (two-tailed) | 0.209 | −0.253 | 1 |
| 0.401 | 0.328 | ||||||
| 0.481 | 0.110 | ||||||
In our study, the subglottic and tracheal dimensions in females were comparatively and statistically less than males this is in agreement with most of the other studies [6, 8, 11]. We have observed that the trachea being a dynamic structure the shape of the trachea varies with the part of the trachea being examined and also with the aging. The subglottis and the first tracheal rings are almost circular (20 mm) cuts, the ratio of CD and the SD is less in the extra thoracic trachea whereas in the intra thoracic trachea the CD is less than the SD as shown in table. These changes are more in male than in females. On an average there are more than three shapes observed in a single subject [12, 13]. The shape of the trachea varies even without disease and depends on the elasticity of the trachea and the intra and extraluminal pressures exerted on its walls [12, 13].
One important question which arises from our observation is whether we are using a larger size endotracheal and tracheostomy tube? Why is there a high incidence of laryngotracheal injuries in Indian population [1].
Our study has some limitations. The subjects were not healthy volunteers but patients who had been referred for CT scan of the neck and thorax. Care was taken to exclude all cases with known pulmonary and other disorders which might affect the trachea, to minimize this potential problem. The number of available chest CT scans in this study is an obvious limitation but standardized and repeated measurements were made in each scan and the overall results are unlikely to change substantially if larger numbers of subjects had been available for analysis.
Conclusion
This is the first documented demographic study of the intraluminal dimensions of the subglottis and upper trachea in India. We have observed that the intra luminal dimension in the adult Indian population is less than that reported in western literature for both genders. Hence the higher incidence of temporary laryngotracheal injuries in Indian population. We could not find any correlation between the tracheal dimension and height of an individual. This data will be useful for the radiologist, anesthetist and otorhinolaryngologist who are dealing with the disorders of the airway.
Acknowledgments
I would like to thank DSIR (TePP project), Government of India, for the funding of the project, a part of which has been utilized for this study. I thank Dr. Arun Ganesh and Dr. Harsha (Radiologist) who have been of great help during the study.
References
- 1.Rangachari V, Sundararajan I, Sumathi V, Kumar KK. Laryngeal sequelae following prolonged intubation: a prospective study. Indian J Crit Care Med. 2006;10:171–175. doi: 10.4103/0972-5229.27858. [DOI] [Google Scholar]
- 2.Hermes C, Grillo MD (2004) Surgery of the trachea and bronchi. BC Decker Inc, London, p 16
- 3.Katz I, Levine M, Herman P. Tracheobronchomegaly: the Mounier–Kuhn syndrome. Am J Roentgenol. 1962;88:1084–1094. [PubMed] [Google Scholar]
- 4.Jesseph JE, Merendino KA. Dimensional interrelationships of the major components of the human tracheobronchial tree. Surg Gynecol Obstet. 1957;105(21):210–214. [PubMed] [Google Scholar]
- 5.Greene A. “Saber-sheath” trachea: relation to chronic obstructive pulmonary disease. Am J Roentgenol. 1978;130:441–445. doi: 10.2214/ajr.130.3.441. [DOI] [PubMed] [Google Scholar]
- 6.Breatnach E, Abbott GC, Fraser RG. Dimensions of the normal human trachea. Am J Roentgenol. 1984;142:903–906. doi: 10.2214/ajr.142.5.903. [DOI] [PubMed] [Google Scholar]
- 7.Brown BM, Oshita AK, Castellino RA. CT assessment of the adult extra thoracic trachea. Comput Assist Tomogr. 1983;7(3):415–418. doi: 10.1097/00004728-198306000-00005. [DOI] [PubMed] [Google Scholar]
- 8.Kamel KS, Lau G, Stringer MD. In vivo and in vitro morphometry of the human trachea. Clin Anat. 2009;22:571–579. doi: 10.1002/ca.20815. [DOI] [PubMed] [Google Scholar]
- 9.Stern EJ, Graham CM, Webb R, Gamsu G (1993) Normal trachea during forced expiration: dynamic CT measurements. Radiology 187:27–31 [DOI] [PubMed]
- 10.Effmann EL, Fram EK, Vock P, Kinks DR (1983) Tracheal cross-sectional area in children: CT determination. Radiology 149:137–140 [DOI] [PubMed]
- 11.Griscom NT, Wohl ME. Dimensions of the growing trachea related to age and gender. Am J Roentgenol. 1986;146:233–237. doi: 10.2214/ajr.146.2.233. [DOI] [PubMed] [Google Scholar]
- 12.Hermes C, Grillo MD (2004) Surgery of the trachea and bronchi. BC Decker Inc, Kimberton, p 43
- 13.Standring S, editor. Gray’s anatomy. 40. Philadelphia: Churchill Livingstone/Elsevier; 2008. pp. 1000–1005. [Google Scholar]


