

Abstract
Two major mechanisms have been causally implicated in the establishment of cellular senescence: the activation of the DNA damage response (DDR) pathway and the formation of senescence-associated heterochromatic foci (SAHF). Here we show that in human fibroblasts resistant to premature p16INK4a induction, SAHF are preferentially formed following oncogene activation but are not detected during replicative cellular senescence or on exposure to a variety of senescence-inducing stimuli. Oncogene-induced SAHF formation depends on DNA replication and ATR (ataxia telangiectasia and Rad3-related). Inactivation of ATM (ataxia telangiectasia mutated) or p53 allows the proliferation of oncogene-expressing cells that retain increased heterochromatin induction. In human cancers, levels of heterochromatin markers are higher than in normal tissues, and are independent of the proliferative index or stage of the tumours. Pharmacological and genetic perturbation of heterochromatin in oncogene-expressing cells increase DDR signalling and lead to apoptosis. In vivo, a histone deacetylase inhibitor (HDACi) causes heterochromatin relaxation, increased DDR, apoptosis and tumour regression. These results indicate that heterochromatin induced by oncogenic stress restrains DDR and suggest that the use of chromatin-modifying drugs in cancer therapies may benefit from the study of chromatin and DDR status of tumours.
Introduction
Cellular senescence is a permanent proliferative arrest triggered by exogenous or endogenous stresses1, 2, 3. Cellular senescence is induced by telomere shortening or dysfunction4, 5, 6, DNA-damaging agents7 or oncogene activation8. Oncogene-induced senescence (OIS) acts as a tumour suppressor mechanism in premalignant lesions9, 10, 11, 12, 13, 14, 15, 16. DDR activation is thought to enforce cellular senescence by imposing a permanent checkpoint4, 17, 19. During cellular senescence, global induction of heterochromatin results in SAHF structures20, 21, 22 the formation of which depends on ASF1 (anti-silencing function 1) and HIRA (histone cell cycle regulation defective homologue A)23, 24, and p16INK4a (refs 20,25). SAHF are highly condensed and heterochromatic chromosomes that are proposed to enforce cellular senescence by suppressing the transcription of genes involved in proliferation20, 26, 27. Although DDR and SAHF have both been causally implicated in the establishment of cellular senescence, their relationship remains undefined. Therefore, we investigated their potential interplay in senescence and cancer.
Results
SAHF are preferentially associated with oncogene-induced DNA replication stress
First, we tested whether DDR and global induction of heterochromatin in the form of SAHF are universal features of the senescent state induced by different genotoxic stimuli. We used human skin fibroblasts (BJ cells) that are genetically stable and resistant to culture stress and premature p16INK4a induction28, 29. We analysed BJ cells that had become senescent following H-RasV12 expression (OIS), telomere shortening, exposure to ionizing radiation and treatment with H2O2 or hydroxyurea. All of these stimuli induced senescence to the same extent, as demonstrated by comparable low BrdU (5-bromo-2-deoxyuridine) incorporation rates, high senescence-associated-β-galactosidase (SA-β-Gal) activity and widespread and sustained DDR (Supplementary Fig. S1a–c). In contrast, when cells were stained with DAPI (4,6-diamidino-2-phenylindole) and with antibodies specific for known heterochromatic SAHF components, such as the trimethylated form of Lys 9 on histone H3 (H3K9me3), heterochromatin protein 1 (HP1γ) and high mobility group A2 (HMGA2)20,25, OIS cells clearly had SAHF, whereas other senescent cells showed a diffuse nuclear pattern, similar to that observed in proliferating cells (Fig. 1a). Consistently, p16INK4a, previously implicated in SAHF formation20, 25, was induced in OIS cells only (Supplementary Fig. S1d). Immunoblotting analyses confirmed that H3K9me3 and HP1γ protein levels are both increased only in OIS cells (Fig. 1b), with the sole exception of H3K9me3, which increases following hydroxyurea treatment, in the absence of detectable SAHF formation and HP1γ induction. Similar observations were made when testing a different human fibroblast cell line derived from fetal lung tissue (MRC5, Supplementary Fig. S1e–g). Additionally, senescence induced by repeated and prolonged exposure to ionizing radiation or etoposide (a topoisomerase inhibitor) did not result in SAHF formation (Fig. 1c, Supplementary Fig. S1h, i). Therefore, cellular senescence can be established in the absence of overt induction of heterochromatin and SAHF formation which, in cell lines resistant to unscheduled p16INK4ainduction, are formed preferentially on oncogene expression. Oncogene activation alters DNA replication leading to DDR activation and senescence establishment14, 18. Thus, we tested whether SAHF formation in OIS requires DNA replication by expressing H-RasV12 in human fibroblasts which were either proliferating or rendered quiescent by contact inhibition. Despite comparable levels of Ras expression (Supplementary Fig. S2a), SAHF form in proliferating cells, but do not form in quiescent cells (Fig. 2a). Similarly, cells arrested in G1 by aphidicolin treatment (a DNA replication inhibitor) do not form SAHF on Ras expression (Supplementary Fig. S2b). A key factor involved in the response to DNA replication stress is ATR30. To test the role of ATR in SAHF formation, we expressed oncogenic Ras in ATR-depleted cells. We discovered that stable and transient ATR knockdown by RNA interference (Fig. 2b, c) does not induce SAHF formation following Ras expression as detected by a lack of heterochromatic foci, assessed by DAPI staining and immunofluorescence microscopy performed with antibodies against H3K9me3 and HMGA2 (Fig. 2d, e), and a lack of H3K9me3 accumulation, as assessed by immunoblotting (Fig. 2f). Therefore, oncogene-induced SAHF formation is DNA-replication dependent and is controlled by ATR, suggesting it is among the outcomes of oncogene-induced DNA replication stress.
Figure 1. SAHF are preferentially formed on oncogene-induced senescence in human normal fibroblasts.

(a) Immunostaining microscopy of SAHF markers (H3K9me3, HP1γ and HMGA2) in human fibroblasts (BJ cells) after induction of senescence through exposure of cells to different genotoxic stimuli. SAHF are preferentially detected in OIS cells. Numbers indicate percentage of SAHF-positive cells (means ± s.e.m.).; n = 3. Cell treatments: E.V., cells transfected with empty vector; OIS, oncogene-induced senescence through H-RasV12 expression; Tel Sen, telomere shortening; IRR Sen, ionizing radiation; H2O2 Sen, treatment with H2O2; HU Sen, hydroxyurea treatment. (b) Immunoblot analysis of heterochromatic markers in BJ cells exposed to the indicated treatments. Heterochromatic markers accumulate preferentially in OIS cells. Histone H3 is used as a loading control. (c) Representative immunofluorescence microscopy images of SAHF markers (H3K9me3, HP1γ and HMGA2) in BJ cells treated as indicated. Q, quiescent cells; IRR Sen indicates repeated exposure to ionizing radiation, Etop Sen, chronic treatment with etoposide. SAHF markers accumulate preferentially in OIS cells but not in cells repeatedly exposed to irradiation or chronically treated with etoposide. Numbers indicate percentage of SAHF-positive cells (means ± s.e.m.); n = 3. Scale bars, 10 μm. Uncropped images of blots are shown in Supplementary Fig. S9.
Figure 2. SAHF formation requires DNA replication and is dependent on ATR.

(a) Oncogene-induced SAHF accumulation, as detected by immunostaining for H3K9me3, in proliferating (left) and quiescent (right) cells. Oncogene-induced SAHF accumulation requires DNA replication. Numbers indicate percentage of SAHF-positive cells (means ± s.e.m.); n = 3. (b, c) Immunoblot analysis shows the efficiency of stable ATR knockdown in cells with ATR shRNA (b) or ATR siRNA (c) and expressing Ras as indicated. GFP siRNA is a control and vinculin is used as a loading control. (d) Immunostaining microscopy of H3K9me3 and HMGA2 shows that on stable depletion of ATR (bottom) Ras-induced SAHF formation is impaired. Numbers indicate percentage of SAHF-positive cells (means ± s.e.m.); n = 3. (e) Formation of SAHF containing HMGA2 is impaired in oncogene-expressing cells on transient ATR downregulation by siRNA. GFP siRNA was used as a control. Numbers indicate percentage of SAHF-positive cells (means ± s.e.m.); n = 3. Scale bars, 10 μm. Uncropped images of blot are shown in Supplementary Fig. S9. (f) Immunoblot analysis reveals a reduced induction of H3K9me3 in ATR-deficient oncogene-expressing cells. Oncogenic Ras is expressed at comparable levels in empty vector and ATR-deficient oncogene-expressing cells. Histone H3 is used as a loading control. E.V.; cells transduced with empty vector. Uncropped images of blots are shown in Supplementary Fig. S9.
Proliferating oncogene-expressing cells display heterochromatin induction and express E2F-target genes
Inactivation of key DDR genes ATM and p53 allows oncogene-expressing cells to avoid cellular senescence14, 18, 31. The impact of their inactivation on heterochromatin and SAHF formation is unclear. We analysed the levels of heterochromatic markers in oncogene-expressing cells following the suppression of either ATM or p53. Surprisingly, we found that the induction of heterochromatic markers is retained in proliferating Ras-expressing cells to an extent similar to OIS cells (Fig. 3a), suggesting that increased heterochromatin formation induced by oncogenic stimuli is independent of the proliferative or senescent state of the cells. Furthermore, single-cell analysis by confocal microscopy imaging of DAPI and heterochromatin staining in DDR-deficient oncogene-expressing cells revealed the widespread presence of nuclear heterochromatic structures morphologically resembling SAHF, as quantified by the use of three independent markers and by the extent of nuclear staining dishomogeneity (Fig. 3b and Supplementary Fig. S2c–e). Notably, efficient DNA replication, as indicated by BrdU incorporation and expression of DNA replication factors (minichromosome maintenance 6, MCM6), can be detected in DDR-deficient oncogene-expressing cells retaining heterochromatin induction (Fig. 3b, c).
Figure 3. Increased heterochromatin in DDR-deficient oncogene-expressing cells is compatible with cellular proliferation.

(a) Immunoblot analyses of heterochromatic markers in OIS cells (left) and in proliferating DDR-deficient oncogene-expressing cells (right). Percentage of BrdU-positive cells is indicated (bottom). (b) Confocal microscopy imaging of DAPI and heterochromatin staining in OIS cells and proliferating DDR-deficient oncogene-expressing cells. Single-cell analysis reveals ongoing DNA replication, as detected by BrdU incorporation, in DDR-deficient oncogene-expressing cells displaying DAPI-dense and H3K9me3-enriched regions resembling SAHF structures. (c) Single-cell immunofluorescence microscopy analyses of MCM6 staining in OIS cells and proliferating DDR-deficient oncogene-expressing cells. MCM6 is present in proliferating DDR-inactivated oncogene-expressing cells bearing high levels of heterochromatin. Numbers indicate percentage of SAHF-positive cells (means ± s.e.m.); n = 3. Scale bars, 10 μm. Uncropped images of blots are shown in Supplementary Fig. S9.
Overall, these results demonstrate that inactivation of senescence-enforcing DDR genes, such as ATM and p53, allows the proliferation of oncogene-expressing cells bearing increased levels of heterochromatin markers, and indicate that heterochromatin induction may be a general indicator of oncogene activation.
SAHF formation in OIS cells has been proposed to promote the stable repression of E2F-target genes that drive cell proliferation20. To investigate whether the oncogene-induced increase in heterochromatin, observed in proliferating ATM- or p53-inactivated cells, is associated with transcriptional repression of proliferative genes, we analysed the mRNA expression levels of E2F-target genes, such as minichromosome maintenance complex 6 (MCM6), proliferating cell nuclear antigen (PCNA) and cyclin A2 (CCNA2), by real-time quantitative PCR (qPCR). As expected, OIS leads to transcriptional repression of these E2F-target genes (Fig. 4a). However, consistent with the observed cell proliferation, these same genes are not repressed in ATM- or p53-inactivated oncogene-expressing cells. MCM6 protein detection in individual cells confirms the mRNA data (Fig. 3c). Furthermore, we performed chromatin immunoprecipitation (ChIP) with antibodies against H3K9me3 to test for the presence of this repressive chromatin mark at the promoters of E2F-target genes and understand the mechanisms regulating the expression of these genes. Consistent with previous reports20, H3K9me3 accumulates at transcriptionally repressed E2F-target gene promoters in OIS cells; however it is lost on inactivation of either ATM or p53 (Fig. 4b). Therefore, inactivation of key DDR genes prevents OIS establishment and the accumulation of heterochromatic marks at specific E2F-target genes, which allows their expression without detectably impacting on the global heterochromatin increase induced by activated oncogenes.
Figure 4. E2F target genes are not repressed by heterochromatin induction in DDR-deficient oncogene-expressing cells.
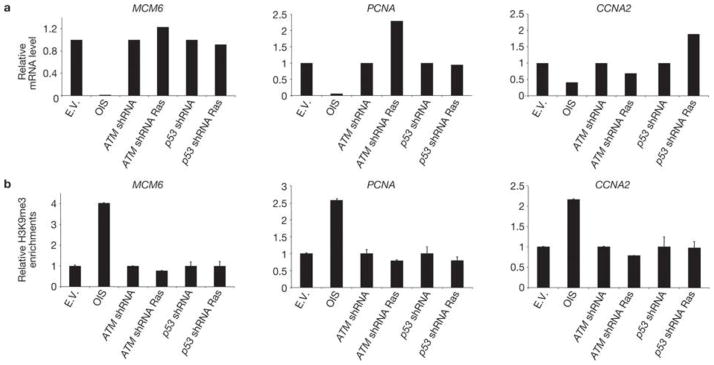
(a) qRT–PCR analyses show that, despite increased global heterochromatin, E2F-target genes (MCM6,PCNA and CCNA2) are not repressed in DDR-deficient oncogene-expressing cells. mRNA levels were normalized to the levels in cells transduced with empty vector. (b) Quantitative ChIP results for H3K9me3 from the promoter regions of three E2F-target genes analysed in a. H3K9me3 levels are expressed as a percentage of the non-immunoprecipitated DNA (input), normalized to the percentage of the total immunoprecipitated histone H3 (to correct for nucleosome variations) and further normalized to the levels in cells transduced with empty vector. These results are representative of three independent experiments.
Oncogene-expressing transformed cells and human tumours display heterochromatin induction
The maintenance of global heterochromatin induction in proliferating oncogene-expressing cells prompted us to investigate heterochromatin levels in transformed cells and human cancer specimens. We observed that transformed human fibroblasts expressing oncogenic Ras, hTERT and the SV40 early region (ELR)32 display high levels of heterochromatin markers organized in nuclear structures (Supplementary Fig. S2f–h). Consistent with our observations in ATM or p53 knocked-down cells expressing oncogenic Ras, these transformed cells also expressed E2F-target genes and had reduced levels of H3K9me3 at their promoters (Supplementary Fig. S2i, l). To determine whether heterochromatin induction is associated in vivo with oncogenic events, we analysed two types of tissues: a normal respiratory epithelium that had probably undergone X-ray-induced cellular senescence (as suggested by persistent γH2AX staining one year after treatment; Supplementary Fig. S3a) and, as a model of oncogene-induced stress, untreated head and neck squamous cell carcinomas (HNSCC). Although we found detectable heterochromatin induction organized in structures resembling SAHF in HNSCC samples, we failed to detect similar structures in the irradiated normal tissue (Supplementary Fig. S3b). Together, these results indicate that global heterochromatin induction is associated with oncogenic events, retained in human transformed cells and is present in vivo in tumoral specimens.
We next examined heterochromatin levels in lung, colon, and head and neck cancer samples, and compared them to their normal counterparts. We observed significantly increased H3K9me3 expression in tumours, compared with normal tissues (Fig. 5a, b). Similarly, studies in the Oncomine database33 indicate a consistent upregulation of HP1γ, HP1β, HMGA1 and HMGA2 in several tumour types (Fig. 5c). Neither H3K9me3 nor HP1γ correlate with a decrease in Ki67 expression, a marker of proliferation, in any of the three tumour types we analysed (Fig. 5d). Indeed, single-cell analysis of HNSCC revealed Ki67 expression in H3K9me3- or HP1γ-positive cells (Fig. 5e,Supplementary Fig. S3c), suggesting that also in tumour samples heterochromatin induction does not affect the expression of proliferative genes.
Figure 5. Increased heterochromatin is retained in human tumours in vivo in different stages of cancer progression.

(a) Immunohistochemistry analysis of lung, colon (scale bars, 200 μm) and HNSCC (scale bars, 100 μm) samples. Tumoral sections show increased accumulation of H3K9me3, compared with normal epithelium. (b) Box plots indicate the percentage of H3K9me3-positive cells in normal epithelium (left box) and tumour samples (right box). Error bars represent 95% confidence intervals. For all cancer types, P < 0.001 for normal versus tumoral tissues; Mann-Whitney test was used for this analysis. Lung, n = 42; colon, n = 20; head and neck, n = 15. The data for the box plots derive from the immunohistochemical analyses in a. (c) Summary of HP1γ, HP1β, HMGA1 and HMGA2 expression analyses using data from the Oncomine database. Heterochromatin components are upregulated in several human cancers, compared with normal tissues. Numbers in the table indicate numbers of studies with a threshold of P < 0.0001 for normal versus tumoral tissues and with a threshold of expression fold change ≥ 2. Genes are further classified according to expression fold change. The percentage indicates whether the fold change in the expression of the gene is included among 1%, 5% or 10% of the genes most upregulated or downregulated. Increase or decrease is visualized by the colour code. Note: an analysis may be counted in more than one cancer type. (d) Scatter plots indicate the correlation between Ki67 expression and H3K9me3 (top) and HP1γ (bottom) expression, in colon, lung and HNSCC cells. P values (> 0.05 in all cases) and Spearman Correlation (rho) are indicated. (e) Immunofluorescence microscopy of heterochromatin markers at single-cell level in HNSCC samples. H3K9me3- or HP1γ-positive structures can be seen in Ki67-expressing cells. Scale bars, 4 μm. (f) H3K9me3 expression in colon and lung carcinomas at different stages. Histograms indicate that H3K9me3 expression in colon and lung carcinomas is not reduced at more advanced stages. H3K9me3 expression is significantly increased in stage III colon carcinomas in comparison to stage I cases (Asterisk indicates P < 0.05, One-way ANOVA). No statistical significant differences were detected among the tumoral stages in lung cancer. (g) Histograms indicate the progressive loss of wild-type p53 or the progressive increase of p53 mutant cases in later stages of colon and lung carcinomas. Colon, n= 21; lung, n = 66.
In agreement with our observations that heterochromatin formation is dependent on oncogene-driven DNA-replication stress, along with the reported induction of CDC6 by oncogenes and the ability of CDC6 to induce DNA replication stress in vitro14, we found that heterochromatin formation in colon and lung cancers positively correlates with CDC6 expression levels (Supplementary Fig. S3d).
Based on studies in the haematopoietic system12, heterochromatin formation has been proposed to be a tumour-suppressive mechanism. According to this model, heterochromatic markers would be expected to be downregulated or lost during cancer progression. Instead, H3K9me3 staining is not reduced with increasing tumour stage in lung or colon cancer (Fig. 5f), whereas p53 inactivation is observed in the same tumours (Fig. 5g). In addition, heterochromatic markers inversely correlate with γH2AX levels in HNSCC and colon cancer samples (Supplementary Fig. S3e, f). Overall, these data indicate that induction of heterochromatin is compatible with cell proliferation in human tumours and is maintained, or even increased, during tumour progression.
Oncogene-induced heterochromatin restrains DDR signalling
We wanted to understand the molecular mechanisms responsible for the maintenance of elevated levels of heterochromatin during tumour progression. Previous reports suggested that heterochromatin poses a barrier to DDR signalling34, 35, 36, 37, 38, 39. We reasoned that global heterochromatin formation induced by oncogene activation may modulate DDR signalling.
Therefore, we investigated the relationship between heterochromatin structures triggered by oncogene activation and DDR foci in the nuclear space of oncogene-expressing cells. In OIS cells, we observed that γH2AX foci and SAHF coexist in the same cell but do not colocalize (Fig. 6a).γH2AX foci are preferentially proximal to, but excluded from, SAHF. The observed lack of γH2AX staining in SAHF is not due to impaired antibody accessibility, as histone H2AX is readily detectable in heterochromatin regions. Line traces drawn through OIS cells revealed a sharp inverse correlation between γH2AX signal intensity and heterochromatic domains, suggesting that SAHF exclude γH2AX foci. Similarly, we observed that the DNA damage sensors RAD50 and NBS1, components of the MRE11–RAD50–NBS1 complex, and the activated form of ATM (ATM phosphorylated at Ser 1981) are also excluded from SAHF (Fig. 6b–d). Thus, we hypothesized that by hindering access of DNA-damage sensors and associated DDR factors, oncogene-induced heterochromatin can restrain DDR signalling in oncogene-expressing cells. To test this hypothesis, we studied the effects of heterochromatin perturbation in OIS and Ras-transformed ELR cells. We treated OIS, ELR and control fibroblasts with a small-molecule inhibitor of SUV39 methyltransferase (SUVi), the key enzyme involved in H3K9 methylation40, 41. As expected, SUVi reduces H3K9 trimethylation and perturbs heterochromatin structures (Fig. 7a, d). We observed a significant increase in intensity of γH2AX foci (Fig. 7b, c) and their progressive detection within DAPI-stained regions (Supplementary Fig. S4a, b). Similarly, on heterochromatin perturbation, NBS1 and pATM foci are not excluded from DAPI-dense regions (Supplementary Fig. S4d, f). Increased γH2AX was confirmed by immunoblotting analysis (Fig. 7d). These results suggest that inactivation of the main enzyme responsible for H3K9me3 is sufficient to boost DDR signalling and to allow access of DDR factors to chromosomal regions otherwise precluded. This effect is specific to oncogene-expressing cells and occurs both in OIS and transformed cells. Importantly, increased DDR signalling is not limited to sites of DNA damage because diffusible DDR factors are also affected, as demonstrated by increased phosphorylation of p53 on Ser 15, an activating event mediated by ATM–ATR (Fig. 7d).
Figure 6. SAHF and DDR markers coexist in OIS cells but do not colocalize.
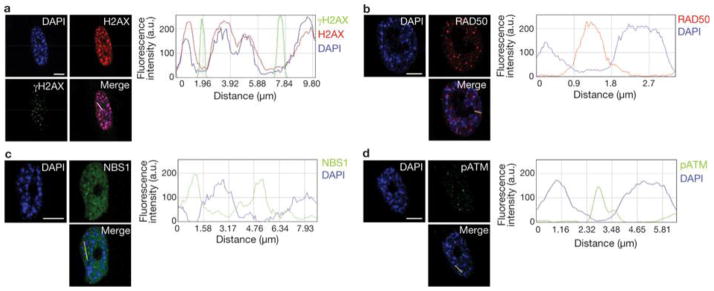
(a) Left: DAPI staining and immunostaining for H2AX and γH2AX in OIS cells. Right: quantification of DAPI, H2AX and γH2AX signal intensity across the indicated line in the merge image. Line traces were generated with the line drawn through the brightest DAPI-dense regions. Heterochromatin and γH2AX do not colocalize. (b–d) Left: DAPI staining and immunostaining for RAD50 (b), NSB1 (c) and pATM (d). Right: quantification of DAPI, and RAD50, NSB1 and pATM signal intensity across the indicated lines in the merge images. Line traces were generated with the line drawn through the brightest DAPI-stained regions. SAHF do not colocalize in OIS cells with the DNA-damage sensors RAD50, NBS1 and pATM. DAPI staining and immunostaining in OIS cells reveal that DDR factors are excluded from SAHF. Scale bars, 10 μm.
Figure 7. Heterochromatin induction restrains oncogene-induced DDR signalling.

(a) SUVi treatment results in loss of H3K9me3 foci. Representative immunofluorescence microscopy images of OIS cells without (left) or with (right) SUVi treatment, and incubated with DAPI and antibodies against H3K9me3. Numbers indicate percentage of SAHF-positive cells (means ± s.e.m.); n = 3. Scale bars, 10 μm. (b) Heterochromatin perturbation by SUVi in oncogene-expressing cells leads to increasedγH2AX signalling in OIS and ELR cells, as detected by immunofluorescence microscopy. E.V. and OIS scale bars, 100 μm; ELR scale bars, 30 μm. (c) Quantification of the integrated intensity of γH2AX per individual focus in control and oncogene-expressing cells on SUVi treatment, as evaluated by high-throughput microscopy. Black bars indicate mean values. OIS versus OIS SUVi and ELR versus ELR SUVi; P < 0.001; pairwise Mann-Whitney, non-parametric test, Benjamini Hochberg P-value adjustment. (d) Immunoblotting analysis of levels of γH2AX and p53 phosphorylated at Ser 15 (p53pS15) in the indicated cells. Heterochromatin perturbation by SUVi leads to increased DDR signalling in oncogene-expressing cells. H3K9me3 antibody is used as a control for SUV39h1 methyltransferase inhibition. H2AX and vinculin are used as loading controls. Uncropped images of blots are shown in Supplementary Fig. S9.
To exclude off-target or indirect effects of SUVi, we suppressed the expression of SUV39h1 or HP1γ, the heterochromatin protein that specifically recognizes H3K9me3 (ref. 42), by RNA interference. Suppression of either SUV39h1 or HP1γ preferentially increases DDR signalling in oncogene-expressing cells (Supplementary Fig. S5a–e). Therefore, we conclude that heterochromatin perturbation leads to an increase of DDR signalling in oncogene-expressing cells. As heterochromatin induction is specifically associated with oncogenic events and is not lost during cancer progression, we reasoned that it could represent an attractive target for cancer therapy in that, by boosting DDR signalling pathways, heterochromatin perturbation may cause apoptosis of tumour cells. At present, SUVi have not been developed for clinical use; however, another class of chromatin-modifying agents, histone deacetylase inhibitors (HDACi), are currently considered promising anticancer drugs43, although their mechanisms of action are still unclear44. In addition, HDAC1 is known to drive the assembly of heterochromatin complexes and heterochromatin induction during cellular senescence45. We therefore tested the effects of the HDACi valproic acid (VPA) on heterochromatin in oncogene-expressing fibroblasts. VPA treatment increased γH2AX signalling in oncogene-expressing cells, but not in control cells, in association with increased histone acetylation, oncogene-induced heterochromatin perturbation and loss of exclusion of DDR factors from SAHF (Supplementary Fig. S5f–i and S4c, e, g).
We then tested the effects of VPA on an in vitro model relevant for cancer studies: mammary epithelial cells (MCF10a) expressing oncogenic Ras or infected with a control empty vector. As expected, oncogenic Ras induced focal accumulation of increased H3K9me3 levels as detected by immunostaining (Supplementary Fig. S6a). Also in this system, VPA treatment increases γH2AX signalling in proliferating oncogene-expressing cells, but not in normal epithelial cells (Fig. 8a, c). Strikingly, increased DDR signalling leads to the activation of the apoptotic programme and specific elimination of oncogene-expressing cells, sparing cells that do not express an oncogene (Fig. 8b, c). We next tested the impact of heterochromatin perturbation in the human colon cancer cell line HCT116 carrying an activating mutation in the K-Ras gene. These cancer cells display dense nuclear heterochromatic signals, as detected by microscopy using DAPI and H3K9me3 staining, and accumulate heterochromatin markers to an extent similar to oncogenic RAS-expressing cells (Supplementary Fig. S6b, c). On treatment in vitro with HDACi and either VPA or panobinostat (a HDACi currently in phase II clinical trials46), HCT116 cells show perturbation of oncogene-induced heterochromatic structures (Supplementary Fig. S6d), increased DDR signalling and subsequent induction of apoptosis (Supplementary Fig. S7a–g). Importantly, HDACi treatment does not induce DNA damage per se as tested by TUNEL (terminal deoxynucleotidyl transferase dUTP nick end labelling) and comet assays (Supplementary Fig. S7h, i) and does not affect gene expression of key DDR components H2AX and ATM (Supplementary Fig. S7l). We next used this human cancer cell line as a xenograft model and implanted untreated HCT116 cells subcutaneously in immunodeficient mice and allowed tumours to form. Mice were then treated with panobinostat or vehicle. Whereas the tumour mass grew exponentially in vehicle-treated mice, HDACi treatment led to a dramatic reduction of tumour growth (Fig. 8d). Analysis of the residual tumour revealed that HDACi treatment increased histone acetylation, γH2AX accumulation and apoptosis (Fig. 8e, f and Supplementary Fig. S8a). Therefore, HDACi treatment, by increasing DDR signalling and apoptosis, induces in vivo regression of the tumoral mass. Importantly, this treatment had no obvious detrimental effects on mice, as assessed by measurement of body weight and grooming (data not shown).
Figure 8. Oncogene-induced heterochromatin formation prevents apoptosis by restraining oncogene-induced DDR signalling.

(a) Immunofluorescence microscopy of MCF10a cells expressing Ras and treated with VPA as indicated. Heterochromatin perturbation by valproic acid (VPA, a HDACi) in oncogenic Ras-expressing MCF10a breast epithelial cells leads to increased γH2AX signalling. (b) FACS analysis of the sub-G1 fraction of MCF10a cells reveals increased apoptosis specifically in proliferating oncogene-expressing epithelial cells treated with VPA. In cells treated with VPA there is increased apoptosis specifically in proliferating oncogene-expressing epithelial cells. (c) Immunoblot analysis shows increased DDR activation and induction of cleaved caspase3 in oncogene-expressing MCF10a cells, compared with control cells, following VPA treatment. Acetylated H4 is used as a control for efficacy of VPA treatment. Histone H3 and histone H2AX are used as loading controls. (d) Tumour volumes of an in vivo colon cancer tumour xenograft treated with panobinostat, a HDACi. Panobinostat treatment leads to growth inhibition and regression of tumour volumes. Vehicle-treated tumours keep proliferating as shown by growth curve indicating the tumour growth of vehicle- or panobinostat-treated mice. Data are means ± s.e.m.; n = 7; P < 0.02, treated versus control, two tailed t-test. (e, f) Quantification of γH2AX- and cleaved caspase-3-positive cells as detected by immunohistochemistry analysis of colon tumour cells of vehicle- or panobinostat-treated mice. Data are means ± s.e.m., n = 3. (g–i) Quantification of TUNEL-positive HCT116 cells following H2AX knockdown (g), ATM-knockdown (h) and treatment with ATM inhibitor (i). Following HDACi treatment there is a reduced induction of apoptosis in cells with H2AX and ATM knockdown, and in cells treated with ATM inhibitor. Data are means ± s.e.m.; n = 3. (j) Proposed model of the events following oncogene activation. Oncogene activation through DNA-replication stress leads to OIS associated with DDR activation, global induction of heterochromatin (HCR) and SAHF formation. SAHF restrains DDR activity. DDR inactivation allows proliferation and transformation of oncogene-expressing cells maintaining heterochromatin induction. Heterochromatin perturbation, relieving heterochromatin inhibitory effect on DDR, increases DDR signalling and leads to apoptosis. Scale bars, 10 μm. Uncropped images of blots are shown in Supplementary Fig. S10.
Finally, we tested the dependency on DDR genes on the observed HDACi-induced apoptosis. H2AX or ATM knocked-down HCT116 cells and controls were exposed to HDACi. DDR-inactivated cells displayed a reduced induction of apoptosis, as detected by both TUNEL assay and single-cell detection of the activated form of caspase 3 (Fig. 8g, h and Supplementary Fig. Sb–g). This is consistent with a previous study47. ATM kinase activity is required, as a specific ATM kinase activity inhibitor causes a decrease in apoptosis in HCT116 cells treated with HDACi (Fig. 8i and Supplementary Fig. S8h-l).
Discussion
In summary, our results show that global heterochromatin induction is a general hallmark of oncogene-induced stress that is retained following DDR inactivation, transformation and throughout human cancer progression. Heterochromatin perturbation in oncogene-expressing cells enhances DDR signalling culminating in cell death by apoptosis (see model in Fig. 8l).
The initiating event that leads to SAHF formation and global induction of heterochromatin is presently unclear. p16INK4a has been shown to have a causative role in SAHF formation20, 25. Although p16INK4a is consistently induced in OIS, culture stress contributes to its accumulation in some human fibroblast strains undergoing replicative senescence28. In strains resistant to this kind of stress, senescence triggered by telomere shortening is associated with low p16INK4a levels and strongly impaired SAHF formation, as we and others have observed20. These in vitro observations are consistent with the reported absence of SAHF formation in fibroblasts obtained from the skin of aged primates that display persistent DNA damage accumulation at telomeres48 (U. Herbig, personal communication). These observations are also consistent with the altered chromatin status, including reduced expression of heterochromatic markers, in human fibroblasts from normally aged individuals and from Hutchinson–Gilford progeria syndrome (HGPS) patients49.
The induction of SAHF following the sole expression of CDC6—a positive DNA-replication regulator induced by several oncogenes18—in vitro14 and, as reported here, the correlation between heterochromatin markers and CDC6 levels in human tumours and DNA replication-dependent formation of SAHF in a manner controlled by ATR, all seem to suggest a causal link between oncogene-altered DNA replication and SAHF formation. Intriguingly, both CDC6 and components of the origin recognition complex bind to and colocalize with HP1 (ref. 50), and topological and chromatin regulators involved in the DNA replication process, such as topoisomerase 1 (ref. 51) and ASF1 (ref. 52), are also essential for SAHF formation53. Moreover, activation of ATR in the absence of DNA damage has been proposed to be sufficient for SAHF formation54.
Consistent with the notion that transformed and ATM- or p53-inactivated oncogene-expressing cells are continuously exposed to DNA replication stress18, 14, 31, we detected heterochromatin induction in these proliferating oncogene-expressing cells. These results also show that global heterochromatin induction is compatible with the transcription of proliferative genes and suggest the involvement of DDR pathways in the control of heterochromatic repressive marks on their promoters. This is in agreement with the recently demonstrated role of ATM in the modulation of the growth-suppressive functions of E2F1 in osteosarcomas55.
Oncogene-induced heterochromatin has been proposed to restrain cell proliferation20 and indeed SUV39h1 has tumour-suppressive functions in mice12. However, the same authors point out that this may be limited to the haematopoietic system12, 20. SUV39h1 has also been reported to be upregulated in colon cancer56 and, in agreement with several studies reported in Oncomine database33, we and others57 have observed increased expression of heterochromatic markers in proliferating tumour samples. These findings, consistent with the lack of reported widespread inactivating mutations of genes encoding heterochromatin factors during cancer progression, may indicate additional unexplored roles for heterochromatin induction in tumorigenesis.
Heterochromatin has been reported to pose a barrier to DDR signalling34, 35, 36, 37, 38, 39. In Drosophila, HP1 prevents DDR activation at chromosome ends58 and in mammals it modulates DDR activation59 and ASF1 inactivates DDR60. These results are consistent with a model in which oncogene-induced heterochromatinization has a role in restraining DDR signalling pathways. Oncogene-induced heterochromatin may both restrain the access of DNA damage sensors to DNA lesions and impair local signal amplification, thus preventing the formation of detectable DDR foci.
Our observations that heterochromatin perturbation increases DDR signalling, specifically the ATM branch, and induces apoptosis suggest that heterochromatin induction contributes to preserve cell viability in oncogene-expressing cells. Chromatin modulation may therefore be exploited therapeutically to boost the DDR caused by oncogene activation, leading to cell death. Thus, our results suggest an additional mechanism for the observed efficacy of HDACi in cancer therapy, especially in solid tumours43, 44, and provide elements for critical consideration of their use in combination with DDR inhibitors. Next generation HDACi are now being developed to overcome current limitations in the pharmacological properties of the approved drugs and to achieve better clinical results, also in combination with additional epigenetic interventions, as recent clinical trials with improved therapeutic effect suggest44. Our results indicate that treatment of oncogene-expressing cells with therapies aimed at heterochromatin alteration may benefit from the analysis of DDR activation and epigenetic status of the tumour.
Methods
Cell Culture and treatments
Early passage BJ, MRC5, MCF10a, HCT116 (The American Type Culture Collection, ATCC) and ELR cells were grown under standard tissue-culture conditions. OIS cells were generated as described18. Telomere-initiated senescent BJ cells were obtained by extensive passaging of BJ cells. Ionizing radiation-induced senescent cells were obtained with a 20 Gy dose and analysed two weeks later. H2O2 was used for 1 h at 500 μM concentration, hydroxyurea was used for two weeks at 600 μM concentration and cells were analysed after two weeks, etoposide was used at 170 nM every three days for two weeks. Valproic acid (VPA, SIGMA) was used at 10–50 mM concentration, as indicated, for 24 h (until 72 h for Fig. 8b). Suv39 methyl transferase inhibitor (Chaetocin, SIGMA) was used at 0.4 nM concentration for 24 h. Panobinostat was used in vitro at 0.004–1 μM range concentration for 24 h on HCT116 cells. KU55933 (KuDOS Pharmaceuticals) was used at 20 μM for 24 h on HCT116 cells. Quiescent cells were obtained by contact-inhibition. Aphidicolin (Sigma) was used at 2 μg ml−1 concentration. SA-β-galactosidase assay was performed as described18.
Plasmids
pBABE-Puro H-RasV12, pBABE-Hygro H-RasV12, pRETROSUPER shp53, pRETROSUPER shATM, pRRL.SIN-18 Lenti GFP and Lenti H-RasV12 and corresponding empty vectors were used as described in ref. 18. pLKO.1 shSUV39h1, pLKO.1 shHP1γ, pLKO.1 shH2AX and pLKO.1-puro were obtained from the RNAi Consortium61(Broad Institute) and used to infect OIS, ELR, BJ, MCF10a and HCT116 cells. pLKO.1 ATR shRNA was obtained from O. F-Capetillo (CNIO).
siRNA
ATR siRNA used is Dharmacon SMART pools: 5′-GAACAACACUGCUGGUUUG-3′, 5′-GCAACUCGCCUAACAGAUA-3′ and 5′-ACUGAUGGCUGAUUAUUUA-3′. ATM siRNA is Dharmacon SMART pools: 5′-GAAUGUUGCUUUCUGAAU-3′, 5′-UAGACAGAAUUCCCAAAUAA-3′, UAUAUCACCUGUUUGUUAG-3′ and 5′-AGGAGGAGCUUGGGCCUUU-3′. GFP siRNA was used as control: 5′-AAGCUACCUGUUCCAUGGCCA-3′. shRNA sequences: SUV39h1 shRNA, 5′-CCGGGCAGGTGTACAACGTCTTCATCTCGAGATGAAGACGTTGTACACCTGCTTTTTTG-3′;HP1γ shRNA, 5′-CCGGGCGTTTCTTAACTCTCAGAAACTCGAGTTTCTGAGAGTTAAGAAACGCTTTTT-3′; p53shRNA, 5′-AGTAGATTACCACTGGAGTCTT-3′; ATM shRNA, 5′-CGAAAGTTGACAGCCAAAGTCTT-3′; ATR shRNA, 5′-CCGGGCCAAAGTATTTCTAGCCTATCTCGAGATAGGCTAGAAAT ACTTTGGCTTTTTG-3′;H2AX shRNA, 5′-CCGGCGACAACAAGAAGACGCGAATCTCGAGATTCGCGTCTTC TTGTTGTCGTTTTTG-3′.
Immunofluorescence microscopy
Cells were fixed and probed as previously described18. To detect SAHF, DAPI was used at 0.13 μg ml−1 for 30 s at room temperature. Images were acquired using a wide field Olympus Biosystems Microscope BX71 and MetaMorph software. Confocal sections were obtained with a Leica TCS SP2 AOBS confocal laser microscope by sequential scanning. For focus intensity, images were acquired using a wide field Olympus BX61 upright microscope, the software ScanR (×40 magnification, N.A. 0.90) and analysed by ImageJ software (version 1.42), using the Object_Counter3D plugin. A threshold value was used to distinguish individual foci (from 1.5 to 4 μm diameter size); between 200 and 2000 nuclei per sample were analysed. Comparative immunofluorescence microscopy analyses were performed in parallel with identical acquisition and analysis parameters. For the distribution of signal intensity, line traces were generated among foci with the line drawn using RGB profiler ImageJ plugin. To evaluate the nuclear staining dishomogeneity the standard deviation relative to the average intensity of SAHF structures within the nuclei was used.
Immunohistochemistry (IHC) and tumour samples analyses
Formalin-fixed paraffin-embedded sections from 15 surgically removed HNSCC and 20 colon carcinomas and 42 lung carcinomas from a previously described tissue bank62 were analysed, after local ethical committee approval. The samples were taken from patients that had not undergone any chemo- or radiotherapy before surgical resection. Immunohistochemistry was performed according to the indirect streptavidin–biotin–peroxidase method, as previously described2. Two independent pathologists performed the evaluation and the results were analysed using the SPSS v12.0 software. P values were calculated computing the Spearman’s correlation coefficient, testing the Null Hypothesis of lack of association and One-way ANOVA as indicated.
Immunohistochemistry (IHC) of tumour xenografts
Tumour xenografts were recovered 2 h after last compound administration and fixed in formalin. Formalin-fixed and paraffin-embedded tumours were stained for haematoxylin/eosin, γH2AX, histone H4 acetylation and caspase-3 activation by the following procedures. For γH2AX staining: formalin-fixed and paraffin-embedded xenograft tissue sections were deparaffinized, re-hydrated, unmasked in 0.25 mM EDTA at 55 °C overnight at 4 °C, and treated for 5 min with 3% H2O2. Slides were then incubated overnight at 4 °C with anti-γH2AX antibody, revealed using the EnVision Plus/HRP detection system and counterstained with haematoxylin. For histone H4 acetylation: formalin-fixed and paraffin-embedded xenograft tissue sections were deparaffinized, re-hydrated, unmasked using TEG (10mM Tris, o.5mM EGTA) buffer at pH 9 and treated for 5 min with 3% H2O2. Slides were then incubated overnight at 4 °C with anti-histone H4 acetylated antibody, revealed using the EnVision Plus/HRP detection system (Dako) and counterstained with haematoxylin. For caspase-3 activation: formalin-fixed and paraffin-embedded xenograft tissue sections were deparaffinized, re-hydrated, unmasked for 10 min in 0.25 mM EDTA at 95 °C, and treated for 5 min with 3% H2O2. Slides were then incubated for 2 h at room temperature with anti-activated caspase-3 antibody, revealed using the EnVision Plus/HRP detection system and counterstained with haematoxylin.
Xenograft model and in vivo HDACi treatment
Female 4–6 weeks old (20–25 g) CD1 nude mice were obtained from Charles River. 5 × 10⁶HCT116 colon carcinoma cell lines (ATCC) in a volume of 0.2 ml were implanted subcutaneously. Following implantation, tumours were allowed to grow to a size of 100 mm3 before starting daily treatments. Panobinostat, produced in-house following synthesis reported in patent application WO2007/146718, was dissolved in vehicle (5% DMSO and 1% TWEEN 80 in PBS) and dosed by intravenous daily administration. Tumour growth was measured using Vernier calipers and tumour volume was calculated using the equation (l × w2)/2, where l and w refer to the larger and smaller dimensions collected at each measurement. All animal studies were carried out in compliance with Italian Legislative Decree N.116 dated January 27, 1992 and the European Communities Council Directive N.86/609/EEC concerning the protection of animals used for experimental or other scientific purposes and according to Institutional Policy Regarding the Care and Use of Laboratory Animals.
Immunoblotting
Cells were lysed in sample buffer and 20–50 μg of whole cell lysate were resolved by SDS–PAGE (SDS– polyacrylamide gel electrophoresis), transferred to nitrocellulose and probed as previously described18.
Database
Gene expression data on heterochromatin proteins HP1γ, HP1β, HMGA1 and HMGA2 were retrieved from the Oncomine, a public cancer microarray database, (www.oncomine.org).
Apoptosis assay and flow cytometry analysis
Apoptosis in vitro was quantified by FACS (fluorescence-activated cell sorting) analysis of the sub-G1 fraction after propidium iodide staining (50 μg ml−1) of ethanol-fixed and permeabilized cells or by TUNEL assay using In Situ Cell Death Detection Kit, Fluoresceine (Roche) on acetone/methanol fixed cells.
qPCR
Total RNA was isolated from cells using RNAeasy (Qiagen) according to the manufacturer’s instructions, and treated with DNAse before reverse transcription. cDNA was generated using the Superscript II Reverse Transcriptase (Invitrogen). The cDNA was used as template in real-time quantitative PCR reactions with SUV39h1 specific primers on a Roche LightCycler 480 Sequence Detection System. The reactions were prepared using SyBR Green reaction mix from Roche. Ribosomal protein P0 (RPP0) was used as a control gene for normalization. Primer sequences for qRT–PCR: RPPO-fw, 5′-TTCATTGTGGGAGCAGAC-3′; RPPO-rev, 5′-CAGCAGTTTCTCCAGAGC-3′; SUV39h1-fw, 5′-GTCATGGAGTACGTGGGAGAG-3′; SUV39h1-rev, 5′-CCTGAC GGTCGTAGATCTGG-3′; ATM-fw, 5′-GCAACTGTACCAAGAAGAGTCCAA-3′; ATM-rev, 5′-GCAGGAAAAAGCCAGATGCA-3′; H2AX-fw, 5′-TCAGCTCTCCCT CCATCTTC-3′; H2AX-rev, 5′-TGTGCCTGTTACCAAGTGCT-3′.
TaqMan Gene Expression Assays was used to study E2F-target genes expression (Fig. 4a, Supplementary Fig. S2i). The cDNA was used as template in real-time quantitative PCR reaction performed on an Applied Biosystems ABI Prism 7900HT Sequence Detection System. The following assays were used from Applied Biosystems: Hs00427214_g1 (PCNA); Hs00195504_m1 (MCM6); Hs00153138_m1 (CCNA2); 4319413 E (18S), Hs99999189_m1 (p16INK4a).
Chromatin immunoprecipitation (ChIP) analysis
ChIPs were performed essentially as described63. Briefly, cells were cross-linked with 1% formaldehyde in PBS for 10 min at 37 °C and quenched in 125 mM glycine in PBS for 5 min at 4 °C. The cells were collected by centrifugation and sonicated in lysis buffer (0.33% SDS, 150 mM NaCl, 10 mM EDTA, 50 mM Tris-HCl at pH 8.0 and 1 × protease inhibitor cocktail) to generate chromatin fragments of ~500 bp in length. The material was clarified by centrifugation, diluted 10-fold in ChIP buffer (0.5% Triton X-100, 2 mM EDTA, 150 mM NaCl, 20 mM Tris-HCl at pH 7.9 and 1 × protease inhibitor cocktail), and pre-cleared with protein A-agarose beads. The pre-cleared, chromatin-containing supernatant was used in immunoprecipitation reactions with the primary antibodies described below. ChIP DNA was then extracted with Chelex 100 at 95 °C for 15 min and purified using DNA purification kit (Quiagen). For gene-specific ChIP analyses, quantitative real-time PCR (qPCR) was used to determine the enrichment of immunoprecipitated material relative to the input material using gene-specific primer sets to the specified regions. Immunoprecipitated DNA from 5 × 10⁶ cell equivalents was resuspended in 0.5 ml of 10 mM Tris at pH 8.0. Real-time PCR was performed with 9.6 μl of DNA per reaction and 200 nM primers, diluted in a final volume of 20 μl in SYBR Green Reaction Mix (Perkin Elmer). Each ChIP experiment was performed at least three times with independent chromatin isolates to ensure reproducibility.
Antibodies
Anti-γH2AX (1:1,000 for immunoblotting, 1:200 for immunofluorescence and 1:100 for IHC); anti-H3K9me3 (1:1,000 for immunoblotting, 1:200 for immunofluorescence and 1:500 for IHC and immunofluorescence of Fig. 5 and Supplementary Information Fig. S3; Upstate Biotechnology); anti-BrdU (Becton Dickinson, 1:20 for immunofluorescence); anti-H3 (1:10,000 for immunoblotting and 1:500 for ChIP); anti-H2AX (1:1,000 for immunoblotting and 1:200 for immunofluorescence); antiH3K9me3 (Abcam, 1:500 for ChIP); anti-p53pS15 and anti-cleaved caspase-3 (Cell Signalling Technology; 1:1,000 for immunoblotting, 1:200 for immunofluorescence and 1:5,000 for IHC); anti-MCM6 (C-20, 1:200 for immunofluorescence); anti-CDC6 (1:100 for IHC); anti-p53 (DO1; 1:1,000 immunoblotting); anti-ATR (N-19; 1:500 immunoblotting; Santa Cruz Biotechnologies); anti-acetylated H4 (ref. 64; 1:500 for immunoblotting and 1:13,000 for IHC); anti-Ras (BD Transduction Laboratories; 1:2,000 for immunoblotting and 1:200 for immunofluorescence); anti-vinculin clone hVIN-1 and anti-tubulin (SIGMA; 1:5,000 immunoblotting); anti-HP1γ (Calbiochem; 1:1,000 for immunoblotting, 1:200 for immunofluorescence and 1:500 for immunofluorescence and IHC in Fig. 5and Supplementary Information Fig. S3); anti-Ki67 (DAKO; 1:50 for IHC and immunofluorescence); anti-ATM pS1981 (Rockland; 1:400 immunofluorescence); anti-NBS1 (Novus; 1:200 immunofluorescence); anti-RAD50 (Abcam; 1:200 immunofluorescence); anti-HMGA2 was a gift from G. Manfioletti (University of Trieste, Trieste, Italy; 1:1,000 for immunoblotting, 1:200 for immunofluorescence).
Statistical analysis
Results are shown as means ± s.d. or s.e.m. as indicated. P values were calculated by Student’s two-tailed t-test, One-way ANOVA, Mann-Whitney test or by Wilcoxon test, as indicated.
Supplementary Material
Acknowledgments
We thank M. Fumagalli for providing fibroblasts undergoing senescence following telomere shortening and for editing the manuscript; A. Oldani and D. Parazzoli from IFOM Imaging Unit for help with imaging; qRT–PCR and Cell Biology Units for support; S. Vultaggio for help with tumour xenograft generation and M. Romanenghi for technical assistance with ChIP. We thank O. Fernandez-Capetillo for pLKO.1 shATR; G. Smith for KU55933 (KuDOS Pharmaceuticals Ltd.). G. Manfioletti for sharing HMGA antibodies; P.P. Di Fiore for support; U. Herbig, B. Amati and M. Foiani for critical reading of the manuscript and all F.d’A.d.F. lab members for discussion and feedback throughout this work. M.L. and V.G. are funded by the European Commission (FP7-GENICA project). W.C.H. is supported in part by an U.S. NIH/NIA grant (ROI AG023145). The S.M. laboratory is supported in part by the European Union (Epitron). The F.d’A.d.F laboratory is supported by AIRC (Associazione Italiana per la Ricerca sul Cancro), the European Community’s 7th Framework Programme (FP7/2007–2013) under grant agreement number 202230 (Genomic instability and genomic alterations in pre-cancerous lesions and/or cancer; GENINCA), HFSP (Human Frontier Science Program), AICR (Association for International Cancer Research), EMBO Young Investigator Program and Telethon.
Footnotes
Contributions
M.D. performed immunofluorescence microscopy experiments in Figs 2a and 7a and Supplementary Fig. S2a, and provided technical assistance for cell culture experiments. V.M. performed immunofluorescence microscopy experiments in Figs 2b and 6b and provided technical assistance for cell culture experiments. M.L. and V.G. generated and analysed data and images in Fig. 5a–g and Supplementary Fig. S3. O.A.B. generated data in Fig. 8b, c and Supplementary Fig. S7f, g. G.G. generated data in Fig. 4b and Supplementary Fig. S2l. R.d.Z. and C.M. generated and analysed data in Fig. 8d, e, f and Supplementary Fig. S8a. E.M. contributed to imaging analysis. G.d’A. performed statistical analysis on an imaging dataset. W.C.H. provided shRNA vectors and Ras transformed fibroblasts (ELR) and edited the manuscript. S.M. supervised O.A.B., R.d.Z. and C.M. work, contributed to experimental plan and edited the manuscript. R.D.M. and G.S. generated data of all remaining figures, assembled the manuscript and contributed to experimental design and manuscript writing. F.d’A.d.F. planned and supervised the project and wrote the manuscript.
Competing financial interests
S.M. has stocks in Genextra Spa, a biopharmaceutical company that is currently developing HDAC inhibitors for cancer therapy.
Contributor Information
Raffaella Di Micco, IFOM Foundation - FIRC Institute of Molecular Oncology Foundation, Milan, Italy.
Gabriele Sulli, IFOM Foundation - FIRC Institute of Molecular Oncology Foundation, Milan, Italy.
Miryana Dobreva, IFOM Foundation - FIRC Institute of Molecular Oncology Foundation, Milan, Italy.
Michalis Liontos, Molecular Carcinogenesis Group, Department of Histology and Embryology, School of Medicine, University of Athens, Athens, Greece.
Oronza A. Botrugno, Department of Experimental Oncology, European Institute of Oncology, Milan, Italy
Gaetano Gargiulo, Department of Experimental Oncology, European Institute of Oncology, Milan, Italy.
Roberto dal Zuffo, DAC-Genextra Group, Milan, Italy.
Valentina Matti, IFOM Foundation - FIRC Institute of Molecular Oncology Foundation, Milan, Italy.
Giovanni d’Ario, IFOM Foundation - FIRC Institute of Molecular Oncology Foundation, Milan, Italy.
Erica Montani, Consortium for Genomic Technologies c/o IFOM-IEO Campus for Oncogenomics, Milan, Italy.
Ciro Mercurio, DAC-Genextra Group, Milan, Italy.
William C. Hahn, Dana-Farber Cancer Institute, Boston, Massachusetts, MA 02115, USA
Vassilis Gorgoulis, Molecular Carcinogenesis Group, Department of Histology and Embryology, School of Medicine, University of Athens, Athens, Greece.
Saverio Minucci, Department of Experimental Oncology, European Institute of Oncology, Milan, Italy. Department of Biomolecular Sciences and Biotechnologies, University of Milan, Italy.
Fabrizio d’Adda di Fagagna, IFOM Foundation - FIRC Institute of Molecular Oncology Foundation, Milan, Italy.
References
- 1.Collado M, Blasco MA, Serrano M. Cellular senescence in cancer and aging. Cell. 2007;130:223–233. doi: 10.1016/j.cell.2007.07.003. [DOI] [PubMed] [Google Scholar]
- 2.Campisi J, d’Adda di Fagagna F. Cellular senescence: when bad things happen to good cells. Nat Rev Mol Cell Biol. 2007;8:729–740. doi: 10.1038/nrm2233. [DOI] [PubMed] [Google Scholar]
- 3.Adams PD. Healing and hurting: molecular mechanisms, functions and pathologies of cellular senescence. Mol Cell. 2009;36:2–14. doi: 10.1016/j.molcel.2009.09.021. [DOI] [PubMed] [Google Scholar]
- 4.d’Adda di Fagagna F, et al. A DNA damage checkpoint response in telomere-initiated senescence. Nature. 2003;426:194–198. doi: 10.1038/nature02118. [DOI] [PubMed] [Google Scholar]
- 5.Herbig U, Jobling WA, Chen BP, Chen DJ, Sedivy JM. Telomere shortening triggers senescence of human cells through a pathway involving ATM, p53, and p21(CIP1), but not p16(INK4a) Mol Cell. 2004;14:501–513. doi: 10.1016/s1097-2765(04)00256-4. [DOI] [PubMed] [Google Scholar]
- 6.Karlseder J, Smogorzewska A, de Lange T. Senescence induced by altered telomere state, not telomere loss. Science. 2002;295:2446–2449. doi: 10.1126/science.1069523. [DOI] [PubMed] [Google Scholar]
- 7.Schmitt CA. Senescence, apoptosis and therapy—cutting the lifelines of cancer. Nat Rev Cancer. 2003;3:286–295. doi: 10.1038/nrc1044. [DOI] [PubMed] [Google Scholar]
- 8.Serrano M, Lin AW, McCurrach ME, Beach D, Lowe SW. Oncogenic ras provokes premature cell senescence associated with accumulation of p53 and p16INK4a. Cell. 1997;88:593–602. doi: 10.1016/s0092-8674(00)81902-9. [DOI] [PubMed] [Google Scholar]
- 9.Halazonetis TD, Gorgoulis VG, Bartek J. An oncogene-induced DNA damage model for cancer development. Science. 2008;319:1352–1355. doi: 10.1126/science.1140735. [DOI] [PubMed] [Google Scholar]
- 10.Michaloglou C, et al. BRAFE600-associated senescence-like cell cycle arrest of human naevi. Nature. 2005;436:720–724. doi: 10.1038/nature03890. [DOI] [PubMed] [Google Scholar]
- 11.Chen Z, et al. Crucial role of p53-dependent cellular senescence in suppression of Pten-deficient tumorigenesis. Nature. 2005;436:725–730. doi: 10.1038/nature03918. [DOI] [PMC free article] [PubMed] [Google Scholar]
- 12.Braig M, et al. Oncogene-induced senescence as an initial barrier in lymphoma development. Nature. 2005;436:660–665. doi: 10.1038/nature03841. [DOI] [PubMed] [Google Scholar]
- 13.Collado M, et al. Tumour biology: senescence in premalignant tumours. Nature. 2005;436:642. doi: 10.1038/436642a. [DOI] [PubMed] [Google Scholar]
- 14.Bartkova J, et al. Oncogene-induced senescence is part of the tumorigenesis barrier imposed by DNA damage checkpoints. Nature. 2006;444:633–637. doi: 10.1038/nature05268. [DOI] [PubMed] [Google Scholar]
- 15.Denchi EL, Attwooll C, Pasini D, Helin K. Deregulated E2F activity induces hyperplasia and senescence-like features in the mouse pituitary gland. Mol Cell Biol. 2005;25:2660–2672. doi: 10.1128/MCB.25.7.2660-2672.2005. [DOI] [PMC free article] [PubMed] [Google Scholar]
- 16.Collado M, Serrano M. Senescence in tumours: evidence from mice and humans. Nat Rev Cancer. 2010;10:51–57. doi: 10.1038/nrc2772. [DOI] [PMC free article] [PubMed] [Google Scholar]
- 17.Di Leonardo A, Linke SP, Clarkin K, Wahl GM. DNA damage triggers a prolonged p53-dependent G1 arrest and long-term induction of Cip1 in normal human fibroblasts. Genes Dev. 1994;8:2540–2551. doi: 10.1101/gad.8.21.2540. [DOI] [PubMed] [Google Scholar]
- 18.Di Micco R, et al. Oncogene-induced senescence is a DNA damage response triggered by DNA hyper-replication. Nature. 2006;444:638–642. doi: 10.1038/nature05327. [DOI] [PubMed] [Google Scholar]
- 19.d’Adda di Fagagna F. Living on a break: cellular senescence as a DNA-damage response. Nat Rev Cancer. 2008;8:512–522. doi: 10.1038/nrc2440. [DOI] [PubMed] [Google Scholar]
- 20.Narita M, et al. Rb-Mediated heterochromatin formation and silencing of E2F target genes during cellular senescence. Cell. 2003;113:703–716. doi: 10.1016/s0092-8674(03)00401-x. [DOI] [PubMed] [Google Scholar]
- 21.Hemann MT, Narita M. Oncogenes and senescence: breaking down in the fast lane. Genes Dev. 2007;21:1–5. doi: 10.1101/gad.1514207. [DOI] [PubMed] [Google Scholar]
- 22.Di Micco R, Fumagalli M, d’Adda di Fagagna F. Breaking news: high-speed race ends in arrest - how oncogenes induce senescence. Trends Cell Biol. 2007;17:529–536. doi: 10.1016/j.tcb.2007.07.012. [DOI] [PubMed] [Google Scholar]
- 23.Zhang R, et al. Formation of macroH2A-containing senescence-associated heterochromatin foci and senescence driven by ASF1a and HIRA. Dev Cell. 2005;8:19–30. doi: 10.1016/j.devcel.2004.10.019. [DOI] [PubMed] [Google Scholar]
- 24.Ye X, et al. Definition of pRB- and p53-dependent and -independent steps in HIRA/ASF1a-mediated formation of senescence-associated heterochromatin foci. Mol Cell Biol. 2007;27:2452–2465. doi: 10.1128/MCB.01592-06. [DOI] [PMC free article] [PubMed] [Google Scholar]
- 25.Narita M, et al. A novel role for high-mobility group A proteins in cellular senescence and heterochromatin formation. Cell. 2006;126:503–514. doi: 10.1016/j.cell.2006.05.052. [DOI] [PubMed] [Google Scholar]
- 26.Zhang R, Chen W, Adams PD. Molecular dissection of formation of senescence-associated heterochromatin foci. Mol Cell Biol. 2007;27:2343–2358. doi: 10.1128/MCB.02019-06. [DOI] [PMC free article] [PubMed] [Google Scholar]
- 27.Funayama R, Ishikawa F. Cellular senescence and chromatin structure. Chromosoma. 2007;116:431–440. doi: 10.1007/s00412-007-0115-7. [DOI] [PubMed] [Google Scholar]
- 28.Beausejour CM, et al. Reversal of human cellular senescence: roles of the p53 and p16 pathways. EMBO J. 2003;22:4212–4222. doi: 10.1093/emboj/cdg417. [DOI] [PMC free article] [PubMed] [Google Scholar]
- 29.Itahana K, et al. Control of the replicative life span of human fibroblasts by p16 and the polycomb protein Bmi-1. Mol Cell Biol. 2003;23:389–401. doi: 10.1128/MCB.23.1.389-401.2003. [DOI] [PMC free article] [PubMed] [Google Scholar]
- 30.Cortez D, Guntuku S, Qin J, Elledge SJ. ATR and ATRIP: partners in checkpoint signaling. Science. 2001;294:1713–1716. doi: 10.1126/science.1065521. [DOI] [PubMed] [Google Scholar]
- 31.Mallette FA, Gaumont-Leclerc MF, Ferbeyre G. The DNA damage signaling pathway is a critical mediator of oncogene-induced senescence. Genes Dev. 2007;21:43–48. doi: 10.1101/gad.1487307. [DOI] [PMC free article] [PubMed] [Google Scholar]
- 32.Hahn WC, et al. Creation of human tumour cells with defined genetic elements. Nature. 1999;400:464–468. doi: 10.1038/22780. [DOI] [PubMed] [Google Scholar]
- 33.Rhodes DR, et al. ONCOMINE: a cancer microarray database and integrated data-mining platform. Neoplasia. 2004;6:1–6. doi: 10.1016/s1476-5586(04)80047-2. [DOI] [PMC free article] [PubMed] [Google Scholar]
- 34.Kim J-A, Kruhlak M, Dotiwala F, Nussenzweig A, Haber JE. Heterochromatin is refractory to ãH2AX modification in yeast and mammals. J Cell Biol. 2007;178:209–218. doi: 10.1083/jcb.200612031. [DOI] [PMC free article] [PubMed] [Google Scholar]
- 35.Murga M, et al. Global chromatin compaction limits the strength of the DNA damage response. J Cell Biol. 2007;178:1101–1108. doi: 10.1083/jcb.200704140. [DOI] [PMC free article] [PubMed] [Google Scholar]
- 36.Goodarzi AA, et al. ATM signaling facilitates repair of DNA double-strand breaks associated with heterochromatin. Mol Cell. 2008;31:167–177. doi: 10.1016/j.molcel.2008.05.017. [DOI] [PubMed] [Google Scholar]
- 37.Ziv Y, et al. Chromatin relaxation in response to DNA double-strand breaks is modulated by a novel ATM- and KAP-1 dependent pathway. Nat Cell Biol. 2006;8:870–876. doi: 10.1038/ncb1446. [DOI] [PubMed] [Google Scholar]
- 38.Noon AT, et al. 53BP1-dependent robust localized KAP-1 phosphorylation is essential for heterochromatic DNA double-strand break repair. Nat Cell Biol. 2010;12:177–184. doi: 10.1038/ncb2017. [DOI] [PubMed] [Google Scholar]
- 39.Goodarzi AA, Jeggo P, Lobrich M. The influence of heterochromatin on DNA double strand break repair: getting the strong, silent type to relax. DNA Repair (Amst) 2010;9:1273–1282. doi: 10.1016/j.dnarep.2010.09.013. [DOI] [PubMed] [Google Scholar]
- 40.Rea S, et al. Regulation of chromatin structure by site-specific histone H3 methyltransferases. Nature. 2000;406:593–599. doi: 10.1038/35020506. [DOI] [PubMed] [Google Scholar]
- 41.Greiner D, Bonaldi T, Eskeland R, Roemer E, Imhof A. Identification of a specific inhibitor of the histone methyltransferase SU(VAR)3–9. Nat Chem Biol. 2005;1:143–145. doi: 10.1038/nchembio721. [DOI] [PubMed] [Google Scholar]
- 42.Lachner M, O’Carroll D, Rea S, Mechtler K, Jenuwein T. Methylation of histone H3 lysine 9 creates a binding site for HP1 proteins. Nature. 2001;410:116–120. doi: 10.1038/35065132. [DOI] [PubMed] [Google Scholar]
- 43.Minucci S, Pelicci PG. Histone deacetylase inhibitors and the promise of epigenetic (and more) treatments for cancer. Nat Rev Cancer. 2006;6:38–51. doi: 10.1038/nrc1779. [DOI] [PubMed] [Google Scholar]
- 44.Altucci L, Minucci S. Epigenetic therapies in haematological malignancies: searching for true targets. Eur J Cancer. 2009;45:1137–1145. doi: 10.1016/j.ejca.2009.03.001. [DOI] [PubMed] [Google Scholar]
- 45.Bandyopadhyay D, et al. Dynamic assembly of chromatin complexes during cellular senescence: implications for the growth arrest of human melanocytic nevi. Aging Cell. 2007;6:577–591. doi: 10.1111/j.1474-9726.2007.00308.x. [DOI] [PMC free article] [PubMed] [Google Scholar]
- 46.George P, et al. Combination of the histone deacetylase inhibitor LBH589 and the hsp90 inhibitor 17-AAG is highly active against human CML-BC cells and AML cells with activating mutation of FLT 3. Blood. 2005;105:1768–1776. doi: 10.1182/blood-2004-09-3413. [DOI] [PubMed] [Google Scholar]
- 47.Kim IA, Kim IH, Kim HJ, Chie EK, Kim JS. HDAC inhibitor-mediated radiosensitization in human carcinoma cells: a general phenomenon? J Radiat Res (Tokyo) 2010;51:257–263. doi: 10.1269/jrr.09115. [DOI] [PubMed] [Google Scholar]
- 48.Herbig U, Ferreira M, Condel L, Carey D, Sedivy JM. Cellular senescence in aging primates. Science. 2006;311:1257. doi: 10.1126/science.1122446. [DOI] [PubMed] [Google Scholar]
- 49.Scaffidi P, Misteli T. Lamin A-dependent nuclear defects in human aging. Science. 2006;312:1059–1063. doi: 10.1126/science.1127168. [DOI] [PMC free article] [PubMed] [Google Scholar]
- 50.Auth T, Kunkel E, Grummt F. Interaction between HP1α and replication proteins in mammalian cells. Exp Cell Res. 2006;312:3349–3359. doi: 10.1016/j.yexcr.2006.07.014. [DOI] [PubMed] [Google Scholar]
- 51.Humbert N, et al. A genetic screen identifies topoisomerase 1 as a regulator of senescence. Cancer Res. 2009;69:4101–4106. doi: 10.1158/0008-5472.CAN-08-2864. [DOI] [PubMed] [Google Scholar]
- 52.Shimada K, et al. Ino80 chromatin remodeling complex promotes recovery of stalled replication forks. Curr Biol. 2008;18:566–575. doi: 10.1016/j.cub.2008.03.049. [DOI] [PubMed] [Google Scholar]
- 53.Adams PD. Remodeling chromatin for senescence. Aging Cell. 2007;6:425–427. doi: 10.1111/j.1474-9726.2007.00313.x. [DOI] [PubMed] [Google Scholar]
- 54.Toledo LI, Murga M, Gutierrez-Martinez P, Soria R, Fernandez-Capetillo O. ATR signaling can drive cells into senescence in the absence of DNA breaks. Genes Dev. 2008;22:297–302. doi: 10.1101/gad.452308. [DOI] [PMC free article] [PubMed] [Google Scholar]
- 55.Liontos M, et al. Modulation of the E2F1-driven cancer cell fate by the DNA damage response machinery and potential novel E2F1 targets in osteosarcomas. Am J Pathol. 2009;175:376–391. doi: 10.2353/ajpath.2009.081160. [DOI] [PMC free article] [PubMed] [Google Scholar]
- 56.Kang MY, et al. Association of the SUV39H1 histone methyltransferase with the DNA methyltransferase 1 at mRNA expression level in primary colorectal cancer. Int J Cancer. 2007;121:2192–2197. doi: 10.1002/ijc.22953. [DOI] [PubMed] [Google Scholar]
- 57.De Koning L, et al. Heterochromatin protein 1α: a hallmark of cell proliferation relevant to clinical oncology. EMBO Mol Med. 2009;1:13. doi: 10.1002/emmm.200900022. [DOI] [PMC free article] [PubMed] [Google Scholar]
- 58.Fanti L, Giovinazzo G, Berloco M, Pimpinelli S. The heterochromatin protein 1 prevents telomere fusions in Drosophila. Mol Cell. 1998;2:527–538. doi: 10.1016/s1097-2765(00)80152-5. [DOI] [PubMed] [Google Scholar]
- 59.Ayoub N, Jeyasekharan AD, Venkitaraman AR. Mobilization and recruitment of HP1: a bimodal response to DNA breakage. Cell Cycle. 2009;8:2945–2950. [PubMed] [Google Scholar]
- 60.Kim JA, Haber JE. Chromatin assembly factors Asf1 and CAF-1 have overlapping roles in deactivating the DNA damage checkpoint when DNA repair is complete. Proc Natl Acad Sci USA. 2009;106:1151–1156. doi: 10.1073/pnas.0812578106. [DOI] [PMC free article] [PubMed] [Google Scholar]
Associated Data
This section collects any data citations, data availability statements, or supplementary materials included in this article.