

Abstract
The nigrostriatal dopaminergic system is a major lesion target for methamphetamine (MA), one of the most addictive and neurotoxic drugs of abuse. High doses of MA alter the expression of a large number of genes. Reference genes (RGs) are considered relatively stable and are often used as standards for quantitative real-time PCR (qRT-PCR) reactions. The purpose of this study was to determine whether MA altered the expression of RGs and to identify the appropriate RGs for gene expression studies in animals receiving MA. Adult male Sprague-Dawley rats were treated with high doses of MA or saline. Striatum and substantia nigra were harvested at 2 hours or 24 hours after MA administration. The expression and stability of 10 commonly used RGs were examined using qRT-PCR and then evaluated by geNorm and Normfinder. We found that MA altered the expression of selected RGs. These candidate RGs presented differential stability in the striatum and in substantia nigra at both 2 hours and 24 hours after MA injection. Selection of an unstable RG as a standard altered the significance of tyrosine hydroxylase (TH) mRNA expression after MA administration. In conclusion, our data show that MA site- and time- dependently altered the expression of RGs in nigrostriatal dopaminergic system. These temporal and spatial factors should be considered when selecting appropriate RGs for interpreting the expression of target genes in animals receiving MA.
Keywords: Methamphetamine, Housekeeping genes, Nigra, Real-time PCR, Reference genes, Striatum
1. Introduction
Quantitative real-time PCR (qRT-PCR) is one of the most commonly used techniques to examine gene expression in biomedical research. The relative quantification method is often used to analyze qRT-PCR data, whereby relative gene expression is obtained by normalization with one or several reference genes (RGs) (Bustin et al. , 2009) or previously known as housekeeping genes (HKGs). Increasing evidence, however, suggests that the expression of RGs can be altered after injury, such as oxidative stress, inflammation, apoptosis, and proliferation. It is likely that the outcome of target gene expression may differ depending on the choice of RGs (Ferguson et al. , 2010, Ullmannova and Haskovec, 2003). Selection of the stable RGs is, thus, critical for accurately measuring gene expression after injury.
Methamphetamine (MA) is a dopaminergic neurotoxin. High doses of MA cause neurodegeneration through suppression of neurotrophic factors, like BMP7 (Shen et al. , 2008) and GDNF (Wang et al. , 2001), and upregulation of apoptotic genes (Bachmann et al. , 2009, Shen, Luo, 2008, Wang, Hayashi, 2001). Many reference genes (RGs), i.e. 18s rRNA (Krasnova et al. , 2011), Hmbs(Luo et al. , 2010), Hprt(Luo, Wang, 2010), Oza1(Martin et al. , 2012), have been used to examine the expression of these target genes after MA treatment. However, limited studies have been conducted to examine the changes of these RGs in the nigrostriatal pathway of adult rats receiving MA. It is thus possible that the expression of target genes may have been mis-interpreted after MA injury if stability of RGs is not validated.
The purpose of this study was to investigate the effect of MA on RGs in rat striatum and nigra and to identify the stability of RGs for qRT-PCR quantification. We examined the expression of 10 frequently used RGs, according to the literature for candidate internal references, at two time points after MA exposure. We found that RGs’ expression was altered by MA in a time-dependent and tissue-specific manner. Our data identified relatively stable RGs that can be potentially useful as the standards for target gene expression in striatum and substantia nigra after MA injury.
2. Materials and Methods
2.1 Candidate reference gene selection
A total of 10 candidate RGs were chosen for this study based on published reports involving MA actions in the nigrostriatal dopaminergic pathway (Table 1).
Table 1.
The panel of candidate reference genes
| Gene symbol | Gene Bank ID# | Gene Name | Reference | Assay ID#/Part number |
|---|---|---|---|---|
| GAPDH | NM_017008.3 | Glyceraldehyde 3-phosphate dehydrogenase | (Pendyala, Ninemire, 2012) | 4352338E |
| Act | NM_031144.2 | Actin, beta | (Nakahara, Kuroki, 2003, Putzke, Spina, 2007) | Rn00667869_m1 |
| 18S | NR_046237.1 | 18S ribosomal RNA | (Krasnova, Ladenheim, 2011, Pendyala, Ninemire, 2012, Wang, Hayashi, 2001) | 4333760F |
| Tbp | NM_001004198.1 | TATA box binding protein | (Pendyala, Ninemire, 2012) | Rn01455646_m1 |
| Hmbs | NM_013168.2 | Hydroxymethylbilane synthase | (Luo, Wang, 2010) | Rn00565886_m1 |
| Hprtl | NM_012583.2 | hypoxanthine phosphoribosyltransferase 1 | (Luo, Wang, 2010) | Rn01527840_m1 |
| Ubc | NM_017314.1 | Ubiquitin C | Rn01499642_m1 | |
| B2m | NM_012512.2 | beta-2 microglobulin | (Shilling et al. , 2006) | Rn00560865_m1 |
| Rps6 | NM_017160.1 | Ribosomal protein S6 | (Shilling, Kuczenski, 2006) | Rn00820815_g1 |
| Oaz1 | NM_139081.1 | Ornithine decarboxylase antizyme 1 | (Martin, Jayanthi, 2012) | Rn01408148_g1 |
2.2 Experimental groups and sampling
Adult male Sprague-Dawley rats (n=32, Charles River Laboratories Inc., Wilmington, MA), weighting 200-225 g, were used in this study. Animals were housed individually in cages with free access to food and water. Animals were acclimated for 1 week in our temperature-controlled animal facility prior to drug treatment. All the animal procedures were done according to guidelines of National Institute of Health. Animals were treated with subcutaneous injections of 0.9% saline (1ml/kg, every two hours, ×4 times, n=16) or MA (5 mg/kg every two hours, × 4 times, n=16). Animals were sacrificed by decapitation at 2h and 24h after the last dose of MA or saline. Brain tissues were collected and frozen at −80 °C until use.
2.3 RNA isolation
RNA isolation was performed in an AirClean 600 PCR Workstation (AirClean® Systems, Raleigh, NC) to protect the samples from potential contamination. All work surfaces, pipettes and gloves were kept free of RNase by spraying Ambion® RNaseZap® (Life Technologies, Carlsbad, CA) just before each experiment. 1 mL TRIzol® Reagents (Life Technologies, Carlsbad, CA) was added to each tissue sample in a 2 mL polypropylene microvial (Biospec Product, Bartlesville, OK) containing 0.5 g of 0.9-2.0 mm stainless steel beads (Next Advance, Averill Park, NY). Brain tissue was homogenized by vigorous shaking with a Mini-BeadBeater-16 (Biospec Product, Bartlesville, OK) for 2 × 30 sec. Total RNA was isolated according to the manufacturer's instruction (TRIzol® Reagent). Briefly, 0.2 mL chloroform was used for separating the organic and aqueous phases by centrifugation at 12,000 × g for 15 min at 4°C. RNA in the aqueous phase was then precipitated using 0.5 mL isopropanol at 12,000 × g for 10 min at 4°C, washed with 1mL of 75 % ethanol, air-dried and redissolved in 30 μl DEPC-treated water (Ambion, Austin, TX). The quantity and purity of isolated RNA were determined using a NanoDrop ND-1000 spectrophotometer (Thermo Scientific, Wilmington, DE). RNA samples were stored at −80°C until use.
2.4 Reverse transcription and qRT-PCR
All first-strand cDNA samples were synthesized from 2.5 μg total RNA per 20 μL reaction using SuperScript® VILO™ cDNA Synthesis Kit (Life Technologies, Carlsbad, CA), then diluted 1:10 with nuclease-free water. Pre-designed TaqMan® probes and primer sets (Life Technologies, Carlsbad, CA, see Table 1) were used to span exons to amplify target cDNA without amplifying genomic DNA. A total volume of 10 μL reaction mixture consisting of 5 μL TaqMan® Fast Advanced Master Mix (Life Technologies, Carlsbad, CA), 0.5 μL of a TaqMan® probe and primer set and 4.5 μL diluted cDNA was loaded to each single well of a 96-well plate. qRT-PCR was run on an Applied Biosystems 7500 Fast Real-Time PCR System under the thermal cycling conditions recommended in the manual for TaqMan® Fast Advanced Master Mix: 50°C for 2 min, followed by 95°C for 20 sec, 40 cycles of denaturation at 95°C for 3 sec and annealing and extension at 60°C for 30 sec. Standard curve for amplification efficiency of PCR reaction was generalized from three replicates per each dilution. Eight biological replicates were used for each treatment group and two technical replicates for each biological replicate. No-reverse-transcription controls (no RT controls) and no template controls (NTCs) were used respectively to rule out genomic DNA contamination and reagent contamination.
2.5 Evaluation of the stability of the candidate reference genes
Two freely accessible Excel-based tools, geNorm v3.5 (http://medgen.ugent.be/~jvdesomp/genorm/) (Vandesompele et al. , 2002) and Normfinder v0.953 (http://www.mdl.dk/publicationsnormfinder.htm) (Andersen et al. , 2004) were used to evaluate the expression stability of the 10 candidate reference genes. Briefly, Ct values from qRT-PCR runs were transformed to linear scale expression quantities using comparative Ct method as described in the manuals. Gene expression stability or “M value” was calculated for each gene by geNorm. The RG with the highest M value was stepwise eliminated until only two RGs remained(Vandesompele, De Preter, 2002). Genes with the highest M values represent the least stable genes, while genes with the lowest M values have the most stable expression. geNorm did not take the experimental conditions into account because this measure relies on the principle that the expression ratio of two ideal internal control genes is identical in all samples (Vandesompele, De Preter, 2002). A pairwise variation value (V value) of each candidate genes was ranked according to stability of intragroup and intergroup variations [15]. The V value represents the levels of variation in average RG stability and was used to determine of the optimal number of RGs. The threshold of Vn/n+1 value was 0.15. An additional RG for endogenous controls was not required if Vn/n+1<0.15. The top-ranked candidate RGs were those with smallest V value.
Normfinder analysis, which takes information of groupings and samples into consideration, was used for assessing the stability of candidate RGs. A stability value of each gene was calculated using intra-group and inter-group variations (Andersen, Jensen, 2004). The top-ranked stable RGs are those with smallest intragroup and intergroup variations or stability values.
RefFinder (http://www.leonxie.com/referencegene.php) was used to identify the most reliable RGs by integrating the four currently widely used programs (geNorm, Normfinder, BestKeeper, and the comparative delta-delta Ct method). CT values from PCR experiments were input as the required format. RefFinder assigned an appropriate weight to an individual gene based on the rankings from individual program and calculated the geometric mean of the rank to yield the overall final ranking.
2.6 Analysis of the target mRNA expression
By using the 7500 Software v2.0.6 for Applied Biosystem 7500 fast RT-PCR system, the amplification efficiency of both target and references genes was estimated with a standard curve method, by which the efficiency was calculated according to the equation Eff = [10 (–1/slope) – 1]×100%. The Ct values collected from 7500 Software v2.0.6 were imported to the qBase v1.3.5 program and the relative expression of a target gene, which expressed as mean ± S.E.M, was automatically analyzed with a modified delta-delta-Ct algorithm(Hellemans et al. , 2007).
2.7 Data analysis
Values are means ± s.e.m. Unpaired t-test was used for statistical analysis. A statistically significant difference was defined as p < 0.05.
3. Results
3.1 geNorm Analysis
We first examined stability of gene expression in striatum of all animals (n=32) at 2 hours and 24 hours after MA or saline injection using geNorm (Fig.1A, B). Actin and Rps6 had the lowest M values, representing the two most stable RGs in striatum at 2h after administration of MA and saline (Fig. 1A-a). Similarly, Actin and Rps6 were identified as the two most stable RGs at 24h after administration (Fig. 1B-a). The stability of RG expression was next examined in nigra. We found that GAPDH and Hprt at 2 hours (Fig.2A-a), whereas Actin and HMBS at 24 hours (Fig.2B-a), were the most stable RGs post injection with lowest M values. These data suggest spatial and temporal variations of RG expression after injection.
Fig.1. geNorm analysis of reference genes in striatum tissue at (A) 2h and (B) 24h after injection of MA or saline.

Average expression stability values (M) was used to identify stable RGs. Lower M values (Right) indicate a more stable expression.
Fig.2. geNorm analysis of reference genes in nigra tissue at (A) 2h and (B) 24h after last dose of MA or saline.

Average expression stability values (M) start from the least stable gene at left and end with most stable genes at the right. Lower M values indicate more stable expression.
The stability of striatal RGs was analyzed separately in animals (n=16 in each group) receiving saline (n=8, Fig.1A-b; Fig.1B-b) or MA (n=8, Fig.1A-c; Fig.1B-c) only. We found that treatment of MA strongly influenced the order of stability amongst RGs. For instance, HMBS was ranked the top stable RG in the saline group at 2 and 24 hours (Fig.1A-b; Fig.1B-b). In contrast, HMBS was the second to the least stable RG in the MA group at 2 hours (Fig.1A-c). These data suggest that MA treatment alters stability of RGs.
We next examined the pairwise variation value V, which is the variation between two sequential normalization factors containing an increasing number of genes [16]. We found that all of V2/3 values were below the threshold value 0.15 (data not shown), indicating that the combined use of the two RGs with lowest V values would be sufficient to normalize gene expression in this experiment.
3.2 Normfinder Analysis
The stability of RGs from all brain samples was next examined using Normfinder. In contrast to geNorm software, which ranks reference genes according to their expression stability (M) values regardless of the grouping information, Normfinder takes experimental design into account by including the intra- and inter-group variations and thus generates stability values (Andersen, Jensen, 2004). The expression stability values calculated by Normfinder are plotted in Fig 3. We found that Rps6 and Hprt were the most stably expressed reference genes in striatum and nigra, respectively, at 2h after MA injection (Fig 3A &B); Hprt and Actin were the most stable RGs in striatum and nigra at 24h after MA injection (Fig.3C,D).
Fig.3. Stability values of candidate reference genes ranked by Normfinder.

The gene with the lowest stability value has the most stable expression; the gene with the highest value the least stable expression.
The RG stability values from geNorm and Normfinder analysis are compared in Table 2. We found that similar top-ranked stable RGs (i.e. Rps6, Hprt and Actin) were identified for striatum (2h), nigra (2h) and nigra (24h) by both algorithms. There is a difference for striatal samples collected at 24 hours post injection between these two analyses. Rps6 and Actin were ranked as most stable reference genes by geNorm, whereas, Hprt was considered most stable by Normfinder.
Table 2.
Comparison of ranking results of geNorm analysis and Normfinder analysis
| Rank | Striatum(2h) |
Nigra(2h) |
Striatum(24h) |
Nigra(24h) |
||||
|---|---|---|---|---|---|---|---|---|
| geNorm | Normfinder | geNorm | Normfinder | geNorm | Normfinder | geNorm | Normfinder | |
| 1 | Rps6* | Rps6• | Hprt* | Hprt• | Rps6* | Hprt• | Hmbs* | Actin• |
| Actin* | GAPDH* | Actin* | Actin* | |||||
| 2 | Hprt | Hprt | Actin | B2m | Hmbs• | Rps6 | Hmbs• | |
| 3 | B2m | B2m• | Rps6 | GAPDH | Hmbs | B2m | Tbp | Rps6 |
| 4 | GAPDH | Oaz1 | Tbp | Oaz1 | Hprt | Actin | Hprt | Hprt |
| 5 | Oaz1 | Actin | 18s | Tbp | Tbp | Rps6 | Ubc | Tbp |
| 6 | 18s | 18s | B2m | B2m | Ubc | Tbp | B2m | Ubc |
| 7 | Tbp | GAPDH | Oaz1 | Actin | 18s | Ubc | GAPDH | B2m |
| 8 | Hmbs | Tbp | Hmbs | Ubc | GAPDH | 18s | 18s | 18s |
| 9 | Ubc | Hmbs | Ubc | 18s | Oaz1 | GAPDH | Oaz1 | GAPDH |
| 10 | Ubc | Hmbs | Oaz1 | Oaz1 | ||||
most stable reference gene pair recommend by geNorm
•optimum pair of reference genes recommended by Normfinder.
In terms of unstable RGs, HMBS was ranked as a least stable RG in both striatum and nigra at 2h after MA injection. HMBS remained relatively stable in striatum and nigra at 24h after injection. Normfinder ranked HMBS as the second most stable RG in both locations and geNorm ranked HMBS as the most stable in nigra at 24h after injection. These data indicated that there was a notable temporal change in the stability of HMBS comparing its ranking at 2h and 24h after injection of MA. Likewise, GAPDH was identified as the most stable RG in nigra at 2h after injection, but was unstable in both striatum and nigra based on the ranking at 24h after injection (Table 2).
3.3 Differential Tyrosine hydroxylase (TH) mRNA expression profile based on the selection of reference genes
It has been documented in many studies that administration of high doses of MA reduces TH activity in nigra and striatum (Harvey et al. , 2009, Kogan et al. , 1976, Luo, Wang, 2010, Trulson et al. , 1985). To demonstrate the importance of choosing appropriate RGs as calibrators in MA treatment paradigms, we normalized TH mRNA expression with each of all standards RGs (Fig 4). A web-based comprehensive tool, RefFinder (http://www.leonxie.com/referencegene.php,(Xie et al. , 2012), which integrates the current major computation programs (geNorm, Normfinder, BestKeeper and comparative delta-delta Ct method), was used to evaluate and rank the tested candidate RGs. The integrative ranking of stability (X-axis) was plotted against TH mRNA expression after normalization (Y axis) in Fig 4. Selection of HMBS as a RG caused the TH mRNA level to be elevated in striatum after MA administration at 2 hours after injection (Fig 4A, p=0.0859). In contrast, using Ubc showed a significant reduction in TH expression in striatum (Fig 4A, p=0.002). To further characterize these two RGs in striatum at 2 hours after injection, we found that Hmbs mRNA was significantly reduced by MA treatment (p<0.01 Fig.5 A) while Ubc was significantly up-regulated when compared with the stable reference genes, Rps6, B2m and Actin. The down-regulated expression of Hmbs in the MA –treated group accounts for this unexpected increase in TH mRNA expression, as shown in Fig 4A. In contrast to striatum, TH mRNA expression was consistently suppressed by MA in nigra, when normalized to each RGs, as early as 2h after injection (Fig 4B).
Fig 4. Relative TH mRNA levels measured by normalization to different reference genes.

The comprehensive ranking of the most to the least stable genes recommended by RefFinder are respectively from left to right in the X-axis. The expression levels of the saline group are set to 1. (*p<0.05, Student's t-test, n=8 for each group)
Fig.5. Relative mRNA level of Hmbs and Ubc (normalized to Rps6 and B2m) in Striatum at 2h after last injection of MA and saline.
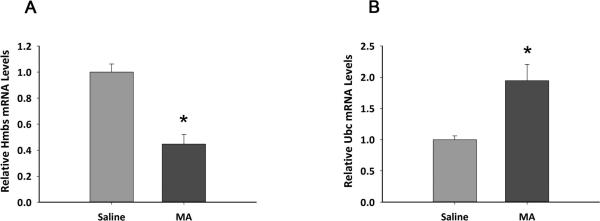
The expression levels of saline group are set to 1 with all the data normalized to Rps6 and B2m, which are used as the best reference gene pair. (A) Comparison of relative Hmbs mRNA levels between saline and MA groups. (B) Comparison of relative Ubc mRNA levels between saline and MA groups. (* p<0.01, Student's t-test, n=8, each group)
The impact of selection of RGs was also shown at 24h after injection. We found that TH expression was consistently and significantly reduced both in striatum (Fig 4C) and in nigra (Fig 4D) when normalized to all RGs, except OAZ1, which was identified as the least stable reference gene by geNorm and Normfinder. The difference in TH mRNA between MA and saline groups is thus underestimated in striatum (p=0.291) and nigra tissue (p=0.248) when Oaz1 was selected as an internal control at 24 hours after injection.
Supplement Fig S1 represents the geometric means of TH mRNA levels normalized to the optimal RG pairs selected by geNorm.
4. Discussion
qRT-PCR is a major quantitative approach for gene expression studies. Selection of proper RGs as endogenous reference controls is a key point for ensuring credible expression of target genes. The evaluation of reference gene stability in striatum and nigra after MA treatment has not been reported before. Based on the literature for related MA studies, we selected 10 commonly used RGs to determine their stability in striatum and nigra after drug administration. We first examined the stability of reference genes, as seen in Figs 1 to 3. Similar methods for stability have been used in other reports (Bonefeld et al. , 2008, Gubern et al. , 2009, Tanic et al. , 2007, Yao et al. , 2012). The implication of the stability was further examined by statistics in Fig 4, which demonstrated that significant variability of TH expression when comparing with stable or unstable RGs. We found that using unstable reference genes as normalizer results in false interpretation of TH expression at 2 hours after MA treatment (Figure 4A). Our results indicate that these candidate RGs presented differential stability in the striatum and in nigra as well as at 2 hours and 24 hours after MA injection. Our data suggest that MA site- and time- dependently altered the expression of RGs in nigrostriatal pathway.
In this study, the expression of RGs was examined by two methods. Results from Normfinder analysis differed slightly from that of geNorm. The difference arises from the distinct algorithm used. Normfinder employs a model-based variance estimation approach, which selects two best candidates genes with minimal combined inter- and intragroup expression variation. The measurement used in geNorm relies on the principle that the expression ratio of two ideal internal genes is identical across all tested samples, regardless of experimental condition or cell type. geNorm selects the optimum RG pair via a repeated stepwise exclusion algorithm, namely a pairwise comparison approach. The drawback of geNorm algorithm is that it may exclude the genes with expression differences in subgroups and then include a pair of co-regulated genes as the best pair based on their similarity in expression profiles(Andersen, Jensen, 2004). In contrast, the best reference gene pair by Normfinder is not based on the minimum intra- and inter-group variation, but the ones that can compensate for expression differences in the subgroups. Normfinder combines a gene that is overexpressed in one group but slightly under-expressed in the other group with another gene with opposite bias for the best performance. In this regard, Normfinder is considered a better approach than geNorm in terms of reference gene selection (Andersen, Jensen, 2004).
We found that the expression of RGs exhibit different stability patterns in striatum and nigra as well as at different time points. Amongst these genes, 18s rRNA, GPADH, and beta-actin were not stable in striatum and nigra in adult rats after MA administration, although these RGs have been frequently used as internal controls in many studies (Nakahara et al. , 2003, Pendyala et al. , 2012, Putzke et al. , 2007, Wang, Hayashi, 2001). Hmbs has been used as a stable reference for target genes in nigra at 3 days after MA treatment (Shen et al., 2011). In the current study, we also demonstrated that Hmbs is one of the most stable RGs in striatum and nigra at 24h after MA injection. However, the expression of Hmbs was not stable at all time. We found that MA reduced the expression of Hmbs in striatum and nigra at 2h after injection (Fig 5A). The reduction of Hmbs at this earlier stage is probably the result of the impact of hypoxia on heme homeostasis (Vargas et al. , 2008). These data suggest that the stability of RGs varies with time and selection of a proper reference gene at different time after injury is critical for target gene expression analysis.
We found that TH expression in striatum, normalized to relatively stable RGs, was significantly downregulated at 24 hours (Fig 4C), but not at 2h (Fig 4A), after the last dose of MA. TH expression in nigra was downregulated at both 2 and 24 hours after MA (Fig 4 B&D). These data suggest that TH expression in striatum (dopaminergic terminals) may undergo a less rapid change in TH expression following MA administration than that in nigra (dopaminergic cell bodies). A significant difference may not be observed at the early point in striatum when the relatively stable RGs were used for comparison.
We also demonstrated that selections of RGs altered interpretation of target gene expression. A false positive downregulation and a trend of upregulation of TH expression in striatum were found when less stable RGs (UBC, TBP or Hmbs) were used at 2 hours after MA administration (Fig 4A). These data suggest that the use of unstable RGs for normalization at 2 hour post injection leads to mis-interpretation of TH mRNA expression in striatum. The variation in TH expression supports our hypothesis that selection of an appropriate RG is crucial for accurate gene quantification in nigrostriatal dopamine tissues. It also implies that the effect of MA on gene expression may have been underestimated or overestimated if qPCR was performed without careful evaluation and selection of candidate RGs.
5. Conclusions
RGs are typically constitutive and stable genes that are required for the maintenance of basic cellular functions in control conditions. However, the expression of RGs can be altered along with target genes at different times after neuronal insults, such as MA injection. To obtain reliable results from qRT-PCR assays, it is necessary to evaluate the stability of RGs before they are selected as endogenous controls for qRT-PCR at each time points after injury.
Supplementary Material
Supplement Fig S1. Relative TH mRNA levels in striatum and nigra at 2h and 24h after MA treatment determined by qRT-PCR using different most stable gene pairs recommend by geNorm.
The expression levels of the saline group are set to 1. (*p<0.01, Student's t-test, n=8 for each group). (A) Normalizers: Rps6 and Actin; (B) Normalizers: Hprt and GAPDH; (C) Normalizers: Rps6 and Actin; (D) Normalizers: Hmbs and Actin.
Research Highlights.
€ The expression of reference genes (RGs) in rat nigrostriatal dopaminergic system can be altered by methamphetamine (MA).
€ Temporal and spatial changes in RGs expression were found after MA administration.
€ Selection of an unstable gene for reference altered the significance of TH mRNA expression after MA administration.
€ The impact of MA on RGs stability should be evaluated before determining gene expression in nigra and striatum.
Acknowledgements
This study was supported by National Health Research Institutes, Taiwan and National Institute on Drug Abuse, IRP, USA.
Footnotes
Publisher's Disclaimer: This is a PDF file of an unedited manuscript that has been accepted for publication. As a service to our customers we are providing this early version of the manuscript. The manuscript will undergo copyediting, typesetting, and review of the resulting proof before it is published in its final citable form. Please note that during the production process errors may be discovered which could affect the content, and all legal disclaimers that apply to the journal pertain.
References
- Andersen CL, Jensen JL, Orntoft TF. Normalization of real-time quantitative reverse transcription-PCR data: a model-based variance estimation approach to identify genes suited for normalization, applied to bladder and colon cancer data sets. Cancer Res. 2004;64:5245–50. doi: 10.1158/0008-5472.CAN-04-0496. [DOI] [PubMed] [Google Scholar]
- Bachmann RF, Wang Y, Yuan P, Zhou R, Li X, Alesci S, et al. Common effects of lithium and valproate on mitochondrial functions: protection against methamphetamine-induced mitochondrial damage. Int J Neuropsychopharmacol. 2009;12:805–22. doi: 10.1017/S1461145708009802. [DOI] [PMC free article] [PubMed] [Google Scholar]
- Bonefeld BE, Elfving B, Wegener G. Reference genes for normalization: a study of rat brain tissue. Synapse. 2008;62:302–9. doi: 10.1002/syn.20496. [DOI] [PubMed] [Google Scholar]
- Bustin SA, Benes V, Garson JA, Hellemans J, Huggett J, Kubista M, et al. The MIQE guidelines: minimum information for publication of quantitative real-time PCR experiments. Clin Chem. 2009;55:611–22. doi: 10.1373/clinchem.2008.112797. [DOI] [PubMed] [Google Scholar]
- Ferguson BS, Nam H, Hopkins RG, Morrison RF. Impact of reference gene selection for target gene normalization on experimental outcome using real-time qRT-PCR in adipocytes. PLoS One. 2010;5:e15208. doi: 10.1371/journal.pone.0015208. [DOI] [PMC free article] [PubMed] [Google Scholar]
- Gubern C, Hurtado O, Rodriguez R, Morales JR, Romera VG, Moro MA, et al. Validation of housekeeping genes for quantitative real-time PCR in in-vivo and in-vitro models of cerebral ischaemia. BMC Mol Biol. 2009;10:57. doi: 10.1186/1471-2199-10-57. [DOI] [PMC free article] [PubMed] [Google Scholar]
- Harvey BK, Chou J, Shen H, Hoffer BJ, Wang Y. Diadenosine tetraphosphate reduces toxicity caused by high-dose methamphetamine administration. Neurotoxicology. 2009;30:436–44. doi: 10.1016/j.neuro.2009.02.003. [DOI] [PMC free article] [PubMed] [Google Scholar]
- Hellemans J, Mortier G, De Paepe A, Speleman F, Vandesompele J. qBase relative quantification framework and software for management and automated analysis of real-time quantitative PCR data. Genome Biol. 2007;8:R19. doi: 10.1186/gb-2007-8-2-r19. [DOI] [PMC free article] [PubMed] [Google Scholar]
- Kogan FJ, Nichols WK, Gibb JW. Influence of methamphetamine on nigral and striatal tyrosine hydroxylase activity and on striatal dopamine levels. Eur J Pharmacol. 1976;36:363–71. doi: 10.1016/0014-2999(76)90090-x. [DOI] [PubMed] [Google Scholar]
- Krasnova IN, Ladenheim B, Hodges AB, Volkow ND, Cadet JL. Chronic methamphetamine administration causes differential regulation of transcription factors in the rat midbrain. PLoS One. 2011;6:e19179. doi: 10.1371/journal.pone.0019179. [DOI] [PMC free article] [PubMed] [Google Scholar]
- Luo Y, Wang Y, Kuang SY, Chiang YH, Hoffer B. Decreased level of Nurr1 in heterozygous young adult mice leads to exacerbated acute and long-term toxicity after repeated methamphetamine exposure. PLoS One. 2010;5:e15193. doi: 10.1371/journal.pone.0015193. [DOI] [PMC free article] [PubMed] [Google Scholar]
- Martin TA, Jayanthi S, McCoy MT, Brannock C, Ladenheim B, Garrett T, et al. Methamphetamine causes differential alterations in gene expression and patterns of histone acetylation/hypoacetylation in the rat nucleus accumbens. PLoS One. 2012;7:e34236. doi: 10.1371/journal.pone.0034236. [DOI] [PMC free article] [PubMed] [Google Scholar]
- Nakahara T, Kuroki T, Ohta E, Kajihata T, Yamada H, Yamanaka M, et al. Effect of the neurotoxic dose of methamphetamine on gene expression of parkin and Pael-receptors in rat striatum. Parkinsonism Relat Disord. 2003;9:213–9. doi: 10.1016/s1353-8020(02)00052-4. [DOI] [PubMed] [Google Scholar]
- Pendyala G, Ninemire C, Fox HS. Protective role for the disulfide isomerase PDIA3 in methamphetamine neurotoxicity. PLoS One. 2012;7:e38909. doi: 10.1371/journal.pone.0038909. [DOI] [PMC free article] [PubMed] [Google Scholar]
- Putzke J, Spina MG, Buchler J, Kovar KA, Wolf G, Smalla KH. The effects of p-chloroamphetamine, methamphetamine and 3,4-methylenedioxymethamphetamine (ecstasy) on the gene expression of cytoskeletal proteins in the rat brain. Addict Biol. 2007;12:69–80. doi: 10.1111/j.1369-1600.2006.00047.x. [DOI] [PubMed] [Google Scholar]
- Shen H, Luo Y, Kuo CC, Wang Y. BMP7 reduces synergistic injury induced by methamphetamine and ischemia in mouse brain. Neurosci Lett. 2008;442:15–8. doi: 10.1016/j.neulet.2008.06.052. [DOI] [PMC free article] [PubMed] [Google Scholar]
- Shen H, Luo Y, Yu SJ, Wang Y. Enhanced neurodegeneration after a high dose of methamphetamine in adenosine A3 receptor null mutant mice. Neuroscience. 2011;194:170–80. doi: 10.1016/j.neuroscience.2011.08.013. [DOI] [PMC free article] [PubMed] [Google Scholar]
- Shilling PD, Kuczenski R, Segal DS, Barrett TB, Kelsoe JR. Differential regulation of immediate-early gene expression in the prefrontal cortex of rats with a high vs low behavioral response to methamphetamine. Neuropsychopharmacology. 2006;31:2359–67. doi: 10.1038/sj.npp.1301162. [DOI] [PubMed] [Google Scholar]
- Tanic N, Perovic M, Mladenovic A, Ruzdijic S, Kanazir S. Effects of aging, dietary restriction and glucocorticoid treatment on housekeeping gene expression in rat cortex and hippocampus-evaluation by real time RT-PCR. J Mol Neurosci. 2007;32:38–46. doi: 10.1007/s12031-007-0006-7. [DOI] [PubMed] [Google Scholar]
- Trulson ME, Cannon MS, Faegg TS, Raese JD. Effects of chronic methamphetamine on the nigral-striatal dopamine system in rat brain: tyrosine hydroxylase immunochemistry and quantitative light microscopic studies. Brain Res Bull. 1985;15:569–77. doi: 10.1016/0361-9230(85)90206-0. [DOI] [PubMed] [Google Scholar]
- Ullmannova V, Haskovec C. The use of housekeeping genes (HKG) as an internal control for the detection of gene expression by quantitative real-time RT-PCR. Folia Biol (Praha) 2003;49:211–6. doi: 10.14712/fb2003049060211. [DOI] [PubMed] [Google Scholar]
- Vandesompele J, De Preter K, Pattyn F, Poppe B, Van Roy N, De Paepe A, et al. Accurate normalization of real-time quantitative RT-PCR data by geometric averaging of multiple internal control genes. Genome Biol. 2002;3:RESEARCH0034. doi: 10.1186/gb-2002-3-7-research0034. [DOI] [PMC free article] [PubMed] [Google Scholar]
- Vargas PD, Furuyama K, Sassa S, Shibahara S. Hypoxia decreases the expression of the two enzymes responsible for producing linear and cyclic tetrapyrroles in the heme biosynthetic pathway. FEBS J. 2008;275:5947–59. doi: 10.1111/j.1742-4658.2008.06723.x. [DOI] [PubMed] [Google Scholar]
- Wang Y, Hayashi T, Chang CF, Chiang YH, Tsao LI, Su TP, et al. Methamphetamine potentiates ischemia/reperfusion insults after transient middle cerebral artery ligation. Stroke. 2001;32:775–82. doi: 10.1161/01.str.32.3.775. [DOI] [PubMed] [Google Scholar]
- Xie F, Xiao P, Chen D, Xu L, Zhang B. miRDeepFinder: a miRNA analysis tool for deep sequencing of plant small RNAs. Plant Mol Biol. 2012;80:75–84. doi: 10.1007/s11103-012-9885-2. [DOI] [PubMed] [Google Scholar]
- Yao L, Chen X, Tian Y, Lu H, Zhang P, Shi Q, et al. Selection of housekeeping genes for normalization of RT-PCR in hypoxic neural stem cells of rat in vitro. Mol Biol Rep. 2012;39:569–76. doi: 10.1007/s11033-011-0772-8. [DOI] [PubMed] [Google Scholar]
Associated Data
This section collects any data citations, data availability statements, or supplementary materials included in this article.
Supplementary Materials
Supplement Fig S1. Relative TH mRNA levels in striatum and nigra at 2h and 24h after MA treatment determined by qRT-PCR using different most stable gene pairs recommend by geNorm.
The expression levels of the saline group are set to 1. (*p<0.01, Student's t-test, n=8 for each group). (A) Normalizers: Rps6 and Actin; (B) Normalizers: Hprt and GAPDH; (C) Normalizers: Rps6 and Actin; (D) Normalizers: Hmbs and Actin.