

Abstract
Quantitative analysis and understanding of signaling networks require measurements of the location and activities of key proteins over time, at the level of single cells, in response to various perturbations. Microfluidic devices enable such analyses to be conducted in a high-throughput and in a highly controlled manner. We describe in detail how to design and use a microfluidic device to perform such information-rich experiments.
Introduction
Methods for Single-Cell Analysis
Intracellular signaling involves the coordinated actions of many signaling proteins in space and time. Developing a quantitative, systems-level understanding of the behavior of such signaling networks increasingly requires comprehensive measurements of the subcellular locations and activities of key signaling components, such as kinases and transcription factors, at multiple time points in response to multiple experimental perturbations (1–3). Traditional assays, such as those involving immunoblotting, measure cell signaling at the level of the population average, which may mask behaviors of individual cells that differ from the average (4). Thus, assays at the level of single cells are important for developing a more complete, comprehensive, and sophisticated understanding of cell signaling.
The commonly used assays for measuring signaling at the level of single cells are live-cell imaging, flow cytometry, and immunocytochemistry. In many live-cell imaging protocols, a genetically encoded signaling protein is tagged with a fluorescent marker (for example, green fluorescent protein), so that its location or activity, or both, can be tracked over time with a microscope. These types of experiments can provide information not easily attainable by other methods, but are usually confounded by the need to overexpress the signaling protein of interest and by possible effects of the fluorescent marker on the protein’s function (5). The throughput of this method is predominantly quite low because only a relatively small number of cells can be monitored for each experimental perturbation, and perturbations are usually performed sequentially. In comparison, flow cytometry is a technique of a higher throughput, which does not require genetic manipulation of cells (6, 7). However, a critical drawback of flow cytometry is its lack of subcellular resolution. Consequently, flow cytometry cannot be used to measure translocation of signaling proteins (for example, translocation to the nuclear or membrane compartments), a key event in many signaling pathways. Finally, immunocytochemistry is a method that can also be used to interrogate signaling networks in genetically unmodified cells at subcellular resolution. The throughput of this technique can be increased through the use of a multiwell format and automated imaging techniques, such as in high-content cell screening (HCCS) (8). However, errors in liquid dispensing, both manually and robotically, preclude uniform handling of each well and place a limit on how finely signaling responses may be resolved (9). Furthermore, multiwell assays can be difficult or expensive to miniaturize, thus consuming large amounts of valuable cells and reagents.
Benefits of Microfluidic Devices
We described a microfluidic device designed for adherent-cell signaling experiments at the single-cell level that uses immunocytochemistry as a readout but overcomes the traditional limitations of HCCS (1). Laminar flow patterns within the microfluidic device ensure complete fluid turnover in a more controlled manner. Also, the microfluidic format is inherently miniaturized and allows parallel experimentation on thousands of cells with very small volumes (about 0.01 to 1 mL) of chemical media, thus requiring small amounts of reagents. The device is versatile and has been used to measure the effects of small molecule inhibitors on tumor necrosis factor (TNF) signaling, to examine putative differences in nuclear factor κB (NF-κB) signaling between the single-cell and population levels, and to analyze the effects of epigenetic changes in gene dosage on insulin growth factor-2 (IGF-2) signaling (1, 10). Likewise, various adherent-cell lines are compatible with the device, including mouse embryonic fibroblasts, cancer cells (for example, A549, HCT-15, and A498), astrocytes, and stemlike cells (1).
Here, we provide detailed information on how to use the device in cell signaling studies. Because the device can be produced through standard soft lithography methods in an appropriate microfabrication facility and the fabrication has been described (1), we focus on application of the device for cell signaling experiments and describe aspects of the device design that should be considered carefully when modifying the design for specific uses.
Typical Microfluidics Device Experiments
A typical experiment using the device involves loading cells into the device chambers, exposing each chamber to a perturbation consisting of a signaling ligand in an automated manner, fixing and staining the cells in situ in the chip, and imaging the stained cells. A straightforward analysis of the images involves quantifying the amount of a particular signaling protein for each cell and comparing the distributions resulting from each perturbation. Because the image data also record the location and morphology of each cell, additional spatial analyses may be performed. The analysis could, for example, focus on the intracellular distribution of a signaling protein within the context of a specific cell morphology. The data could also be used to determine whether signaling responses depend on the cell density and to interrogate related questions about cell-cell communication. The confined volume of a microfluidic chamber mimics the small intercellular spaces in real tissues and, consequently, increases the concentration of signals that might be secreted by cells. For this reason, the device may also be advantageous for studying autocrine and paracrine signaling systems.
Device Design
The device is a two-layer monolithic slab of polydimethylsiloxane (PDMS) reversibly bonded to a glass coverslip (Fig. 1, A and B). Valve channels are in the upper layer, and fluidic elements are in the lower layer. The core design of the fluidic layer (Fig. 1C) incorporates a set of main inlets that are connected to a set of chambers, which are, in turn, connected to a main outlet. The chambers are divided into two subsets consisting of 32 cell chambers and 10 sacrificial chambers. Integrated valves, including 10 multiplexing valves, control flow to the chambers and allow each cell chamber to be individually accessed (11). Other valves control flow from the main inlets and to the main outlet. The cell chambers can be divided into four groups that can be isolated from one another (by actuating valves 18 and 23), and each group has dedicated inlets and outlets with valves to facilitate parallel experiments. The device can be produced through standard soft lithography methods in an appropriate microfabrication facility (12). One important consideration is the network of channels that connect the main inlets to the cell chambers. The network in our device was designed to provide an even distribution of cells in the cell chambers without the use of valves, thereby allowing all of the chambers to be seeded simultaneously in a single step. We first tested a binary tree network (Fig. 2A), a common topology used in parallelized microfluidic devices (11, 13). In this network, a fluid channel splits into two channels, and then each branch further splits into two channels, and so on until the number of channels matches the number of cell chambers. This topology ensures that the total path length from the inlet to each chamber is the same for all chambers. Therefore, the resistances of the paths are equal, and for a fixed pressure drop, the flow rates and delay times to each chamber are also identical. This is a useful feature that allows equivalent manipulations of the fluid in each chamber during the cell signaling experiment. However, we also found that the collection of streams emanating from the binary tree network have large differences in cell density (Fig. 2A). The binary tree is therefore better suited for cell seeding protocols that rely on valves (13), or for experiments examining the effect of cell density on cell signaling, because it creates an approximately linear sampling of cell density, albeit in a nonmonotonic manner (Fig. 2D).
Fig. 1.

Device design. (A) Complete device design. The upper valve layer is shown in blue and the lower fluidic layer is shown in red. Circles indicate locations where holes are drilled to interface to the outside. Actual size is 21 × 40 mm. (B) Schematic showing the double-layer device design in cross section. (C) Schematic showing the location of major parts of the device.
Fig. 2.

Network shape affects cell distribution. Cell distributions differ in a binary tree network (A), a fanlike network (B), and a two-level fanlike network (C). (D) The distribution in (A) is replotted in sorted order and shows a roughly linear spread of cell numbers. A binary tree network has equal resistance to all outlets but a highly nonuniform cell distribution, whereas a fanlike network has unequal resistance to the outlets but a uniform cell distribution, except at the edges. A two-level fanlike network has nearly equal resistance to all outlets and a roughly uniform cell distribution to cell chambers, with lower density flow directed to the sacrificial chambers.
Ensuring that the cell density is the same from chamber to chamber requires an alternate distribution network. We found that one simple “fanlike” network, in which a single channel branches into many channels, has a nearly uniform exit distribution except at the edges (Fig. 2B). The nonuniformity at the edges reflects the phenomenon that fluid streamlines within one cell radius of the channel wall are depleted of cells (14). (The same phenomenon underlies the highly nonuniform distribution created by binary tree networks.) Unlike the binary tree topology, this network has different path lengths to each chamber: longer to the peripheral chambers and shorter to the central chambers. To compensate, we used a distribution network that has two levels of branching (Fig. 2C). At the first level, the inlet channel splits into 6 channels, and the middle 4 channels each split at the second level into 10 channels. This creates a total of 42 channels and, correspondingly, 42 chambers. The 10 chambers connected to the two peripheral channels of each of the five branch points are designated “sacrificial” because of their low cell density, whereas the remaining 32 “cell” chambers receive a uniform cell density and are used for experimentation. In this two-level design, the path length to each cell chamber can be made nearly identical, similar to the binary tree, while also providing uniform cell distribution to the experimental chambers (Fig. 2C).
Another important design consideration is device reusability. In our experience, the device is more easily reused if a “push-down” valve is used instead of a “push-up” valve (12, 15). In monolithic push-up devices, the cell chamber is completely enclosed within the PDMS, making it difficult to clean the chambers before reuse (13). In contrast, in monolithic push-down devices, the ceiling of the cell chamber is PDMS, and the floor is a glass coverslip. When the experiment is finished, the PDMS can be peeled off of the glass. The coverslip can be preserved if desired (for example, by mounting it to a glass microscope slide), and the PDMS is more easily cleaned because the ceiling of the cell chamber is exposed.
Materials
Device Preparation and Cleaning
Alconox powdered detergent (Alconox, #1104-1)
Ethanol, 70%
Glass coverslip, No. 1, 22 × 60 mm
HCl, 1 M
Microfluidic device (see “Device Design”)
Petri dishes, plastic, 10-cm diameter
Trypsin, 0.25% (Invitrogen, #25200-056)
Basic Microfluidic Device and Experiment Supplies
Blunt needles, 23-gauge, cut to ½-inch length (Small Parts, #HTXX-23R)
-
Blunt needle luer adapter, 23-gauge (BD Diagnostics, #427565)
Note: This particular adapter is preferred because its translucency allows bubbles to be easily detected by eye. Syringes, 1 mL (Becton Dickinson #309602)
Cell culture medium for the cell of interest
Cells of interest
Diamond-tipped stylus for glass scoring
Fluorescent-conjugated secondary antibody
Gel-loading pipette tips, round (Corning, #4853)
Gelatin, type A (Sigma, #G6144)
Goat serum (Invitrogen, #16210064)
Paraformaldehyde, 4% (Electron Microscopy Sciences, #157-4-100)
Phosphate-buffered saline (PBS) (Invitrogen, #14040-133)
Primary antibody
Stimulating agent dissolved in cell culture medium
Syringes, 1 mL (Becton Dickinson, #309602)
Triton X-100 (Sigma, #T9284)
Tweezers, two pairs
Tygon microbore tubing, 0.02-inch inner diameter (Cole Parmer, #EW-06418-02)
Equipment
Automated fluorescence microscope equipped with a charge-coupled device (CCD) camera [for example, Cascade 512B (Photometrics), and driven by imaging software such as Slidebook (Intelligent Imaging Innovations)]
Binocular light microscope
Cell culture facility
CO2 incubator (5%, 37°C), placed adjacent to the solenoid valves
-
Computer-controlled solenoid valves with pressure source
Note: Readers are referred to (11, 16) for guidance on how to construct their own computer-based valve controller. MATLAB software for image analysis (Mathworks)
-
Microfluidic device
Note: Device can be produced through standard soft lithography methods in an appropriate microfabrication facility such as the Whitaker Institute Lithography and Fabrication Facility at Johns Hopkins University (http://www.ece.jhu.edu/faculty/andreou/WhitakerFacility). Ultrasonic cleaner (Branson, #CPN-952-316)
Recipes
Recipe 1: 1% Alconox Cleaning Solution
Dissolve 1 gram of Alconox powder in 100 mL of warm dH2O (40 to 60°C).
Recipe 2: 0.1% Gelatin Solution
-
Add 0.5 grams gelatin to 500 mL of endotoxin-free dH2O. (Gelatin will not fully dissolve at this stage.) Within a couple of hours, autoclave the solution. Gelatin will solubilize and remain a solution. Store at 4°C.
Note: Depending on the experimental conditions, a solution of an extracellular matrix protein of interest may also be used.
Recipe 3: 0.1% Triton X-100 Solution
Dissolve 0.1 mL of Triton X-100 in 99.9 mL of PBS.
Recipe 4: 10% Goat Serum
Combine 10 mL of goat serum with 90 mL of PBS.
Recipe 5: Primary Antibody Solution
-
Dissolve primary antiboy to a working concentration in 10% Goat Serum (Recipe 4).
Note: Concentration will vary by antibody. Typical working dilutions range from 1:100 to 1:200 from the antibody stock solution (as provided by the manufacturer).
Recipe 6: Secondary Antibody Solution
-
Dissolve secondary antibody to a working concentration in 10% Goat Serum (Recipe 4).
Note: Concentration will vary by antibody. Typical working dilution range from 1:100 to 1:200 from the antibody stock solution (as provided by the manufacturer).
Instructions
Device Preparation
The device needs to be cleaned, then reversibly sealed to a glass substrate in preparation for an experiment. The glass should be cleaned to promote cell attachment after cells are loaded into the device. Ideally, steps 1 through 7 below should be performed in a low-dust environment, such as a clean room or high-efficiency particulate air (HEPA)–filtered laminar flow hood.
After preparing the device according to this protocol, we find that typically no special sterilization is required before its use. We attribute this to laminar flow within the device, which ensures that any nonsterile fluid within the device can be completely flushed out and replaced with sterile fluid. Additionally, the antibiotics that are commonly added to the culture media of mammalian cells lower the risk of contamination. However, if contamination is a concern, we recommend sterilization by shortwave ultraviolet light illumination.
Rinse the device with Alconox Cleaning Solution (Recipe 1) and then rinse thoroughly in dH2O.
-
Dry the surface, inlets, and outlets with an air stream.
Note: This step helps to remove dust. -
In a bath-type ultrasonic cleaner, sonicate a 22 × 60 mm glass coverslip immersed in a tray containing 1 M HCl for 30 min, rinse thoroughly with dH2O, and dry the surface in an air stream.
Note: The glass should by highly hydrophilic. Gently place the coverslip on the device.
Place the assembled device on a clean flat surface with the glass face down, and press out any air bubbles trapped between the PDMS and the glass.
-
Bake the assembled device overnight at 37°C in a nonhumidified environment to produce a tight, but reversible, bond to the glass.
Note: Baking at higher temperatures speeds up the bonding process but can also lead to warping of the device, which makes imaging more difficult. Baking at 37°C prevents warping. -
Place the assembled device on a flat plastic Petri dish and tape down the edges of the coverslip (Fig. 3).
Note: The thin coverslip cracks easily if bent. Taping it to a portable flat surface, such as a Petri dish, prevents accidental cracking. When releasing the device from the dish at the end of the experiment, be sure to peel off the tape in a direction parallel to the coverslip, rather than perpendicular to it, to avoid cracking the glass. -
Sterilize by placing the assembled device under shortwave ultraviolet light illumination for 1 hour.
Note: This step is optional.
Fig. 3.

Microfluidic device. An assembled device with a tube inserted into main inlet 16 and plugs in all other inlets and outlets is shown.
Basic Steps in Microfluidics
The methods require the experimenter to be familiar with the following basic steps. Novices often have difficulty inserting tubes and plugs into the device because it is difficult to find the target hole. The target hole is especially difficult to locate when a liquid droplet has formed at the entrance to the hole, which is necessary to avoid bubbles. Practice, steady hands, and a good set of tweezers help. Tips are provided for the appropriate steps.
Basic step 1: Making tubes
Make a tube by cutting a 180-cm length piece of Tygon microbore tubing (inner diameter 0.02 inch).
Insert a 23-gauge blunt needle luer adapter into one end.
Insert a 23-gauge, ½-inch-long blunt needle in the other end (Fig. 4). Autoclave before use.
Fig. 4.

Assembled microfluidic tube and plug.
Basic step 2: Making plugs
Make a plug by inserting a 23-gauge, ½-inch blunt needle into a 0.5-cm piece of Tygon microbore tubing.
Melt the tip of the tubing by holding it in the flame of a Bunsen burner for a few seconds, and then pinch shut (Fig. 4).
Autoclave before use.
Basic step 3: Filling and inserting a tube into the device
The main purpose of a tube connecting to a device inlet is to introduce a particular liquid into the device through positive hydrostatic pressure. For a 180-cm length tube, the minimum required liquid volume to fill the tube is approximately 400 μL. To avoid bubbles, at least 500 to 1000 μL of liquid is recommended.
Attach a 1-mL syringe to a tube (Basic step 1).
-
Immerse the tip of the tube into the solution of interest and use the syringe to draw up liquid to fill the entire tube and part of the syringe.
Note: Avoid introducing air bubbles by keeping the tip in the liquid the entire time. Remove the plunger of the syringe.
Tap out any bubbles, which are typically located where the syringe connects to the luer adapter of the tube.
If the tube is not to be immediately inserted into the device, insert the tip of the tube into the top of the syringe to avoid liquid dripping out, then tape the syringe to a vertical surface.
-
To insert the tube into the device allow a small liquid drop to form at the entrance of the inlet and allow a small liquid drop to form at the tip of the tube, then make liquid-to-liquid contact between these two drops and insert the tip 1 mm into the inlet.
Note: Liquid-liquid contact is essential to avoid introducing air bubbles into the device. If necessary, first remove any plug or other tube connected to the desired inlet (see Basic step 4). A droplet will form at the inlet due to fluid flow from other tubes attached to the device. Look carefully through the droplet to find the hole, then insert the tube into the hole. If the droplet becomes too large, blot with tissue paper and allow a new droplet to form and try again to insert the tube. Alternatively, once the droplet has formed, lower the other tubes attached to the device down to the level of the device. This will stop the flow so that the droplet does not continue to grow, thereby facilitating tube insertion.
Basic step 4: Plugging an inlet and removing tubes and plugs from the device
The size of the PDMS inlet is matched to the size of the plug or tube to ensure a snug fit. Plugs should not be pushed excessively far into the inlet. However, occasionally, the fit may be so snug that the force used to remove the plug or tube is transmitted through the PDMS and causes the PDMS to detach from the glass. The following procedure avoids this scenario. For tubes and plugs, the best grip is obtained by using tweezers to hold the portion of the Tygon microbore tubing that is wrapped around the blunt needle. For gel-loading pipette tips, the best grip is obtained by using tweezers to hold the pipette tip no more than 1 cm from the end.
-
To plug an inlet, insert a plug (Basic step 2) only 1 mm into the inlet.
Note: The plug will be snug and does not need to be pushed farther into the inlet. To remove a plug or tube from the device, with a pair of tweezers press down on the PDMS around the plug or tube to be removed and with a second pair of tweezers remove the plug or tube.
Cell Loading
In this section, we describe how to load the chambers of the device with cells. The steps described rely on the basic steps described in the previous section. Figure 5 illustrates schematically the inlets and outlets and when they are plugged and the positions of the tubes with the solutions.
Fig. 5.

Schematic of cell seeding and immunostaining procedures. (A to H) shows the configuration of device, tubes, and plugs for seeding the device with cells: (A) priming the device with a solution of extracellular matrix (ECM) proteins, (B) coating with ECM proteins, (C) exchanging ECM and cell medium tubes, (D) flushing excess ECM proteins out of the device, (E) inserting the pipette tip containing cells, (F) flowing cells into the device, (G) exchanging the pipette tip with a plug, and (H) incubating the device while cells attach and spread. (I to L) shows the basic steps involved in in situ immunocytochemistry: (I) using negative hydrostatic pressure to introduce an immunocytochemical reagent into the device, (J) incubating the reagent for the desired period of time, (K) generating a liquid bubble, and (L) washing out the reagent with PBS. The inlet and outlet sides of the device are indicated with I and O, respectively, and the arrow indicates the direction of flow, if any.
Fill a tube with a solution of an extracellular matrix protein, such as 0.1% Gelatin Solution (Recipe 2), to aid in cell adherence to glass.
Insert the tube into one of the main inlets of the device (Fig. 5A).
Plug each inlet and outlet after the gelatin solution emerges from it.
-
When all the holes are plugged, raise the tube to its maximum height (Fig. 5B) and allow coating to proceed for at least 30 min.
Note: Some air bubbles may be trapped in the device during this step. Raising the tube raises the hydrostatic pressure inside the device and pushes out the air after a few minutes (PDMS is permeable to nonpolar gases). Lower the tube of gelatin to the height of the device (Fig. 5C).
Remove the plug in the main outlet and insert a tube filled with culture medium.
Remove the tube of extracellular matrix protein, which should leave one open inlet.
Place the tube of medium about 50 cm above the device and wait 3 min to ensure that the medium completely flushes through the entire device (Fig. 5D).
Plug the open inlet and use tissue paper to blot off the excess liquid.
-
Trypsinize, pellet by centrifugation (1200 rpm for 5 min), and resuspend the cells at 9 × 10⁶ cells/mL. Pipette up and down vigorously to break up cell clumps into single cells.
Note: At this cell density, each chamber will be seeded with about 300 cells. A fully confluent 75-cm2 flask typically yields 100 to 300 μL of solution at this density, allowing multiple devices to be seeded, if desired. Move the device to a bench top space close to a binocular light microscope.
-
Remove the plug from one of the main inlets. Fill a gel-loading pipette tip with 50 μL of resuspended cells and insert it into the open inlet (Fig. 5E).
Note: Ensure liquid-liquid contact by pushing a small amount of liquid out of the pipette tip just before inserting it into the inlet. Also, with practice, cell seeding can be performed with as little as 10 μL of resuspended cells, which allows the use of very small amounts of cells. Detach the pipette tip from the pipettor. Immediately lower the cell medium tube to ~50 cm below the device (Fig. 5F) to allow the cell solution to flow into the device through negative hydrostatic pressure.
Transfer the device onto the stage of the binocular light microscope.
Watch the cell solution flow into the device using the binocular light microscope. After ~30 s, the device should be filled uniformly with cells.
Raise the cell medium tube to the same height as the device, remove the pipette tip, and plug the inlet (Fig. 5G). Use tissue paper to blot off the excess liquid.
-
Place the device in a 37°C, 5% CO2 humidified incubator. Tape the cell medium syringe to the wall of the incubator at least 30 cm above the device (Fig. 5H).
Note: Over periods of hours, air bubbles can spontaneously nucleate and grow inside the device at negative hydrostatic pressure. Elevating the cell medium syringe maintains a small positive hydrostatic pressure in the device and prevents bubbles from forming. Allow 4 to 18 hours for cells to attach and spread, depending on the cell line.
Running a Time-Course Experiment
Here, we describe how to perform an experiment in the device that yields a detailed time course of cell signaling activity in response to a solution of a single stimulus or drug (for example, 10 ng/mL TNF in cell culture medium). Figure 6 shows the device and associated equipment.
Fig. 6.

Assembled equipment for performing experiments with the microfluidic device.
The experiment is performed with computer automation that is designed to toggle valves in sequence so that each chamber receives the stimulus for a different duration. Ideally, the stimulus start times should be staggered, so that the stimulus end times all coincide, and then the cells are all fixed simultaneously. After fixation, the chambers are flushed with PBS and can be stored for at least 6 weeks at 4°C. The automation should flush each liquid through the sacrificial channels for 60 s just before its first use. At 15 cm-H2O pressure difference, this 60-s flush into the sacrificial channels ensures that the dead volume between the main inlet and cell chamber entrance is exchanged. Fluids should flow into the cell chambers for 15 s to ensure that the fluid inside the chamber is completely exchanged. The shear stress that the cells experience is ~2 dyne/cm2, which may be detrimental if applied continuously for minutes to hours (17) but is well tolerated by many kinds of cells for a few seconds.
Turn the solenoids to manual control (Fig. 6).
Fill pressure lines 1 through 15 with water and plug them into the corresponding valve channels on the device (Fig. 1A, blue circles).
-
Fill the valve channels in the device with water by raising the pressure in the valves, one at a time, to 5 pounds per square inch (psi). Keep the cell medium syringe elevated ~50 cm above the device.
Note: Filling the valve channels one at a time at a low pressure, while maintaining a positive hydrostatic pressure in the cell chambers, prevents the air being pushed out of the valve channels from forming bubbles in the cell chambers. Raise the pressure in all valves to 20 psi, thereby closing all the microfluidic valves.
Unplug main inlet 13.
-
Toggle valves 11 and 13 off for a few seconds to generate a small liquid drop at inlet 13.
Note: Toggling valves 11 and 13 allows flow from the cell medium tube, which is currently inserted at the main outlet, to pass through the sacrificial channels to inlet 13. This generates the droplet needed to maintain liquid-liquid contact when inserting the tube at inlet 13, without affecting the experimental cell chambers. Plug a tube filled with stimulus solution into inlet 13.
Unplug inlet 14, toggle valves 11 and 14 off for a few seconds to generate a small liquid drop at inlet 14, then plug a tube of 4% paraformaldehyde into inlet 14.
Unplug inlet 15, toggle valves 11 and 15 off for a few seconds to generate a small liquid drop at inlet 15, then plug a tube of PBS into inlet 15.
Place the device in a 37°C, 5% CO2 incubator (Fig. 6).
Arrange the tubes so that the liquid levels of the stimulus solution, 4% paraformaldehyde, and PBS are 15 cm above the liquid level of the cell medium (outlet) syringe.
-
Turn the solenoids to computer control and begin an experiment with the following parameters:
Stagger the addition of the stimulus solution to achieve desired time course, flushing through the sacrificial channels for 60 s, and then flow for 15 s through cell channels. See Table 1 for a detailed list of the toggling pattern of valves.
Flush 4% paraformaldehyde through the sacrificial channels for 60 s, then flow for 15 seconds through all the chambers and hold in the chambers for 20 min.
Flush PBS through sacrificial channels for 60 s, then flow for 15 seconds through all the chambers and store in PBS.
At the end of the experiment, replace the tubes inserted at inlet 13, inlet 14, and the main outlet with plugs, leaving the PBS tube inserted at inlet 15.
Switch the solenoids to manual control and toggle them all off.
Unplug all of the pressure lines from the device.
-
Store the device at 4°C with the PBS tube elevated ~50 cm above the device. This ensures bubbles do not form in the device while it is in storage.
Note: Devices with fixed cells can be stored in PBS for at least 6 weeks at 4°C before staining.
Table 1.
Multiplex valve toggling pattern for controlling fluidic entry to individual channels. To isolate the indicated nonsacrificial channels from fluidic flow, toggle off valve 12, and toggle on valve 11 and the control valves associated with the channel. To allow flow through the sacrificial channels, toggle off valve 11. Example 1: To flush material from inlet 13 through the sacrificial channels, toggle off valves 11 and 13 and leave on valves 1 through 10 and 12; then, to flow material from inlet 13 through channel 37 only, toggle on 2, 3, 6, 8, 10, and 11 and leave off 1, 4, 5, 7, 9, 12, and 13. The table lists the valves that can be toggled on without impeding flow to the indicated channels (if any others from 1 through 10 are toggled on, flow will be impeded). Thus, by omitting some valves entirely (for example, 7 through 10 in the case where we only use 1 through 6), we can address multiple channels at the same time and perform identical time courses in parallel. Example 2: Toggling on 1, 3, and 5 and leaving off 2, 4, 6, 7, 8, 9, and 10 allows flow only to channels 2, 12, 22, and 32; hence, these four channels can be treated at the same time.
| Channel Number | Associated Multiplex Valve Control |
|---|---|
| 1 | Sacrificial |
| 2 | 1, 3, 5, 7, 9 |
| 3 | 2, 3, 5, 7, 9 |
| 4 | 1, 4, 5, 7, 9 |
| 5 | 2, 4, 5, 7, 9 |
| 6 | 1, 3, 6, 7, 9 |
| 7 | 2, 3, 6, 7, 9 |
| 8 | 1, 4, 6, 7, 9 |
| 9 | 2, 4, 6, 7, 9 |
| 10 | Sacrificial |
| 11 | Sacrificial |
| 12 | 1, 3, 5, 8, 9 |
| 13 | 2, 3, 5, 8, 9 |
| 14 | 1, 4, 5, 8, 9 |
| 15 | 2, 4, 5, 8, 9 |
| 16 | 1, 3, 6, 8, 9 |
| 17 | 2, 3, 6, 8, 9 |
| 18 | 1, 4, 6, 8, 9 |
| 19 | 2, 4, 6, 8, 9 |
| 20 | Sacrificial |
| 21 | Sacrificial |
| 22 | 1, 3, 5, 7, 10 |
| 23 | 2, 3, 5, 7, 10 |
| 24 | 1, 4, 5, 7, 10 |
| 25 | 2, 4, 5, 7, 10 |
| 26 | 1, 3, 6, 7, 10 |
| 27 | 2, 3, 6, 7, 10 |
| 28 | 1, 4, 6, 7, 10 |
| 29 | 2, 4, 6, 7, 10 |
| 30 | Sacrificial |
| 31 | Sacrificial |
| 32 | 1, 3, 5, 8, 10 |
| 33 | 2, 3, 5, 8, 10 |
| 34 | 1, 4, 5, 8, 10 |
| 35 | 2, 4, 5, 8, 10 |
| 36 | 1, 3, 6, 8, 10 |
| 37 | 2, 3, 6, 8, 10 |
| 38 | 1, 4, 6, 8, 10 |
| 39 | 2, 4, 6, 8, 10 |
| 40 | Sacrificial |
Staining the Cells
Performing immunocytochemistry of cells in the device is similar to performing traditional immunocytochemistry of cells on slides. The cells are incubated with the same solutions as those used for immunocytochemistry of cells on slides for the same period of time, and in the same sequence. The main protocol adaptations for the device relate to using negative hydrostatic pressure to introduce each solution into the device and using positive hydrostatic pressure to wash the cells with PBS between steps. Here, we provide a generic protocol that minimizes the amount of antibodies used. Figure 5 (panels I through L) shows the various inlets and outlets with the appropriate plug or solution tube.
-
Remove the device from storage and place the PBS tube ~50 cm above the device.
Note: There should be only one tube inserted into the device: PBS inserted at one of the main inlets. -
Unplug the main outlet and insert a gel-loading pipette tip filled with 100 μL 0.1% Triton X-100 (Recipe 3).
Note: Accidental introduction of air bubbles should be avoided at every stage of operation. Follow the techniques described in Basic steps 3 and 4 whenever the protocol calls for unplugging and inserting pipette tip or tube. -
Lower the PBS tube to ~50 cm below the device (Fig. 5I) and wait 3 min to allow the permeabilization solution to flush into the device.
Note: Three minutes at the indicated height ensures that the fluid within the device is completely exchanged several times. -
Unplug the PBS tube from the main inlet and insert a plug in its place. Allow at least 100 μL to drain out of the PBS tube (Fig. 5J) to flush out contaminants near the tip of the tube, which allows the tube to be reused.
Note: Refill the tube with PBS if needed. Allow permeabilization to proceed for 5 min.
Remove the plug from the main inlet and wait for a small droplet to form (Fig. 5K).
Plug PBS into the main inlet, place the tube ~50 cm above the device (Fig. 5L), and allow PBS to flush through the device for 3 min.
Fill a gel-loading pipette tip with 100 μL 10% Goat Serum (Recipe 4) and insert it into the main outlet.
Lower the PBS tube to ~50 cm below the device and wait 3 min (Fig. 5I).
Unplug the PBS tube from the main inlet, insert a plug in its place, and allow at least 100 μL to drain out of the PBS tube (Fig. 5J).
Allow blocking to proceed for 1 hour.
Remove the plug from the main inlet and wait for a small droplet to form (Fig. 5K).
Plug PBS into the main inlet, place the tube ~50 cm above the device (Fig. 5L), and allow PBS to flush through the device for 3 min.
-
Fill a gel-loading pipette tip with 100 μL Primary Antibody Solution (Recipe 5), and insert it into the main outlet.
Note: The primary or secondary antibody solution may also contain counterstaining reagents (such as DAPI, Hoechst, or other nuclear dyes) for simultaneous staining. Lower the PBS tube to ~50 cm below the device and wait 3 min (Fig. 5I).
Unplug the PBS tube from the main inlet, insert a plug in its place, and allow at least 100 μL to drain out of the PBS tube (Fig. 5J).
-
Incubate with primary antibody solution for 1 hour.
Note: Device should be protected from light if the primary antibody solution contains a light-sensitive dye. Remove the plug from the main inlet and wait for a small droplet to form (Fig. 5K).
Plug PBS into the main inlet, place the tube ~50 cm above the device (Fig. 5L), and allow PBS to flush through the device for 3 min.
Fill a gel-loading pipette tip with 100 μL fluorescent-conjugated Secondary Antibody Solution (Recipe 6) and insert it into the main outlet.
Lower the PBS tube to ~50 cm below the device and wait 3 min. (Fig. 5I).
Unplug the PBS tube from the main inlet, insert a plug in its place, and allow at least 100 μL to drain out of the PBS tube (Fig. 5J).
Cover the device to protect it from light and incubate in secondary antibody solution for 1 hour.
Remove the plug from the main inlet and wait for a small droplet to form (Fig. 5K).
Plug PBS into the main inlet, place the tube ~50 cm above the device (Fig. 5L), and allow PBS to flush through the device for 3 min.
Plug the open inlet and store the device in the dark at 4°C with the PBS tube elevated at least 30 cm above the device to ensure that bubbles do not form in the device while it is in storage.
Imaging the Cells and Quantifying Signaling Activities
After staining, the cell chambers can be imaged with the appropriate fluorescence microscopy modality. Typically, we image each cell chamber in its entirety using overlapping fields of view under nonsaturating conditions on a motorized Zeiss Axiovert 200M epifluorescence microscope equipped with a Cascade 512B CCD camera (Photometrics). Custom MATLAB programs (available upon request) were written to correct for background fluorescence and seamlessly stitch the images together (Fig. 7). Analysis is performed on the stitched images, thereby ensuring that every cell is analyzed in an identical way. Here, we describe the algorithm implemented in MATLAB for quantifying signaling activities in the nuclei of cells, which can be adapted to quantify other metrics of interest.
Fig. 7.

Example image data obtained from the microfluidic device. (A) Composite fluorescent image of an immunostained device (left, scale bar 500 μm) and enlarged view of cells in one chamber (right, scale bar 50 μm). Each row is a chamber, and each colored spot is an A549 lung cancer cell. Cells were stimulated with 10 ng/mL TNF for the indicated times. Sacrificial chambers are denoted “Sac.” Actin (phalloidin) is shown in red, signaling proteins (c-Fos, p65, phosphorylated c-Jun, and phospho-ATF2 in groups A, B, C, and D respectively) are shown in green, and nuclei (Hoechst 33258) are shown in blue.
Performing the background correction
Image each chamber using side-by-side fields of view that overlap by at least 10% of the width of each field. Obtain both fluorescence (antibody stains and counterstains, such as nuclear dyes) and phase-contrast images for each field.
-
Using a clean glass slide, acquire the darkfield (bias) image of the imaging system by averaging three images at the focused plane of the slide while all incident and ambient light sources are turned off.
Note: Alternatively, the darkfield can be measured by taking images when all of the emitted light is directed away from the camera (for example, toward the eyepiece). For each fluorescent channel used, acquire its flatfield (gain) image by averaging three images of a uniformly fluorescent object, such as a solution of dye.
Correct each image using the following Equation 1 by applying the formula on a pixel-by-pixel basis.
| (Eq.1) |
I is the image, df and ff respectively are the darkfield and flatfield images, Icorr is the corrected image, and F and D are constants. The denominator, ff − df, is the darkfield-corrected flatfield and is the pure gain (ratio of light collected to light emitted) of the imaging system. The numerator, I − df, is the darkfield-corrected image and is a true measure of the amount of light collected. Thus, the ratio (I − df)/(ff − df) is a true measure of the light emitted (18). The constants F and D are used to rescale Icorr so that its intensity range is similar to that of I. We recommend setting F equal to the mean value of ff − df and setting D equal to the mean value of df.
Stitching together the images
Determine the approximate alignment position for each pair of overlapping images based on the location metadata recorded with the images.
For candidate alignments around this guess, compute the mean value of the absolute difference in pixel values in the overlapping area for the phase-contrast images. This metric is minimized when two images are properly aligned.
Stitch the phase-contrast images and record all of the alignments.
With the recorded alignments, stitch together the fluorescent images; this ensures pixel-by-pixel correspondence between all of the stitched images.
Identifying the nuclei and quantifying the signal
Segment the cell nuclei in the nuclear dye image (Fig. 8A, panels 1 to 3) by determining the locations of pixels with intensity value above a certain threshold, typically at least 3 standard deviations above the mean value of the background intensity.
Perform clean-up operations as necessary, such as filling in small holes, or rejecting regions that are too small, too large, or too irregular to be true nuclei.
-
Apply a morphological erosion filter to the nucleus mask using a disk a few pixels in diameter to eliminate these extranuclear pixels in the boundary of each nucleus (Fig. 8A, panel 4).
Note: Because nuclear dyes tend to be very bright, lateral blur will cause pixels just outside of the nucleus to be bright. For each nucleus, average the corresponding pixels in antibody-stained image (Fig. 8A, panels 5 and 6).
Compute other metrics as desired, such as the coordinate of the center of each nucleus and its area.
Fig. 8.
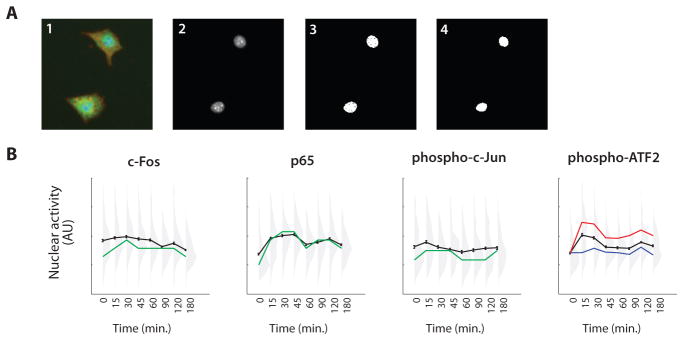
Example image analysis. (A) Panels show (1) overlaid images of nuclei (blue), antibody stain (green), and actin (red); (2) nuclear dye image; (3) segmented nuclei; (4) final nuclear mask; (5) nuclear mask overlaid on antibody stain image; and (6) nuclear mask overlaid on phase-contrast image. (B) Quantification of signaling protein activity from the image in Fig. 7. The mean activity is plotted in black (error bars, standard error of the mean). Distributions of signaling protein activity at each time point are shown in gray, with each distribution consisting of ~300 cells. In the three leftmost panels, the positions of the peaks in the distributions are traced in green. In the rightmost panel, the approximate mean of the two modes of the bimodal distributions are indicated by the red and blue curves. For each signaling protein, there are statistically significant changes in the average over time, but this masks large actual cell-to-cell variability, as indicated by substantial overlaps between the distributions.
Cleaning the Device
-
Carefully and gently peel off the glass coverslip.
Note: With practice, the coverslip can be removed in one piece. Use one hand to gently compress or bend the device so that it progressively detaches from the glass. Use the other hand to hold the coverslip and to sense the amount of force transmitted to the glass. Do not allow the glass to bend, even slightly, or it will crack. To prevent the cells fixed to the glass from drying out, immerse the coverslip in PBS.
With a diamond-tipped stylus, score the glass and cut out the portion corresponding to the cell chambers.
-
Mount and seal the coverslip to a glass microscope slide.
Note: Steps 2 through 4 are optional. Instead cells and coverslip may be discarded. Rinse the device with dH2O and blot dry.
Submerge the device in 0.25% trypsin at 37°C for 30 min to remove any protein or cellular material adhered to the device.
Rinse the device thoroughly in dH2O.
Store face up in a plastic Petri dish.
Rinse tubes by passing through 2 mL each of Alconox Cleaning Solution (Recipe 1), dH2O, and 70% ethanol.
Flush out the tubes with air and autoclave before reuse.
Variations on the Basic Protocol
Seeding multiple cell types
The device can be divided into four groups of chambers (A, B, C, and D) that can each receive different resuspended cell solutions (Fig. 1B). Each group has its own inlet and outlet that are used to introduce a different cell line to each group. This enables direct comparison of signaling time courses across different cell types.
Complete steps 1 through 9 of “Cell Loading.”
Attach tubes of cell culture medium to the outlets corresponding to valves 19 through 22.
Fill valve channels 18 and 23 with water, then pressurize to 20 psi to close the valves.
Unplug the four inlets corresponding to valve 17.
Trypsinize and spin down each of the cell lines, and resuspend at 9 × 10⁶ cells/mL. Resuspend vigorously to break up cell clumps into single cells.
For each cell line, fill a gel-loading pipette tip with 50 μL cell solution and insert it into one of the open inlets corresponding to valve 17.
Detach the pipette tip from the pipettor and immediately lower the corresponding outlet tube ~50 cm below the device.
Watch the cells flow into the device (~30 s) with a binocular light microscope.
Raise the outlet tube to the same height of the device, remove the pipette tip, and plug the inlet.
Blot excess liquid with tissue paper.
Place the device in a 37°C 5% CO2 humidified incubator. Tape all outlet tubes to the wall of the incubator at least 30 cm above the device.
Allow 4 to 18 hours for cells to attach and spread.
-
After cells have attached to the glass substrate, remove the tubes inserted into outlets 19, 20, 21, and 22, and plug the holes.
Note: This leaves a single tube of cell medium inserted at the main outlet. Toggle off valves 18 and 23.
Proceed with experiment.
Performing identical time courses in parallel
In some experiments, the same time course of stimulus is applied to each of the four groups of chambers. This is useful, for example, to measure the same signaling protein in four different cell types responding to the same conditions. Alternately, this scheme can be used to measure four different signaling proteins in a single cell type under the same conditions.
To implement this type of experiment, use only valves 1 through 6 to control the time at which solutions are applied to the cell chambers (see Table 1 for details.) The multiplexed design ensures that corresponding chambers from each of the four groups will be exposed simultaneously. In contrast, independent control over each chamber requires using valves 1 through 10.
Performing complex time courses using two stimuli
The device can be used to implement time-course experiments in which cells are exposed to two fluids in an arbitrary sequence. For example, we conducted an experiment in which cells were exposed to sequential pulses of TNF, with washouts in the intervening periods (1). Because the device is flexible enough to permit a wide variety of such experiments, we cannot here provide a specific protocol that would describe how to perform all such experiments. Instead, we discuss the important considerations.
The device should be coated and seeded as per the basic protocol. A tube of each stimulus should be inserted into main inlets 13 and 14, a tube of fixative in main inlet 15, and a tube of PBS in main inlet 16. The experiment is primarily implemented by programming the solenoid valves to toggle in a pattern that exposes each chamber to the stimuli in the desired pattern for the desired duration. We recommend that the experiment be performed so that the end points for the chambers all coincide. In this way, all the cells can be simultaneously fixed and washed. Also, it is important to verify that two different fluids do not need to be applied to the different chambers at the same time, and that two chambers that need the same fluid at the same time can be addressed simultaneously by the multiplexer. Violations of these constraints, which would otherwise make the experiment impossible, can sometimes be circumvented by rearranging the assignments of stimulation patterns to chambers (1).
Multiple antibody staining
Another common experiment that can be implemented in the device is performing identical time courses in each of the four groups of channels, then staining cells in each group with a different antibody (Fig. 7). This enables multiple signaling readouts to be measured in parallel. As with all other experiments, accidental introduction of air bubbles should be avoided at every stage of operation. Follow the techniques described in Basic steps 3 and 4 whenever the protocol calls for unplugging and inserting pipette tips or tube.
-
1
Complete steps 1 through 11 in “Staining the Cells.”
-
2
During the blocking, fill valve 18 with water, then pressurize it to 20 psi to close the valve.
-
3
Remove the plugs for the four inlets corresponding to valve 17.
-
4
Fill gel-loading pipette tips with 100 μL of one of each of the four primary antibody solutions and insert them into the inlets.
Note: Be careful to avoid cross-contamination of the solutions. -
5
Remove the pipette tip of 10% Goat Serum (Recipe 4) that is attached to the main outlet.
-
6
Insert a tube of PBS in this outlet, immediately lower it to ~50 cm below the device, and allow the primary antibody solutions to flush through the device for 3 min.
-
7
Unplug the PBS tube from the main outlet and allow 100 μL to drain out of the PBS tube.
-
8
Incubate with Primary Antibody Solution (Recipe 5) for 1 hour.
-
9
Insert a tube of PBS into the main outlet and raise it to ~50 cm above the level of the device.
-
10
Detach the primary antibody pipette tips and wash the cells for 3 min.
-
11A
Apply secondary antibodies in the same manner as steps 2 through 10 above using secondary antibody solutions, instead of primary antibody solutions, at step 4.
Note: These steps are for separate application of the secondary antibody solutions. -
11B
Release valve 18, plug the inlets corresponding to valve 17, and remove the plug from one of the main inlets. Fill a gel-loading pipette tip with 100 μL of the Secondary Antibody Solution (Recipe 6) and insert it into the open main inlet, incubate for 1 hour, and wash, as in steps 9 and 10.
Note: This option can be used if the secondary antibody is the same for all the primary antibodies, or the secondary antibodies can be mixed together in a common solution (because they display negligible cross-reactivity). -
12
Plug all open inlets, then store the device in the dark at 4°C with the PBS tube elevated at least 30 cm above the device.
Troubleshooting
Flow Impeded by Dust
Dust trapped between the PDMS and the glass coverslip will prevent fluid flow. If a dust particle “connects” two adjacent channels, then flow to these channels cannot be controlled independently and the device is unusable. Remove the glass coverslip from the device, reclean the device and the glass, and reassemble the device in a low-dust environment. To quickly check for dust by eye, hold the device with the glass face up and oriented so that the reflection of a nearby light bulb is visible in the glass. In this orientation, regions where the PDMS is not directly touching the glass, due to the presence of channels, chambers, or dust, will stand out as brighter than regions of the PDMS that directly touch the glass. Alternatively, use a binocular light microscope at low power magnification to scan for dust.
Poor Cell Attachment
Adequate cell attachment is essential. Cells will have difficulty attaching to chemically contaminated surfaces. Thus, the first step is to ensure that the glass is clean. Use fresh cleaning solutions and check that the glass is highly hydrophilic after cleaning. A simple “liquid drop test” can be used to gauge hydrophilicity. A 10-μL water drop will remain beaded on a hydrophobic surface but will rapidly spread out to a thin sheet encompassing a large area upon contacting a hydrophilic surface. The second step for enhancing cell attachment is optimizing cell surface coating agents. We find that many cell types attach to 0.1% gelatin, 10 μg/mL fibronectin, or a mixture of both. Some cell types require special surfaces for culture. For example, various types of neurons often attach much better if the cell substratum is coated with laminin, and sometimes attach better on German or Desag borosilicate glass. Avoid the use of poly-L-lysine or poly-D-lysine in this device design, because it makes the glass surface too adhesive (cells stick during seeding, rather than after, causing clogs).
Bubbles in the cell chamber
Bubbles are undesirable for at least two reasons. First, they interfere with the designed pattern of liquid flow within the device. Second, they can dry out and kill cells. To prevent bubbles from forming, keep in mind that bubbles are usually caused by one of the following reasons:
Liquid-liquid contact was not established before inserting a tube into the device. Avoid this by ensuring that a liquid drop at the inlet, however small, touches a liquid drop at the tip of the tube before inserting the tube.
A bubble present in a tube that is already inserted into the device flows into the device. Avoid this by ensuring the tip of the tube is submerged during the entire time that liquid is drawn into the tube, and tap out bubbles at the bottom of the syringe.
Air from a valve channel is pushed into the fluidic layer. Avoid this by dead-end filling the valve channel at a low pressure (5 psi) while maintaining a positive hydrostatic pressure in the lower layer (by raising the tube that is already inserted into the device).
Bubbles spontaneously nucleate in the device. The primary way to avoid this is to always maintain a positive hydrostatic pressure, by raising the tubes that are already inserted into the device, during any long incubation or storage steps. Degassing fluids before use in the device can also help, as does keeping the device in a humidified environment.
If a bubble forms accidentally, first check to see if is due to the third reason. If so, immediately toggle off the solenoid valves to prevent the bubble from growing. Then, to eliminate any type of bubble, plug all open inlets. Raise all tubes that are inserted into the device to their maximum height to apply positive hydrostatic pressure to push the trapped gas out of the device by diffusion through the PDMS (PDMS is highly permeable to nonpolar gases).
Notes and Remarks
In Figs. 7 and 8, we show results from a typical multiple-antibody experiment. We exposed A549 lung cancer cells to 10 ng/mL TNF for up to 3 hours and measured the nuclear activity of four transcription factors: c-Fos, p65 (NF-κB), phosphorylated c-Jun, and phosphorylated activating transcription factor 2 (ATF2). Examining the data at the population level (mean responses shown in black in Fig. 8B), we find that c-Fos activity peaks at 30 min, p65 shows biphasic behavior peaking at 30 to 45 min and again at 120 min, and c-Jun and ATF2 peak at 15 min and quickly return to basal levels. Standard errors indicate that these changes in time are significant and suggest that the signaling dynamics are well defined. Re-examining the data at the single-cell level, however, paints a different picture (distributions shown in gray in Fig. 8B). The most likely behavior of an individual cell, given by the peaks of the distributions (shown in green in Fig. 8B), shows much larger changes in time compared with the population average. Also, for all conditions, the total variability is large relative to the error bars, and there is a substantial overlap in the distributions, even between the distributions with the highest and lowest averages. For phosphorylated ATF2 in particular, the distributions appear to be bimodal at several time points, with one subpopulation of cells showing persistently elevated activity in response to TNF and the other subpopulation deviating little from the unstimulated control (zero time point; see red and blue curves in Fig. 8B). Thus, many cells do not appear to respond, even though there is a significant shift in the average response of the overall population. We have observed that this behavior is a common feature of signaling in many cell types in response to many stimuli.
These data indicate that it is important to distinguish between experimental error and real cell-to-cell variability when studying signaling at the single-cell level. Experimental error in population-level metrics (for example, mean and median) decreases as the number of cells measured increases. In the experiment shown in Figs. 7 and 8, each chamber has ~300 cells, which allows changes in the average to be distinguished. On the other hand, the actual cell-to-cell variability is not affected by the number of cells measured. Furthermore, ~300 cells is enough to determine the actual variation (standard deviation of the distribution) to within . That is to say, experimenting with a few hundred cells is both sufficient for detection of significant changes in signaling within the population and enough to accurately capture the breadth of the distribution of single-cell responses. As such, after measuring a few hundred cells for a given condition, there may be less to gain from measuring more cells under the same condition than from measuring cells exposed to some other conditions. Thus, analyses using the described microfluidic device, with its emphasis on parallel experimentation, can be expected to quickly generate a wealth of data with high statistical power.
Related Techniques
Microfluidic devices have been used to culture various types of cells (19–22), and culture conditions may translate from one device to another. Also, multiple high-throughput multichamber microfluidic assays have been described that are optimized for experiments related to cell signaling. These assays have been used for diverse purposes, including measuring growth rates (23), monitoring gene expression in living cells (24), and directing stem cell differentiation (13).
References
- 1.Cheong R, Wang CJ, Levchenko A. High-content cell screening in a microfluidic device. Mol Cell Proteomics. 2008;8:433–442. doi: 10.1074/mcp.M800291-MCP200. [DOI] [PMC free article] [PubMed] [Google Scholar]
- 2.Janes KA, Albeck JG, Gaudet S, Sorger PK, Lauffenburger DA, Yaffe MB. A systems model of signaling identifies a molecular basis set for cytokine-induced apoptosis. Science. 2005;310:1646–1653. doi: 10.1126/science.1116598. [DOI] [PubMed] [Google Scholar]
- 3.Janes KA, Gaudet S, Albeck JG, Nielsen UB, Lauffenburger DA, Sorger PK. The response of human epithelial cells to TNF involves an inducible autocrine cascade. Cell. 2006;124:1225–1239. doi: 10.1016/j.cell.2006.01.041. [DOI] [PubMed] [Google Scholar]
- 4.Ferrell JE, Jr, Machleder EM. The biochemical basis of an all-or-none cell fate switch in Xenopus oocytes. Science. 1998;280:895–898. doi: 10.1126/science.280.5365.895. [DOI] [PubMed] [Google Scholar]
- 5.Barken D, Wang CJ, Kearns J, Cheong R, Hoffmann A, Levchenko A. Comment on “Oscillations in NF-κB signaling control the dynamics of gene expression”. Science. 2005;308:52a. doi: 10.1126/science.1107904. [DOI] [PMC free article] [PubMed] [Google Scholar]
- 6.Irish JM, Hovland R, Krutzik PO, Perez OD, Bruserud O, Gjertsen BT, Nolan GP. Single cell profiling of potentiated phospho-protein networks in cancer cells. Cell. 2004;118:217–228. doi: 10.1016/j.cell.2004.06.028. [DOI] [PubMed] [Google Scholar]
- 7.Sachs K, Perez O, Pe’er D, Lauffenburger DA, Nolan GP. Causal protein-signaling networks derived from multiparameter single-cell data. Science. 2005;308:523–529. doi: 10.1126/science.1105809. [DOI] [PubMed] [Google Scholar]
- 8.Perlman ZE, Slack MD, Feng Y, Mitchison TJ, Wu LF, Altschuler SJ. Multidimensional drug profiling by automated microscopy. Science. 2004;306:1194–1198. doi: 10.1126/science.1100709. [DOI] [PubMed] [Google Scholar]
- 9.Dunn DA, Feygin I. Challenges and solutions to ultra-high-throughput screening assay miniaturization: Submicroliter fluid handling. Drug Discov Today. 2000;5:84–91. doi: 10.1016/s1359-6446(00)00064-7. [DOI] [PubMed] [Google Scholar]
- 10.Kaneda A, Wang CJ, Cheong R, Timp W, Onyango P, Wen B, Iacobuzio-Donahue CA, Ohlsson R, Andraos R, Pearson MA, Sharov AA, Longo DL, Ko MS, Levchenko A, Feinberg AP. Enhanced sensitivity to IGF-II signaling links loss of imprinting of IGF2 to increased cell proliferation and tumor risk. Proc Natl Acad Sci USA. 2007;104:20926–20931. doi: 10.1073/pnas.0710359105. [DOI] [PMC free article] [PubMed] [Google Scholar]
- 11.Thorsen T, Maerkl SJ, Quake SR. Microfluidic large-scale integration. Science. 2002;298:580–584. doi: 10.1126/science.1076996. [DOI] [PubMed] [Google Scholar]
- 12.Unger MA, Chou HP, Thorsen T, Scherer A, Quake SR. Monolithic microfabricated valves and pumps by multilayer soft lithography. Science. 2000;288:113–116. doi: 10.1126/science.288.5463.113. [DOI] [PubMed] [Google Scholar]
- 13.Gomez-Sjoberg R, Leyrat AA, Pirone DM, Chen CS, Quake SR. Versatile, fully automated, microfluidic cell culture system. Anal Chem. 2007;79:8557–8563. doi: 10.1021/ac071311w. [DOI] [PubMed] [Google Scholar]
- 14.Roberts BW, Olbricht WL. The distribution of freely suspended particles at microfluidic bifurcations. AIChE J. 2006;52:199–206. [Google Scholar]
- 15.Studer V, Hang G, Pandolfi A, Ortiz M, Anderson WF, Quake SR. Scaling properties of a low-actuation pressure microfluidic valve. J Appl Phys. 2004;95:393–398. [Google Scholar]
- 16.Gomez-Sjoberg R, Quake S. http://thebigone.stanford.edu/foundry/testing/own_controller.html.
- 17.Kim L, Vahey MD, Lee HY, Voldman J. Microfluidic arrays for logarithmically perfused embryonic stem cell culture. Lab Chip. 2006;6:394–406. doi: 10.1039/b511718f. [DOI] [PubMed] [Google Scholar]
- 18.Hiraoka Y, Sedat JW, Agard DA. The use of a charge-coupled device for quantitative optical microscopy of biological structures. Science. 1987;238:36–41. doi: 10.1126/science.3116667. [DOI] [PubMed] [Google Scholar]
- 19.Kane BJ, Zinner MJ, Yarmush ML, Toner M. Liver-specific functional studies in a microfluidic array of primary mammalian hepatocytes. Anal Chem. 2006;78:4291–4298. doi: 10.1021/ac051856v. [DOI] [PubMed] [Google Scholar]
- 20.Li Jeon N, Baskaran H, Dertinger SK, Whitesides GM, Van de Water L, Toner M. Neutrophil chemotaxis in linear and complex gradients of interleukin-8 formed in a microfabricated device. Nat Biotechnol. 2002;20:826–830. doi: 10.1038/nbt712. [DOI] [PubMed] [Google Scholar]
- 21.Rhee SW, Taylor AM, Tu CH, Cribbs DH, Cotman CW, Jeon NL. Patterned cell culture inside microfluidic devices. Lab Chip. 2005;5:102–107. doi: 10.1039/b403091e. [DOI] [PubMed] [Google Scholar]
- 22.Tourovskaia A, Figueroa-Masot X, Folch A. Differentiation-on-a-chip: A microfluidic platform for long-term cell culture studies. Lab Chip. 2005;5:14–19. doi: 10.1039/b405719h. [DOI] [PubMed] [Google Scholar]
- 23.Yu H, Alexander CM, Beebe DJ. A plate reader-compatible microchannel array for cell biology assays. Lab Chip. 2007;7:388–391. doi: 10.1039/b612358a. [DOI] [PubMed] [Google Scholar]
- 24.King KR, Wang S, Irimia D, Jayaraman A, Toner M, Yarmush ML. A high-throughput microfluidic real-time gene expression living cell array. Lab Chip. 2007;7:77–85. doi: 10.1039/b612516f. [DOI] [PMC free article] [PubMed] [Google Scholar]
- 25.The authors thank A. Feinberg, A. Groisman, J. Weinstein, R. Alani, M. Yaffe, and A. Quiñones-Hinojosa for insightful discussions and support. R.C. is a trainee in the Medical Scientist Training Program at the Johns Hopkins University. R.C., C.J.W., and A.L. are supported by NIH grants GM072024, RR020839, GM69013, CA131920, and CA65145.