Polyvalent DNA-functionalized gold nanoparticle conjugates (DNA–Au NPs) have proven useful in a variety of assembly,[1–3] biodiagnostic,[4–6] and nanotherapeutic[7–10] applications. Their widespread use is a consequence of: 1) their novel hybridization properties and 2) straightforward methods for synthesizing macroscopic quantities of them in relatively monodisperse form.[1,11,12] In some applications, the utility of DNA–Au NPs relies on their ability to assemble via DNA hybridization into polymeric aggregates (Scheme 1A).[1] This reaction is accompanied by a concomitant red-to-blue color change, a consequence of the dampening and red-shifting of the nanoparticle surface plasmon resonance (SPR) band at ~520 nm (for a 15-nm nanoparticle).[13] As the temperature is increased above the melting temperature of the duplex DNA linkages connecting the gold nanoparticles, the polymeric structure dehybridizes, the spectroscopic signature associated with the dispersed particles is restored, and a single, highly cooperative melting transition is observed. The melting transition occurs at a higher temperature and over a more narrow temperature range than free duplex DNA of the same sequence.[1,14,15]
Scheme 1.
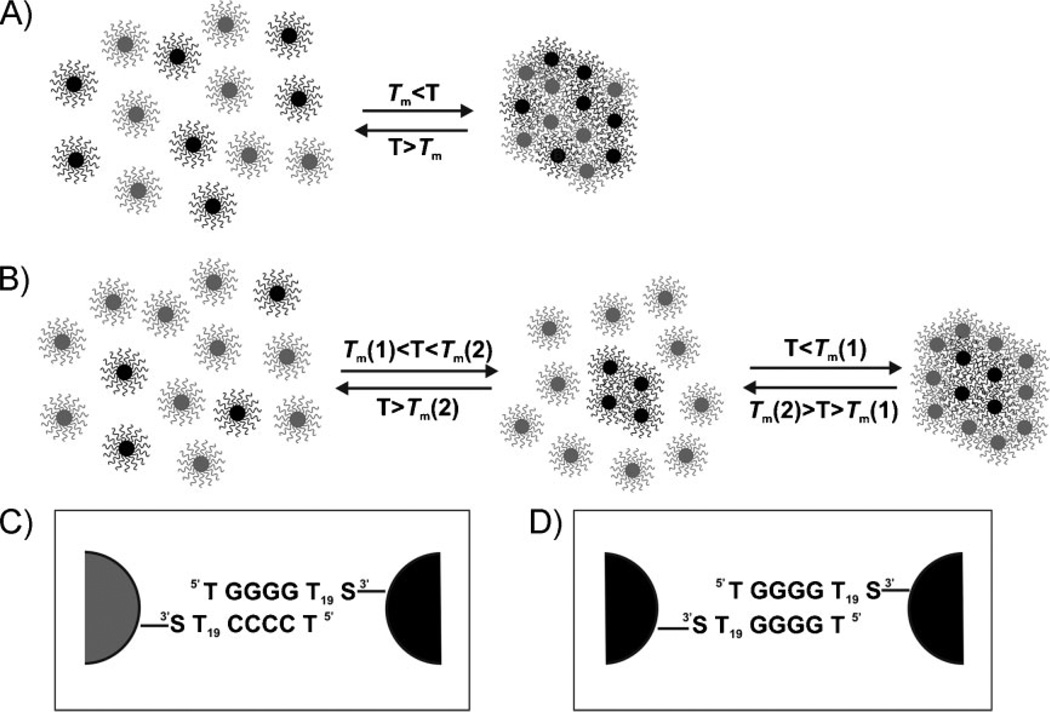
A) A general scheme for the hybridization and melting of DNA–Au NP aggregates where a single melting transition would likely be observed. Particles A (gray, functionalized with TCCCC–) and B (black, functionalized with TGGGG–) are complementary DNA–Au NPs. B) A general scheme for the hybridization and melting of DNA–Au NP aggregates where two melting transitions would likely be observed. Particles A (gray) and B (black) are complementary and can hybridize via Watson–Crick base pairing; the B particles also are capable of interacting with themselves via G-quadruplex interactions (Tm[2,B–B) > Tm[1,A–B)). General schematic of particles involved in C) Watson–Crick binding (A–B) and D) G-quadruplex binding (B–B). For the chemical structure of each type of binding interaction, see the Supporting Information, Figure S1.
The structure of these nanoparticle aggregates is highly complex, and efforts have been made to elucidate the nature of the DNA interactions connecting the hybrid bioinorganic particle conjugates. [15–20] Recently, it has been determined that an assortment of traditional (i.e., Watson–Crick) and nontraditional (e.g., G-quadruplex)[21–23] DNA interactions (which are inherently different in binding strength) can be used to induce nanoparticle aggregation. These interactions are often randomly distributed throughout the aggregate structure. If the aggregate is held together by duplexes of varying strengths, the experiment used to monitor dehybridization is only sensitive to the strongest links, which keep the particles as part of the aggregate. In other words, if a particle is connected to other particles by more than one type of interaction, the spectroscopic measurement only detects the breaking of the strong interaction, which results in release of the particle from the aggregate. Consequently, for this type of structure, only a single melting transition is observed (Scheme 1A). Indeed, when aggregates form from particles modified with complex sequences, one must consider all of the types of interaction that can result in particle assembly and incorporation in the aggregate.
Many weak interactions become cumulatively strong in the context of these polyvalent oligonucleotide–nanoparticle conjugates. For example, it is known that particles terminated with a single G base are capable of forming aggregate structures with a very sharp and co-operative melting transition, reminiscent of the structures held together via long, overlapping tracts of Watson–Crick base pairs.[15] In the course of our studies, we have discovered a novel system comprising particles modified with tracts of C and G bases. These structures can hybridize with each other through Watson–Crick base pairing interactions (Scheme 1C), and the G-terminated structures are capable of forming G-quadruplexes, which are exceptionally stable due to the multivalency of the particles (Scheme 1D, and see Supporting Information, Figure S1, for the chemical structure of DNA binding interactions). Interestingly, under the appropriate conditions, these particles will form two-component aggregates with a core defined by particles held together via G-quadruplex binding (black, Scheme 1B) and a shell bound to the core and held together by Watson–Crick base pairing interactions (gray, Scheme 1B). The core/shell aggregate structures exhibit distinct melting transitions representative of a phase-separated structure and can be prepared in a variety of different ways from randomly dispersed particle building blocks. Finally, the structures obtained and the corresponding melting transitions observed are nearly identical, regardless of the conditions used to prepare the aggregates, suggesting that the core/shell configuration in this system represents a thermodynamically stable structure (Supporting Information, Figure S2).
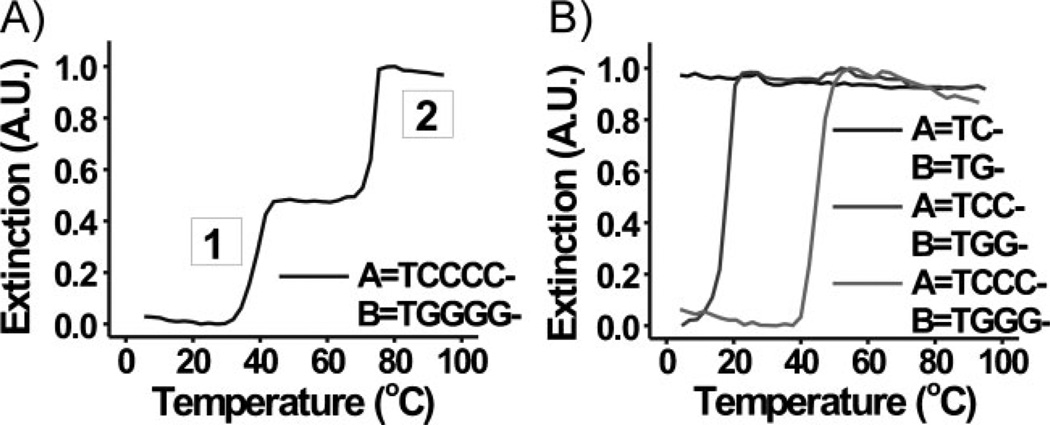
Initially, hybridization and subsequent melting behavior of 60-nm DNA–Au NPs (A and B) were analyzed under a variety of experimental conditions. Aggregates were formed from equal amounts of DNA–Au NPs (A=TCCCC–, B=TGGGG–, Scheme 1, Table 1) in 1.0 m NaCl, 10 mm sodium phosphate (PB), 0.01% sodium dodecyl sulfate (SDS). Under these conditions, two binding interactions are possible: 1) A–B (Watson–Crick interaction) and 2) B–B (G-quadruplex interaction); A–A interactions are not likely under these conditions (vide infra). As a result, two sharp melting transitions were observed corresponding to two dehybridization events: transition 1 (at lower T, Tm=38.6 °C) and transition 2 (at higher T, Tm=73.9 °C) (Figure 1A). Since the extinction of the solution of DNA– Au NPs did not significantly change (remained constant at ~0.5 A.U., Figure 1A) between the two transitions, we can conclude that minimal rehybridization/reorganization occurs within the aggregate following the first melting transition. It should also be noted that the aggregation process for these systems was slow (see Experimental Section), occurring on a much longer timescale than would be required for reorganization to occur during these melting transitions. Under the same experimental conditions, a single transition was observed for other aggregates of DNA–Au NPs functionalized with sequences containing similar recognition elements (A=TC-, B=TG–; A=TCC–, B=TGG–; A= TCCC–, B=TGGG–; A=B=TCG–; A=TCGC–, B=TGCG–, Scheme 1, Table 1, Figure 1B, Supporting Information, Table S1, Figure S3).[15] We reasoned that only a single transition, likely due predominately to Watson–Crick binding, was observed for these other systems, since the intermittent placement and low number of guanines would make G-quadruplex formation less favorable.
Table 1.
List of DNA sequences.
| Name | Oligonucleotide Sequence |
|---|---|
| Control | 5′– TTT TTT TTT TTT TTT TTT TTT TTT – (CH2)3 –SH – 3′ |
| TC- | 5′– TCT TTT TTT TTT TTT TTT TTT TTT – (CH2)3 –SH – 3′ |
| TG- | 5′– TGT TTT TTT TTT TTT TTT TTT TTT – (CH2)3 –SH – 3′ |
| TCC- | 5′– TCC TTT TTT TTT TTT TTT TTT TTT – (CH2)3 –SH– 3′ |
| TGG- | 5′– TGG TTT TTT TTT TTT TTT TTT TTT – (CH2)3 –SH – 3′ |
| TCCC- | 5′– TCC CTT TTT TTT TTT TTT TTT TTT – (CH2)3 –SH – 3′ |
| TGGG- | 5′– TGG GTT TTT TTT TTT TTT TTT TTT – (CH2)3 –SH – 3′ |
| TCCCC- | 5′– TCC CCT TTT TTT TTT TTT TTT TTT – (CH2)3 –SH – 3′ |
| TGGGG- | 5′– TGG GGT TTT TTT TTT TTT TTT TTT – (CH2)3 –SH – 3′ |
Figure 1.
Normalized melting curves (monitored at 260 nm) for aggregates composed of 60-nm DNA–Au NPs functionalized with A) A=TCCCC– and B=TGGGG– and B) A=TC– and B=TG–, A=TCC–, and B=TGG–, and A=TCCC– and B=TGGG– in 1.0 m NaCl, 10 mm PB, 0.01% SDS.
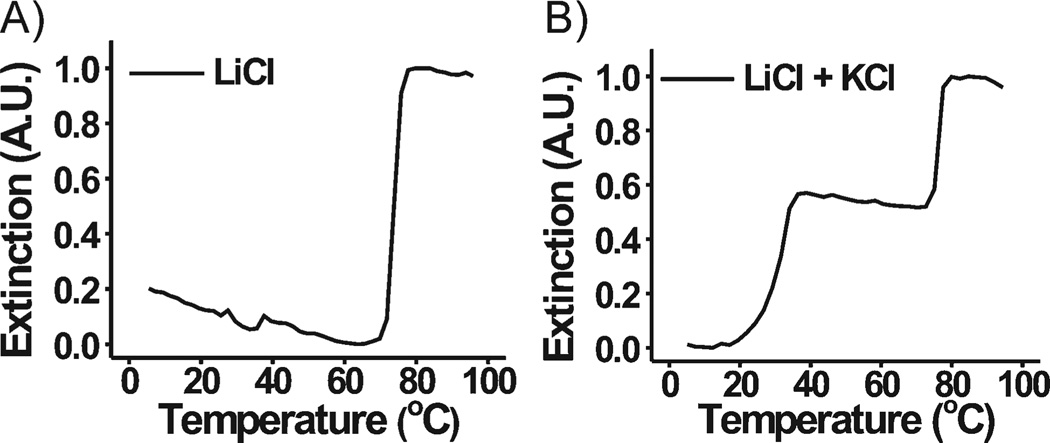
Next, we proved that each transition was the result of a different type of DNA hybridization interaction and confirmed the type of interaction responsible for each melting transition. The stability of assemblies of DNA–Au NPs bound by G-quadruplex interactions is dependent on the type of cation present and decreases according to the following cation trend: K+ ≫ Cs+ > Na+, respectively.[21–23] Note that Li+ does not foster G-quadruplex interactions. Thus, DNA–Au NPs functionalized with A=TCCCC– and B=TGGGG– would be unlikely to participate in G-quartet interactions in a lithium buffer system (1.0 m LiCl, 10 mm Li phosphate, 0.01% lithium dodecyl sulfate (LDS; buffer A), while Watson–Crick pairings would still be possible.[24] Only one melting transition was observed when the melting behavior of this system was explored in buffer A (Figure 2A). Furthermore, the two distinct melting transitions were recovered when K+ (a G-quartet stabilizing ion) was spiked into a lithium buffer system (0.2 m LiCl, 10 mm Li phosphate, 0.01% LDS, 0.02 m KCl (buffer B), Figure 2B). These results suggest that G-quadruplex interactions play a role in aggregate stabilization and are the primary interactions responsible for one of the two observed melting transitions. Buffer B was used in all of the remaining experiments, unless otherwise noted.
Figure 2.
Normalized melting curves (monitored at 260 nm) for aggregates composed of 60-nm DNA–Au NPs functionalized with A=TCCCC– and B=TGGGG– in A) 1.0 m LiCl, 10 mm Li phosphate, 0.01% LDS and B) 0.2 m LiCl, 10 mm Li phosphate, 0.01% LDS, 0.02 m KCl.
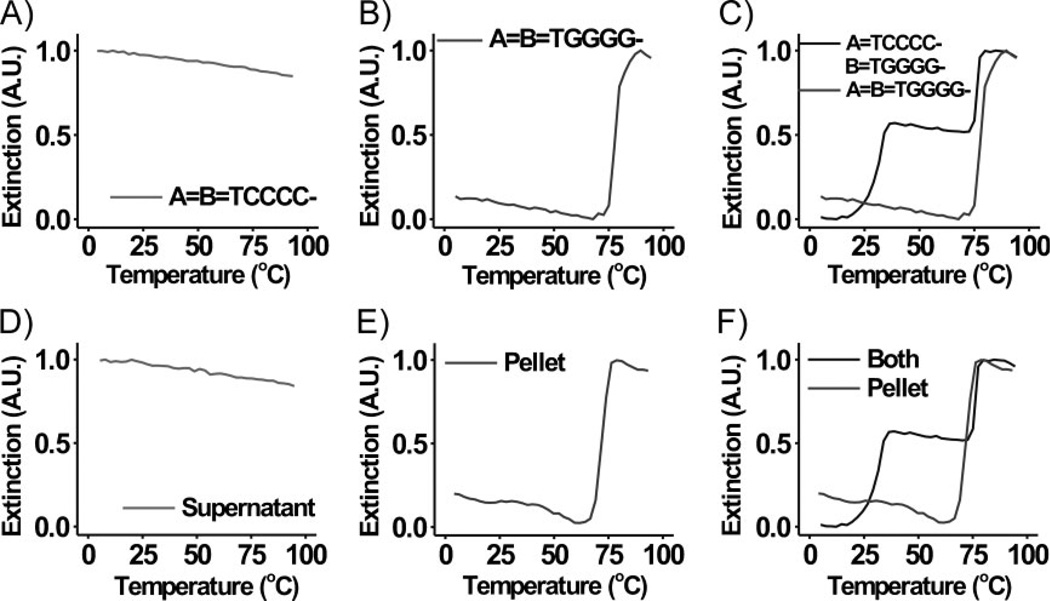
In order to determine which transition was due to dehybridization of G-quadruplex interactions, we analyzed the behavior of each nanoparticle component individually (A=B=TCCCC–; A=B=TGGGG–, Scheme 1, Table 1, Figure 3). DNA–Au NPs functionalized with TCCCC– are not capable of forming traditional Watson–Crick base pairings or participating in G-quadruplex interactions in bufferB. Further, the total salt concentration in this buffer is likely too low to induce nanoparticle aggregation through the formation of other non-Watson–Crick binding interactions (i.e., C–C or C+ –C).[20,24] However, under these experimental conditions, DNA–Au NPs functionalized with TGGGG– can form aggregates via G-quadruplex interactions. In fact, melting transitions were not observed for nanoparticles functionalized with TCCCC–, while those functionalized with TGGGG– form aggregates, exhibiting a single sharp melting transition upon dehybridization (Figure 3A and B). Interestingly, the melting temperature (Tm) of this transition (Figure 3B) is approximately the same as that of transition 2 observed previously (Figure 3C). These data suggest that transition 2 is due to the dehybridization of the portions of the particle aggregates that are stabilized by G-quadruplex interactions.
Figure 3.
Normalized melting curves (monitored at 260 nm) for aggregates composed of 60-nm DNA–Au NPs functionalized with A) A=B=TCCCC– and B) A=B=TGGGG– in 0.2 m LiCl, 10 mm Li phosphate, 0.01% LDS, 0.02 m KCl. C) Overlay of the normalized melting curves shown in Figures 2B and 3B. D and E) Normalized melting curves (monitored at 260 nm) for aggregates composed of 60-nm DANN–Au NPs in 0.2 m LiCl, 10 mm Li phosphate, 0.01% LDS, 0.02 m KCl. In (D) and (E), the particles analyzed were those isolated from the supernatant and the pellet (i.e., aggregate), respectively, of a solution of DNA–Au NPs functionalized with A=TCCCC– and B=TGGGG– at ~50 °C. F) Overlay of the normalized melting curves shown in Figures 2B and 3E.
To further confirm this result, the nanoparticles involved in each transition were isolated directly from the aggregate structure. Aggregates of DNA–Au NPs functionalized with A=TCCCC– and B=TGGGG– were formed, and subsequently the temperature of the solution was brought to ~50 °C (Tm (1) < 50 °C < Tm (2)). At this temperature, the particles involved in transition 2 were bound in the aggregate form, while those involved in transition 1 were dehybridized from the aggregates and dispersed in solution. The aggregates were separated from the free particles by centrifugation. Each fraction of particles was then rehybridized separately in buffer B and melting behaviors were examined. The DNA–Au NPs recovered from the supernatant (the particles released in transition 1) do not hybridize or exhibit a melting transition (Figure 3D), as was seen previously with samples of DNA–Au NPs functionalized with TCCCC– (Figure 3A). Those recovered from the aggregate show a melting transition that overlaps with transition 2 (Figure 3E and F). These data further support the conclusion that transition 1 can be attributed to the dehybridization (of Watson–Crick interactions) and subsequent release of DNA–Au NPs functionalized with TCCCC– from those functionalized with TGGGG–. Transition 2 is likely a result of the dispersion of DNA–Au NPs functionalized with TGGGG– that were involved in G-quadruplex binding.
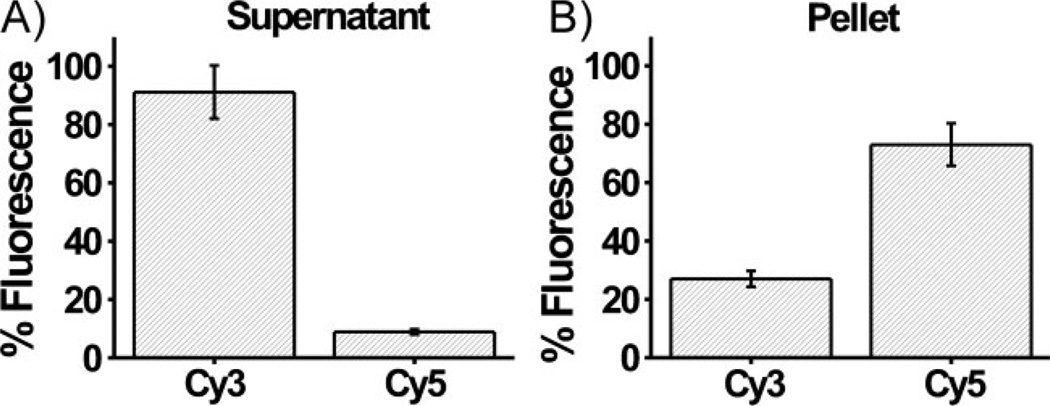
The same experiment also was performed with fluorophore-labeled oligonucleotides (Cy3-labeled TCCCC–, Cy5-labeled TGGGG–, label near the 3’ end). After isolation of each particle fraction, the labeled oligonucleotides were released from the surface of the particles and the relative amount of fluorescence in each sample was measured. Emission from Cy3-labeled oligonucleotides was found to account for 27 and 91% of the total fluorescence of the pellet sample (i.e., the aggregate) and supernatant, respectively, while that of the Cy5-labeled oligonucleotides accounted for 73 and 9% of the total fluorescence from the pellet and supernatant, respectively (Figure 4). Assuming that the oligonucleotide loading on both sets of DNA–Au NPs was approximately equal,[12] these values roughly translate to the percentage of particles of each type dispersed in the supernatant or bound in the aggregate form at ~50 °C. Therefore, DNA–Au NPs functionalized with TCCCC– comprised the majority of the particles in the supernatant (91%), while DNA–Au NPs functionalized with TGGGG– made up the majority of the particles in the aggregate (73%). Note that the supernatant cannot be completely removed from the pellet, making it impossible to achieve 100% values in either case.
Figure 4.
Relative percent fluorescence of Cy3- and Cy5-labeled oligonucleotides [TCCCC– and TGGGG–, respectively) released from the surface of DNA–Au NPs isolated from the A) supernatant and B) pellet of a solution of DNA–Au NPs functionalized with A=TCCCC– and B=TGGGG– at ~50 °C.
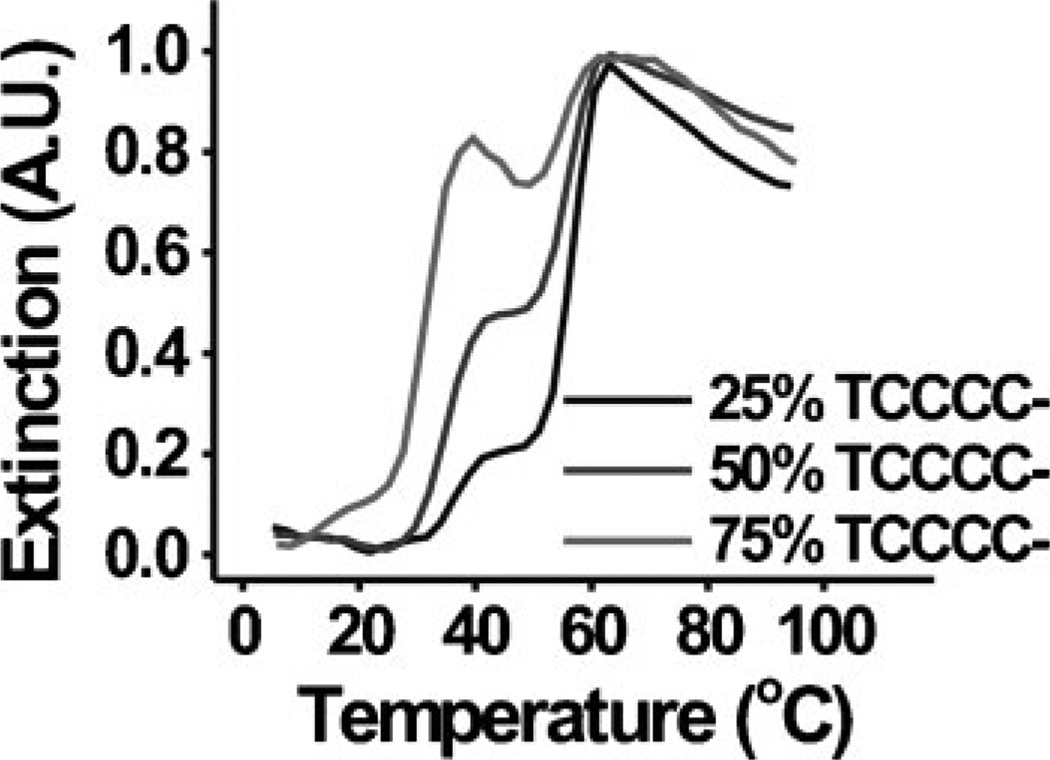
In all of the experiments presented above, a 1-to-1 ratio of each type of nanoparticle was used (DNA–Au NPs functionalized with TCCCC– to those functionalized with TGGGG–). As a result, transitions 1 and 2 each accounted for approximately half of the total change in extinction from the fully hybridized aggregate state to the fully dispersed free-particle state (e.g., Figure 1A). Theoretically, the number of particles capable of participating in each binding interaction, and thus the size of each transition, can be changed by controlling this ratio. For example, according to the current assignment of the melting transitions, it would be expected that as the relative amount of DNA–Au NPs functionalized with TCCCC– decreases the relative size (change in extinction) of transition 1 would decrease, while that of transition 2 would increase proportionally. In fact, as the percentage of DNA–Au NPs functionalized with TCCCC– is increased from 25 to 50 to 75%, the relative size of transition 1 made up approximately 25, 50, and 75% of the total change in extinction, respectively (Figure 5). These results suggest the majority of the DNA–Au NPs in the system that are functionalized with TCCCC– dehybridize in transition 1, while those functionalized with TGGGG– primarily disperse in transition 2. Note that, in the systems containing only 25% and 50% TCCC-functionalized DNA–Au NPs, there is no decrease in A260 after the first melting transition, as with the data presented in Figures 1–3. However, in the system with 75% CCCC, there is a noticeable decrease in A260 after the first melting transition. This is most likely due to aggregation of multiple G-quadruplex cores whose Watson–Crick binding shells have melted away. Because there are fewer TGGGG-functionalized particles and a large excess of TCCCC-functionalized particles in this system, the G-quadruplex cores are smaller, leading to more aggregation of the cores after the Watson–Crick Binding interactions dissociate.
Figure 5.
Normalized melting curves (monitored at 260 nm) for aggregates composed of 60-nm DNA–Au NPs functionalized with A=TCCCC– and B=TGGGG–, where DNA–Au NPs functionalized with TCCCC– make up 25, 50, or 75% of the total number of nanoparticles in the sample. DNA–Au NPs functionalized with TGGGG– make up the other 75, 50, and 25% of the total nanoparticles in each sample, respectively.
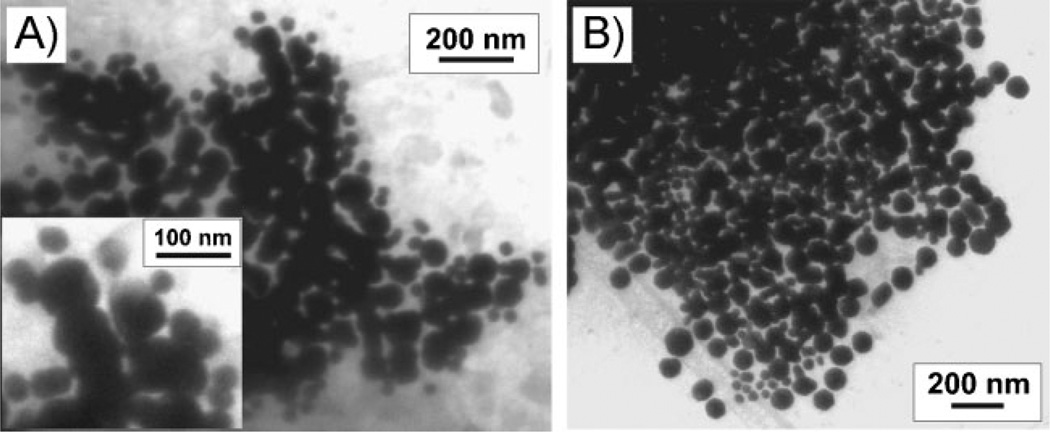
Finally, in order to visualize the structure of the aggregates, we characterized them by cryo-TEM; this allowed us to preserve the state of the aggregate structure in solution in a thin layer of vitreous ice during the sample preparation process. In order to label the particles involved in each transition in the TEM, we used particles of different diameters (40- and 80-nm gold nanoparticles). We performed two experiments, one in which aggregates were formed from 40-nm particles functionalized with A=TCCCC– and 80-nm particles functionalized with B=TGGGG– and one in which aggregates were formed from 80-nm particles functionalized with A=TCCCC– and 40-nm particles functionalized with B=TGGGG–. Two melting transitions also are observed for these aggregates, similar to those seen for the 60-nm particles (Supporting Information, Figure S4). In the TEM images, we noticed that the particles functionalized with B=TGGGG– typically were located in the center of the aggregates, while the particles functionalized with A=TCCCC– were observed at the edges of the aggregates (Figure 6). It is likely that this segregation occurs because particles involved in G-quadruplex binding are concentrated towards the core of the aggregate structures and those involved in Watson–Crick binding ring this core at the outer fringes of the aggregate structures. Note that because TEM gives a two-dimensional image of a three-dimensional system, particles on top of or underneath the aggregate structure appear to be in the middle of the aggregate.
Figure 6.
Cyro-TEM image of aggregates of A) 40-nm DNA–Au NPs functionalized with A=TCCCC– and 80-nm DNA–Au NPs functionalized with B=TGGGG– and B) 80-nm DNA–Au NPs functionalized with A=TCCCC and 40-nm DNA–Au NPs functionalized with B=TGGGG– in 0.4 m LiCl, 10 mm Li phosphate, 0.01% LDS, 0.02 m KCl. The inset in (A) is a zoomed-in view of the upper middle portion of the aggregate that is shown in (A).
In conclusion, we have successfully designed a system of DNA–Au NPs that can be used to create complex aggregate structures with two DNA binding domains. Unlike their conventional counterparts, which comprised a single binding domain and display a single, sharp melting transition upon dehybridization, these phase-separated materials display two sharp and highly co-operative melting transitions. These multidomain materials are thermodynamically stable structures and can be accessed using a variety of different preparative routes. To the best of our knowledge, this system is the first example of a core/shell DNA-linked aggregate structure built by relying on more than one type of the myriad of known DNA binding interactions. Interestingly, since the strength of the DNA binding interactions varies, each region has a different reactivity and can be thermally addressed. Indeed, this work can be used as a blueprint to synthesize even more complex DNA-linked nanoparticle aggregate structures with more than two binding domains. Further, this knowledge will be useful in efforts focused on using these materials to create controlled-release systems.[25]
Experimental Section
Preparation of DNA-functionalized gold nanoparticles
Gold nanoparticles (60 nm in diameter) were purchased from Ted Pella (Redding, CA). Oligonucleotides were purchased from Integrated DNA Technologies, Inc. (Coralville, IA) or synthesized on an Expedite Nucleic Acid Synthesizer, using reagents acquired from Glen Research (Sterling, VA). Oligonucleotides that were synthesized on the Expedite were purified using Poly–Pak II cartridges (Glen Research) according to the manufacturer’s protocol. The oligonucleotides then were attached to the gold nanoparticle surface using standard literature procedures with minor modifications.[12] The disulfide protecting groups on the oligonucleotides were cleaved by addition of dithiolthreitol (DTT, Pierce Biotechnology, Inc., Rockford, IL) to lyophilized DNA and incubated at room temperature for 1 h (0.1 m DTT, 0.17 m sodium phosphate buffer (PB), pH 8.0). The cleaved oligonucleotides were purified using a NAP-5 column (Sephadex, G-25 DNA grade G. E. Healthcare, Piscatiway, NJ) and then added to an aqueous solution of gold nanoparticles (3 nmol oligonucleotide/mL gold nanoparticles). The oligonucleotide/gold nanoparticle solution was allowed to incubate at room temperature overnight. Next, the concentrations of sodium PB and sodium dodecyl sulfate (SDS) were brought to 10 mm and 0.01 (wt/vol)% respectively. The concentration of NaCl was increased to 0.05 m using 2 m NaCl, 10 mm PB while maintaining an SDS concentration of 0.01%, and the mixture was sonicated for ~10 s in a Branson 2510 sonicator. This process was repeated one more time to bring the NaCl concentration to 0.1 m. Then, the NaCl concentration was raised in 0.1 m increments until a final concentration of 1.0 m NaCl was reached. The salting process was followed by another overnight incubation at room temperature. To remove excess oligonucleotides, the gold nanoparticles were centrifuged and the supernatant was removed, leaving a pellet of gold nanoparticles at the bottom of an Eppendorf tube. The particles then were resuspended in 0.01% solution of Triton X-100 in water. This washing process was repeated for a total of four supernatant removals. The nanoparticles were stored as a colloidal suspension in 0.01% Triton X-100 at 4 °C until further use. Water (> 18.0 MΩ), purified using a Barnstead NANOpure Ultrapure water system, was used for all experiments. The concentrations of both gold nanoparticles and oligonucleotides were determined on a NanoDrop ND-1000 UV/vis spectrophotometer or a Cary 5000 UV/vis spectrophotometer.
DNA sequence design
The DNA sequences used in these investigations were a series of 24-mer oligonucleotides composed of: 1) a 3’ propyl thiol functionality, 2) a poly-T spacer, 3) a G and/or C-rich section and 4) a single T capping base on the 5’ end (Table 1, Supporting Information, Table S1). Each section of the oligonucleotide was designed to serve a key role in the experiment. The 3’ thiol functionality was used to anchor the DNA strand to the gold nanoparticle surface. The poly-T spacer separates the G and/or C-rich recognition element from the nanoparticle surface so that it is accessible for hybridization. Poly-T sequences were selected as spacer units since these sequences, either free in solution or on the surface of a gold nanoparticle, do not exhibit hybridization and subsequent melting behavior (Supporting Information, Figure S5).[15,24,26] A single T was added to the end of every sequence to increase nanoparticle stability.[21–23]
Hybridization and melting of DNA-functionalized gold nanoparticles
After the washing step, the extinction values of the gold nanoparticle solutions were measured, and their concentrations were determined using Beer’s Law (A =εbc, ε =2.01 × 10⁹ L/mol · cm for 60-nm Au NPs at 560 nm). The total concentration of oligonucleotides in each sample then was determined using DNA loading values for sonicated particles with a T10 spacer (~913 strands/particle for a 60-nm Au NP).[12] Using these values, the concentration of nanoparticle-bound DNA in solution was adjusted to ~150 nm using 0.01% Triton X-100. To induce hybridization, the DNA–Au NPs (A and B) were combined with their appropriate complement (Scheme 1), centrifuged, and resuspended in the appropriate salt buffer. All DNA–Au NPs were allowed to equilibrate at room temperature for ~3 h, then at 4 °C overnight (~12 h) prior to testing, unless otherwise noted.
The samples were transferred to pre-chilled cuvettes (at 4 °C) for melting analysis using a Cary 100 UV/vis spectrophotometer. The temperature was ramped from 4 to 95 °C at 1 °C/min with magnetic stirring. The extinction was monitored at 1 °C intervals at 260 and 560 nm. The Cary 100 was flushed with nitrogen during all measurements in order to prevent condensation on the outside of the cuvettes at lower temperatures. Although data were collected at two different wavelengths, both of which exhibited similar melting transitions, only the data collected at 260 nm are presented in this article. The values of A.U. (absorbance units) as presented were normalized such that the maximum value of A260 in each set of data was assigned a value of 1.0 and the minimum value was assigned a value of 0.0; other values were scaled to match.
Quantification of fluorophore-modified oligonucleotides on the gold nanoparticle surface
Oligonucleotides were labeled near their 3′ end with fluorophores (cyanine derivatives, Cy3 (excitation maximum=546 nm, emission maximum=563 nm) or Cy5 (excitation maximum=646 nm, emission maximum=662 nm) (Glen Research, Sterling, VA)) using standard coupling procedures. These oligonucleotides were displaced from the surface of the nanoparticles using 0.5 m DTT in 0.17 m sodium phosphate buffer, pH=8. The relative amount of fluorescence from the released Cy3- and Cy5-labeled DNA strands was measured using a Photon Technology International (PTI) FluoDia T70 microplate fluorometer.
Cyro-TEM imaging
For cryo-TEM samples, drops of the gold nanoparticle aggregate solutions were placed on holey carbon films (Ted Pella) and excess solution was wicked away by a blot paper. The grids were then quickly plunged into liquid ethane using a Gatan cryo-plunge system. Humidity was maintained to avoid excess evaporation by placing a water-soaked sponge in the sample preparation chamber. The prepared samples were then transferred into a transmission electron microscope using a Gatan cryo-transfer system. Images were taken by the Hitachi HF-8100 transmission electron microscope with an accelerating voltage of 100 kV.
Supplementary Material
Footnotes
C.A.M acknowledges the National Science Foundation Nanoscale Science and Engineering Center (NSF-NSEC), the National Cancer Institute Center of Nanotechnology Excellence (NCI-CCNE), and the U.S. Army Medical Research and Materiel Command for financial support of this work. H.D.H. is grateful to the U.S. Department of Homeland Security (D.H.S.) for a Graduate Fellowship under the D.H.S. Scholarship and Fellowship Program. V.P.D. acknowledges the National Science Foundation Materials World Network (MWN) under grant number DMR-0603184/001, and the NUANCE Center at Northwestern University, supported by the NSF-NSEC, the NSF-MRSEC, the Keck Foundation, the State of Illinois, and Northwestern University. Any opinions, findings and conclusions or recommendations expressed in this material are those of the authors and do not necessarily reflect those of the National Science Foundation.
Supporting Information is available on the WWW under http://www.small-journal.com or from the author.
Contributor Information
Sarah J. Hurst, Department of Chemistry and International Institute for Nanotechnology, Northwestern University, 2145 Sheridan Road, Evanston, IL 60208–3113 (USA)
Haley D. Hill, Department of Chemistry and International Institute for Nanotechnology, Northwestern University, 2145 Sheridan Road, Evanston, IL 60208–3113 (USA)
Robert J. Macfarlane, Department of Chemistry and International Institute for Nanotechnology, Northwestern University, 2145 Sheridan Road, Evanston, IL 60208–3113 (USA)
Jinsong Wu, Department of Materials Science and Engineering, Northwestern University, 2220 Campus Drive, Evanston, IL 60208–3113 (USA).
Vinayak P. Dravid, Department of Materials Science and Engineering, Northwestern University, 2220 Campus Drive, Evanston, IL 60208–3113 (USA)
Chad A. Mirkin, Email: chadnano@northwestern.edu, Department of Chemistry and International Institute for Nanotechnology, Northwestern University, 2145 Sheridan Road, Evanston, IL 60208–3113 (USA).
References
- 1.Mirkin CA, Letsinger RL, Mucic RC, Storhoff JJ. Nature. 1996;382:607. doi: 10.1038/382607a0. [DOI] [PubMed] [Google Scholar]
- 2.Park SY, Lytton-Jean AKR, Lee B, Weigand S, Schatz GC, Mirkin CA. Nature. 2008;451:553. doi: 10.1038/nature06508. [DOI] [PubMed] [Google Scholar]
- 3.Nykypanchuk D, Maye MM, van der Lelie D, Gang O. Nature. 2008;451:549. doi: 10.1038/nature06560. [DOI] [PubMed] [Google Scholar]
- 4.Taton TA, Mirkin CA, Letsinger RL. Science. 2000;289:1757. doi: 10.1126/science.289.5485.1757. [DOI] [PubMed] [Google Scholar]
- 5.Nam J-M, Thaxton CS, Mirkin CA. Science. 2003;301:1884. doi: 10.1126/science.1088755. [DOI] [PubMed] [Google Scholar]
- 6.Rosi NL, Mirkin CA. Chem. Rev. 2005;105:1547. doi: 10.1021/cr030067f. [DOI] [PubMed] [Google Scholar]
- 7.Rosi NL, Giljohann DA, Thaxton CS, Lytton-Jean AKR, Han MS, Mirkin CA. Science. 2006;312:1027. doi: 10.1126/science.1125559. [DOI] [PubMed] [Google Scholar]
- 8.Seferos DS, Giljohann DA, Hill HD, Prigodich AE, Mirkin CA. J. Am. Chem. Soc. 2007;129:15477. doi: 10.1021/ja0776529. [DOI] [PMC free article] [PubMed] [Google Scholar]
- 9.Giljohann DA, Seferos DS, Patel PC, Millstone JE, Rosi NL, Mirkin CA. Nano Lett. 2007;7:3818. doi: 10.1021/nl072471q. [DOI] [PMC free article] [PubMed] [Google Scholar]
- 10.Seferos DS, Giljohann DA, Rosi NL, Mirkin CA. ChemBio-Chem. 2007;8:1230. doi: 10.1002/cbic.200700262. [DOI] [PubMed] [Google Scholar]
- 11.Frens G. Nature Phys. Sci. 1973;241:20. [Google Scholar]
- 12.Hurst SJ, Lytton-Jean AKR, Mirkin CA. Anal. Chem. 2006;78:8313. doi: 10.1021/ac0613582. [DOI] [PMC free article] [PubMed] [Google Scholar]
- 13.Ghosh SK, Pal T. Chem. Rev. 2007;107:4797. doi: 10.1021/cr0680282. [DOI] [PubMed] [Google Scholar]
- 14.Elghanian R, Storhoff JJ, Mucic RC, Letsinger RL, Mirkin CA. Science. 1997;277:1078. doi: 10.1126/science.277.5329.1078. [DOI] [PubMed] [Google Scholar]
- 15.Hurst SJ, Hill HD, Mirkin CA. J. Am. Chem. Soc. 2008;130:12192. doi: 10.1021/ja804266j. [DOI] [PMC free article] [PubMed] [Google Scholar]
- 16.Jin R, Wu G, Mirkin CA, Schatz GC. J. Am. Chem. Soc. 2003;125:1643. doi: 10.1021/ja021096v. [DOI] [PubMed] [Google Scholar]
- 17.Long H, Kudlay A, Schatz GC. J. Phys. Chem. B. 2006;110:2918. doi: 10.1021/jp0556815. [DOI] [PubMed] [Google Scholar]
- 18.Park SY, Gibbs-Davis JM, Nguyen ST, Schatz GC. J. Phys. Chem. B. 2007;111:8785. doi: 10.1021/jp071985a. [DOI] [PubMed] [Google Scholar]
- 19.Licata NA, Tkachenko AV. Phys. Rev. E. 2006;74:041408. doi: 10.1103/PhysRevE.74.041408. [DOI] [PubMed] [Google Scholar]
- 20.Hill HD, Hurst SJ, Mirkin CA. Nano Lett. 2008;9:317. doi: 10.1021/nl8030482. [DOI] [PMC free article] [PubMed] [Google Scholar]
- 21.Seela F, Jawalekar AM, Anup M, Chi L, Zhong D. Chem. Biodivers. 2005;2:84. doi: 10.1002/cbdv.200490168. [DOI] [PubMed] [Google Scholar]
- 22.Li Z, Mirkin CA. J. Am. Chem. Soc. 2005;127:1170. doi: 10.1021/ja053547s. [DOI] [PubMed] [Google Scholar]
- 23.Wu Z-S, Guo M-M, Shen G-L, Yu R-Q. Anal. Bioanal. Chem. 2007;387:2623. doi: 10.1007/s00216-007-1126-1. [DOI] [PubMed] [Google Scholar]
- 24.Bloomfield VA, Crothers DM, Tinoco JI. Nucleic Acids: Structures, Properties, and Functions. Sausalito, CA: University Science Books; 2000. [Google Scholar]
- 25.Jabr-Milane L, van Vlerken L, Devalapally H, Shenoy D, Komareddy S, Bhavsar M, Amiji M. J. Controlled Release. 2008;130:121. doi: 10.1016/j.jconrel.2008.04.016. [DOI] [PubMed] [Google Scholar]
- 26.Saenger W. Principles of Nucleic Acid Structure. New York, NY: Springer-Verlag; 1984. [Google Scholar]
Associated Data
This section collects any data citations, data availability statements, or supplementary materials included in this article.


