

Summary
The role of epistasis in the genetic architecture of quantitative traits is controversial, despite the biological plausibility that non-linear molecular interactions underpin the genotype-phenotype map. This controversy arises because most genetic variation for quantitative traits is additive. However, additive variance is consistent with pervasive epistatic gene action. Here, I discuss experimental designs to detect the contribution of epistasis to quantitative trait phenotypes in model organisms. These studies indicate that epistatic gene action is common, and that additivity can be an emergent property of underlying genetic interaction networks. Epistasis causes hidden quantitative genetic variation in natural populations and could be responsible for the small additive effects, missing heritability and lack of replication typically observed for human complex traits.
Introduction
Understanding how naturally occurring variation in DNA sequences causes phenotypic variation in quantitative traits is a major challenge of contemporary biology. Efforts to chart the genotype-phenotype map for quantitative traits using linkage and association study designs have mainly focused on estimating additive effects of single loci (i.e., the main effect of the polymorphic locus averaged over all other genotypes). However, quantitative variation in phenotypes must result in part from multi-factorial genetic perturbation of highly dynamic, interconnected and non-linear developmental, neural, transcriptional, metabolic and biochemical networks1. Thus, epistasis (non-linear interactions between segregating loci) is a biologically plausible feature of the genetic architecture of quantitative traits. Deriving genetic interaction networks from epistatic interactions between loci will improve our understanding of biological systems that give rise to variation in quantitative traits2 as well as mechanisms underlying genetic homeostasis3,4 and speciation5,6. Knowledge of interacting loci will improve predictions of response to natural selection in the wild, artificial selection and inbreeding depression (and its converse, heterosis) in agricultural animal and crop species, and individual disease risk in humans.
Mapping epistatic interactions is challenging experimentally, statistically and computationally. The experimental challenge is the large sample sizes required to detect significant interactions and sample the landscape of possible genetic interactions. The statistical challenge is the severe penalty incurred for testing multiple hypotheses. The computational challenge is the large numbers of tests that must be evaluated. Genetically tractable model organisms afford the opportunity to utilize experimental designs that incorporate both new mutations and segregating variants to detect epistasis, and many recent studies in model organisms have highlighted the importance of epistasis in the genetic architecture of quantitative traits. Here, I describe the quantitative genetics of epistasis and why the role of epistatic gene action has been controversial, review experimental methods to detect epistasis in yeast, Drosophila melanogaster, mice, Arabidopsis thaliana and maize, and summarize empirical results showing that epistasis is pervasive. I discuss the implications of pervasive epistasis in model organisms for evolutionary models of the maintenance of quantitative genetic variation and speciation, and animal and plant breeding. Given that epistasis is pervasive in model organisms, it is likely to also be a hallmark of the genetic architecture of human complex traits. I discuss how underlying epistatic gene action can give rise to the small additive effects, missing heritability and lack of replication typically observed in human genome wide association studies. I do not discuss statistical and computational methods for assessing epistasis as these have been reviewed previously7,8.
Quantitative Genetics of Epistasis
In classical Mendelian genetics, epistasis refers to the masking of genotypic effects at one locus by genotypes of another, as reflected by departure from expected Mendelian segregation ratios in a di-hybrid cross2. In quantitative genetics, epistasis refers to any statistical interaction between genotypes at two (or more) loci9-11. Epistasis can refer to a modification of the additive and/or dominance effects of the interacting loci (Fig. 1a-b), and for two diploid loci can be easily visualized by plotting the phenotypes of the nine different genotypes (Fig. 1c-e). Epistatic interactions for quantitative traits fall into two categories: a change of the magnitude of effects, in which the phenotype of one locus is enhanced or suppressed by genotypes at the other locus (Fig. 1d); or a change of direction of effects (Fig. 1e). In the absence of epistasis the estimates of additive and dominance effects at each locus are the same regardless of the genotype of the other locus (Fig. 1c). With epistasis, the effect of one locus depends on the genotype at the interacting locus.
Fig. 1. Two-locus genotypic effects.
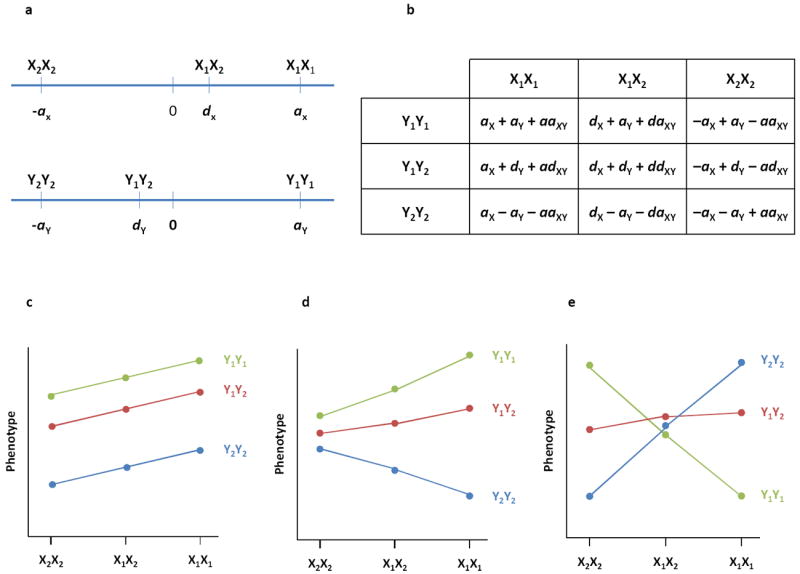
(a) Genotypic values for loci X and Y, each with two alleles (X1, X2, Y1, Y2). The additive effect (a) of each locus is one half the difference in mean phenotype between the two homozygous genotypes. The dominance effect (d) is the difference between the mean phenotype of heterozygous individuals and the average phenotype of the homozygous genotypes10. d = 0 indicates additive gene action; d ≠ 0 denotes departures from additivity due to dominance. (b) Genotypic values for two-locus genotypes. The first two terms for each genotype denote the additive combination of single locus additive and dominance effects. With epistasis additional terms reflecting additive by additive (aaXY), additive by dominance (adXY, daXY) and dominance by dominance (ddXY) epistasis contribute to the genotype value. (c-d) Graphical representations of genotypic effects at two biallelic loci. (c) Additive gene action at locus X, partial dominance at locus Y, and no epistasis between X and Y. (d) Epistasis where the additive effect of locus Y is much greater in the X1X1 than the X2X2 genetic background. (e) Epistasis where the additive effects of locus X are opposite in the Y1Y1 and Y2Y2 genetic backgrounds.
The role of epistasis in the genetic architecture of quantitative traits has been controversial since early formulations of quantitative genetic theory12,13 and continues today7,14. Differing perspectives regarding the importance of epistasis arise depending on whether one focuses on epistatic interactions at the level of individual genotypes or at the level of epistatic genetic variance in populations2,9. Epistatic interactions at the level of individual genotypic values (variously called ‘genetical’, ‘biological’ or ‘physiological’ epistasis15) are independent of allele frequencies at the interacting loci. In populations, the total genetic variance is partitioned into orthogonal components attributable to additive, dominance and epistatic variance, which depend on allele frequencies10,11.
Epistatic gene action (Fig. 2a, b) can have peculiar effects in populations because the effects of one locus (the target locus) vary depending on the allele frequency of the interacting locus (Fig. 2c, d). If the allele frequency of the interacting locus varies among populations, the effect of the target locus can be significant in one population but not another, or even of the opposite sign. Epistatically interacting loci generate substantial additive genetic variance over much of the allele frequency spectrum, because of non-zero main (additive) effects (Fig. 2e, f). Epistatic variance is maximal when both interacting loci are at intermediate frequencies and is of much smaller magnitude than the additive genetic variance unless the genotypic values effect at one locus are in opposite directions in the different genetic backgrounds (Fig. 2g, h). Additive genetic variance therefore accounts in theory for most of the total genetic variance for a wide range of allele frequencies in the presence of epistatic gene action (Fig. 2i, j)10,11,14.
Fig. 2. Quantitative genetics of additive by additive interactions.
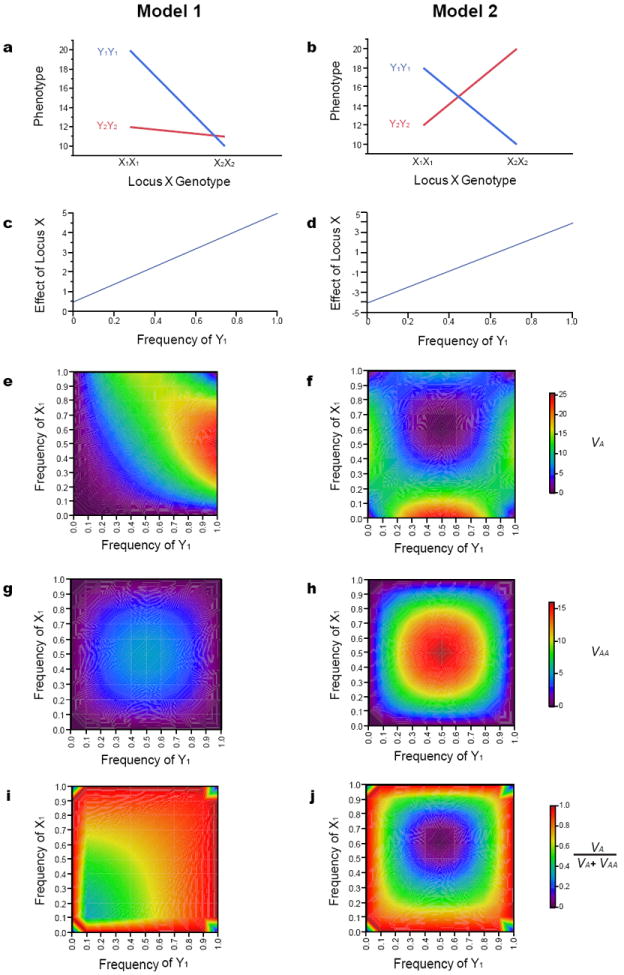
The four double homozygote genotypes at two hypothetical bi-allelic loci (X and Y) are depicted. (a) Genotypic values for an epistatic model (Model 1) in which the effect of the X locus is greater in the Y1Y1 genetic background (blue line) than the Y2Y2 genetic background (red line). (b) Genotypic values for an epistatic model (Model 2) in which the effect of the X locus is of similar magnitude but in the opposite direction in the Y1Y1 genetic background (blue line) than the Y2Y2 genetic background (red line). (c, d) The additive effect of the X locus depends on the frequency at the Y locus for epistatic Models 1 and 2, respectively. (e, f) Additive genetic variance (VA); (g, h) Additive by additive genetic variance (VAA); and (i, j) the ratio of additive genetic variance to the total genetic variance (VA/(VA + VAA)) for epistatic Models 1 and 2, respectively.
Most observed genetic variance for quantitative traits is additive. Additive genetic variance could be ‘real’ if most loci affecting the trait have additive gene action, or ‘apparent’ from non-zero main effects arising from epistatic gene action at many loci. This distinction is not important if the goal is to estimate heritability, predict phenotype from genetic relationships among individuals16,17 or predict short term response to artificial or natural selection, which depend on additive variance specific to the population of interest10,11. However, knowing whether additive variance is an emergent property of underlying epistatic gene action becomes critical if the goal is to functionally dissect the genotype-phenotype map, determine genetic interaction networks, understand the effects of mutational perturbations on standing variation, predict long-term responses to artificial and natural selection and understand the consequences of genetic drift and inbreeding on quantitative traits.
Distinguishing between real and apparent additive genetic variance requires that we obtain evidence for the existence of epistatic gene action, as well as estimate genotypic values at causal, potentially epistatic, pairs (or more) of loci. Genetically tractable model organisms enable analysis of epistatic interactions using: mutations generated in a common homozygous genetic background; quantitative genetic analyses of inbred lines and outbred populations; chromosome substitution, introgression and near-isogenic lines; and induced mutations as foci for exploring interactions with segregating variants. The ability to construct mapping populations from crosses of inbred lines where all allele frequencies are 0.5 is particularly powerful, as this maximizes epistatic variance and frequency of the rarer two-locus genotypes.
Epistasis Between Mutations
Mutations that have been induced in the same homozygous genetic background are excellent resources for estimating the magnitude and nature of di-genic epistatic interactions. Epistasis occurs if the difference in phenotype of the double mutant cannot be predicted from the combined effects of the single mutants. The double mutant phenotype can be more mutant than expected (this is known as ‘synergistic’, ‘enhancing’, ‘aggravating, or ‘negative’ epistasis) or less mutant than expected (known as ‘antagonistic’, ‘suppressing’, ‘alleviating’ or ‘positive’ epistasisThe advantage of this method is that the interacting partners are known, facilitating the construction of genetic interaction networks. A disadvantage is that it does not easily scale beyond pairwise interactions and to large numbers of mutations, since a comprehensive evaluation of pairwise interactions requires the generation of ~n2 genotypes, which in practice prevents exploration of the entire interaction space.
Epistasis between small numbers of mutations
Studies utilizing limited numbers of random mutations or mutations affecting the same trait show that epistasis is common. In Escherichia coli, 14/27 (52%) of pairs of random mutations that were tested exhibited epistasis for fitness18. In Drosophila melanogaster, 35/128 (27%) of tests for epistasis among pairs random mutations had significant effects on quantitative traits involved in intermediary metabolism. These epistatic effects were large and occurred between mutations without significant main effects19. Diallel cross designs among small numbers of P-element mutations that affect olfactory, locomotor and aggressive behavior and lifespan in D. melanogaster revealed extensive epistasis and defined new genetic interaction networks20-23. The interaction networks were influenced by environmental conditions, sex and the presence or absence of an additional interacting mutation21,22.
Genome-wide interaction screens
A few model systems are amenable to experimental analysis of genome wide genetic interaction networks. Analysis of deletions for all 6,000 genes in Saccharomyces cerevisiae revealed that only 20% of the genome is essential for survival, at least under optimal growth conditions24. This observation attests to the robustness of biological networks to mutational perturbation, and sets the stage for synthetic enhancement genetics in this species25. The deletion mutation collection and high-throughput methods for generating and selecting double mutants and for measuring growth rate and quantifying fitness25 have facilitated large scale genetic interaction screens in yeast26-30. Performing all ~18 million possible pairwise interaction tests remains a practical impossibility even in this genetically tractable model system. Therefore, the yeast global genetic network architecture was investigated with a set of query mutations chosen to represent biological pathways of interest. Interactions were examined between each of the query mutations and a larger number of target mutations26,29,30 or for all possible pairwise combinations of the query mutations27,28. Similar strategies have been adopted for systematic mapping of genetic interactions in Caenorhabditis elegans31,32 and in D. melanogaster cell lines33 using RNA interference. Larger scale studies26,27,29-31,33 using qualitative assays typically find that ~1-3% of interactions have significant effects, while smaller scale studies28,32 that employ quantitative assays identify a larger number of interactions (~13-35%). These studies have been instrumental in determining the general properties of genetic interaction networks (Box 1). The scale-free and small world properties of these networks imply that the major features of network topology can be inferred by focusing on major hub genes and interactions among the genes with which they interact.
Box 1. Properties of genetic interaction networks.
Genetic interaction networks in budding yeast25-30, C. elegans31,32 and D. melanogaster33 share common properties that are likely to be generalizable to genetic interaction networks in other species.
The fitness of the double mutant tends to be lower than expected when genes act in separate but compensatory pathways, and higher than expected if the genes act in the same pathway.
The distribution of the number of interactions per gene (connectivity) follows a power law distribution, such that many genes have no or few interactions, while a few genes have many interactions. Genes with many interacting partners are hubs in the interaction network.
Genetic interaction networks are ‘small world’ networks, such that the shortest path between a pair of genes is small, resulting in dense local neighborhoods of interacting genes that interact with each other.
Genetic interactions occur among functionally related genes that belong to the same pathway or biological process. The ‘guilt by association’ principle can thus be used to infer the function of a computationally predicted gene from the function of the genes with which it genetically interacts.
Network hub genes have the following characteristic compared to genes with fewer interactions: they are more important for fitness; they are more pleiotropic; their mRNAs are expressed at higher levels;they are more sensitive to environmental perturbations; and they are more evolutionarily conserved.
Genetic interaction networks are largely decoupled from protein-protein interaction networks.
Although properties of genetic network architecture are conserved across species, the network connectivities are not conserved.
Gene expression based screens
Mutations typically have pleiotropic effects on many phenotypes; therefore, focusing on only one phenotype will not uncover the full spectrum of possible interactions. Genome-wide analysis of differences of gene expression in the presence of single and double mutations relative to the control can be used to place genes in an interaction network in the absence of organismal-level phenotypes23,34-36. This approach is particularly powerful for higher eukaryotes that have long generation intervals and that lack high throughput methods for generating double mutants and for accurately measuring complex organismal quantitative traits, but for which large collections of mutations are available37-41. In Drosophila, single mutations have pleiotropic effects on hundreds of gene expression traits22,23,42. The genes for which expression is altered in the mutant genetic background are thus candidate genes for inclusion in a genetic interaction network affecting the organismal phenotype associated with the focal mutation. A high proportion of such candidate genes indeed exhibit epistasis with the focal mutation42. Thus, combining mutational perturbations with gene expression is a powerful approach to iteratively reverse engineer networks. The large numbers of candidate genes implicated by gene expression profiling indicates that the interaction space is very large.
Epistasis Between QTLs
To what extent does the extensive epistasis implicated by analysis of induced mutations translate to epistatic interactions in natural populations? The ability to construct inbred lines, artificial selection lines and chromosome substitution lines, as well as to map quantitative trait loci (QTLs) affecting complex traits by linkage and association, facilitates analysis of epistasis between naturally occurring variants in model organisms.
Comparing broad and narrow sense heritability
Narrow sense heritability, h2, refers to the fraction of the phenotypic variance of a quantitative trait due to additive genetic variance, whereas broad sense heritability, H2, refers to the fraction of the phenotypic variance due to all components of genetic variance. In model organisms that can be crossed as well as inbred, one can obtain unbiased estimates of narrow sense heritability from half-sib family designs or from the response to directional artificial selection. The genetic component of broad sense heritability that is estimated from fully inbred lines is due to additive variance and additive-by-additive epistatic variance (Box 2)10. Thus, epistatic variance can be inferred to contribute to the genetic architecture of traits for which the broad sense heritability is much greater than expected from strictly additive variance (Box 2). However, further gene mapping studies are necessary to identify the individual loci affecting the traits.
Box 2. Evidence for epistasis from realized and broad sense heritability.
The response to a single generation of artificial selection for a quantitative trait is given by the breeder’s equation, R = h2S. R is the difference in mean between the parental and offspring generation. h2 is the realized heritability, (VA + ½VAA)/VP, where VA is the additive and VAA is the additive by additive genetic variance (ignoring higher order epistatic interactions for simplicity), and VP is the phenotypic variance (VA + VAA + VE, where VE is the environmental variance). S, the selection differential, is the difference between the mean of the parental population and the mean of the selected group10. The realized heritability is thus h2 = R/S. If selection is conducted over several generations, the realized heritability can be estimated from the regression of the cumulated response (ΣR) on the cumulated selection differential (ΣS); that is, h2 = ΣR/ΣS. In contrast, broad sense heritabilities determined from variation among completely homozygous inbred lines (ignoring higher order additive by additive epistatic interactions) are H2 = (2VA + 4VAA)/VP, where VP, the phenotypic variance, is 2VA + 4VAA + VE (Ref. 100). Note that in this scenario there is no dominance variance and no epistatic interaction variance terms involving dominance, since there are no heterozygotes. If all variation is additive (VAA = 0), then the broad sense heritability (H2) among inbred lines is related to the realized heritability from artificial selection from the outbred populations from which the inbred lines were derived: H2 = 2h2/(1 + h2) (Ref. 101). Realized and broad sense heritabilities for D. melanogaster behavioral traits are given in the table (values come from references 102-106). In all cases broad sense heritabilities are greater than expected from strictly additive variance, implying that epistatic variance contributes to the genetic architecture of these traits.
|
|
|||
| Observed | Expected | ||
|
| |||
| Trait | h2 | H2 | H2 = 2h2/(1+h2) |
|
| |||
| Copulation latency | 0.07 | 0.25 | 0.13 |
| Startle response | 0.16 | 0.58 | 0.28 |
| Aggressive behavior | 0.09 | 0.78 | 0.17 |
| Ethanol knock-down time | 0.08 | 0.24 | 0.15 |
|
| |||
QTL-QTL interactions
QTLs are mapped either by linkage to, or association with, molecular markers. In model organisms, linkage mapping is typically conducted using line cross analysis. Linkage mapping populations are established by crossing two lines that differ genetically for the trait of interest, and generating backcross, F2 or advanced intercross individuals, or recombinant inbred lines (RILs) (Fig. 3a)10,11. Association mapping utilizes samples of individuals (or inbred lines) from a natural population. In both cases molecular marker genotypes and quantitative trait phenotypes are obtained for members of the mapping population. Standard statistical methods are used to determine whether there is a significant difference in phenotype between marker genotypes, in which case the QTL affecting the trait is either linked to, or in linkage disequilibrium (LD) with, the marker locus21. These tests are performed for each marker in turn, and genomic regions for which the P-value of the test passes an appropriate threshold that accounts for multiple tests correspond to the position of the QTL. Association mapping can be performed for candidate genes or genome wide. Compared to linkage mapping using a population of the same size, association mapping captures more genetic diversity and has increased mapping precision, but is prone to artifactual LD induced by population structure and has reduced power to detect QTLs that have minor allele frequencies < 0.5 (Ref. 21).
Fig. 3. Genotypes for mapping QTLs between two genetically divergent lines.
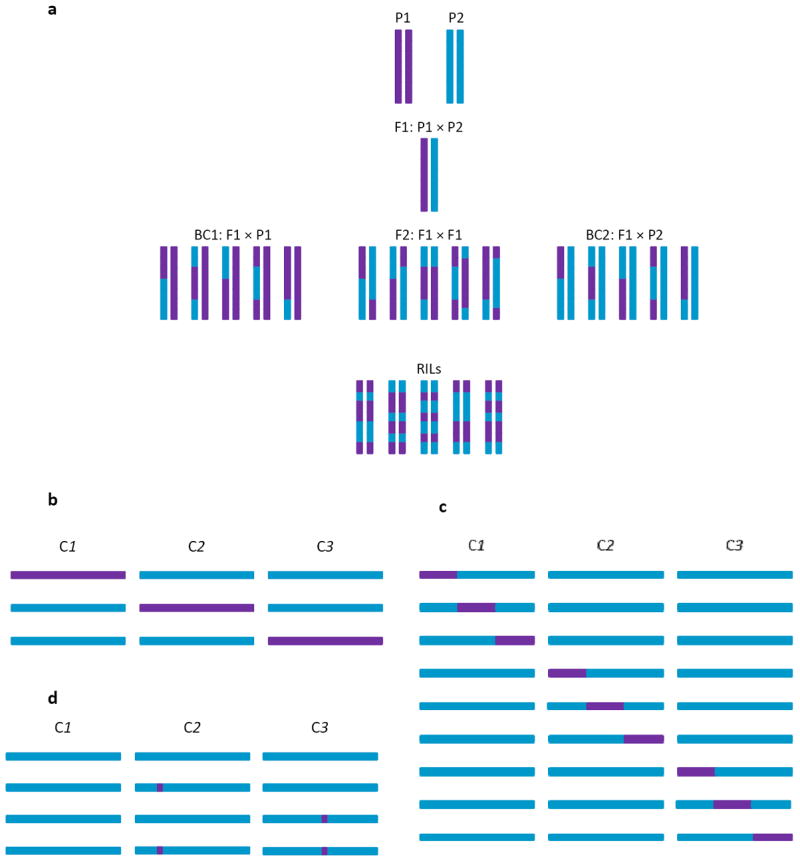
(a) Parental lines (P1 and P2) are crossed to produce an F1 generation. Common segregating generations used for QTL mapping are backcrosses of the F1 to either parental line (BC1, BC2), F2 derived from mating F1 individuals, and recombinant inbred lines (RILs) derived by inbreeding F2 families. (b-d) Experimental designs based on introgression. (b) Chromosome substitution lines, (c) introgression lines, (d) near-isogenic lines. Three chromosomes (C1 – C3) are depicted.
Epistasis between QTLs is estimated by fitting a statistical model that includes the main effects of each QTL and the effects of the QTL × QTL interaction term (Fig. 4). Utilizing multi-factorial perturbations in epistasis screens has the advantage that many interactions can be tested using genotypes and phenotypes that are determined for a relatively small number of individuals. As a result, it is more efficient for exploring interaction space than is laboriously constructing all possible pairwise combinations of mutant alleles. The power to detect epistasis between QTLs in mapping populations derived from inbred lines is maximal, because all polymorphic alleles have frequencies of 0.5. However, in small mapping populations the number of lines that carry the rarer double-homozygous genotype classes is small, which increases the variance in the mean value of the trait within each class; in addition, other segregating QTLs can confound the estimate of epistasis for the tested pair of loci. These factors, plus the severe multiple testing penalty for pairwise epistasis screens, make it difficult to detect all but extremely strong interactions, particularly in association mapping populations where allele frequencies are not balanced. Given these inherent biases against detecting epistasis, most studies only evaluate additive QTL effects. However, when epistasis is evaluated in linkage mapping populations, it is often found. Epistatic effects can be as large as main effects, and can occur between QTLs that are not individually significant.
Fig. 4. Two dimensional search for epistatic interactions.
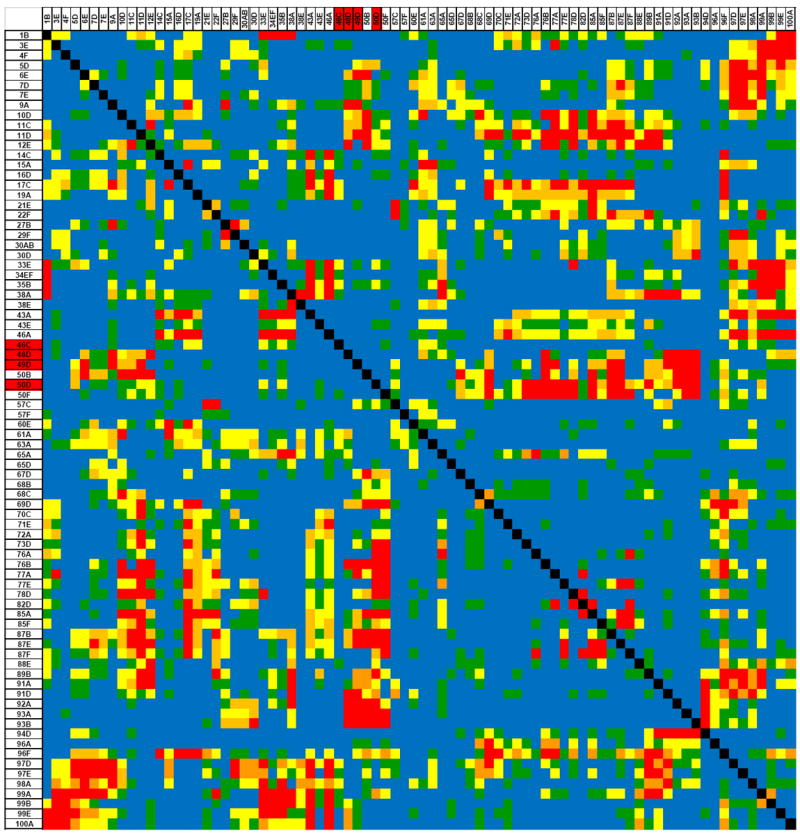
Data from an experiment mapping QTLs affecting Drosophila lifespan in an RIL population are depicted109. The x-axis and y-axis depict the marker loci. Two main effect QTLs are indicated at cytological positions 46C-49D and at 50D (indicated by red shading on the x and y axes). The body of the graph depicts the P-values of the QTL × QTL interaction terms. Main effect QTLs do not interact with each other, but do interact with QTLs without significant main effects. QTLs without significant main effects show significant interaction effects. Red: P < 0.0001; orange: 0.0001 ≤ P < 0.001; yellow: 0.001 ≤ P < 0.01; green: 0.01 ≤ P < 0.05; blue: P ≥ 0.05.
A sampling of traits for which epistatic interactions have been detected in QTL mapping experiments includes sporulation efficiency43,44 and gene expression traits45 in yeast; thermal preference in C. elegans46; bristle number, wing shape, longevity, enzyme activity, metabolic rate and flight velocity in D. melanogaster20,21; body weight and adiposity traits47-50, litter size51 and serum insulin-like growth factor 152 in mice; growth rate53,54 in chickens; growth rate55 and metabolites56,57 in Arabidopsis thaliana; and differences in whole-plant and inflorescence architecture between maize and teosinte58. While these studies demonstrate that epistasis cannot be ignored when describing the genetic architecture of complex traits, QTL mapping alone does not identify the causal interacting genes since the QTL intervals contain many loci.
Model organisms allow further dissection of QTLs. First, one can construct near isogenic lines (NILs), in which a region containing the QTL is introgressed into the isogenic background of one of the parental lines, and successive generations of recombination are used to whittle down the QTL to a small genomic interval (Fig. 3d). This approach was used to confirm the epistatic effects of two QTLs with no individual main effects for C. elegans thermal preference, but for which the interaction accounted for 50% of the total variance in this behavior46. Similarly, genetic dissection of A. thaliana NILs for a region with no overall effect on growth rate revealed two epistatically interacting QTLs that affect growth rate, for one of which the effect on growth was in opposite directions in the different genetic backgrounds55. Second, one can perform transformation and allelic replacement to prove that variants are causal, as well as to engineer all possible combinations of causal variants to investigate epistasis at nucleotide resolution. These approaches were used in D. melanogaster to demonstrate that each of three domains in the Adh gene, as well as an intragenic epistatic interaction, contributed to the difference in Adh protein levels between the Fast and Slow electrophoretic alleles59, and in S. cerevisiae to reveal strong epistasis for causal variants affecting sporulation efficiency43,44.
A powerful QTL mapping design is to introgress genomic regions from one strain into the genetic background of another. This can be done at the level of entire chromosomes, to create a panel of chromosome substitution strains60 (Fig. 3b), or for introgressions that tile across the genome of the donor line (Fig. 3c), as for genome tagged mice61. A relatively small number of introgression lines can be used to map QTLs with high precision. Epistasis occurs if the sum of the effects of the introgressed fragments is significantly greater than, or significantly less than, the mean difference in phenotype between the two parental strains. In rodents, introgression designs detect more QTLs, and QTLs that have larger effects, than do classical mapping populations for a wide variety of blood chemistry, bone and behavioral traits. In addition, the sum of the effects of individual QTLs are several orders of magnitude greater than the difference in phenotype between the parental strains60-62. Similar results are found for aggressive behavior in D. melanogaster63. These results indicate that the combined effects of individual introgressed regions in the genome of the donor line are less than additive. Less-than-additive effects of introgressed QTLs have also been demonstrated for several fruit quality traits in tomato64,65.
Epistatic interactions lead to differing main effects of each of the interacting loci for different allele frequencies of the interacting locus (Fig. 2c, d). As such, they also lead to lack of replication of estimated QTL effects in populations in which allele frequencies of causal interacting loci differ66. In model organisms one can construct mapping populations with different QTL allele frequencies to determine how often allelic effects vary; here, lack of replication of QTL effects can identify potentially interacting loci. The D. melanogaster Genetic Reference Panel (DGRP) is a collection of ~200 sequenced inbred lines derived from a single population, which enables genome-wide association mapping for quantitative traits using all polymorphic molecular variants67. Flyland is a large outbred advanced intercross population derived from 40 DGRP lines68. In this population, QTLs can be rapidly mapped by phenotyping large numbers of individuals and sequencing pools of individuals from the phenotypic extremes of the distribution; QTLs have significant differences in allele frequencies between the two pools of sequenced flies68,69. None of QTLs detected for each of three quantitative traits were replicated in extreme QTL mapping in the Flyland population. However, 50-60% of the QTLs detected for the three traits in either population participated in at least one epistatic interaction, and these interactions perturbed common, biologically plausible, and highly connected genetic networks68. Although these analyses point to pervasive epistasis, the challenge remains to determine which of the statistically predicted interactions are biologically significant.
Epistasis Between Mutations and QTLs
Analysis of epistasis between induced mutations does not scale well to large numbers of mutations, but has the advantage that the interacting partners are specified. Analysis of epistasis between QTLs has the advantage that interactions among large numbers of polymorphisms and genes can be evaluated, but due to the severe multiple testing penalty, there will be large numbers of false positive associations among the top interactions for which there is the highest level of statistical support. An alternative strategy is to carry out one-dimensional screens that evaluate the phenotypic effects of a known mutation in different genetic backgrounds. Although these designs have not been implemented on a large scale, there are many studies indicating that this will be a very powerful approach.
Waddington3 noted the contrast between the large effects and phenotypic variability of mutations and the apparent stability of wild type strains, despite exposure to naturally occurring genetic and environmental perturbations. He coined the term ‘canalization’ to refer to the buffering of natural variation against such perturbations. In modern parlance, genetic canalization refers to suppressing (less than additive) epistatic interactions between naturally segregating variants. To the extent that these interactions occur between different genetic loci, one can probe the nature and magnitude of the naturally occurring epistatic modifier loci by asking to what extent they modify the effects of a mutant allele.
One of the first experiments to demonstrate the occurrence of naturally segregating epistatic modifiers of a mutation was Rendel’s introgression of a scute (sc) mutation into a wild derived background70. D. melanogaster has four large scutellar bristles on the dorsal thorax – this number is invariant in nature. Mutations at sc reduce this number to an average of one or less. In a wild type genetic background segregating for sc and sc+ alleles, the number of scutellar bristles increased to ~3 in sc mutants and to 5-6 in sc+ individuals following artificial selection for increased bristle number. These results are consistent with selection of epistatic modifiers of sc that were segregating in the initial population and that suppress the mutant sc phenotype. However, the genetic backgrounds for this experiment were not well defined. More recently, introgressions of mutant Ultrabithorax, Antennapedia, Sevenless and scalloped alleles into different wild-derived D. melanogaster backgrounds have demonstrated variation outside the invariant wild type phenotype for, respectively: haltere size, shape and bristle number71,72; the antenna to leg transformation homeotic phenotype72; eye roughness and size73; and wing morphology74. The epistatic effects ranged from complete suppression to enhancement of the mutant phenotype.
A variant of the mutant introgression design is to cross the mutant allele to a sample of wild-derived lines and evaluate phenotypes of F1 genotypes. The advantage of this method is that it is easier to implement than constructing introgression lines; the disadvantage is that any phenotypic variation cannot be attributed to allelic complementation (dominance effects) or non-allelic complementation (epistasis) unless the experiment is conducted in a QTL mapping population. In D. melanogaster, crosses of a dominant Epidermal Growth Factor Receptor mutation to wild-derived lines gives a range of eye roughness phenotypes73,75. Approximately 1-2% of F1 progeny from crosses of D. melanogaster strains carrying mutant alleles of the heat shock protein gene Hsp90 to outbred strains had a wide variety of morphological abnormalities, suggesting that Hsp90 normally suppresses alleles affecting multiple phenotypes76. These results indicate that populations harbor a hidden reservoir of genetic variation for invariant traits that is only revealed in the ‘decanalizing’ background of the mutation. Such variation has been called ‘potential variance’ or ‘cryptic genetic variation’77.
Experimental designs to assess epistasis between mutations and QTLs can be adapted to assess the effect of naturally segregating epistatic modifiers of mutations that affect traits exhibiting quantitative phenotypic variation in natural populations. Here, the effects of both the mutant and wild type alleles of the locus in question need to be assessed for the quantitative trait phenotype in different genetic backgrounds, in an introgression or F1 design. Epistasis occurs if the additive effect of the mutation varies with genetic background, detected as a significant statistical interaction between the mutant and background genotypes. These designs have been utilized in D. melanogaster to demonstrate epistasis for the extended lifespan phenotype that is caused by overexpression of a human Superoxide dismutase transgene in motorneurones78, and between several mutations affecting startle response79 (Fig. 5), olfactory behavior and sleep traits80 in different DGRP line backgrounds. Similarly, there is epistasis between a null myostatin allele and genetic background for growth traits in mice81; between the disease resistance mutation Rp1-D21 and genetic background for the hypersensitive response in maize82; and for an RNAi knock down Hsp90 allele and genetic background for morphological and life history traits in A. thaliana83.
Fig. 5. Epistasis between naturally occurring variation and mutations in D. melanogaster.
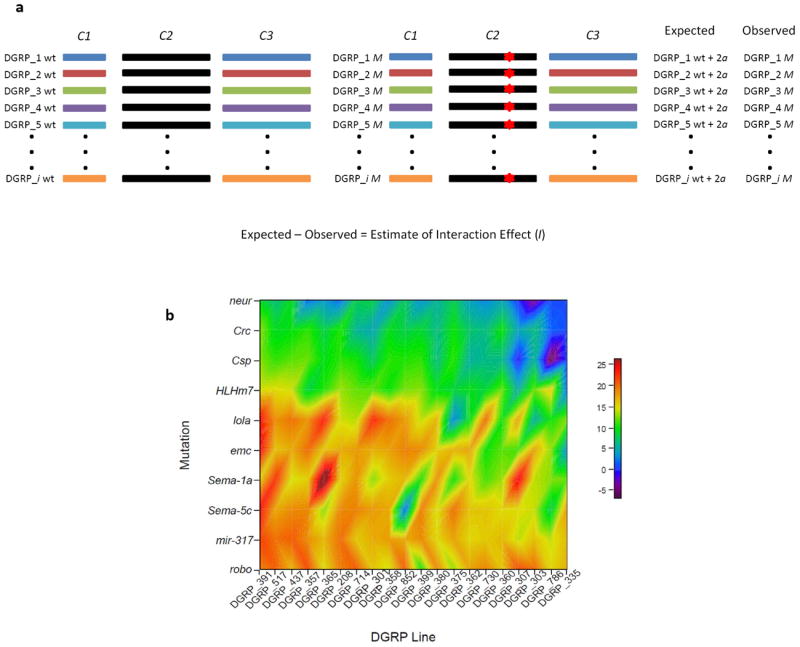
(a) Graphical representation of genotypes of i homozygous Drosophila Genetic Reference Panel (DGRP) lines, in which C1, C2 and C3 represent the three major chromosomes. Co-isogenic C2 chromosomes containing a wild type allele (DGRP_i wt) or a mutant allele (red star, DGRP_i M) of a focal gene affecting a quantitative trait have been introgressed into each DGRP line. The quantitative trait is measured for all pairs of wt and M DGRP introgression lines. The difference in phenotype between the wild type and mutant allele in the background on which the mutant was generated is 2a. If there are only additive effects on the phenotype, the expectation is that the effect of the mutation will be the same in each DGRP line background and the expected phenotype of the ith DGRP line with the mutant C2 allele is DGRP_i wt + 2a. If not, the difference between the expected and observed phenotypes is due to epistasis. (b) Estimates of epistatic interactions for ten mutations affecting startle response in 20 DGRP backgrounds. The interaction effects vary among mutations and DGRP lines, and are large and predominantly positive; i.e., naturally occurring variation suppresses the effects of the mutations. (Data from Ref. 79)
Only a few studies to date have analyzed QTL mapping populations to map, by linkage or association, loci that interact with focal mutations 72,74,75,81-83. Some studies have used candidate gene association analyses to test whether naturally occurring alleles at the mutant locus75 or naturally occurring variants at a known interacting locus74 interacted with the mutant allele. Others performed unbiased genome scans in a QTL mapping population72,81-83, typically uncovering unlinked interacting loci without significant main effects.
Implications of Pervasive Epistasis
The studies reviewed here indicate that epistatic gene action is a common feature of the genetic architecture of quantitative traits in model organisms. By extension, the same is likely to be true for quantitative traits in other organisms where gene-gene interactions are more difficult to detect, including humans. The epistatic interactions that have been detected define previously uncharacterized, highly interconnected genetic networks that are enriched for biologically plausible gene ontology categories, metabolic and cellular pathways. Analysis of epistasis reveals that much quantitative genetic variation is hidden and not apparent from analysis of main effects of causal variants, and that additivity is an emergent property of underlying epistatic networks. Furthermore, several types of observation suggest that natural populations have evolved suppressing epistatic interactions as homeostatic (canalizing) mechanisms. These observations include: less-than-additive interactions between QTLs; cryptic genetic variation for invariant phenotypes in natural populations that can only be observed in the presence of a decanalizing mutation; and naturally segregating variation that largely suppresses the effects of induced mutations for quantitative traits.
This realization is paradigm-shifting. Rather than perceiving phenotypic variation for quantitative traits in natural populations as highly variable, it may be more accurate to wonder why there is not more variation in organismal phenotypes, given the large amount of segregating molecular genetic polymorphism. Genome wide association studies in model organisms67 as well as humans84 typically find an inverse relationship between minor allele frequency and additive effect, such that the rarer alleles are associated with larger effects than common alleles. Statistically, rare alleles must have larger effects than common alleles to be detected in a mapping population of the same size; the puzzle is why so few common alleles of large effect are found segregating within natural populations. One possible explanation is that rare alleles have large effects because they are relatively new mutations, and epistatic modifiers that ameliorate their effects have not yet occurred in the population. Common alleles are presumably older, and could achieve an intermediate frequency due to a modifier mutation at another locus that suppresses the effect of the polymorphism.
On the other hand, QTLs detected by linkage mapping in populations derived from crosses of inbred lines typically have moderately large effects20,21. Possibly, these loci were not common in the populations from which the parental inbred lines were derived. Alternatively, the lines which survived inbreeding could be enriched for compatible epistatic interactions that were decanalized by crossing to a different genetic background. In this case, one would predict that adding additional parental lines to linkage mapping populations might incorporate additional canalizing alleles, such that more QTLs, with smaller effects, will be found compared to populations derived from crosses of two inbred lines. This prediction appears to be borne out in an outbred advanced intercross population derived from eight inbred mouse strains85, as well as in the maize nested association mapping population, consisting of 200 RILs from each of 25 crosses between diverse inbred lines and a single common parental line86.
Pervasive epistasis has consequences for plant and animal breeding, evolutionary biology, and human genetics. Applied breeding programs rely on artificial selection within populations as well as transfer of exotic genetic material to elite lines to improve quantitative traits of agronomic importance. In the presence of epistasis, the genetic architecture of response to artificial selection from the same base population could differ among replicate lines as well as within the same line over time, due to allele frequency drift and changes in frequency of causal alleles due to selection. Loci with beneficial effects in one genetic background will not have the same effects when introgressed into another background, unless interacting loci are identified and co-introgressed. Many modern breeding programs use additive models based on dense molecular markers and estimates of trait phenotypes from a reference population to predict breeding values of selection candidates based on genotype information only16,17; in the presence of epistasis genomic prediction may be poor if the frequency of causal alleles varies between the reference and test populations.
Two major unresolved questions in evolutionary biology concern the mechanisms maintaining quantitative variation in natural populations, and the causes of adaptation and speciation. The former puzzle10,87,88 arises because heritabilities of quantitative traits are appreciable in natural populations such that the magnitudes of genetic and environmental variation are approximately equal; yet most quantitative traits appear to be under strong stabilizing selection89, which reduces genetic variation. Direct estimates of mutational variance for quantitative traits in many model organisms are ~0.001 of the environmental variance90. Most theoretical models that are used to assess the possibility that quantitative genetic variation is maintained by a balance between elimination of variation by stabilizing selection and re-introduction by mutation cannot simultaneously account for the empirical estimates89, 91. Estimates of mutational variance are too low to generate the observed levels of genetic variance under strong selection. Suppressing epistasis between QTLs or mutations could cause overestimates of the strength of stabilizing selection and underestimates of the magnitude of mutational variation, respectively, necessitating a revision of the inference that mutation-selection balance does not account for much segregating variation for traits under stabilizing selection79. Furthermore, inbreeding and genetic drift cause variation in allele frequencies from the parental population. With epistatic gene action, this can result in the ‘conversion’ of epistatic variance to additive variance, potentially enabling rapid adaptation to new environments92-94. Epistasis is central to Wright’s13 models of the genetic basis of evolution and founder effect speciation models92. With epistasis, the genetic architecture of response to natural selection will be different in different populations, potentially increasing the likelihood of evolution of Dobzhansky-Muller incompatibilities5,6 and consequent speciation events.
Epistasis is one of several non-mutually exclusive explanations for small effects, missing heritability, and lack of replication of top trait-associated variants in different populations in human GWA studies84. First, with suppressing epistasis, additive effects of common interacting loci will be small. Second, estimates of narrow sense heritability in humans are obtained from twice the difference in the correlation of monozygotic and dizygotic twins10, and are biased upward in the presence of dominance and epistasis. Thus, suppressing epistasis could potentially account for the high levels of heritability and small amounts of additive genetic variation that have been estimated from mapped loci in human populations. Third, estimates of additive effects of causal alleles will differ between populations with different allele frequencies but the same underlying epistatic genetic architecture66,68. Additive genomic prediction methods utilizing all variants explain a much higher proportion of phenotypic variance in human GWA studies than obtained by summing the variance explained from individual markers exceeding the genome-wide significance threshold95, but the prediction accuracy of these methods is low in independent populations96,97. Genomic prediction methods that allow for non-additive effects98.99 are likely to increase the accuracy of individual risk prediction, but understanding the biology of human quantitative traits and complex diseases will require knowledge of the underlying loci.
Conclusions and Future Prospects
Mapping epistatic interactions is statistically and experimentally challenging. Much progress in understanding and predicting genetic interaction networks affecting quantitative traits has been made by taking advantage of the unique resources and experimental designs that are available for model organisms. Epistasis is common and can cause cryptic genetic variation for quantitative traits in natural populations; however, mapping the causal interacting variants is in its infancy. Future advances will be made by employing these experimental designs on a much larger scale, taking advantage of falling costs of sequencing individual genomes as well as prospects for high throughput and accurate measurements of quantitative trait phenotypes21. Molecular variants, singly and in combination, perturb transcriptional, metabolic and protein interaction networks, which in turn causally affect organismal phenotypes21. However, systems genetic models to date only consider additive effects of variants on transcripts and traits21. In the future, we must assess the effects of pairwise and higher order epistatic interactions between polymorphic DNA variants on molecular interaction networks, and in turn evaluate their effects on organismal phenotypes in order to understand the mechanistic basis of epistasis. Only then will we be able to go beyond describing the phenomenon of epistasis to predicting and testing its consequences for genetic systems.
KEY POINTS.
A major challenge of contemporary biology is to understand how naturally occurring genetic variation causes phenotypic variation in quantitative traits. Despite the biological plausibility that genetic variation affects non-linear networks at multiple levels of biological organization, most efforts to explain the relationship between genetic and phenotypic variation concentrate on additive effects of single loci.
Mapping gene-gene interactions (epistasis) is challenging experimentally, statistically and computationally due to the large number of interactions to be evaluated (of the order of the square of the number of single locus tests for pairwise interactions).
Epistatic interactions for quantitative traits result in either a change of the magnitude or direction of allelic effects at one locus, depending on the genotype at the interacting locus. With epistasis, the additive (main) effect of a locus changes with the allele frequency of the interacting locus, such that estimates of effects at a single interacting locus will differ between populations with different allele frequencies.
Epistasis generates largely additive variance for quantitative traits; therefore, the observation that most genetic variance for quantitative traits is additive is not inconsistent with underlying epistatic genetic architecture. Experimental designs that are only possible in model organisms enable the exploration of the gene-gene interaction space, and the results of these analyses indicate that epistasis is pervasive.
Genetic interaction networks are derived by assessing quantitative trait phenotypes of wild type, single mutant and double mutant genotypes. The networks exhibit scale-free and small world properties, such that the major features of network topology may be inferred by focusing on major hub genes and interactions among the genes with which they interact. Combining genomics with mutant-interaction screens may aid in identifying network hubs.
Leveraging multi-factorial perturbations in QTL mapping populations is less laborious than constructing all pairwise combinations of mutant alleles, and the ability to construct chromosome substitution lines, introgression lines and near isogenic lines in model organisms maximizes power to detect interactions. Epistasis is commonly observed, even between loci without significant main effects, but there are only a few cases where the actual interacting variants have been identified.
Natural populations harbor hidden reservoirs of cryptic genetic variation that can be revealed by introducing mutations into wild-derived backgrounds. When this approach is implemented in a QTL mapping population, it is a powerful experimental design for identifying naturally occurring variants that enhance or suppress the mutant phenotype.
Observations of cryptic genetic variation and less-than-additive epistatic interactions between QTLs suggest that natural populations have evolved suppressing epistatic interactions as homeostatic (canalizing) mechanisms for quantitative traits. Pervasive epistasis has consequences for plant and animal breeding, evolutionary biology, and human genetics.
In the future, assessment of the pleiotropic effects of genetic interactions on transcriptional, metabolic and protein interaction networks will provide insights into the mechanistic basis of epistasis for organismal phenotypes.
Acknowledgments
I thank Shanshan Zhou for preparing Figures 2 and 5b and Robert Anholt for comments on the manuscript. Work in the author’s laboratory is supported by National Institutes of Health grants R01 GM45146, R01 GM076083, R01 GM59469 and R01 AA016560.
GLOSSARY
- Heterosis
Also known as ‘hybrid vigour’, heterosis is the phenomenon whereby the mean value of a quantitative trait in the F1 progeny of two inbred lines exceeds (in the direction of increased fitness) the mean value of the parental lines (‘mid-parent heterosis’) or the mean value of the best parent (‘high parent heterosis’).
- Di-hybrid cross
A cross between parental lines that are fixed for alternative alleles at two unlinked loci (e.g., A1A1B2B2 × A2A2B1B1, where A and B denote the loci and the subscripts are the alleles) in which nine genotypes segregate in the F2 generation.
- Dominance effect
The difference between the genotypic value of the heterozygous genotype from the average of the two homozygous genotypes at a locus affecting a quantitative trait.
- Standing variation
Allelic variation that is currently segregating within a population, as opposed to alleles that appear as the result of new mutation events.
- Main effects
Also known as marginal effects, these are the effects of a variable averaged over all other variables.
- Diallel cross
A class of experimental designs that are used to estimate additive and non-additive variance components for a quantitative trait from all possible crosses among a population of inbred lines. Full diallel designs include reciprocal crosses, whereas half-diallel designs do not; parental lines can be included or excluded in either case.
- Synthetic enhancement
A type of epistatic interaction whereby the phenotype of a double mutant is more severe than predicted from the additive effects of the single mutants.
- Minor allele frequency
The frequency of the less common allele at a bi-allelic locus.
- Multiple testing penalty
The downward adjustment of the significance threshold for individual statistical tests required when multiple hypothesis tests are conducted on a single data set; for n independent tests, the Bonferroni adjusted 5% significance threshold is 0.05/n.
- Introgression
The substitution of a genomic region from one strain into that of another, typically by repeated backcrosses.
- Founder effect speciation models
A class of models for the evolution of reproductive isolation that is based on changes in selection pressures and allele frequencies of epistatically interacting loci, which result from the establishment of a new population in a new environment from a small number of individuals.
- Dobzhansky-Muller incompatibilities
Substitutions that occur during divergence of two lineages that are neutral in the respective genetic backgrounds but which cause a reduction in fertility and/or viability in hybrids between the two lineages.
- Missing heritability
The phenomenon whereby the fraction of total phenotypic variance explained by all individually significant loci in human genome wide association analyses for common diseases and quantitative traits is typically much less than the heritability estimated from relationships among relatives.
- Genomic prediction methods
Models, which are derived from a discovery sample that consists of individuals with measured phenotypes and genome wide marker data, that are used to predict individual phenotypes in an independent sample from the same population using genome wide marker data only.
Biography
Trudy F. C. Mackay
Trudy F. C. Mackay is William Neal Reynolds and Distinguished University Professor of Biological Sciences at North Carolina State University, Raleigh, USA. She received her Ph.D. in Genetics from the University of Edinburgh, UK, in the laboratory of Alan Robertson, and did a postdoctoral fellowship with Roger Doyle at Dalhousie University, Halifax, Canada. She has been at North Carolina State University since 1988. Her interests are the molecular genetic basis of variation for quantitative traits and mechanisms that maintain variation in complex traits within populations and cause divergence of trait values between species.
References
- 1.Kauffman SA. The Origins of Order. Oxford University Press; New York: 1993. [Google Scholar]
- 2.Phillips PC. Epistasis - the essential role of gene interactions in the structure and evolution of genetic systems. Nat Rev Genet. 2008;9:855–867. doi: 10.1038/nrg2452. A comprehensive review describing the importance of studying gene interactions with respect to dissecting regulatory pathways, mapping the genetic basis of complex traits and understanding the structure and evolution of complex systems. [DOI] [PMC free article] [PubMed] [Google Scholar]
- 3.Waddington CH. Canalization of development and the inheritance of acquired characters. Nature. 1942;150:563–565. doi: 10.1038/1831654a0. [DOI] [PubMed] [Google Scholar]
- 4.Waddington CH. The Strategy of Genes. George Allen and Unwin; London: 1957. [Google Scholar]
- 5.Dobzhansky T. Genetics and the Origin of Species. Columbia University Press; New York: 1937. [Google Scholar]
- 6.Muller HJ. In: Bearing of the Drosophila Work on Systematics. The New Systematics. Huxley JS, editor. Clarendon; Oxford: 1940. [Google Scholar]
- 7.Carlborg O, Haley CS. Epistasis: Too often neglected in complex trait studies? Nat Rev Genet. 2004;5:618–625. doi: 10.1038/nrg1407. [DOI] [PubMed] [Google Scholar]
- 8.Cordell HJ. Detecting gene-gene interactions that underlie human diseases. Nat Rev Genet. 2009;10:392–404. doi: 10.1038/nrg2579. [DOI] [PMC free article] [PubMed] [Google Scholar]
- 9.Cheverud JM, Routman EJ. Epistasis and its contribution to genetic variance components. Genetics. 1995;139:1455–1461. doi: 10.1093/genetics/139.3.1455. The first paper to clearly articulate the difference between the effect of epistatic gene action on individual genotypes, which is independent of allele frequency; and the contribution of epistasis to epistatic variance for a quantitative trait, which does depend on allele frequency. [DOI] [PMC free article] [PubMed] [Google Scholar]
- 10.Falconer DS, Mackay TFC. Introduction to Quantitative Genetics. Longman; Harlow, Essex: 1996. [Google Scholar]
- 11.Lynch M, Walsh JB. Genetics and Analysis of Quantitative Traits. Sinauer Associates; Sunderland, MA: 1998. [Google Scholar]
- 12.Fisher RA. The Genetical Theory of Natural Selection. Clarendon; Oxford: 1930. [Google Scholar]
- 13.Wright S. Evolution in Mendelian populations. Genetics. 1931;16:97–159. doi: 10.1093/genetics/16.2.97. [DOI] [PMC free article] [PubMed] [Google Scholar]
- 14.Hill WG, Goddard ME, Visscher PM. Data and theory point to mainly additive genetic variance for complex traits. PLoS Genet. 2008;4:e1000008. doi: 10.1371/journal.pgen.1000008. [DOI] [PMC free article] [PubMed] [Google Scholar]
- 15.Alvarez-Castro JM, Carlborg O. A unified model for functional and statistical epistasis and its application in quantitative trait loci analysis. Genetics. 2007;176:1151–1167. doi: 10.1534/genetics.106.067348. [DOI] [PMC free article] [PubMed] [Google Scholar]
- 16.Meuwissen TH, Hayes BJ, Goddard ME. Prediction of total genetic value using genome-wide dense marker maps. Genetics. 2001;157:1819–1829. doi: 10.1093/genetics/157.4.1819. [DOI] [PMC free article] [PubMed] [Google Scholar]
- 17.Hayes BJ, Lewin HA, Goddard ME. The future of livestock breeding: genomic selection for efficiency, reduced emissions intensity, and adaptation. Trends Genet. 2013;29:206–214. doi: 10.1016/j.tig.2012.11.009. [DOI] [PubMed] [Google Scholar]
- 18.Elena SF, Lenski RE. Test of synergistic interactions among deleterious mutations in bacteria. Nature. 1997;390:395–398. doi: 10.1038/37108. One of the first studies demonstrating epistasis for new mutations affecting fitness, using the E. coli model system. [DOI] [PubMed] [Google Scholar]
- 19.Clark AG, Wang L. Epistasis in measured genotypes: Drosophila P-element insertions. Genetics. 1997;147:157–163. doi: 10.1093/genetics/147.1.157. [DOI] [PMC free article] [PubMed] [Google Scholar]
- 20.Flint J, Mackay TFC. Genetic architecture of quantitative traits in mice, flies, and humans. Genome Res. 2009;19:723–733. doi: 10.1101/gr.086660.108. [DOI] [PMC free article] [PubMed] [Google Scholar]
- 21.Mackay TFC, Stone EA, Ayroles JF. The genetics of quantitative traits: challenges and prospects. Nat Rev Genet. 2009;10:565–577. doi: 10.1038/nrg2612. [DOI] [PubMed] [Google Scholar]
- 22.Magwire MM, et al. Quantitative and molecular genetic analyses of mutations increasing Drosophila life span. PLoS Genetics. 2010;6:e1001037. doi: 10.1371/journal.pgen.1001037. [DOI] [PMC free article] [PubMed] [Google Scholar]
- 23.Zwarts L, et al. Complex genetic architecture of Drosophila aggressive behavior. Proc Natl Acad Sci USA. 2011;108:17070–17075. doi: 10.1073/pnas.1113877108. [DOI] [PMC free article] [PubMed] [Google Scholar]
- 24.Giaever G, et al. Functional profiling of the Saccharomyces cerevisiae genome. Nature. 2002;418:387–391. doi: 10.1038/nature00935. [DOI] [PubMed] [Google Scholar]
- 25.Boone C, Bussey H, Andrews BJ. Exploring genetic interactions and networks with yeast. Nat Rev Genet. 2007;8:437–449. doi: 10.1038/nrg2085. [DOI] [PubMed] [Google Scholar]
- 26.Tong AH, et al. Global mapping of the yeast genetic interaction network. Science. 2004;303:808–813. doi: 10.1126/science.1091317. This paper describes the first high throughput analysis of synthetic lethal genetic interaction mapping in yeast, deriving the first large scale genetic interaction network. [DOI] [PubMed] [Google Scholar]
- 27.Collins SR, Schuldiner M, Krogan N, Weissman JS. A strategy for extracting and analyzing large-scale quantitative epistatic interaction data. Genome Biol. 2006;7:R63. doi: 10.1186/gb-2006-7-7-r63. [DOI] [PMC free article] [PubMed] [Google Scholar]
- 28.St Onge RP, et al. Systematic pathway analysis using high-resolution fitness profiling of combinatorial gene deletions. Nat Genet. 2007;39:199–206. doi: 10.1038/ng1948. [DOI] [PMC free article] [PubMed] [Google Scholar]
- 29.Costanzo M, et al. The genetic landscape of a cell. Science. 2010;327:425–431. doi: 10.1126/science.1180823. [DOI] [PMC free article] [PubMed] [Google Scholar]
- 30.Szappanos B, et al. An integrated approach to characterize genetic interaction networks in yeast metabolism. Nat Genet. 2011;43:656–662. doi: 10.1038/ng.846. [DOI] [PMC free article] [PubMed] [Google Scholar]
- 31.Lehner B, Crombie C, Tischler J, Fortunato A, Fraser AG. Systematic mapping of genetic interactions in Caenorhabditis elegans identifies common modifiers of diverse signaling pathways. Nat Genet. 2006;38:896–903. doi: 10.1038/ng1844. This study describes the first large-scale mapping of genetic interaction networks in a metazoan, generated by feeding hypomorphic C. elegans mutants arrays of bacteria that expressed dsRNAi molecules targeting specific signalling pathways. [DOI] [PubMed] [Google Scholar]
- 32.Byrne AB, et al. A global analysis of genetic interactions in Caenorhabditis elegans. J Biol. 2007;6:8. doi: 10.1186/jbiol58. [DOI] [PMC free article] [PubMed] [Google Scholar]
- 33.Horn T, et al. Mapping of signaling networks through synthetic genetic interaction analysis by RNAi. Nature Methods. 2011;8:341–346. doi: 10.1038/nmeth.1581. [DOI] [PubMed] [Google Scholar]
- 34.Van Driessche N, et al. Epistasis analysis with global transcriptional phenotypes. Nat Genet. 2005;37:471–477. doi: 10.1038/ng1545. [DOI] [PubMed] [Google Scholar]
- 35.Aylor DL, Zeng Z-B. From classical genetics to quantitative genetics to systems biology: modeling epistasis. PLoS Genet. 2008;4:e1000029. doi: 10.1371/journal.pgen.1000029. [DOI] [PMC free article] [PubMed] [Google Scholar]
- 36.Carter GW, et al. Prediction of phenotype and gene expression for combinations of mutations. Mol Syst Biol. 2007;3:96. doi: 10.1038/msb4100137. [DOI] [PMC free article] [PubMed] [Google Scholar]
- 37.Bellen HJ, et al. The Drosophila gene disruption project: progress using transposons with distinctive site specificities. Genetics. 2011;188:731–743. doi: 10.1534/genetics.111.126995. [DOI] [PMC free article] [PubMed] [Google Scholar]
- 38.Dietzl G, et al. A genome-wide transgenic RNAi library for conditional gene inactivation in Drosophila. Nature. 2007;448:151–156. doi: 10.1038/nature05954. [DOI] [PubMed] [Google Scholar]
- 39.Sabrautzki S, et al. New mouse models for metabolic bone diseases generated by genome-wide ENU mutagenesis. Mamm Genome. 2012;23:416–430. doi: 10.1007/s00335-012-9397-z. [DOI] [PMC free article] [PubMed] [Google Scholar]
- 40.O’Rourke EJ, Conery AL, Moy TI. Whole-animal high-throughput screens: the C. elegans model. Methods Mol Biol. 2009;486:57–75. doi: 10.1007/978-1-60327-545-3_5. [DOI] [PubMed] [Google Scholar]
- 41.O’Malley RC, Alonso JM, Kim CJ, Leisse TJ, Ecker JR. An adapter ligation-mediated PCR method for high-throughput mapping of T-DNA inserts in the Arabidopsis genome. Nat Protoc. 2007;2:2910–2917. doi: 10.1038/nprot.2007.425. [DOI] [PubMed] [Google Scholar]
- 42.Anholt RRH, et al. The genetic architecture of odor-guided behavior in Drosophila: Epistasis and the transcriptome. Nat Genet. 2003;35:180–184. doi: 10.1038/ng1240. The first study to demonstrate that genes that whose transcription is co-regulated in a mutant background themselves affect the same trait as the focal mutations, and that mutations in these genes interact epistatically with the focal mutation. [DOI] [PubMed] [Google Scholar]
- 43.Deutschbauer AM, Davis RW. Quantitative trait loci mapped to single-nucleotide resolution in yeast. Nat Genet. 2005;37:1333–1340. doi: 10.1038/ng1674. [DOI] [PubMed] [Google Scholar]
- 44.Gerke J, Lorenz K, Cohen B. Genetic interactions between transcription factors cause natural variation in yeast. Science. 2009;323:498–501. doi: 10.1126/science.1166426. [DOI] [PMC free article] [PubMed] [Google Scholar]
- 45.Brem RB, Storey JD, Whittle J, Kruglyak L. Genetic interactions between polymorphisms that affect gene expression in yeast. Nature. 2005;436:701–703. doi: 10.1038/nature03865. [DOI] [PMC free article] [PubMed] [Google Scholar]
- 46.Gaertner BE, Parmenter MD, Rockman MV, Kruglyak L, Phillips PC. More than the sum of its parts: a complex epistatic network underlies natural variation in thermal preference behavior in Caenorhabditis elegans. Genetics. 2012;192:1533–1542. doi: 10.1534/genetics.112.142877. [DOI] [PMC free article] [PubMed] [Google Scholar]
- 47.Cheverud JM, et al. Genetic architecture of adiposity in the cross of LG/J and SM/J inbred mice. Mamm Genome. 2001;12:3–12. doi: 10.1007/s003350010218. [DOI] [PubMed] [Google Scholar]
- 48.Stylianou IM, et al. Quantitative trait locus analysis for obesity reveals multiple networks of interacting loci. Mamm Genome. 2006;17:22–36. doi: 10.1007/s00335-005-0091-2. [DOI] [PubMed] [Google Scholar]
- 49.Jarvis JP, Cheverud JM. Mapping the epistatic network underlying murine reproductive fatpad variation. Genetics. 2011;187:597–610. doi: 10.1534/genetics.110.123505. [DOI] [PMC free article] [PubMed] [Google Scholar]
- 50.Leamy LJ, Gordon RR, Pomp D. Sex-, diet-, and cancer-dependent epistatic effects on complex traits in mice. Front Genet. 2011;2:71. doi: 10.3389/fgene.2011.00071. [DOI] [PMC free article] [PubMed] [Google Scholar]
- 51.Peripato AC, et al. Epistasis affecting litter size in mice. J Evol Biol. 2004;17:593–602. doi: 10.1111/j.1420-9101.2004.00702.x. [DOI] [PubMed] [Google Scholar]
- 52.Hanlon P, et al. Three-locus and four-locus QTL interactions influence mouse insulin-like growth factor-I. Physiol Genomics. 2006;26:46–54. doi: 10.1152/physiolgenomics.00247.2005. [DOI] [PMC free article] [PubMed] [Google Scholar]
- 53.Carlborg O, Jacobsson L, Ahgren P, Siegel P, Andersson L. Epistasis and the release of genetic variation during long-term selection. Nat Genet. 2006;38:418–420. doi: 10.1038/ng1761. This study documents the importance of epistatic interactions governing long term response to artificial selection for growth rate in chickens. [DOI] [PubMed] [Google Scholar]
- 54.Pettersson M, Besnier F, Siegel PB, Carlborg O. Replication and explorations of high-order epistasis using a large advanced intercross line pedigree. PLoS Genet. 2011;7:e1002180. doi: 10.1371/journal.pgen.1002180. [DOI] [PMC free article] [PubMed] [Google Scholar]
- 55.Kroymann J, Mitchell-Olds T. Epistasis and balanced polymorphism influencing complex trait variation. Nature. 2005;435:95–98. doi: 10.1038/nature03480. This paper reports the surprising observation that a small chromosome interval with no effect on growth rate of A. thaliana contained two epistatically interacting QTLs affecting growth. [DOI] [PubMed] [Google Scholar]
- 56.Wentzel AM, et al. Linking metabolic QTLs with network and cis-eQTLs controlling biosynthetic pathways. PLoS Genet. 2007;3:1687–1701. doi: 10.1371/journal.pgen.0030162. [DOI] [PMC free article] [PubMed] [Google Scholar]
- 57.Rowe HC, Hansen BG, Halkier BA, Kliebenstein DJ. Biochemical networks and epistasis shape the Arabidopsis thaliana metabolome. Plant Cell. 2008;20:1199–1216. doi: 10.1105/tpc.108.058131. [DOI] [PMC free article] [PubMed] [Google Scholar]
- 58.Doebley J, Stec A, Gustus C. teosinte branched1 and the origin of maize: evidence for epistasis and the evolution of dominance. Genetics. 1995;141:333–346. doi: 10.1093/genetics/141.1.333. [DOI] [PMC free article] [PubMed] [Google Scholar]
- 59.Stam LF, Laurie CC. Molecular dissection of a major gene effect on a quantitative trait: the level of alcohol dehydrogenase expression in Drosophila melanogaster. Genetics. 1996;144:1559–1564. doi: 10.1093/genetics/144.4.1559. This classic paper uses P-element transformation to create all possible combinations of three segments of the Adh gene, showing that each of the three segments affects Adh activity, and that there is, surprisingly, epistasis between two different regions within the gene. [DOI] [PMC free article] [PubMed] [Google Scholar]
- 60.Shao H, et al. Genetic architecture of complex traits: large phenotypic effects and pervasive epistasis. Proc Natl Acad Sci USA. 2008;105:19910–19914. doi: 10.1073/pnas.0810388105. [DOI] [PMC free article] [PubMed] [Google Scholar]
- 61.Gale GD, et al. A genome-wide panel of congenic mice reveals widespread epistasis of behavior quantitative trait loci. Mol Psychiatry. 2009;14:631–645. doi: 10.1038/mp.2008.4. [DOI] [PMC free article] [PubMed] [Google Scholar]
- 62.Spiezio SH, Takada T, Shiroishi T, Nadeau JH. Genetic divergence and the genetic architecture of complex traits in chromosome substitution strains of mice. BMC Genet. 2012;13:38. doi: 10.1186/1471-2156-13-38. [DOI] [PMC free article] [PubMed] [Google Scholar]
- 63.Edwards AC, Mackay TFC. Quantitative trait loci for aggressive behavior in Drosophila melanogaster. Genetics. 2009;182:889–897. doi: 10.1534/genetics.109.101691. [DOI] [PMC free article] [PubMed] [Google Scholar]
- 64.Eshed Y, Zamir D. Less-than-additive epistatic interactions of quantitative trait loci in tomato. Genetics. 1996;143:1807–1817. doi: 10.1093/genetics/143.4.1807. [DOI] [PMC free article] [PubMed] [Google Scholar]
- 65.Causse M, Chaïb J, Lecomte L, Buret M, Hospital F. Both additivity and epistasis control the genetic variation for fruit quality traits in tomato. Theor Appl Genet. 2007;115:429–442. doi: 10.1007/s00122-007-0578-1. [DOI] [PubMed] [Google Scholar]
- 66.Greene CS, Penrod NM, Williams SM, Moore JH. Failure to replicate a genetic association may provide important clues about genetic architecture. PLoS One. 2009;4:e5639. doi: 10.1371/journal.pone.0005639. [DOI] [PMC free article] [PubMed] [Google Scholar]
- 67.Mackay TFC, et al. The Drosophila melanogaster Genetic Reference Panel. Nature. 2012;482:173–178. doi: 10.1038/nature10811. [DOI] [PMC free article] [PubMed] [Google Scholar]
- 68.Huang W, et al. Epistasis dominates the genetic architecture of Drosophila quantitative traits. Proc Natl Acad Sci USA. 2012;109:15553–15559. doi: 10.1073/pnas.1213423109. [DOI] [PMC free article] [PubMed] [Google Scholar]
- 69.Ehrenreich IM, et al. Dissection of genetically complex traits with extremely large pools of yeast segregants. Nature. 2010;464:1039–1042. doi: 10.1038/nature08923. [DOI] [PMC free article] [PubMed] [Google Scholar]
- 70.Rendel JM. Canalization of the scute phenotype of Drosophila. Evolution. 1959;13:425–439. [Google Scholar]
- 71.Gibson G, van Helden S. Is function of the Drosophila homeotic gene Ultrabithorax canalized? Genetics. 1997;147:1155–1168. doi: 10.1093/genetics/147.3.1155. [DOI] [PMC free article] [PubMed] [Google Scholar]
- 72.Gibson G, Wemple M, van Helden S. Potential variance affecting homeotic Ultrabithorax and Antennapedia phenotypes in Drosophila melanogaster. Genetics. 1999;151:1081–1091. doi: 10.1093/genetics/151.3.1081. [DOI] [PMC free article] [PubMed] [Google Scholar]
- 73.Polaczyk PJ, Gasperini R, Gibson G. Naturally occurring genetic variation affects Drosophila photoreceptor determination. Dev Genes Evol. 1998;207:462–470. doi: 10.1007/s004270050137. [DOI] [PubMed] [Google Scholar]
- 74.Dworkin I, et al. Genomic consequences of background effects on scalloped mutant expressivity in the wing of Drosophila melanogaster. Genetics. 2009;181:1065–1076. doi: 10.1534/genetics.108.096453. [DOI] [PMC free article] [PubMed] [Google Scholar]
- 75.Dworkin I, Palsson A, Birdsall K, Gibson G. Evidence that Egfr contributes to cryptic genetic variation for photoreceptor determination in natural populations of Drosophila melanogaster. Curr Biol. 2003;13:1888–1893. doi: 10.1016/j.cub.2003.10.001. [DOI] [PubMed] [Google Scholar]
- 76.Rutherford SL, Lindquist S. Hsp90 as a capacitor for morphological evolution. Nature. 1998;396:336–342. doi: 10.1038/24550. [DOI] [PubMed] [Google Scholar]
- 77.Gibson G, Dworkin I. Uncovering cryptic genetic variation. Nat Rev Genet. 2004;5:681–690. doi: 10.1038/nrg1426. This review documents the presence of cryptic genetic variation for complex traits and argues that it is important in understanding the genetic basis of common diseases in humans, artificial selection response in livestock and crops, and evolutionary responses to new mutations. [DOI] [PubMed] [Google Scholar]
- 78.Spencer CC, Howell CE, Wright AR, Promislow DE. Testing an ‘aging gene’ in long-lived drosophila strains: increased longevity depends on sex and genetic background. Aging Cell. 2003;2:123–130. doi: 10.1046/j.1474-9728.2003.00044.x. [DOI] [PMC free article] [PubMed] [Google Scholar]
- 79.Yamamoto A, Anholt RRH, Mackay TFC. Epistatic interactions attenuate mutations affecting startle behaviour in Drosophila melanogaster. Genet Res. 2009;91:373–382. doi: 10.1017/S0016672309990279. [DOI] [PubMed] [Google Scholar]
- 80.Swarup S, et al. Extensive epistasis for olfactory behavior, sleep and waking activity in Drosophila melanogaster. Genet Res. 2012;94:9–20. doi: 10.1017/S001667231200002X. [DOI] [PMC free article] [PubMed] [Google Scholar]
- 81.Cheng Y, et al. Mapping genetic loci that interact with myostatin to affect growth traits. Heredity. 2011;107:565–573. doi: 10.1038/hdy.2011.45. [DOI] [PMC free article] [PubMed] [Google Scholar]
- 82.Chaikam V, et al. Use of Mutant-Assisted Gene Identification and Characterization (MAGIC) to identify novel genetic loci that modify the maize hypersensitive response. Theor Appl Genet. 2011;123:985–997. doi: 10.1007/s00122-011-1641-5. [DOI] [PubMed] [Google Scholar]
- 83.Sangster TA, et al. HSP90-buffered genetic variation is common in Arabidopsis thaliana. Proc Natl Acad Sci USA. 2008;105:2969–2974. doi: 10.1073/pnas.0712210105. [DOI] [PMC free article] [PubMed] [Google Scholar]
- 84.Manolio TA, et al. Finding the missing heritability of complex diseases. Nature. 2009;461:747–753. doi: 10.1038/nature08494. [DOI] [PMC free article] [PubMed] [Google Scholar]
- 85.Valdar W, et al. Genome-wide genetic association of complex traits in heterogeneous stock mice. Nat Genet. 2006;38:879–887. doi: 10.1038/ng1840. [DOI] [PubMed] [Google Scholar]
- 86.Buckler ES, et al. The genetic architecture of maize flowering time. Science. 2009;325:714–718. doi: 10.1126/science.1174276. [DOI] [PubMed] [Google Scholar]
- 87.Barton NH, Turelli M. Evolutionary quantitative genetics: how little do we know? Annu Rev Genet. 1989;23:337–370. doi: 10.1146/annurev.ge.23.120189.002005. [DOI] [PubMed] [Google Scholar]
- 88.Barton NH, Keightley PD. Understanding quantitative genetic variation. Nat Rev Genet. 2002;3:11–21. doi: 10.1038/nrg700. [DOI] [PubMed] [Google Scholar]
- 89.Johnson T, Barton N. Theoretical models of selection and mutation on quantitative traits. Philos Trans R Soc Lond B Biol Sci. 2005;360:1411–1425. doi: 10.1098/rstb.2005.1667. [DOI] [PMC free article] [PubMed] [Google Scholar]
- 90.Houle D, Morikawa B, Lynch M. Comparing mutational variabilities. Genetics. 1996;143:1467–1483. doi: 10.1093/genetics/143.3.1467. [DOI] [PMC free article] [PubMed] [Google Scholar]
- 91.Zhang X-S, Hill WG. Genetic variability under mutation selection balance. Trends Ecol Evol. 2005;20:468–470. doi: 10.1016/j.tree.2005.06.010. [DOI] [PubMed] [Google Scholar]
- 92.Carson HL, Templeton AR. Genetic revolutions in relation to speciation phenomena: the founding of new populations. Annu Rev Ecol Syst. 1984;15:97–131. [Google Scholar]
- 93.Goodnight CJ. On the effect of founder events on epistatic genetic variance. Evolution. 1987;41:80–91. doi: 10.1111/j.1558-5646.1987.tb05772.x. [DOI] [PubMed] [Google Scholar]
- 94.Tachida H, Cockerham CC. A building block model for quantitative genetics. Genetics. 1989;121:839–844. doi: 10.1093/genetics/121.4.839. [DOI] [PMC free article] [PubMed] [Google Scholar]
- 95.Yang J, et al. Common SNPs explain a large proportion of the heritability for human height. Nat Genet. 2010;42:565–569. doi: 10.1038/ng.608. [DOI] [PMC free article] [PubMed] [Google Scholar]
- 96.Makowsky R, et al. Beyond missing heritability: Prediction of complex traits. PLoS Genetics. 2011;7:e1002051. doi: 10.1371/journal.pgen.1002051. [DOI] [PMC free article] [PubMed] [Google Scholar]
- 97.Benyamin B, et al. Childhood intelligence is heritable, highly polygenic and associated with FNBP1L. Mol Psychiatry. 2013 doi: 10.1038/mp.2012.184. Epub ahead of print. [DOI] [PMC free article] [PubMed] [Google Scholar]
- 98.Hu Z, et al. Genomic value prediction for quantitative traits under the epistatic model. BMC Genet. 2011;12:15. doi: 10.1186/1471-2156-12-15. [DOI] [PMC free article] [PubMed] [Google Scholar]
- 99.Long N, Gianola D, Rosa GJ, Weigel KA. Marker-assisted prediction of non-additive genetic values. Genetica. 2011;139:843–854. doi: 10.1007/s10709-011-9588-7. [DOI] [PubMed] [Google Scholar]
- 100.Bulmer MG. The Mathematical Theory of Quantitative Genetics. Clarendon Press; Oxford: 1985. [Google Scholar]
- 101.Anholt RRH, Mackay TFC. Principles of Behavioral Genetics. Elsevier, Inc; 2010. [Google Scholar]
- 102.Mackay TFC, et al. Genetics and genomics of Drosophila mating behavior. Proc Natl Acad Sci USA. 2005;102(Suppl 1):6622–6629. doi: 10.1073/pnas.0501986102. [DOI] [PMC free article] [PubMed] [Google Scholar]
- 103.Ayroles JF, et al. Systems genetics of complex traits in Drosophila melanogaster. Nat Genet. 2009;41:299–307. doi: 10.1038/ng.332. [DOI] [PMC free article] [PubMed] [Google Scholar]
- 104.Jordan KW, Carbone MA, Yamamoto A, Morgan TJ, Mackay TFC. Quantitative genomics of locomotor behavior in Drosophila melanogaster. Genome Biol. 2007;8:R172. doi: 10.1186/gb-2007-8-8-r172. [DOI] [PMC free article] [PubMed] [Google Scholar]
- 105.Edwards AC, Rollmann SM, Morgan TJ, Mackay TFC. Quantitative genomics of aggressive behavior in Drosophila melanogaster. PLoS Genet. 2006;2:e154. doi: 10.1371/journal.pgen.0020154. [DOI] [PMC free article] [PubMed] [Google Scholar]
- 106.Edwards AC, et al. A transcriptional network associated with natural variation in Drosophila aggressive behavior. Genome Biol. 2009;10:R76. doi: 10.1186/gb-2009-10-7-r76. [DOI] [PMC free article] [PubMed] [Google Scholar]
- 107.Morozova TV, Anholt RR, Mackay TFC. Phenotypic and transcriptional response to selection for alcohol sensitivity in Drosophila melanogaster. Genome Biol. 2007;8:R231. doi: 10.1186/gb-2007-8-10-r231. [DOI] [PMC free article] [PubMed] [Google Scholar]
- 108.Morozova TV, et al. Alcohol sensitivity in Drosophila: translational potential of systems genetics. Genetics. 2009;183:733–745. doi: 10.1534/genetics.109.107490. [DOI] [PMC free article] [PubMed] [Google Scholar]
- 109.Leips J, Mackay TFC. Quantitative trait loci for lifespan in Drosophila melanogaster: Interactions with genetic background and larval density. Genetics. 2000;155:1773–1788. doi: 10.1093/genetics/155.4.1773. [DOI] [PMC free article] [PubMed] [Google Scholar]