

Abstract
Nonlinear modeling of multi-input multi-output (MIMO) neuronal systems using Principal Dynamic Modes (PDMs) provides a novel method for analyzing the functional connectivity between neuronal groups. This paper presents the PDM-based modeling methodology and initial results from actual multi-unit recordings in the prefrontal cortex of non-human primates. We used the PDMs to analyze the dynamic transformations of spike train activity from Layer 2 (input) to Layer 5 (output) of the prefrontal cortex in primates performing a Delayed-Match-to-Sample task. The PDM-based models reduce the complexity of representing large-scale neural MIMO systems that involve large numbers of neurons, and also offer the prospect of improved biological/physiological interpretation of the obtained models. PDM analysis of neuronal connectivity in this system revealed "input-output channels of communication" corresponding to specific bands of neural rhythms that quantify the relative importance of these frequency-specific PDMs across a variety of different tasks. We found that behavioral performance during the Delayed-Match-to-Sample task (correct vs. incorrect outcome) was associated with differential activation of frequency-specific PDMs in the prefrontal cortex.
Keywords: Multi-input/multi-output (MIMO) neuronal systems, Prefrontal cortex, Dynamic nonlinear modeling, Principal Dynamic Modes, Modeling of neural systems, Neural coding, Volterra-Wiener modeling
1 Introduction
The study of neural information encoding and processing by neuronal ensembles is essential for the quantitative understanding of neural function and remains a formidable challenge. In pursuing this goal, many studies have relied on effective mathematical/computational modeling methodologies that seek to quantify the dynamic relations between recorded spike-train data (Churchland & Sejnowski 1999; Berger et al. 1988, 2010; Deadwyler & Hampson 2004; Anderson & Eliasmith 2004; Marmarelis et al. 2005, 2009, 2013). Early studies of “integrate-and-fire” models were initially useful but soon reached their intrinsic limitations in representing the actual complexity of neuronal dynamics (Koch & Segev 1989; Eeckman 1992; Abbott 1999). These limitations are also evident in the use of “generalized linear models” (Dobson 2002). Conductance-based multi-compartment models such as the Hodgkin-Huxley model and its many variants offer greater versatility but exhibit rapidly growing complexity in the context of large neuronal ensembles (Hodgkin & Huxley 1952; Fitzhugh 1955; Hindmarsh & Rose1984; Koch & Segev 1989; Hille 2001; Izhikevich 2007; Izhikevich & Edelman 2008). These models also typically describe only the generation of action potentials without inclusion of the important processes of synaptic transmission, somatodendritic integration and axonal propagation. In contrast to biophysicallyrealistic spiking network models, perceptron-type or Hopfield-type artificial neural networks employ continuous variables representing firing rates. While many interesting theoretical results have been generated for these models (Rosenblatt 1962; Koch & Segev 1989; Hopfield 1982; Widrow & Lehr 1990; Hertz et al. 1991; Eeckman 1992; Dobson 2002), the dynamics of actual spike-based neural systems are poorly modeled by perceptron-type or Hopfield-type artificial neural networks.
Our group has developed a general approach for modeling Multi-Input/Multi-Output (MIMO) systems that seeks to balance the dual requirements of fidelity and feasibility within a practical context (Marmarelis & Berger 2005; Berger et al. 2010, 2011, 2012; Hampson et al. 2012a,b,c; Marmarelis et al. 2009, 2012; Song et al. 2007, 2009; Zanos et al. 2008, 2009;) and yields models of predictive capability. A recent variant of this methodology employs the concept of Principal Dynamic Modes (PDMs) (Marmarelis 1997) to extract parsimonious models of nonlinear dynamic systems with greater interpretability within a biomedical context. This paper follows on a recent application to the prefrontal cortex of non-human primates (Marmarelis et al. 2013) and seeks to elaborate on the interpretation of the obtained PDM-based model with regard to its utility for parsing (i.e. properly segmenting and interpreting) the neural code imprinted on the experimental data during the Delayed-Match-to-Sample (DMS) task.
2 Methodology
The key methodological tool of this study is the PDM modeling approach that is outlined briefly below. In this approach, we seek a set of basis functions (the PDMs) that achieve efficient representation of the kernels of the equivalent Volterra model of a given system. Note that the latter constitutes a general and canonical input-output model form for all finite-memory systems – i.e. almost all physiological systems (Marmarelis 2004). The Volterra or PDM-based models are predictive in that they are able to describe the dynamic nonlinear transformations of arbitrary patterns of spike-train activity of multiple input neurons into spike-train activity of multiple output neurons in neuronal ensembles (Marmarelis et al. 2013).
The PDM-modeling methodology commences with a method for efficient estimation of Volterra kernels using Laguerre expansions (Marmarelis 1993; Marmarelis & Orme 1993; Marmarelis 1997, 2004). Following the kernel expansion, the output signal of a Q-th order system (for the single-input case) is expressed as:
| (1) |
where vj denotes the convolution of the input signal with the j-th Laguerre function and ε(t) denotes the residual prediction error. The expansion coefficients {cr} are estimated via least-squares fitting of Eq. (1). The kernel estimates are constructed using the estimated expansion coefficients (Marmarelis 2004). Upon estimation of the kernels of a second-order Volterra model for each output neuron (with the specified number of inputs), we determine the PDMs from the respective estimates of self-kernels via singular value decomposition (SVD) of a rectangular matrix composed of all first-order kernels and all second-order self-kernels weighted by the root-mean-square value of the respective input. The PDMs are the singular vectors that correspond to the significant singular values by applying a selection threshold (usually 10% of the maximum singular value). The PDMs are normalized to have maximum value equal to 1 (which is also the maximum absolute value).
The selected PDMs for each output neuron of the MIMO model are subsequently fused for all output neurons via SVD of a matrix containing the selected PDMs for all output neurons. This "fusion" process via SVD seeks to extract the PDM waveforms that are most commonly found among the PDM sets of the various output neurons, which correspond to the larger singular values of the SVD expression:
| (2) |
where R denotes the rectangular matrix composed of the PDMs of all output neurons, U and V denote the singular vector matrices, and (SL , Ss) are the submatrices containing the large and small singular values respectively – i.e. if H significant singular values are selected, then the top HxH block of SL and the bottom HxH block of SS are diagonal sub-matrices (with the respective ranked singular values on the diagonal), while the remaining blocks are zero. The significant "fused" PDMs are termed "global" PDMs and represent an efficient kernel expansion basis for all input-output dynamic relationships in the subject system. A separate set of global PDMs (gPDMs) is generally obtained for each distinct phase of the behavioral task (e.g. the Sample Presentation or the Match Response phases of the DMS task of this study). However, the gPDMs of the various phases of the task may also be fused via SVD, if we seek a functional basis that is valid across some or all phases of the task. Fusion of gPDMs may also occur across different tasks and/or different animals, depending on the objectives of each study. This process of "generalization" of the PDM-based model is subject, of course, to the trade-off between model predictive accuracy and model parsimony (in terms of number of required gPDMs). In the sequel, the term gPDM will be often replaced for simplicity by the term PDM with reference to the specified model applicability (e.g. across a set of neurons or animals or task phases or tasks etc.). Thus, the PDM-based modeling approach separates the representation of system dynamics (PDMs) from the nonlinearities (ANFs) and the inter-modulation characteristics (cross-terms).
To complete the estimation of the PDM-based MIMO model, we must also determine the associated nonlinear functions (ANFs), which represent the nonlinearities of the system, and the cross-terms of the MIMO model that represent the interactions among the various inputs as they impact each output (see Figure 1 for a schematic diagram of the PDM-based MIMO model). For a continuous output system, the ANFs are usually given a polynomial form and their unknown coefficients are estimated via least-squares fitting of the output equation (in the single-input case):
| (3) |
where uh(t) denotes the output of the h-th PDM and fh denotes the respective ANF. For a spike-output system, a threshold-trigger operator (TT) is appended at the output of Eq. (3) (see Figure 1) and the ANF of each PDM is computed as the histogram of the PDM-output values (the latter are computed as the convolution of the PDM with the respective input spike-train) that correspond to a spike at the respective output neuron, normalized by the histogram of all PDM-output values. Thus, the computed ANF may be viewed as an estimate of the conditional probability of having an output spike given a specific value of the respective PDM-output at each time. The ANF values are non-negative by construction (histogram values) and can be summed to yield the "strength" of each input-PDM-output channel. A binwidth of 0.5 is used for the histogram, with the central bin being symmetric around zero. The output of each ANF represents the additive contribution of the respective "input-PDM channel" to the likelihood of firing at the output neuron. For this reason, all the ANF outputs are summed to form their aggregate contribution to the Likelihood of Firing (LoF) for each output neuron (see the schematic diagram of Figure 1), with the addition of the significant "cross-terms" of the MIMO model that are determined by the following statistical significance test. The correlation coefficient between the system output and each product of all possible pairs of PDM outputs is tested using the w-statistic against the null hypothesis of zero correlation (Marmarelis & Marmarelis 1978). The coefficients of the selected significant cross-terms are estimated via least-squares regression on the output spike-train, where the sum of the ANF outputs is also taken as another regression variable. The efficacy of this approach has been tested and validated with simulated examples where “ground truth” is available. Application to actual neural systems has been recently demonstrated in the prefrontal cortex of non-human primates (Marmarelis et al. 2013).
Fig. 1.

Block diagram of the PDM-based MIMO model employing 5 PDMs with 4 Layer-2 input neurons and 4 Layer-5 output neurons designated as L2-Ni and L5-Ni respectively (i=1,2,3,4). In the notation ANF[i, j, k], i=output#, j=input#, k=PDM#. The threshold-trigger (TT) operator includes an exponential refractory component (see Marmarelis et al. 2013).
Figure 1 shows a schematic block-diagram of the PDM-based MIMO model of a neuronal ensemble in the prefrontal cortex (PFC) with 4 inputs (Layer 2 neurons), 4 outputs (Layer 5 neurons) and 5 global PDMs that is used in this study. The designation of the PDMs as “global” alludes to the fact that these PDMs result from “fusion” of PDMs derived for all input and output neurons for each phase of the DMS task (Sample-Presentation or Match-Response) and for Correct versus Incorrect responses separately. Observing the schematic of Figure 1, we see that the spike-train of each input neuron convolves with each of the global PDMs to generate the PDM outputs (graded signals) that are subsequently being transformed by the respective ANFs in a static nonlinear fashion to generate their respective contributions to the LoF of each output neuron. The ANF outputs for all "input-PDM-ANF channels" are summed for each output neuron and subjected to a “threshold-trigger” (TT) operator after addition of the cross-terms to generate the model prediction of the output spike-train. The TT includes an exponential refractory component with two parameters (initial refractory amplitude and relaxation timeconstant) which are determined as described inMarmarelis et al. (2013). We establish the following definitions:
Input Neuron: PFC Layer-2 neuron
Output Neuron: PFC Layer-5 neuron
Principal Dynamic Modes (PDMs): System-customized orthogonal basis for the representation of the system kernels (nonlinear dynamics)
Associated Nonlinear Function (ANF): Static nonlinear transformation of PDM output forming additively the model prediction; conditional probability of firing in this context
Input-PDM-Output (IPO) Channel: channel of input-output information transfer via each PDM defined by input-PDM convolution followed by ANF nonlinear transformation
Channel Strength (CS): the sum of the (positive) values of each ANF
The experimental methods used for the collection of the data are described in (Opris et al. 2011; Hampson et al. 2012c). The data were collected in the labs of Dr. Deadwyler and Dr. Hampson at Wake-Forest University from Layers 2 (L2) and 5 (L5) of the pre-frontal cortex (PFC) in non-human primates (NHP). The NHPs of this study were adult male rhesus macaque, Macaca mulata, that were trained to acknowledge a displayed computer-generated icon during the "sample-presentation" phase of the experiment (removed after acknowledgement) and, after a random delay from 5 to 35 sec, to match the previously acknowledged icon among several computer-generated icons presented to the NHP during the "match-response" phase of the experiment. When the correct icon is selected (matched), the animal is rewarded. During this task, the neuronal activity is recorded at PFC L2 neurons viewed as the “inputs” and PFC L5 neurons viewed as the “outputs” of a putative MIMO system that represents this transformation of neuronal activity during the various phases of the DMS task. The presented computer-generated icons are randomly changed from trial to trial.
We analyzed the collected data in two phases of the DMS task: (1) the “sample-presentation” (SP) phase between the display time of the "sample icon" and 3 sec later (which includes the acknowledgement, occurring typically 0.5–1.5 sec after display); and (2) the “match-response” phase between the display time of multiple icons, among which the "sample icon" is included, and the NHP behavioral response to match the "sample icon" (correctly or incorrectly). The spikes of the collected data were binned in 2 msec bins, when the mean-firing-rate was between 0.5 and 25 spikes per second (Opris et al. 2011; Hampson et al. 2012c). A set of illustrative spike-train data from a Layer-5 (output) neuron after the presentation of the multiple icons, including the "sample icon", during the Match-response phase of the experiment is shown in Figure 2 for 86 trials with Correct outcome (left panel) and for 44 trials with Incorrect outcome (right panel). The red circles mark the time of response of the NHP, which is the end of the analyzed dataset. It is evident by simple inspection that the response time is much shorter on the average for the Incorrect outcomes and their mean firing rate is lower over the initial 1 sec of the data-record. These "output" spike-train datasets for each Layer-5 neurons are analyzed with reference to the spike-train datasets of "input" Layer-2 neurons using the methodology described above to obtain the PDM-based input-output model. The 1st and 2nd order Volterra kernels were estimated using Laguerre expansions with 5 Laguerre basis functions having alpha parameter equal to 0.5, as determined through a search procedure (Marmarelis 2004). Five global PDMs were found to be significant in this system, as ascertained through the SVD procedure outlined above. Illustrative results are presented in the following section.
Fig. 2.

Illustrative spike-train data from a Layer-5 output neuron (503a) during the MR phase of the experiment for 86 trials with correct outcome containing 699 spikes (left panel) and for 44 trials with incorrect outcome containing 360 spikes (right panel). The red circles mark the time of response of the NHP, which is the end of the analyzed dataset.
A key benefit of the PDM-based modeling approach is that it offers potential means for biological/physiological interpretation of the obtained MIMO model. This is done by examining the form of the obtained PDMs, which describe the dynamic characteristics of the system, and the corresponding ANFs, which describe the interneuronal connectivity along distinct "input-PDM channels", as indicated in Figure 1. For instance, if the frequency-domain representation of a PDM exhibits resonant peaks at some frequency-band corresponding to the well-known neural rhythms (delta, theta, alpha, beta, gamma), which have been associated in previous studies with specific sensorimotor and cognitive functions, then a significant ANF for a specific input-output channel of this PDM indicates an active connection between the respective Layer-2 neuron (input) and Layer-5 neuron (output) of the functional type suggested by the characteristics of the respective PDM. For example, a significant ANF for a PDM with a resonant peak in the theta-band indicates transfer of information between the respective Layer-2 and Layer-5 neurons that is related to memory functions and sensorimotor integration – since the latter have been associated with theta-band activity. This is the primary interpretational approach that is utilized in the present study (see Discussion).
3 Results
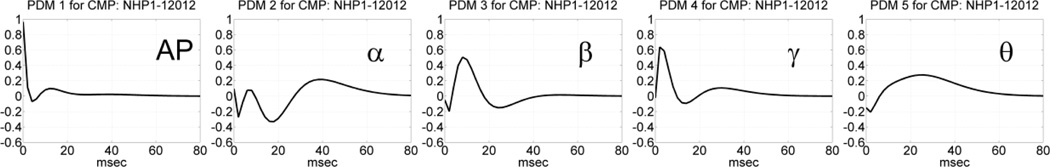
Following the procedure outlined above, we estimated the global PDMs for a MIMO model with 4 inputs and 4 outputs using data recorded in the prefrontal cortex (PFC) of NHP-1 during Session 12012 for trials with correct or incorrect outcomes, separately, in each of the two phases of the DMS experiment: the sample-presentation (SP) phase or the match-response (MR) phase. The obtained global PDMs for the trials with correct and incorrect outcome during the SP phase of Session 12012 are shown in Figure 3 in the time-domain. Their counterparts in the frequency-domain (FFT magnitudes) are shown in Figure 4. It is seen that the global PDMs for correct and incorrect outcomes are only slightly different and share some intriguing similarities, which are more evident and interpretable in the frequency domain. Specifically, it is seen that the 1st PDM has an all-pass (AP) spectral characteristic in both cases, akin to a relay transfer of information, while the resonant peaks in the frequency-domain representation of the other four global PDMs correspond to the well-known bands of neural rhythmic activity (α, β, γ, θ) that have been associated in numerous previous studies with specific cognitive functions. We note that the global PDMs are valid for all input-output neuronal connections and concern the dynamics of the data transfer from input (Layer-2) neurons to output (Layer-5) neurons. They do not concern the actual spike train activity of these neurons (the key distinction between a "signal" and a "system").
Fig. 3.

The five global PDMs of the PFC MIMO model in the time domain obtained from data of Session 12012 during the SP phase of 86 DMS trials with correct outcome (top panels) and 44 DMS trials with incorrect outcome (bottom panels).
Fig. 4.

The five global PDMs of the PFC MIMO model in the frequency domain obtained from data of Session 12012 during the SP phase of 86 DMS trials with correct outcome (top panels) and 44 DMS trials with incorrect outcome (bottom panels).
Similar results were obtained for the global PDMs in the MR phase of the DMS task during Session 12012, as illustrated in Figures 5 and 6 for the time-domain and frequency-domain respectively. It is seen again that the obtained global PDMs for the MR phase of trials with correct or incorrect outcome are only slightly distinct and exhibit intriguing similarities, especially evident in terms of their spectral peaks, which correspond to the celebrated bands of neural rhythms (AP, α, β, γ, θ) in both cases. Some small differences exist in the phase and in the detailed spectral profiles of these global PDMs. The PDM spectral peaks are found in the same bands of well-known neural rhythms in all cases (correct/incorrect outcome and SP/MR phase). This result is remarkable when we note that the number of trials used for the estimation of these global PDMs was 86 with correct outcomes and 44 with incorrect outcomes – i.e. a relatively small number of trials.
Fig. 5.
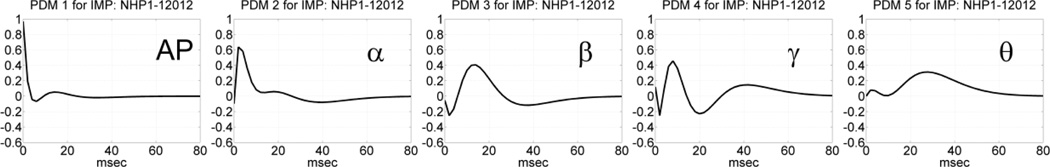
The five global PDMs of the PFC MIMO model in the time domain obtained from data of Session 12012 during the MR phase of 86 DMS trials with correct outcome (top panels) and 44 DMS trials with incorrect outcome (bottom panels).
Fig. 6.

The five global PDMs of the PFC MIMO model in the frequency domain obtained from data of Session 12012 during the MR phase of 86 DMS trials with correct outcome (top panels) and 44 DMS trials with incorrect outcome (bottom panels).
Since we seek comparison of the neuronal connectivity for information transfer in the PFC during trials with correct versus incorrect outcomes, we fuse the two sets of global PDMs over correct and incorrect outcomes and obtain a common set of global PDMs that is valid for both correct and incorrect trials (for each phase separately). This set of fused PDMs, termed "common" PDMs in the context of this study, allows comparison of neuronal connectivity for correct versus incorrect trials on the basis, solely, of the respective ANFs which define the various input-PDM-output (IPO) channel of neural information transfer in the PFC. The fusion of the two sets of global PDMs is performed with SVD as described in Methods. It results in the five "common" PDMs of the SP phase (valid for both correct and incorrect outcomes) that are shown in Figure 7. We see that these common PDMs retain the same spectral characteristics as the previous global PDMs that correspond to the (AP, α, β, γ, δ/θ) bands (as expected). What is gained by this fusion is that there are no (even small) differences in the PDM phase between correct and incorrect trials – allowing comparison on the basis, solely, of the respective CS values for each IPO channel of information transfer, characterized by the respective PDM band of neural rhythmic activity that has been associated in previous studies with specific cognitive functions (see Discussion). Using these common PDMs, we compute the ANFs for the SP phase of this MIMO model, following the procedure outlined in Methods. The computed set of 20 ANFs for one output neuron (5 PDMs×4 input neurons) for the SP phase of trials with correct outcomes is shown for illustrative purposes in Figure 8. Each ANF panel displays the computed conditional probability of having an output spike at each time instant, given that the value of the PDM-output is found in the respective bin. The sum of the (non-negative) ANF values constitutes a measure of the connection strength between a given pair of input and output neurons via each PDM-ANF channel and will be termed "channel strength" (CS) of the respective IPO channel in the sequel. The CS value of each IPO channel represents the conditional probability of having an output spike for any non-zero value of the respective PDM output. The CS values will be used to compare the neuronal connectivity between the Layer-2 and Layer-5 neurons for correct and incorrect outcomes of the DMS task. The difference of the CS values of each IPO channel between correct and incorrect trials will be used to assess possible differences in neural connectivity between the two outcomes.
Fig. 7.

The obtained five common PDMs in the time-domain (top) and frequency-domain (bottom) for the NHP prefrontal cortex during the SP phase of the DMS trials (session 12012 of NHP-1) that are valid for both correct and incorrect outcomes. The 1st PDM has an all-pass (AP) characteristic, while the other PDMs have resonant peaks in the well-known frequencybands of neural rhythmic activity (α, β, γ, δ/θ).
Fig. 8.

The computed 20 (= 5 PDMs×4 inputs) ANF estimates for a single output neuron during the SP phase of trials with correct outcomes in Session 12012 of NHP-1.
The obtained CS values for all 80 (4×5×4) IPO channels during the SP phase of the DMS task in Session 12012 are reported in Table 1, along with the respective CS differences (CSD) between correct and incorrect outcomes. We see that all CS values are below 5% and the CSD values remain below 1% in 68 out of 80 IPOs. Of the remaining, more significant, 12 CSD values (highlighted in red), half are found in the 1st PDM column (AP, essentially a relay mode), four with negative sign and two with positive sign. In the 2nd PDM column (α band), only one IPO channel (Input#1-Output#2) shows significant CSD value with negative sign (indicating reduced alpha-band connectivity for correct outcomes). Likewise, in the 3rd PDM column (β band), only one IPO channel (Input#3-Output#1) shows significant CSD value with negative sign (indicating reduced beta-band connectivity for correct outcomes). In the 4th PDM column (γ band), three IPO channels (see Table 1) show significant CSD value with mixed signs, indicating both reduced and increased gamma-band connectivity for correct outcomes (depending on the input-output connection). Finally, there is only one significant CSD value with negative sign in the 5th PDM column (δ/θ band) in the connection between the 2nd input and the 4th output. This type of inference regarding neuronal connectivity, which is based on the computed significant CSD values, allows novel insights into the "functional wiring" of neural systems that have not been possible heretofore. Thus, the functional decomposition of neuronal connectivity using PDMs and ANFs in the prefrontal cortex offers a rigorous method of determining how neural information processing is organized between Layer-2 neurons and Layer-5 neurons during each phase of the DMS task for different outcomes (see Discussion).
Table 1.
Channel strengths (CS) of the 4×5×4 IPO channels in the SP phase of Session 12012 for trials with correct/incorrect (CSP/ISP) outcomes and their differences.
| Input Neuron |
NHP-1, Session12012,  Channel Strengths for Output Neuron#1 Channel Strengths for Output Neuron#1 |
|||||||||
|---|---|---|---|---|---|---|---|---|---|---|
| CSP/ISP Channel Strengths | Channel Strength Differences (CSD) |
|||||||||
| Characteristic Band of PDMs | Characteristic Band of PDMs | |||||||||
| AP | α | β | γ | δ/θ | AP | α | β | γ | δ/θ | |
| 1 | 0.9 / 1.5 | 2.0 / 1.7 | 1.9 / 2.4 | 1.8 / 2.0 | 1.1 / 1.3 | −0.6 | 0.3 | −0.5 | −0.2 | −0.2 |
| 2 | 2.0 / 3.2 | 2.0 / 2.1 | 2.4 / 2.8 | 2.8 / 3.7 | 1.5 / 2.3 | −1.2 | −0.1 | −0.4 | −0.5 | −0.8 |
| 3 | 1.6 / 2.8 | 2.0 / 2.3 | 2.1 / 3.4 | 1.7 / 2.7 | 1.8 / 2.3 | −1.2 | −0.3 | −1.3 | −1.0 | −0.5 |
| 4 | 2.1 / 1.2 | 2.0 / 1.7 | 2.7 / 2.2 | 2.7 / 1.9 | 1.8 / 1.4 | 0.9 | 0.3 | 0.5 | 0.6 | 0.4 |
| μ | 1.7 / 2.2 | 2.0 / 2.0 | 2.3 / 2.7 | 2.3 / 2.6 | 1.6 / 1.8 | −0.5 | 0.1 | −0.4 | −0.3 | −0.3 |
| σ | 0.5 / 0.0 | 0 / 0.3 | 0.4 / 0.5 | 0.6 / 0.8 | 0.3 / 0.6 | 1.0 | 0.3 | 0.7 | 0.7 | 0.5 |
| Input Neuron |
NHP-1, Session12012, Channel Strengths for Output Neuron #2 | |||||||||
|---|---|---|---|---|---|---|---|---|---|---|
| CSP/ISP Channel Strengths | Channel Strength Differences (CSD) |
|||||||||
| Characteristic Band of PDMs | Characteristic Band of PDMs | |||||||||
| AP | α | β | γ | δ/θ | AP | α | β | γ | δ/θ | |
| 1 | 3.7 / 2.6 | 2.4 / 3.4 | 3.7 / 3.4 | 4.5 / 3.4 | 1.7 / 2.2 | 1.1 | −1.0 | 0.3 | 1.1 | −0.5 |
| 2 | 2.4 / 2.7 | 2.9 / 2.6 | 3.1 / 3.9 | 3.0 / 3.4 | 2.6 / 2.2 | −0.3 | 0.3 | −0.8 | −0.4 | 0.4 |
| 3 | 3.5 / 3.1 | 2.7 / 2.2 | 3.8 / 3.2 | 4.2 / 4.2 | 1.8 / 2.0 | 0.4 | 0.5 | 0.6 | 0 | −0.2 |
| 4 | 2.3 / 3.1 | 2.7 / 3.0 | 3.3 / 3.3 | 2.8 / 3.7 | 2.5 / 2.9 | −0.8 | −0.3 | 0 | −0.9 | −0.4 |
| μ | 3.0 / 2.0 | 2.7 / 2.8 | 3.5 / 3.5 | 3.6 / 3.7 | 2.2 / 2.3 | 0.1 | −0.1 | 0.0 | −0.1 | −0.2 |
| σ | 0.7 / 0.3 | 0.2 / 0.5 | 0.3 / 0.3 | 0.9 / 0.4 | 0.5 / 0.4 | 0.8 | 0.7 | 0.6 | 0.9 | 0.4 |
| Input Neuron |
NHP-1, Session12012, Channel Strengths for Output Neuron#3 |
|||||||||
|---|---|---|---|---|---|---|---|---|---|---|
| CSP/ISP Channel Strengths | Channel Strength Differences (CSD) |
|||||||||
| Characteristic Band of PDMs | Characteristic Band of PDMs | |||||||||
| AP | α | β | γ | δ/θ | AP | α | β | γ | δ/θ | |
| 1 | 2.6 / 2.0 | 2.4 / 2.0 | 3.3 / 2.8 | 3.5 / 2.8 | 1.9 / 1.1 | 0.6 | 0.4 | 0.5 | 0.7 | 0.8 |
| 2 | 2.1 / 1.1 | 2.1 / 1.9 | 2.6 / 2.2 | 3.2 / 1.8 | 1.9 / 1.6 | 1.0 | 0.2 | 0.4 | 0.4 | 0.3 |
| 3 | 2.8 / 2.2 | 2.4 / 2.3 | 3.6 / 3.5 | 3.3 / 2.4 | 2.0 / 1.6 | 0.9 | 0.1 | 0.1 | 0.9 | 0.4 |
| 4 | 3.2 / 2.3 | 2.6 / 2.2 | 3.4 / 3.2 | 3.6 / 3.2 | 1.7 / 1.9 | 0.9 | 0.4 | 0.2 | 0.4 | −0.2 |
| μ | 2.7 / 1.9 | 2.4 / 2.1 | 3.2 / 2.9 | 3.4 / 2.6 | 1.9 / 1.6 | 0.9 | 0.3 | 0.3 | 0.6 | 0.3 |
| σ | 0.5 / 0.6 | 0.2 / 0.2 | 0.4 / 0.6 | 0.2 / 0.6 | 0.1 / 0.3 | 0.2 | 0.2 | 0.2 | 0.2 | 0.4 |
| Input Neuron |
NHP-1, Session12012, Channel Strengths for Output Neuron#4 |
|||||||||
|---|---|---|---|---|---|---|---|---|---|---|
| CSP/ISP Channel Strengths | Channel Strength Differences (CSD) |
|||||||||
| Characteristic Band of PDMs | Characteristic Band of PDMs | |||||||||
| AP | α | β | γ | δ/θ | AP | α | β | γ | δ/θ | |
| 1 | 2.0 / 3.2 | 2.8 / 2.4 | 3.3 / 3.1 | 2.7 / 3.7 | 2.0 / 2.3 | −1.2 | 0.4 | 0.2 | −1.0 | −0.3 |
| 2 | 3.4 / 4.8 | 3.1 / 3.0 | 4.0 / 3.9 | 4.4 / 5.1 | 2.1 / 3.4 | −1.4 | 0.1 | 0.1 | −0.7 | −1.2 |
| 3 | 2.9 / 3.7 | 3.3 / 2.9 | 4.0 / 3.5 | 3.8 / 4.6 | 2.9 / 2.3 | −0.8 | 0.4 | 0.5 | −0.8 | 0.6 |
| 4 | 3.6 / 3.1 | 2.9 / 3.0 | 3.8 / 4.0 | 4.1 / 3.6 | 2.4 / 2.7 | 0.5 | −0.1 | −0.2 | 0.5 | −0.3 |
| μ | 3.0 / 3.7 | 3.0 / 2.8 | 3.8 / 3.6 | 3.8 / 4.3 | 2.4 / 2.7 | −0.7 | 0.2 | 0.2 | −0.5 | −0.3 |
| σ | 0.7 / 0.8 | 0.2 / 0.3 | 0.3 / 0.4 | 0.7 / 0.7 | 0.4 / 0.5 | 0.9 | 0.2 | 0.3 | 0.7 | 0.7 |
In the MR phase of the DMS task, the obtained five common PDMs are shown in Figure 9 and, although distinct from their counterparts in the SP phase (see Figure 7), they correspond again to the well-known bands of neural rhythms (viz. α, β, γ/θ, δ) in addition to the AP characteristics of the 1st PDM. The γ/θ characteristic of the 4th PDM comprises characteristics of both of these bands. We note that the theta band merged with the delta band in the common PDMs of the SP phase. The resulting CS and CSD values for these common PDMs are given in Table 2 for session 12012 of NHP-1. It is observed that some IPO channels exhibit very large absolute CSD values, relative to what was reported in Table 1. Specifically, the γ/θ band connection between the 2nd output neuron and the 1st or 3rd input neuron exhibits CSD value greater than 8% (8.6% and 25.7% respectively), while very large CSD values are also seen in the β band connection between the 1st output neuron and the first input neuron (-8.8%) or the 3rd output neuron and the second input neuron (6.4%). Note that the latter two IPO connections exhibit opposite polarity, implying significant but antagonistic change in the β band communication between the respective input-output neurons for correct outcomes. This signifies increased level of interactions between PFC and visual cortex (expressed in the γ band) or the hippocampus (expressed in the θ band) during correct-outcome trials, as well as elevated sensorimotor integration (expressed in the β band) that is expected in the MR phase of the DMS task (see Discussion). Other significant CSD values, comparable to the ones seen in the SP phase (see Table 1) are also seen and highlighted in red in Table 2. By far the most significant (almost dominant) role is ascribed by this analysis to the γ/θ band connection between the 3rd input neuron and the 2nd output neuron during the MR phase, consistent with higher cognitive/memory level activity during correct-outcome trials (see Discussion).
Fig. 9.

The obtained five common PDMs in the time-domain (top) and frequency-domain (bottom) for the NHP prefrontal cortex during the MR phase of the DMS trials (session 12012 of NHP-1) that are valid for both correct and incorrect outcomes. The 1st PDM has an all-pass (AP) characteristic, while the other PDMs have resonant peaks in the well-known frequency-bands of neural rhythmic activity (α, β, γ/θ, δ).
Table 2.
Channel strengths of the 4×5×4 Input-PDM-Output channels in the MR phase of Session 12012 for trials with correct/incorrect (CMR/IMR) outcomes and their differences.
| Input Neuron |
NHP-1 session12012,  Channel Strengths for Output Neuron #1 Channel Strengths for Output Neuron #1 |
|||||||||
|---|---|---|---|---|---|---|---|---|---|---|
| CMR/IMR Channel Strengths (CS) | Channel Strength Differences [CMR-IMR] |
|||||||||
| Characteristic Band of PDMs | Characteristic Band of PDMs | |||||||||
| AP | α | β | γ/θ | δ | AP | α | β | γ/θ | δ | |
| 1 | 1.3 / 1.0 | 2.0/ 2.3 | 1.3/ 10.1 | 1.0 / 1.8 | 0.9 / 1.0 | 0.3 | −0.3 | −8.8 | −0.8 | −0.1 |
| 2 | 3.3 / 1.8 | 1.7/ 1.3 | 0.7 / 0.9 | 0.5 / 0.2 | 0.9 / 0.8 | 1.5 | 0.4 | −0.2 | 0.3 | 0.1 |
| 3 | 1.2 / 1.0 | 2.2/ 2.7 | 1.2 / 1.3 | 1.2 / 0.5 | 0.9 / 1.4 | 0.2 | −0.5 | −0.1 | 0.7 | −0.5 |
| 4 | 1.4 / 2.3 | 2.3/ 2.3 | 2.9 / 1.1 | 1.1 / 0.7 | 1.0 / 1.3 | −0.9 | 0 | 1.8 | 0.4 | −0.3 |
| μ | 1.8 / 1.5 | 2.1/ 2.2 | 1.5 / 3.4 | 1.0 / 0.8 | 0.9 / 1.1 | 0.3 | −0.1 | −1.8 | 0.2 | −0.2 |
| σ | 1.0 / 0.6 | 0.3/ 0.6 | 1.0 / 4.5 | 0.3 / 0.7 | 0.1 / 0.3 | 1.0 | 0.4 | 4.7 | 0.7 | 0.3 |
| Input Neuron |
NHP-1 session12012, Channel Strengths for Output Neuron#2 |
|||||||||
|---|---|---|---|---|---|---|---|---|---|---|
| CMR/IMR Channel Strengths | Channel Strength Differences |
|||||||||
| Characteristic Band of PDMs | Characteristic Band of PDMs | |||||||||
| AP | α | β | γ/θ | δ | AP | α | β | γ/θ | δ | |
| 1 | 1.9 / 2.9 | 3.6 / 2.9 | 2.7 / 1.7 | 9.9 / 1.3 | 1.8 / 1.3 | −1.0 | 0.7 | 1.0 | 8.6 | 0.5 |
| 2 | 1.6 / 1.8 | 2.7 / 3.3 | 1.6 / 2.4 | 1.6 / 2.0 | 1.6 / 1.5 | −0.2 | −0.6 | −0.8 | −0.4 | −0.1 |
| 3 | 2.1 / 4.4 | 2.9 / 3.2 | 1.9 / 1.8 | 26.6/0.9 | 1.2 / 1.3 | −2.3 | −0.3 | 0.1 | 25.7 | −0.1 |
| 4 | 1.3 / 1.6 | 2.8 / 3.4 | 5.3 / 4.4 | 1.6 / 1.8 | 1.3 / 1.5 | −0.3 | −0.6 | 0.9 | −0.2 | −0.2 |
| μ | 1.7 / 2.7 | 3.0 / 3.2 | 2.9 / 2.6 | 9.9 / 1.5 | 1.5 / 1.4 | −1.0 | −0.2 | 0.3 | 8.4 | 0.0 |
| σ | 0.4 / 1.3 | 0.4 / 0.2 | 1.7 / 1.3 | 11.8/0.5 | 0.3 / 0.1 | 1.0 | 0.6 | 0.8 | 12.3 | 0.3 |
| Input Neuron |
NHP-1 session12012, Channel Strengths for Output Neuron #3 |
|||||||||
|---|---|---|---|---|---|---|---|---|---|---|
| CMR/IMR Channel Strengths | Channel Strength Differences |
|||||||||
| Characteristic Band of PDMs | Characteristic Band of PDMs | |||||||||
| AP | α | β | γ/θ | δ | AP | α | β | γ/θ | δ | |
| 1 | 1.1 / 0.6 | 2.4 / 2.4 | 1.9 / 2.7 | 1.4 / 1.2 | 1.3 / 1.0 | 0.5 | 0 | −0.8 | 0.2 | 0.3 |
| 2 | 1.6 / 0.9 | 2.9 / 2.0 | 7.2 / 0.8 | 1.6 / 0.5 | 1.4 / 1.1 | 0.7 | 0.9 | 6.4 | 1.1 | 0.3 |
| 3 | 1.6 / 1.8 | 2.4 / 2.3 | 1.9 / 1.9 | 1.2 / 1.4 | 1.1 / 1.0 | −0.2 | 0.1 | 0 | −0.2 | 0.1 |
| 4 | 2.1 / 1.8 | 2.2 / 2.1 | 2.6 / 2.1 | 1.0 / 1.5 | 1.0 / 1.2 | 0.3 | 0.1 | 0.5 | −0.5 | −0.2 |
| μ | 1.6 / 1.3 | 2.5 / 2.2 | 3.4 / 1.9 | 1.3 / 1.2 | 1.2 / 1.1 | 0.3 | 0.3 | 1.5 | 0.2 | 0.1 |
| σ | 0.4 / 0.6 | 0.3 / 0.2 | 2.6 / 0.8 | 0.3 / 0.5 | 0.2 / 0.1 | 0.4 | 0.4 | 3.3 | 0.7 | 0.2 |
| Input Neuron |
NHP-1 session12012, Channel Strengths for Output Neuron #4 |
|||||||||
|---|---|---|---|---|---|---|---|---|---|---|
| CMR/IMR Channel Strengths | Channel Strength Differences |
|||||||||
| Characteristic Band of PDMs | Characteristic Band of PDMs | |||||||||
| AP | α | β | γ/θ | δ | AP | α | β | γ/θ | δ | |
| 1 | 1.5 / 1.4 | 3.3 / 2.3 | 2.3 / 1.4 | 1.9 / 1.2 | 1.2 / 1.3 | 0.1 | 1.0 | 0.9 | 0.7 | −0.1 |
| 2 | 2.1 / 1.5 | 2.9 / 3.3 | 1.9 / 2.6 | 1.6 / 1.7 | 1.2 / 1.5 | 0.6 | −0.4 | −0.7 | −0.1 | −0.3 |
| 3 | 1.3 / 1.7 | 3.3 / 2.1 | 2.0 / 2.7 | 1.7 / 2.2 | 1.5 / 1.3 | −0.4 | 1.2 | −0.7 | −0.5 | 0.2 |
| 4 | 2.8 / 2.8 | 2.9 / 3.3 | 1.9 / 2.5 | 1.4 / 4.1 | 1.4 / 1.6 | 0 | −0.4 | −0.6 | −2.7 | −0.2 |
| μ | 1.9 / 1.9 | 3.1 / 2.8 | 2.0 / 2.3 | 1.7 / 2.3 | 1.3 / 1.4 | 0.1 | 0.4 | −0.3 | −0.7 | −0.1 |
| σ | 0.7 / 0.7 | 0.2 / 0.6 | 0.2 / 0.6 | 0.2 / 1.3 | 0.2 / 0.2 | 0.4 | 0.9 | 0.8 | 1.5 | 0.2 |
The question can be raised whether the mean firing rates (MFRs) of these input-output neurons are higher in the MR phase for correct outcomes. Table 3 shows the MFRs of all input-output neurons for the SP and MR phase of session 12012. It is evident that there is no significant difference in the MFR of any of these neurons between correct and incorrect outcomes. The 4th input neuron has about double MFR in both phases, but there is no difference between correct and incorrect outcomes, neither does this higher MFR affect the obtained CS values (the CS values for the 4th input appear comparable with the rest of the inputs, for all output neurons). This lends credence to the proposition that PDM analysis may reveal important functional characteristics of the neural system that are not evident by direct visual inspection of the neuronal activity (e.g. the observed relative MFR values).
Table 3.
Mean Firing Rates of 4 Layer-2 (input) and 4 Layer-5 (output) neurons in the SP phase (top) and MR phase (bottom) of session 12012 for correct and incorrect outcomes.
| Mean Firing Rates (spikes per second) during SP phase (NHP-1session12012) | |||||
|---|---|---|---|---|---|
| Layer-2 Neuron |
Correct | Incorrect | Layer-5 Neuron |
Correct | Incorrect |
| 1 | 3.74 | 3.85 | 1 | 2.19 | 2.30 |
| 2 | 3.22 | 3.48 | 2 | 3.56 | 3.38 |
| 3 | 3.51 | 3.45 | 3 | 2.87 | 2.72 |
| 4 | 7.45 | 7.37 | 4 | 3.61 | 3.58 |
| Mean Firing Rates (spikes per second) during MR phase (NHP-1session12012) | |||||
|---|---|---|---|---|---|
| Correct | Incorrect | Layer-5 Neuron |
Correct | Incorrect | |
| 1 | 3.87 | 3.93 | 1 | 2.12 | 2.24 |
| 2 | 3.07 | 3.53 | 2 | 3.43 | 3.55 |
| 3 | 3.31 | 3.54 | 3 | 2.75 | 2.61 |
| 4 | 7.00 | 7.48 | 4 | 3.49 | 3.78 |
When the PDM analysis was repeated for another experimental session of the same NHP (involving different placement of the electrodes), the key spectral characteristics of the obtained common PDMs remained rather similar, as illustrated in Figure 8 for Session 13112, in terms of the exhibited spectral peaks in the same frequency-bands of neural rhythmic activity. However, the resulting CS and CSD values were different for the various IPO channels, as indicated in Tables 4 and 5 for the SP phase and the MR phase respectively. Note that there are three output neurons of adequate recorded activity in this session. We see in Tables 4 and 5 that the CS values in this session are generally larger (the top 10 CSD absolute values for Session 13112 are >2, while for Session 12012 no CSD absolute value was >2) and the significant CSD values are found in different IPO channels for the same phase of the two sessions (note that the electrode placement is different in the two sessions). For example, the largest CSD values for output neuron #1 in the SP phase are now in the alpha-band channel (2nd PDM) of the 1st and 2nd input neurons and indicate reduced alpha-band activity for correct outcomes. The same is seen for output neuron #3, while significant increase in the alpha-band is seen for output neuron #2. Such significant changes of CS values in the alpha band were not seen in the previous session (12012) during the SP phase. Conversely, in the SP phase of session 12012, the largest CSD values are found in the other PDM bands (see Table 1). In the MR phase of session 13112, the largest CSD values are found in the gamma band for the connections between the 1st input and the 1st or 3rd output neuron (in addition to the AP 1st PDM for the 1st output). This is similar to the MR phase of session 12012 where the largest CSD values are also found in the gamma band for the connections between the 1st input and 1st or 3rd output, with the addition of the beta band for the 2nd output neuron (see Table 2). The implications of these results are further explored in the Discussion section.
Table 4.
Channel strengths of the 4×5×3 Input-PDM-Output channels in the SP phase of Session 13112 for trials with correct/incorrect (CSP/ISP) outcomes and their differences.
| Input Neuron |
NHP-1, Session13112, Channel Strengths for 
|
|||||||||
|---|---|---|---|---|---|---|---|---|---|---|
| CSP/ISP Channel Strengths (CS) | Channel Strength Differences (CSD) |
|||||||||
| Characteristic Band of PDMs | Characteristic Band of PDMs | |||||||||
| AP | α | β | γ/δ | δ/θ | AP | α | β | γ/δ | δ/θ | |
| 1 | 7.1 / 6.3 | 2.6 / 9.5 | 5.2 / 4.5 | 8.7 / 7.2 | 4.1 / 3.8 | 0.8 | −6.9 | 0.7 | 1.5 | 0.3 |
| 2 | 3.2 / 3.6 | 2.6 / 8.6 | 4.0 / 4.2 | 5.0 / 3.9 | 3.8 / 4.9 | −0.4 | −6.0 | −0.2 | 1.1 | −1.1 |
| 3 | 6.0 / 5.5 | 5.6 / 2.9 | 4.8 / 4.8 | 7.2 / 6.7 | 4.2 / 4.9 | 0.5 | 2.7 | 0 | 0.5 | −0.7 |
| 4 | 6.0 / 6.6 | 4.5 / 2.9 | 4.3 / 5.0 | 6.9 / 7.1 | 3.3 / 4.0 | −0.6 | 1.6 | −0.7 | −0.2 | −0.7 |
| μ | 5.6 / 5.5 | 3.8 / 6.0 | 4.6 / 4.6 | 7.0 / 7.1 | 3.9 / 4.4 | 0.1 | −2.2 | −0.1 | 0.7 | −0.6 |
| σ | 1.7 / 1.4 | 1.5 / 3.6 | 0.5 / 0.4 | 1.5 / 1.6 | 0.4 / 0.6 | 0.7 | 5.0 | 0.6 | 0.7 | 0.6 |
| Input Neuron |
NHP-1, Session13112, Channel Strengths for 
|
|||||||||
|---|---|---|---|---|---|---|---|---|---|---|
| CSP/ISP Channel Strengths (CS) | Channel Strength Differences (CSD) |
|||||||||
| Characteristic Band of PDMs | Characteristic Band of PDMs | |||||||||
| AP | α | β | γ/δ | δ/θ | AP | α | β | γ/δ | δ/θ | |
| 1 | 6.7 / 7.9 | 5.0 / 3.8 | 7.7 / 7.1 | 9.0/10.2 | 7.6 / 6.2 | −1.2 | −1.2 | 0.6 | −0.8 | 1.4 |
| 2 | 6.8 / 5.8 | 8.6 / 4.0 | 7.2 / 6.6 | 8.4 / 8.0 | 6.4 / 5.4 | 1.0 | 4.6 | 0.6 | 0.4 | 1.0 |
| 3 | 8.2 / 8.5 | 5.0 / 4.8 | 7.6 / 7.6 | 9.9/11.1 | 6.9 / 5.8 | −0.3 | 0.2 | 0 | −1.2 | 1.1 |
| 4 | 7.0 / 7.0 | 4.4 / 4.2 | 7.2 / 7.2 | 9.2 / 9.1 | 7.0 / 6.1 | 0 | 0.2 | 0 | 0.1 | 1.1 |
| μ | 7.2 / 7.3 | 5.8 / 4.2 | 7.4 / 7.1 | 9.1 / 9.6 | 7.0 / 5.9 | −0.1 | 1.0 | 0.3 | −0.4 | 1.2 |
| σ | 0.7 / 1.2 | 1.9 / 0.4 | 0.3 / 0.4 | 0.6 / 1.3 | 0.5 / 0.4 | 0.9 | 2.5 | 0.4 | 0.8 | 0.2 |
| Input Neuron |
NHP-1, Session13112,  , Channel Strengths for , Channel Strengths for 
|
|||||||||
|---|---|---|---|---|---|---|---|---|---|---|
| CSP/ISP Channel Strengths (CS) | Channel Strength Differences (CSD) |
|||||||||
| Characteristic Band of PDMs | Characteristic Band of PDMs | |||||||||
| AP | α | β | γ/δ | δ/θ | AP | α | β | γ/δ | δ/θ | |
| 1 | 12.6/11.0 | 5.3/11.7 | 9.0 / 8.3 | 14.8/13.7 | 8.2/5.9 | 1.6 | −6.4 | 0.7 | 1.1 | 2.3 |
| 2 | 6.4 / 5.7 | 5.2/11.1 | 7.7 / 7.1 | 8.5 / 6.5 | 7.0/7.6 | 0.7 | −5.9 | 0.6 | 2.0 | −0.6 |
| 3 | 8.4 / 6.9 | 4.9/11.6 | 8.1 / 7.4 | 10.6/8.1 | 6.6/ 7.0 | 1.5 | −6.7 | 0.7 | 2.5 | −0.4 |
| 4 | 8.2 / 8.4 | 6.7 / 8.5 | 7.9 / 7.3 | 9.9/10.1 | 7.1/ 6.3 | −0.2 | −1.8 | 0.6 | −0.2 | 0.8 |
| μ | 8.9 / 8.0 | 5.5/10.7 | 8.2 / 7.5 | 11.0/ 9.6 | 7.2/ 6.7 | 0.9 | −5.2 | 0.7 | 1.4 | 0.5 |
| σ | 2.6 / 2.3 | 0.8 / 1.5 | 0.6 / 0.5 | 2.7 / 3.1 | 0.7/ 0.8 | 0.8 | 2.3 | 0.1 | 1.2 | 1.3 |
Table 5.
Channel strengths of the 4×5×3 Input-PDM-Output channels in the MR phase of Session 13112 for trials with correct/incorrect (CMR/IMR) outcomes and their differences.
| Input Neuron |
NHP-1, Session13112,  , Channel Strengths for , Channel Strengths for
|
|||||||||
|---|---|---|---|---|---|---|---|---|---|---|
| CMR/IMR Channel Strengths (CS) | Channel Strength Differences (CSD) |
|||||||||
| Characteristic Band of PDMs | Characteristic Band of PDMs | |||||||||
| AP | α | β | γ/θ | δ | AP | α | β | γ/θ | δ | |
| 1 | 8.1 / 5.3 | 4.1 / 3.6 | 4.1 / 4.1 | 9.2 / 6.6 | 2.9/ 2.7 | 2.8 | 0.5 | 0 | 2.6 | 0.2 |
| 2 | 4.3 / 3.8 | 4.6 / 4.9 | 4.4 / 3.5 | 5.8 / 4.2 | 3.3/ 3.7 | 0.5 | −0.3 | 0.9 | 1.6 | −0.4 |
| 3 | 6.0 / 6.3 | 4.3 / 4.6 | 4.0 / 3.6 | 7.1 / 6.7 | 3.6/ 3.7 | −0.3 | −0.3 | 0.4 | 0.4 | −0.1 |
| 4 | 6.1 / 4.0 | 3.9 / 4.9 | 3.8 / 4.0 | 7.4 / 5.5 | 3.3/ 2.6 | 2.1 | −1.0 | −0.2 | 1.9 | 0.7 |
| μ | 6.1 / 4.9 | 4.2 / 4.5 | 4.1 / 3.8 | 7.4 / 5.8 | 3.3/ 3.2 | 1.3 | −0.3 | 0.3 | 1.6 | 0.1 |
| σ | 1.6 / 1.2 | 0.3 / 0.6 | 0.3 / 0.3 | 1.4 / 1.2 | 0.3/ 0.6 | 1.4 | 0.6 | 0.5 | 0.9 | 0.5 |
| Input Neuron |
NHP-1, Session13112, , Channel Strengths for
|
|||||||||
|---|---|---|---|---|---|---|---|---|---|---|
| CMR/IMR Channel Strengths (CS) | Channel Strength Differences (CSD) |
|||||||||
| Characteristic Band of PDMs | Characteristic Band of PDMs | |||||||||
| AP | α | β | γ/θ | δ | AP | α | β | γ/θ | δ | |
| 1 | 6.6 / 6.9 | 7.2 / 6.1 | 7.3 / 5.7 | 8.6 / 8.6 | 5.2/ 4.7 | −0.3 | 1.1 | 1.6 | 0 | 0.5 |
| 2 | 5.5 / 6.6 | 7.0 / 7.4 | 6.9 / 6.7 | 7.5 / 8.4 | 5.3/ 5.3 | −1.1 | −0.4 | 0.2 | −0.9 | 0 |
| 3 | 9.0 / 8.2 | 6.9 / 6.6 | 6.0 / 6.0 | 10.3/10.5 | 5.0/ 4.5 | 0.8 | 0.3 | 0 | −0.2 | 0.5 |
| 4 | 7.4 / 6.5 | 6.9 / 5.9 | 6.9 / 6.1 | 9.4 / 8.8 | 5.5/ 4.4 | 0.9 | 1.0 | 0.8 | 0.6 | 1.1 |
| μ | 7.1 / 7.1 | 7.0 / 6.5 | 6.8 / 6.1 | 9.0 / 9.1 | 5.3/ 4.7 | 0.1 | 0.5 | 0.7 | −0.1 | 0.5 |
| σ | 1.5 / 0.8 | 0.1 / 0.7 | 0.6 / 0.4 | 1.2 / 1.0 | 0.2/ 0.4 | 1.0 | 0.7 | 0.7 | 0.6 | 0.5 |
| Input Neuron |
NHP-1, Session13112, , Channel Strengths for
|
|||||||||
|---|---|---|---|---|---|---|---|---|---|---|
| CMR/IMR Channel Strengths (CS) | Channel Strength Differences (CSD) |
|||||||||
| Characteristic Band of PDMs | Characteristic Band of PDMs | |||||||||
| AP | α | β | γ/θ | δ | AP | α | β | γ/θ | δ | |
| 1 | 10.2 / 12.1 | 7.2 / 8.0 | 7.4 / 8.1 | 11.8/14.7 | 5.0/ 6.1 | −1.9 | −0.8 | −0.7 | −2.9 | −0.9 |
| 2 | 5.3 / 6.0 | 6.9 / 7.3 | 6.3 / 6.4 | 6.8 / 8.2 | 5.2/ 5.0 | −0.7 | −0.4 | −0.1 | −1.4 | 0.2 |
| 3 | 9.8 / 9.6 | 7.3 / 8.4 | 6.1 / 6.4 | 11.6/11.8 | 5.4/ 5.7 | 0.2 | −1.1 | −0.3 | −0.2 | −0.3 |
| 4 | 9.7 / 8.8 | 7.2 / 6.6 | 7.6 / 6.4 | 11.6/11.3 | 5.4/ 4.6 | 0.9 | 0.6 | 1.2 | 0.3 | 0.8 |
| μ | 8.8 / 9.1 | 7.2 / 7.6 | 6.9 / 6.8 | 10.5/11.5 | 5.3 /5.4 | −0.4 | −0.4 | 0.0 | −1.1 | −0.1 |
| σ | 2.3 / 2.5 | 0.2 / 0.8 | 0.8 / 0.9 | 2.4 / 2.7 | 0.2/ 0.7 | 1.2 | 0.7 | 0.8 | 1.4 | 0.7 |
Similar observations are made in the results of PDM analysis of data collected in the prefrontal cortex of different NHPs – viz. that the common PDMs are rather similar in spectral characteristics, but the derived significant CS and CSD values are found in various IPO channels (some common with previous sessions and some not). This finding is further discussed in the following section.
4 Discussion
This paper presents illustrative results of PDM-based modeling and analysis of the neuronal connections between Layer-2 neurons (viewed as input) and Layer-5 neurons (viewed as output) in the prefrontal cortex (PFC) of NHPs performing a Delayed-Match-to-Sample (DMS) task. The advocated modeling/analysis approach utilizes a set of "common" PDMs that constitute an efficient functional basis for the representation of the input-output dynamic relationships between all neurons of this MIMO model during the respective phase of the DMS task for both correct and incorrect outcomes. Each PDM may generally incorporate several biological mechanisms that must be delineated through subsequent scientific analysis (experimental and computational). These biological mechanisms pertain to the integrated neuronal dynamics of the transfer of information from Layer-2 to Layer-5 neurons of the NHP-PFC during the DMS task.
The main aim of the paper is to demonstrate how this approach can be used for methodical and rigorous parsing of the neural code used for the transfer of information between these two layers of the NHP PFC during the DMS task. This aim is pursued through estimation of PDM-based MIMO models and the resulting decomposition of the functional characteristics of this system in terms of dynamic modules defined by the PDMs and corresponding to frequency bands of widely studied neural rhythms – viz. the α, β, γ, δ, θ bands [Marmarelis et al. 2013]. This decomposition allows the parsing of the dynamics of the neuronal connections in terms of Input-PDM-Output (IPO) channels of information flow that are weighted by scalar parameters of "channel strengths" (CS) on the basis of the experimental data. This data-based analysis yields novel insight into which neuronal connections are more significant within each band of neural activity. Since the well-known α, β, γ, δ, θ bands have been associated in numerous previous studies with specific functional characteristics and cognitive processes, we view this model decomposition as being tantamount to a rigorous and quantitative "parsing of the neural code" utilized by the subject system. It should be emphasized that this PDM-based model decomposition concerns the dynamic connections between neurons and not their individual spike-train activity. Of course, the spectral characteristics of the spiketrain activity of the output neurons are influenced by the PDM characteristics in that the significant bands among the PDMs (i.e. those with large CS values) will selectively enhance the spectral content of the output in the respective frequencies.
The present study further compares the neuronal connectivity characteristics between trials with correct and incorrect outcomes, as captured by the computed neuron-to-neuron CS values using the PDM-based MIMO models. The analysis of the data is focused on the two key phases of the DMS task: the Sample Presentation (SP) phase and the Match Response (MR) phase. The analysis yields estimates of the "common" PDMs for each phase – i.e. the PDMs which are valid for all trials with correct or incorrect outcome during the respective phase – and measures of "connection strengths" (in the form of the computed CS values) between all combinations of input-output connections via each PDM (i.e. the IPO channels of neuronal connectivity). The IPO channels represent the key entity for parsing the neural code, since they characterize each input-output connection with regard to the functional characteristics of the respective PDM. Fundamental for this purpose is the key empirical finding that the data-extracted PDMs exhibit spectral peaks (resonances) that correspond to the well-known frequency bands of neural rhythms (i.e. α, β, γ, δ, θ) in a consistent manner across different task phases and experimental sessions [Marmarelis et al. 2013]. In addition to these bands, the 1st PDM was found to have consistently an "all-pass" (AP) relay-transfer characteristic. The CS values of the various IPO channels were generally different for different task phases or experimental sessions, suggesting variability and task-dependence in these cortical connections.
Since neural rhythms have been considered by many to play a key role in cortical synchronization via phase-locked rhythmic activity across distant brain regions (e.g. Singer 1993, 1999; Fries 2005; Canolty et al. 2010), we offer the PDM-based MIMO modeling as a practical and rigorous means of quantitative analysis that ties neural rhythms with the temporal coding hypothesis in neural information processing. In this conceptual and scientific context, the proposed PDM-based approach allows the "parsing of the neural code" via decomposition of the dynamics of neuronal interactions in terms of common dynamic modules (i.e. the data-extracted common PDMs in Figures 7, 9 and 10) that correspond to the celebrated (α, β, γ, δ, θ) bands of neural rhythms. The latter are generally viewed as being associated with coordination of the timing of neuronal firing and formation of "cell assemblies" in connection with specific cognitive functions (e.g. sensorimotor integration, working memory, memory formation, attention, anticipation, executive function and perception).
Fig. 10.

The obtained five common PDMs in the frequency-domain for the prefrontal cortex of NHP-1 during the SP phase (top) and MR phase (bottom) of the DMS trials in session 13112 that are valid for both correct and incorrect outcomes. The form of these PDMs is similar to the ones shown in Figures 7 and 9, exhibiting characteristic resonant peaks in the frequency-bands of neural rhythmic activity (α, β, γ, δ, θ) in addition to the relay-mode (AP) of the 1st PDM.
Specifically, the obtained sets of common PDMs (see Figures 7, 9 and 10) have a 1st PDM with an "all-pass" (AP) spectral characteristic, akin to relay-transfer. The 2nd PDM exhibits a spectral peak in the alpha-band (10–15 Hz) that has been associated in previous EEG studies of the PFC with internalized attention (Klimesch et al. 1998; Aftanas & Golocheikine, 2001; Jensen et al. 2002) and processing of internal mental content (Stein & Sarnthein 2000). The 3rd PDM exhibits a spectral peak in the beta-band (15–30 Hz) that has been associated in previous studies of the PFC in NHPs, using EEGs and local field potentials (LFPs), with sensorimotor integration (Murthy and Fetz, 1992, 1996; Sanes and Donoghue, 1993; Courtemanche et al. 2003) and preparation for motor action (Baker et al. 1999; Donoghue et al. 1998; Zhang et al. 2008). The 4th PDM exhibits a spectral peak in the low end of the gamma-band (30–80 Hz) associated in previous studies with various cognitive tasks, including sensory information processing and working memory (Singer 1993, 1999; Fries 2005; Fries et al. 2007; Rizzuto et al. 2003; Jensen et al. 2007) as well as motor tasks (Sanes & Donoghue 1993; Fetz et al. 2000; Lebedev & Nelson 1995). Somatic inhibition via GABAA receptors and activation of interneurons by AMPA receptors are essential for the generation of gamma rhythms. The 5th PDM has high values in the delta-band (<4 Hz) and has been associated in previous studies with short-term plasticity (Kiss et al. 2011), anticipation of reaction (Gabor et al. 2010), neuropsycological performance (Anderson & Horn 2003) and deep sleep (Brandenberger 2003; Hobson and Pace-Schott 2002). The important theta-band (5–9 Hz) is combined within the same PDM either with the gamma-band (MR phase) or with the deltaband (SP phase) and has been associated in previous studies with memory formation, consolidation and retrieval (Buzsaki 2002, 2005; Eckstrom et al. 2005; Fox et al. 1986; Jacobs et al. 2006, 2007; Jones & Wilson 2005; Kahana 2006) and the delineation of the memory-encoding from the memory-retrieval process (Hasselmo et al. 2002; Vertes 2005).
In particular with regard to oscillations in the NHP PFC, the work of Benchenane et al. (2011) is relevant to our findings, because it concludes that the PFC is probably involved with "multiple functional networks" connecting it with the visual cortex for attention guidance (utilizing mostly gamma and beta oscillations) and with the hippocampus for memory storage and consolidation (utilizing mostly theta oscillations). This functional organization is viewed as a form of "frequency multiplexing" that allows the PFC to perform simultaneously multiple distinct functions, as suggested by Friedriech et al. (2004) for the insect olfactory system. Similar conclusions were reached in a recent study of short-term memory encoding of multiple visual objects, where the important role of gamma (~32 Hz) and delta (~3 Hz) oscillations was identified in the NHP PFC (Siegel et al. 2009). This confirmed the results of a previous study that pointed out the dynamic modulation and phase encoding of PFC neurons in interplay with the hippocampus over the theta band during learning and memory of task-dependent behavior (Hyman et al. 2005).
There are two sets of functional components in the PDM-based MIMO models: the PDMs, which constitute a common functional basis for the representation of the dynamics of all input-output connections, and the Associated Nonlinear Functions (ANFs), which represent in this context the conditional probabilities of having a spike at the output neuron when the respective PDM output has a given non-zero value. In the context of neuronal ensembles, the sum of the (positive) values of each ANF is more relevant because it quantifies the observed strength of the respective IPO channel. This sum of ANF values is the "channel strength" (CS) of the respective IPO channel defined as the cascaded signal flow from the spike-train activity of an input neuron through a PDM filter (convolution) to the transformation by the respective ANF (multiplication by the respective CS in this case) to the output neuron. Thus these two sets of functional components of the PDM-based MIMO models appear in cascaded PDM-ANF/CS pairs that determine the functional characteristics of each IPO channel. The PDM defines the dynamic characteristics (e.g. the frequency band of high gain) and the ANF/CS defines the input-output connection strength for that PDM.
The physiological interpretation of the PDMs can elucidate the functional characteristics of the neuronal connections and advance our understanding of the function of a neural system. Thus, the PDMs can be a useful tool for understanding neural function using experimental data, because they allow the decomposition of neuronal interconnections in well-known bands of neural activity (α, β, γ, δ, θ). We term this process the "parsing of the neural code" and suggest that it may offer a valuable analysis tool in our efforts to understand and quantify the dynamic interactions between neuronal ensembles. For instance, it is shown in Table 2 that the flow of information from Layer-2 neurons (inputs) to Layer-5 neurons (outputs) during the MR phase that exert maximum influence on the likelihood of a correct (versus an incorrect) outcome is conducted over the γ/θ band between the 3rd input neuron and the 2nd output neuron (CSD=25.7). Second in such influence is the IPO over the γ/θ band between the 1st input neuron and the 2nd output neuron (CSD=8.6). The strongly elevated γ/θ connectivity for the correct-outcome trials suggests the importance of coordination of PFC activity with the visual cortex and working memory (γ band), as well as with the hippocampus for memory consolidation and retrieval (θ band). Some significant connectivity is also observed over the β band between the 1st input neuron and the 1st output neuron (CSD=-8.8), as well as between the 2nd input neuron and the 3rd output neuron (CSD=6.4). This reflects the importance of sensorimotor integration and preparation for action during the correct-outcome trials. The fact that the latter two CSD values have opposite signs points out the complexity in the "neuronal wiring" of the PFC, potentially involving antagonistic mechanisms. This expected complexity in the PFC connectivity is further manifested in the different CS and CSD values obtained for different experimental sessions (having different electrode placements).
We note that a specific spectral peak of a PDM implies that a periodic input spike-train with similar frequency will be transferred more efficiently to the respective output through this IPO channel. This effect will be strengthened when it is cascaded through various neuronal layers with similar IPO channels. It is interesting to note that the spectral characteristics of the activity of Layer-2 neurons are broadband, while the spectral characteristics of the activity of Layer-5 neurons exhibit peaks associated with the bands that have some significant CS values. The significant CS values define the “functional connectivity” in this part of the PFC for the respective behavioral tasks. They also ascribe specific functional characteristics to these neural connections by virtue of the properties of the associated PDMs, thus enabling the novel representation of neural information (neural encoding). This process allows the functional “decomposition” of the PFC connectivity between Layer-2 and Layer-5 that represents a novel neural coding scheme, akin to parsing of the neural code.
5 Conclusions
This paper elaborates on the functional meaning of a recently proposed approach to modeling and analyzing the dynamic interactions between neuronal ensembles (Marmarelis et al. 2013) that employs the concept of Principal Dynamic Modes (PDMs). This approach is generally applicable to (almost) all physiological systems and yields Volterra-equivalent canonical models that have predictive capability for arbitrary input patterns, while retaining representational efficiency (i.e. model compactness). The employed PDMs and their associated nonlinear functions (ANFs) are obtained from spike-train data in a multi-input/multi-output (MIMO) dynamic and nonlinear context that is suitable for modeling the interactions of neuronal ensembles. In addition, the PDMs are interpretable in terms of functional characteristics of the modeled neuronal interconnections and the underlying biological mechanisms. It was found that the PDMs in the NHP PFC correspond to specific bands of neural oscillations (rhythms), associated in numerous previous studies with specific cognitive processes. The obtained ANF for each Input-PDM-Output (IPO) channel of information flow quantifies the connection strength between any pair of input-output neurons over the neural communication band (α, β, γ, δ, θ) of the respective PDM. In this study, the ANFs are condensed to scalar measures of "channel strengths" (CS) by mere summation of the (positive) ANF values for each IPO channel. The significant CS values define the functional organization of the subject system and offer a method of dynamic system decomposition in terms of input-output neuronal connections with specific functional characteristics (determined by the respective PDM). This is offered as a general method for "parsing the neural code".
The initial application of this methodology to data collected from PFC neurons of Layer 2 (inputs) and Layer 5 (outputs) in two NHPs performing a Delayed-Match-to-Sample (DMS) task yielded results that allow quantitative comparison of the neuronal connectivity between trials with correct and incorrect outcome. The important role of the gamma, theta and beta bands was evident in the results during the match-response phase of the DMS task, consistent with previously published work (see Discussion). In the sample-presentation phase of the DMS task, the important role of the gamma, theta and beta bands was still evident, along with the alpha band, but the computed CS values and their differences between correct and incorrect outcomes were much smaller.
These results corroborate the feasibility of performing this type of analysis in a practical context that reveals novel insights into the functional organization of neural systems. It is hoped that this approach may offer an efficient way to parse the neural coding in terms of band-specific and connection-specific information intrinsic to the neuronal connectivity of various brain regions.
Acknowledgements
This work was supported by NIH-NIBIB grant P41-EB001978 to the Biomedical Simulations Resource at USC, the DARPA contracts N66601-09-C-2080 and N66601-09-C-2081, and NSF grant EEC-0310723.
Contributor Information
V. Z. Marmarelis, Department of Biomedical Engineering and the Biomedical Simulations Resource (BMSR) at the University of Southern California, Los Angeles, CA 90089, USA marmarelis@hotmail.com; Tel: (213) 740-0841; Fax: (213) 740-0343)
D. C. Shin, Department of Biomedical Engineering and the Biomedical Simulations Resource (BMSR) at the University of Southern California, Los Angeles, CA 90089, USA
D. Song, Department of Biomedical Engineering, Program in Neuroscience, Center for Neural Engineering, University of Southern California, Los Angeles, CA 90089, USA
R. E. Hampson, Department of Physiology and Pharmacology, Wake Forest University Health Sciences, Winston–Salem, NC 27157, USA
S. A. Deadwyler, Department of Physiology and Pharmacology, Wake Forest University Health Sciences, Winston–Salem, NC 27157, USA
T. W. Berger, Department of Biomedical Engineering, Program in Neuroscience, Center for Neural Engineering, University of Southern California, Los Angeles, CA 90089, USA
References
- Abbott LF. Lapique's introduction of the integrate-and-fire model neuron. Brain Research Bulletin. 1999;50:303–304. doi: 10.1016/s0361-9230(99)00161-6. [DOI] [PubMed] [Google Scholar]
- Aftanas LI, Golocheikine SA. Human anterior and frontal midline theta and lower alpha reflect emotionally positive state and internalized attention: high-resolution EEG investigation of meditation. Neuroscience Letters. 2001;310:57–60. doi: 10.1016/s0304-3940(01)02094-8. [DOI] [PubMed] [Google Scholar]
- Anderson C, Horne JA. Prefrontal cortex: links between low frequency delta EEG in sleep and neuropsychological performance in healthy, older people. Psychophysiol. 2003;40:349–357. doi: 10.1111/1469-8986.00038. [DOI] [PubMed] [Google Scholar]
- Anderson CH, Eliasmith C. Neural Engineering: Computation, Representation, and Dynamics in Neurobiological Systems (Computational Neuroscience) MIT Press; 2004. [Google Scholar]
- Baker SN, Kilner JM, Pinches EM, Lemon RN. The role of synchrony and oscillations in the motor output. Exp. Brain Res. 1999;128:109–117. doi: 10.1007/s002210050825. [DOI] [PubMed] [Google Scholar]
- Benchenane K, Tiesinga PH, Battaglia FP. Oscillations in the prefrontal cortex: a gateway to memory and attention. Current Opinion in Neurobiology. 2011;21:1–11. doi: 10.1016/j.conb.2011.01.004. [DOI] [PubMed] [Google Scholar]
- Berger TW, Eriksson JL, Ciarolla DA, Sclabassi RJ. Nonlinear systems analysis of the hippocampal perforant path-dentate system. II. Effects of random train stimulation. J. Neurophysiol. 1988;60:1077–1094. doi: 10.1152/jn.1988.60.3.1077. [DOI] [PubMed] [Google Scholar]
- Berger TW, Song D, Chan RH, Marmarelis VZ. The neurobiological basis of cognition: identification by multi-input, multi-output nonlinear dynamic modeling. Proceedings of IEEE. 2010;98:356–374. doi: 10.1109/JPROC.2009.2038804. [DOI] [PMC free article] [PubMed] [Google Scholar]
- Berger TW, Hampson RE, Song D, Goonawardena A, Marmarelis VZ, Deadwyler SA. A cortical neural prosthesis for restoring and enhancing memory. Journal of Neural Engineering. 2011;8:046017. doi: 10.1088/1741-2560/8/4/046017. [DOI] [PMC free article] [PubMed] [Google Scholar]
- Berger TW, Song D, Chan RHM, Marmarelis VZ, Hampson RE, Deadwyler SA, LaCoss J, Wills J, Granacki JJ. A hippocampal cognitive prosthesis: Multi-Input, Multi-Output nonlinear modeling and VLSI implementation. IEEE Trans. Neural Systems & Rehab. Eng. 2012;20(2):198–211. doi: 10.1109/TNSRE.2012.2189133. [DOI] [PMC free article] [PubMed] [Google Scholar]
- Brandenberger G. The Ulradien Rhythm of Sleep: Diverse Relations with Pituitary and Adrenal Hormones. Revue Neurologique. 2003;159(11):S5–S10. [PubMed] [Google Scholar]
- Buzsaki G. Theta oscillations in the hippocampus. Neuron. 2002;33:325–340. doi: 10.1016/s0896-6273(02)00586-x. [DOI] [PubMed] [Google Scholar]
- Buzsaki G. Theta rhythm of navigation: link between path integration and landmark navigation, episodic and semantic memory. Hippocampus. 2005;15:827–840. doi: 10.1002/hipo.20113. [DOI] [PubMed] [Google Scholar]
- Canolty RT, Ganguly K, Kennerley SW, Cadieu CF, Koepsell K, Wallis JD, Carmena JM. Oscillatory phase coupling coordinates anatomically dispersed functional cell assemblies. Proc Natl Acad Sci USA. 2010;107:17356–17361. doi: 10.1073/pnas.1008306107. [DOI] [PMC free article] [PubMed] [Google Scholar]
- Churchland PS, Sejnowski TJ. The Computational Brain. MIT Press; 1999. [Google Scholar]
- Courtemanche R, Fujii N, Graybiel AM. Synchronous, focally modulated beta-band oscillations characterize Local Field Potential activity in the striatum of awake behaving monkeys. J. Neuroscience. 2003;23:11741–11752. doi: 10.1523/JNEUROSCI.23-37-11741.2003. [DOI] [PMC free article] [PubMed] [Google Scholar]
- Deadwyler SA, Hampson RE. Differential but complementary mnemonic functions of the hippocampus and subiculum. Neuron. 2004;42:465–476. doi: 10.1016/s0896-6273(04)00195-3. [DOI] [PubMed] [Google Scholar]
- Dobson AJ. An Introduction to Generalized Linear Models. CRC Press; 2002. [Google Scholar]
- Donoghue JP, Sanes JN, Hatsopoulos NG, Gaal G. Neural discharge and local field potential oscillations in primate motor cortex during voluntary movements. J. Neurophysiol. 1998;79:159–173. doi: 10.1152/jn.1998.79.1.159. [DOI] [PubMed] [Google Scholar]
- Eeckman FH. Neural Systems: Analysis and Modeling. 1992. [Google Scholar]
- Eikenberry SE, Marmarelis VZ. A nonlinear auto-regressive Volterra model of the Hodgkin-Huxley equations. J Comp Neuroscience. 2013;34(1):163–173. doi: 10.1007/s10827-012-0412-x. PMID: 22878687. [DOI] [PubMed] [Google Scholar]
- Ekstrom AD, Caplan J, Ho E, Shattuck K, Fried I, Kahana M. Human hippocampal theta activity during virtual navigation. Hippocampus. 2005;15:881–889. doi: 10.1002/hipo.20109. [DOI] [PubMed] [Google Scholar]
- Fetz EE, Chen D, Murthy VN, Matsumura M. Synaptic interactions mediating synchrony and oscillations in primate sensorimotor cortex. J. Physiol Paris. 2000;94:323–331. doi: 10.1016/s0928-4257(00)01089-5. [DOI] [PubMed] [Google Scholar]
- FitzHugh R. Mathematical models of threshold phenomena in the nerve membrane. Bull. Math. Biophysics. 1955;17:257–278. [Google Scholar]
- Fox SE, Wolfson S, Ranck JBJ. Hippocampal theta rhythm and the firing of neurons in walking and urethane anesthetized rats. Exp. Brain Res. 1986;62:495–508. doi: 10.1007/BF00236028. [DOI] [PubMed] [Google Scholar]
- Friedrich RW, Habermann CJ, Laurent G. Multiplexingusing synchrony in the zebra fish olfactory bulb. Nature Neurosci. 2004;7:862–871. doi: 10.1038/nn1292. [DOI] [PubMed] [Google Scholar]
- Fries P. A mechanism for cognitive dynamics: neuronal communication through neuronal coherence. Trends Cogn. Sci. 2005;9:474–480. doi: 10.1016/j.tics.2005.08.011. [DOI] [PubMed] [Google Scholar]
- Fries P, Nikolic D, Singer W. The gamma cycle. Trends Neurosci. 2007;30:309–316. doi: 10.1016/j.tins.2007.05.005. [DOI] [PubMed] [Google Scholar]
- Gabor S, Hangya B, I Hernadi I, Winkler P, Lakatos, Ulbert I. Phase entrainment of human delta oscillations can mediate the effects of expectation on reaction speed. J. Neuroscience. 2010;30:13578–13585. doi: 10.1523/JNEUROSCI.0703-10.2010. [DOI] [PMC free article] [PubMed] [Google Scholar]
- Hampson RE, Song D, Chan RHM, Sweatt AJ, Fuqua J, Gerhardt GA, Shin D, Marmarelis VZ, Berger TW, Deadwyler SA. A nonlinear model for hippocampal cognitive prosthesis: Memory facilitation by hippocampal ensemble stimulation. IEEE Trans. Neural Systems & Rehab. Eng. 2012a;20(2):184–197. doi: 10.1109/TNSRE.2012.2189163. PMID: 22438334. [DOI] [PMC free article] [PubMed] [Google Scholar]
- Hampson RE, Song D, Chan RHM, Sweatt AJ, Riley MR, Goonawardena AV, Marmarelis VZ, Gerhardt GA, Berger TW, Deadwyler SA. Closing the loop for memory prostheses: Detecting the role of hippocampal neural ensembles using nonlinear models. IEEE Trans. Neural Systems & Rehab. Engineering. 2012b;20(4):510–525. doi: 10.1109/TNSRE.2012.2190942. PMID: 22498704. [DOI] [PMC free article] [PubMed] [Google Scholar]
- Hampson RE, Gerhardt GA, Marmarelis VZ, Song D, Opris I, Santos L, Berger TW, Deadwyler SA. Facilitation and restoration of cognitive function in primate prefrontal cortex by a neuroprosthesis that utilizes minicolumn-specific neural firing. J Neural Eng. 2012c;9(5):056012. doi: 10.1088/1741-2560/9/5/056012. [DOI] [PMC free article] [PubMed] [Google Scholar]
- Hasselmo ME, Bodelon C, Wyble BP. A proposed function for hippocampal theta rhythm: separate phases of encoding and retrieval enhance reversal of prior learning. Neural Comput. 2002;14:793–817. doi: 10.1162/089976602317318965. [DOI] [PubMed] [Google Scholar]
- Hertz J, Krogh A, Palmer RG. Introduction to the theory of neural computation. Addison-Wesley; 1991. [Google Scholar]
- Hille B. Ionic Channels of Excitable Membranes. 3rd ed. Sinauer Associates; 2001. [Google Scholar]
- Hindmarsh JL, Rose RM. A model of neuronal bursting using three coupled first order differential equations. Proc. R. Soc. London, Ser. B. 1984;221:87–102. doi: 10.1098/rspb.1984.0024. [DOI] [PubMed] [Google Scholar]
- Hobson J, Pace-Schott E. The cognitive neuroscience of sleep: Neuronal systems, con sciousness and learning. Nature Reviews Neuroscience. 2002;3:679–693. doi: 10.1038/nrn915. [DOI] [PubMed] [Google Scholar]
- Hodgkin A, Huxley A. A quantitative description of membrane current and its application to conduction and excitation in nerve. J. Physiol. 1952;117:500–544. doi: 10.1113/jphysiol.1952.sp004764. [DOI] [PMC free article] [PubMed] [Google Scholar]
- Hopfield JJ. Neural networks and physical systems with emergent collective computational abilities. Proc. National Academy of Sciences USA. 1882;79(8):2554–2558. doi: 10.1073/pnas.79.8.2554. [DOI] [PMC free article] [PubMed] [Google Scholar]
- Hyman J, Zilli E, Paley A, Hasselmo M. Medial prefrontal cortex cells show dynamic modulation with the hippocampal theta rhythm dependent on behavior. Hippocampus. 2005;15:739–749. doi: 10.1002/hipo.20106. [DOI] [PubMed] [Google Scholar]
- Izhikevich EM. Dynamical systems in neuroscience: Geometry of excitability and bursting. MIT Press; 2007. [Google Scholar]
- Izhikevich EM, Edelman GM. Large-scale model of mammalian thalamocortical systems. Proc. Nat. Acad. Sci. 2008;105:3593–3598. doi: 10.1073/pnas.0712231105. [DOI] [PMC free article] [PubMed] [Google Scholar]
- Jacobs J, Hwang G, Curran T, Kahana MJ. EEG oscillations and recognition memory: theta correlates of memory retrieval and decision making. NeuroImage. 2006;15:978–987. doi: 10.1016/j.neuroimage.2006.02.018. [DOI] [PubMed] [Google Scholar]
- Jacobs J, Kahana MJ, Ekstrom AD, Fried I. Brain oscillations control timing of single-neuron activity in humans. J. Neurosci. 2007;27:3839–3844. doi: 10.1523/JNEUROSCI.4636-06.2007. [DOI] [PMC free article] [PubMed] [Google Scholar]
- Jensen O, et al. Oscillations in the alpha band increase with memory load during retention in a short-term memory task. Cerebral Cortex. 2002;12:877–882. doi: 10.1093/cercor/12.8.877. [DOI] [PubMed] [Google Scholar]
- Jensen O, Kaiser J, Lachaux JP. Human gamma-frequency oscillations associated with attention and memory. Trends Neurosci. 2007;30:317–324. doi: 10.1016/j.tins.2007.05.001. [DOI] [PubMed] [Google Scholar]
- Jones MW, Wilson MA. Theta rhythms coordinate hippocampal-prefrontal interactions in a spatial memory task. PLoS Biol. 2005;3:e402. doi: 10.1371/journal.pbio.0030402. [DOI] [PMC free article] [PubMed] [Google Scholar]
- Kahana MJ. The cognitive correlates of human brain oscillations. J. Neurosci. 2006;26:1669–1672. doi: 10.1523/JNEUROSCI.3737-05c.2006. [DOI] [PMC free article] [PubMed] [Google Scholar]
- Kiss T, Hoffmann WE, Hajós M. Delta oscillation and short-term plasticity in the rat medial prefrontal cortex: modelling NMDA hypofunction of schizophrenia. Int. J. Neuropsychophar. 2011;14:29–42. doi: 10.1017/S1461145710000271. [DOI] [PubMed] [Google Scholar]
- Klimesch W, et al. Induced alpha-band power changes in the human EEG and attention. Neuroscience Letters. 1998;244:73–76. doi: 10.1016/s0304-3940(98)00122-0. [DOI] [PubMed] [Google Scholar]
- Koch C, Segev I. Methods in neuronal modeling: From synapses to networks. MIT Press; 1989. [Google Scholar]
- Lebedev MA, Nelson RJ. Rhythmically firing (20–50 Hz) neurons in monkey primary somatosensory cortex: activity patterns during initiation of vibratory-cued hand movements. J. Comp. Neurosci. 1995;2:313–334. doi: 10.1007/BF00961443. [DOI] [PubMed] [Google Scholar]
- Marmarelis PZ, Marmarelis VZ. Analysis of physiological systems: The white-noise approach. Plenum Press; 1978. [Google Scholar]
- Marmarelis VZ, Orme ME. Modeling of neural systems by use of neuronal modes. IEEE Transactions in Biomedical Engineering. 1993;40:1149–1158. doi: 10.1109/10.245633. [DOI] [PubMed] [Google Scholar]
- Marmarelis VZ. Identification of nonlinear biological systems using Laguerre expansions of kernels. Ann. Biomed. Eng. 1993;21:573. doi: 10.1007/BF02368639. [DOI] [PubMed] [Google Scholar]
- Marmarelis VZ. Modeling methodology for nonlinear physiological systems. Ann. Biomed. Eng. 1997;25:239. doi: 10.1007/BF02648038. [DOI] [PubMed] [Google Scholar]
- Marmarelis VZ. Nonlinear dynamic modeling of physiological systems. Wiley Interscience & IEEE Press; 2004. [Google Scholar]
- Marmarelis VZ, Berger TW. General methodology for nonlinear modeling of neural systems with Poisson point-process inputs. Math Biosciences. 2005;196:1–13. doi: 10.1016/j.mbs.2005.04.002. [DOI] [PubMed] [Google Scholar]
- Marmarelis VZ, Zanos TP, Berger TW. Boolean modeling of neural systems with point-process inputs and outputs. Part I: Theory and simulations. Annals Biomed. Eng. 2009;37:1654–1667. doi: 10.1007/s10439-009-9736-8. [DOI] [PMC free article] [PubMed] [Google Scholar]
- Marmarelis VZ, Shin DC, Song D, Hampson RE, Deadwyler SA, Berger TW. Design of optimal stimulation patterns for neuronal ensembles based on Volterra-type hierarchical modeling. Journal of Neural Engineering. 2012;9(6):066003. doi: 10.1088/1741-2560/9/6/066003. PMID: 23075519. [DOI] [PMC free article] [PubMed] [Google Scholar]
- Marmarelis VZ, Shin DC, Song D, Hampson RE, Deadwyler SA, Berger TW. Nonlinear modeling of dynamic interactions within neuronal ensembles using Principal Dynamic Modes. J Comp Neuroscience. 2013;34(1):73–87. doi: 10.1007/s10827-012-0407-7. PMID: 23011343. [DOI] [PMC free article] [PubMed] [Google Scholar]
- Murthy VN, Fetz EE. Coherent 25- to 35-Hz oscillations in the sensorimotor cortex of awake behaving monkeys. Proc. Natl. Acad. Sci. USA. 1992;89:5670–5674. doi: 10.1073/pnas.89.12.5670. [DOI] [PMC free article] [PubMed] [Google Scholar]
- Murthy VN, Fetz EE. Oscillatory activity in sensorimotor cortex of awake monkeys: synchronization of local field potentials and relation to behavior. J. Neurophysiol. 1996;76:3949–3982. doi: 10.1152/jn.1996.76.6.3949. [DOI] [PubMed] [Google Scholar]
- Opris I, Hampson RE, Stanford TR, Gerhardt GA, Deadwyler SA. Neural activity in frontal cortical cell layers: evidence for columnar sensorimotor processing. J. Cogn Neurosci. 2011;23:1507–1521. doi: 10.1162/jocn.2010.21534. [DOI] [PMC free article] [PubMed] [Google Scholar]
- Rizzuto DS, Madsen JR, Bromfield EB, Schulze-Bonhage A, Seelig D, Aschenbrenner-Scheibe R, Kahana MJ. Reset of human neocortical oscillations during a working memory task. Proc. Natl. Acad. Sci. USA. 2003;100:7931–7936. doi: 10.1073/pnas.0732061100. [DOI] [PMC free article] [PubMed] [Google Scholar]
- Rosenblatt F. Principles of neurodynamics. Spartan Books; 1962. [Google Scholar]
- Sanes JN, Donoghue JP. Oscillations in local field potentials of the primate motor cortex during voluntary movement. Proc. Natl. Acad. Sci. USA. 1993;90:4470–4474. doi: 10.1073/pnas.90.10.4470. [DOI] [PMC free article] [PubMed] [Google Scholar]
- Siegel M, Warden MR, Miller EK. Phase-dependent neuronal coding of objects in short-term memory. Proc Nat Academy of Sciences USA. 2009;106:21341–21346. doi: 10.1073/pnas.0908193106. [DOI] [PMC free article] [PubMed] [Google Scholar]
- Singer W. Synchronization of cortical activity and its putative role in information processing and learning. Annu. Rev. Physiol. 1993;55:349–374. doi: 10.1146/annurev.ph.55.030193.002025. [DOI] [PubMed] [Google Scholar]
- Singer W. Neuronal synchrony: a versatile code for the definition of relations? Neuron. 1999;24:49–65. 111–125. doi: 10.1016/s0896-6273(00)80821-1. [DOI] [PubMed] [Google Scholar]
- Song D, Chan RH, Marmarelis VZ, Hampson RE, Deadwyler SA, Berger TW. Nonlinear dynamic modeling of spike train transformations for hippocampal-cortical prostheses. IEEE Trans. Biomed. Eng. 2007;54:1053–1066. doi: 10.1109/TBME.2007.891948. [DOI] [PubMed] [Google Scholar]
- Song D, Chan RHM, Marmarelis VZ, Hampson RE, Deadwyler SA, Berger TW. Nonlinear modeling of neural population dynamics for hippocampal prostheses. Neural Networks. 2009;22:1340–1351. doi: 10.1016/j.neunet.2009.05.004. [DOI] [PMC free article] [PubMed] [Google Scholar]
- Stein von A, Sarnthein J. Different frequencies for different scales of cortical integration: from local gamma to long range alpha/theta synchronization. Intern. J. Psychophysiology. 2000;38:301–313. doi: 10.1016/s0167-8760(00)00172-0. [DOI] [PubMed] [Google Scholar]
- Vertes RP. Hippocampal theta rhythm: a tag for short term memory. Hippocampus. 2005;15:923–935. doi: 10.1002/hipo.20118. [DOI] [PubMed] [Google Scholar]
- Widrow B, Lehr MA. 30 years of adaptive neural networks: Perceptron, madaline, and backpropagation. Proc. IEEE. 1990;78(9):1415–1442. [Google Scholar]
- Zanos TP, Courellis SH, Berger TW, Hampson RE, Deadwyler SA, Marmarelis VZ. Nonlinear modeling of causal interrelationships in neuronal ensembles. IEEE Trans. Neural Syst. Rehabil. Eng. 2008;16:336–352. doi: 10.1109/TNSRE.2008.926716. [DOI] [PMC free article] [PubMed] [Google Scholar]
- Zanos TP, Hampson RE, Deadwyler SA, Berger TW, Marmarelis VZ. Boolean modeling of neural systems with point-process inputs and outputs. Part II: Application to the rat hippocampus. Annals Biomed. Eng. 2009;37:1668–1682. doi: 10.1007/s10439-009-9716-z. [DOI] [PMC free article] [PubMed] [Google Scholar]
- Zhang Y, Chen Y, Bressler SL, Ding M. Response preparation and inhibition: The role of the cortical sensorimotor beta rhythm. Neuroscience. 2008;156:238–246. doi: 10.1016/j.neuroscience.2008.06.061. [DOI] [PMC free article] [PubMed] [Google Scholar]