

Abstract
There are five known ATP-dependent proteases in Escherichia coli (Lon, ClpAP, ClpXP, HslUV, and the membrane-associated FtsH) that catalyze the removal of both misfolded and properly folded proteins in cellular protein quality control pathways. Hexameric ClpA rings associate with one or both faces of the cylindrically shaped tetradecameric ClpP protease. ClpA catalyzes unfolding and translocation of polypeptide substrates into the proteolytic core of ClpP for degradation through repeated cycles of ATP binding and hydrolysis at two nucleotide binding domains on each ClpA monomer. We previously reported a molecular mechanism for ClpA catalyzed polypeptide translocation in the absence of ClpP, including elementary rate constants, overall rate, and the kinetic step size. However, the potential allosteric effect of ClpP on the mechanism of ClpA catalyzed translocation remains unclear. Using single-turnover fluorescence stopped-flow methods, here we report that ClpA, when associated with ClpP, translocates polypeptide with an overall rate of ~35 aa s–1 and, on average, traverses ~5 aa between two rate-limiting steps with reduced cooperativity between ATP binding sites in the hexameric ring. This is in direct contrast to our previously reported observation that, in the absence of ClpP, ClpA translocates polypeptide substrates with a maximum translocation rate of ~20 aa s–1 with cooperativity between ATPase sites. Our results demonstrate that ClpP allosterically impacts the polypeptide translocation activity of ClpA by reducing the cooperativity between ATP binding sites.
Keywords: ATP-dependent proteases, AAA+ motor proteins, pre-steady-state kinetics, protein unfoldases
Introduction
Virtually every major event in the cell is catalyzed by macromolecular machines.1,2 One example are the ATP-dependent proteases, which are ATP-driven enzymes required in all organisms for the removal of both misfolded and properly folded proteins in cell cycle regulation.3,4 The ATP-dependent proteases share a common architecture where a hexameric AAA+ ATPase can associate with one or both ends of a barrel-shaped peptidase that contains active sites in its interior sequestered from bulk solvent.5–7 In these systems, the AAA + ATPase component is responsible for the recognition, unfolding, and subsequent translocation of specific protein substrates into the proteolytic core of the associated peptidase.
Clp/Hsp100 proteins can be classified as either Class I or Class II.2,8 Class I proteins contain two ATP binding and hydrolysis sites per monomer, while Class II proteins contain only one site per monomer. Class I enzymes include ClpA and ClpB, whereas Class II includes ClpX and HslU. Despite the differences in number of ATPase sites, both ClpA and ClpX can associate with ClpP to form the ATP-dependent protease ClpAP or ClpXP, respectively. In both cases, the motor component, ClpA or ClpX, bind to proteins displaying a degradation tag and, through repeating cycles of ATP binding and hydrolysis, translocates the protein substrate through the central channel of the motor component into the proteolytic core of ClpP.4,9–11
Despite the similar functions of ClpA and ClpX, it is unclear as to why ClpA requires two ATP binding sites. The monomeric structure of ClpA shows that ClpA is composed of three domains: an N domain, AAA+ domain 1 (D1), and AAA+ domain 2 (D2).12 Both D1 and D2 contain Walker A and Walker B motifs, which form the ATP binding and hydrolysis sites. In both AAA cassettes, the Walker A and Walker B motifs are separated by a loop that resides in the central channel of the hexameric ring. In the D2 domain of ClpA, this corresponds to a conserved aromatic–hydrophobic sequence, GYVG, which is present in nearly all AAA+ unfoldases.13 Through cross-linking studies, Hinnerwisch et al. showed that when ClpA was bound to an SsrA-containing substrate in the presence of adenosine 5′-(γ-thio)-triphosphate (ATPγS), the D2 loop made contact with the SsrA sequence.14 Although they did not observe cross-linking to the D1 loop, mutations in this loop eliminated translocation. From this, it was concluded that both D1 and D2 loops are involved in polypeptide translocation.
In the absence of nucleotide, ClpA resides in a mixture of monomers, dimers, and tetramers at thermodynamic equilibrium.15,16 To form hexameric rings active in polypeptide binding and association with ClpP, ClpA requires nucleoside triphosphate binding. Singh and Maurizi showed that ATP binding at D1 was essential for assembly into hexameric rings whereas D2 is responsible for the majority of the observed ATP hydrolysis.17
ClpAP catalyzed polypeptide translocation and degradation has been examined by monitoring either the steady-state degradation of model substrates, often green fluorescent protein (GFP),18 or the appearance of fluorescence resonance energy transfer (FRET) upon substrate entry into ClpP.19,20 Both strategies have the absolute requirement that ClpP is present. Thus, the question of whether or not ClpP exerts an allosteric effect on the mechanism of ClpA catalyzed polypeptide translocation cannot be addressed with either of these strategies. To overcome this limitation, we developed a single-turnover fluorescence stopped-flow method that allows us to examine ClpA catalyzed polypeptide translocation in the absence of the proteolytic component, ClpP.21 Using this approach, we showed that ClpA, in the absence of ClpP, translocated polypeptide substrates with an overall rate of ~20 aa s–1 and a kinetic step size of ~14 aa step–1.
The kinetic step size represents the average number of amino acids translocated between two rate-limiting steps and does not necessarily reflect mechanical movement.22–30 We have previously reported that the observed kinetic step size for ClpA translocation is independent of ATP concentration and that the observed rate-limiting step is kinetically coupled to repeating cycles of ATP binding and hydrolysis.21 From this observation, it can be concluded that a single step is being monitored in each repeating cycle of polypeptide translocation. Thus, the observed step immediately follows ATP binding.25,26 Therefore, the observed step could be mechanical movement, ATP hydrolysis, or a slow conformational change, that is, D1 or D2 loop movement.
In the case of ClpA, the interpretation of the kinetic step size is further muddled by the fact that the enzyme contains two ATP binding and hydrolysis sites per monomer and that both sites are hydrolyzing ATP at different rates.31 Therefore, it is unclear if the step that limits the observation of translocation and repeats every ~14 aa translocated is occurring at D1 or D2. Despite these limitations on the interpretation of the kinetic step size, quantitative information on the elementary steps in polypeptide translocation can be obtained using such single-turnover kinetic approaches.
Here, we report the results from applying our single-turnover fluorescence stopped-flow technique to examine ClpA catalyzed polypeptide translocation in the presence of ClpP. This was performed to address the question: does ClpP allosterically impact the ClpA catalyzed polypeptide translocation mechanism? Here, we report that ClpA, in the presence of ClpP, translocates polypeptide substrate with an overall rate of ~36 aa s–1 in contrast to our previous report of ~20 aa s–1 in the absence of ClpP, both at saturating [ATP]. We show that this is the consequence of both an increase in the elementary rate constant and an increase in the frequency with which the observed rate-limiting step repeats, that is, a decrease in the kinetic step size. Most strikingly, the dependence of the kinetic parameters on ATP concentration suggests that the cooperativity between ATP binding and hydrolysis sites is reduced during polypeptide translocation in the presence of ClpP. This is in stark contrast to what was observed for ClpA in the absence of ClpP, where the dependence of the kinetic parameters on ATP suggests cooperativity between ATP binding and hydrolysis sites.
Results
Application of a single-turnover method to examine polypeptide translocation by ClpAP
To examine ClpAP catalyzed polypeptide translocation, we performed single-turnover translocation experiments in buffer H (see Materials and Methods) as previously described for ClpA.21 Figure 1 illustrates the experimental design. In syringe 1 of the stopped-flow apparatus is a solution containing 1 μM ClpA monomer, 1.2 μM ClpP monomer, 150 μM ATPγS, and 20 nM fluorescein-labeled polypeptide substrate (see Table 1 for sequences). Each polypeptide substrate contains the SsrA sequence, AANDENYALAA (shown in boldface in Table 1), at the carboxy terminus and a single cysteine residue at the amino terminus that has been labeled with fluorescein-5-maleimide. ClpA binds the SsrA sequence at the carboxy terminus of the substrate and translocates toward the amino terminus.19,21 Inclusion of ATPγS is required for assembly of hexameric ClpA that is active in both polypeptide binding and ClpP association.6,21,32 The structure shown in Fig. 1 is a schematic representation of the contents of syringe 1 from a model of the ClpA hexamer12 and the crystal structure of the ClpP tetradecamer, since there is not an available crystal structure of hexameric ClpA bound to tetradecameric ClpP.33
Fig. 1.

Schematic representation of single-turnover stopped-flow translocation experiments. Syringe 1 contains the indicated reagents, ClpA, ClpP, ATPγS, and fluorescein-labeled polypeptide. The structure shown illustrates the contents of syringe 1 with the formation of the ClpAP complex with a single polypeptide bound (illustration is a schematic created by superimposing model structures for ClpA, ClpP, and model polypeptide substrate). Syringe 2 contains ATP to fuel polypeptide translocation and 300 μM SsrA peptide to serve as a trap for unbound ClpAP or any ClpAP that dissociates from polypeptide during the course of the reaction. The two reactants are rapidly mixed in the green-colored chamber and fluorescein is excited at λex = 494 nm. Fluorescein emissions are observed above 515 nm with a 515-nm-long pass filter. Upon mixing, the concentrations are 2-fold lower than in the preincubation syringe.
Table 1.
Polypeptide translocation substrates
| Substrate | Name | Length (aa) | Sequence |
|---|---|---|---|
| I | N-Cys−50 | 50 | Flu-CLILHNKQLGMTGEVSFQAANTKSAANLKVKELRSKKKLAANDENYALAA |
| II | N-Cys−40 | 40 | Flu-CTGEVSFQAANTKSAANLKVKELRSKKKLAANDENYALAA |
| III | N-Cys−30 | 30 | Flu-CTKSAANLKVKELRSKKKLAANDENYALAA |
Flu, fluorescein dye covalently attached at the cysteine residue.
Syringe 2 contains a solution of ATP and 300 μM SsrA polypeptide. The inclusion of a non-fluorescently modified SsrA polypeptide in syringe 2 serves as a protein trap that insures single-turnover conditions. Upon mixing the contents of the two syringes, free ClpAP or any ClpAP that dissociates will rapidly bind the non-fluorescently modified SsrA trap, thus insuring that the observed signal is only sensitive to ClpAP that was bound at time zero.
Reaction progress is monitored by exciting fluorescein at 494 nm and observing the emissions at 515 nm and above using a 515-nm-long pass filter. Upon binding to the polypeptide substrate in the presence of ATPγS, ClpAP quenches the fluorescence, identical with what was observed and reported for ClpA.21 Thus, the reactant in syringe 1 represents a prebound complex with quenched fluorescence and will exhibit a fluorescence increase when ClpAP dissociates.
Figure 2 shows the fluorescence time courses collected from rapidly mixing the contents of syringe 1 and 2, as illustrated in Fig. 1, at a final ATP concentration of 300 μM after mixing. The representative time courses are from three experiments performed with polypeptide substrate lengths of 30, 40, and 50 aa (see Table 1). Similar to what was observed for ClpA in the absence of ClpP, the three fluorescence time courses exhibit a lag followed by a fluorescence enhancement.21 Consistently, the extent of the lag increases with increasing substrate length. Under single-turnover conditions, a lag phase in the kinetic time course is observed if two or more rate-limiting steps occur with similar rate constants.22,26,29 Likewise, ClpAP is proceeding through more rate-limiting steps with each increase in substrate length since the extent of the lag is increasing with increasing substrate length.
Fig. 2.

Fluorescence time courses for ClpAP catalyzed polypeptide translocation. Time courses represent 1 μM ClpA, 1.2 μM ClpP, 150 μM ATPγS, and 20 nM fluorescein-labeled polypeptide substrate pre-assembled prior to rapid mixing with 600 μM ATP and 300 μM SsrA. Shown are time courses for ClpAP catalyzed translocation of N-Cys-50, NCys-40, and N-Cys-30 polypeptide substrates. The red continuous lines represent a global NLLS fit using Scheme 2 for time courses collected with substrates I–III in Table 1. The resultant parameters are kT = (4.69 ± 0.09) s–1, kC = (0.12 ± 0.01) s–1, kNP = (0.02 ± 0.002) s–1, m = (4.6 ± 0.3) aa step–1, and mkT = (21.5 ± 1.1) aa s–1. Each time course was analyzed under a given set of conditions by constraining the parameters kT, kC, kNP, and h to be global parameters, while Ax, xx, and nx were allowed to float for each polypeptide length, where the subscript “x” represents the polypeptide substrate length.
The time courses shown in Fig. 2 are only sensitive to the enzyme that was bound at time zero. In our previous examination of ClpA catalyzed polypeptide translocation, the only active form of the enzyme would be hexameric ClpA.21 However, in the experiments shown here, signal will come from hexameric ClpA or hexameric ClpA associated with ClpP. Moreover, ClpP can be associated with either one or two hexamers of ClpA, that is, a 1:1 or 2:1 complex, respectively. In the experimental design, shown in Fig. 1, the monomeric ClpA concentration is 1 μM and the concentration of ClpP tetradecamers is 86 nM. If it is assumed that all of the ClpA monomers are in the hexameric state, then the concentration of hexamers would be 166.7 nM, that is, 1 μM ClpA monomer divided by 6 monomers per hexamer. Thus, the hexameric concentration of ClpA would be in 2-fold excess over the concentration of ClpP, a condition that has been used in many studies.5,7,19,20,34 However, we previously reported that 18 μM ClpA monomer in the presence of 1 mM ATPγS did not sediment as a single ideal species in sedimentation velocity experiments.32 Rather, there was a distribution of oligomers where the hexameric state exhibited a sedimentation coefficient of ~15.5 S.32
The single-turnover experiments schematized in Fig. 1 are performed with 1 μM ClpA monomer and 150 μM ATPγS in the preincubation syringe. Under these conditions, the ClpA concentration is 18-fold lower and the ATPγS concentration is nearly 7-fold lower than in our previous report on the assembly state of ClpA.32 Since the free monomer concentration and the free nucleotide concentration are the thermodynamic driving forces for hexamer formation, one would predict that the hexameric state would be even less populated under these lower concentration conditions than in our previous study. To address this, we performed sedimentation velocity experiments to determine the concentration of hexamers in the preincubation syringe illustrated in Fig. 1 with 1 μM ClpA and three different concentrations of ATPγS between 50 and 150 μM ATPγS.
Figure 3a shows the c(s) distributions from the analysis of sedimentation velocity experiments performed with 1 μM ClpA monomer and 50, 100, and 150 μM ATPγS. We have previously published sedimentation coefficients for monomer and hexamer to be 4.5 S and 15.5 S, respectively.16,32 Consistently, the c(s) distribution shows a clear reaction boundary at ~4.5 S and ~15.5 S. Moreover, as the nucleotide concentration is increased, the reaction boundary for the monomer decreases and the hexamer increases (see Fig. 3a). The c(s) distribution clearly indicates that not all of the ClpA resides in the hexameric state and that ClpA resides in a dynamic equilibrium of hexamers, monomers, and potentially other oligomers.
Fig. 3.

Sedimentation coefficient distribution, c(s), dependence on ATPγS concentration. (a) c(s) distributions for 1 μM ClpA in the presence of 50 μM (black), 100 μM (red), and 150 μM (blue) ATPγS from the analysis of sedimentation velocity experiments performed as described in Materials and Methods in buffer H. (b) The concentration of ClpA hexamers was determined from analysis of the c(s) distributions collected at the three [ATPγS] using a non-interacting discrete species model. For 1 μM ClpA and 150 μM ATPγS, the concentration of ClpA hexamers was determined to be [ClpA6] = (130 ± 11) nM, which represents the average and standard deviation of eight replicates.
The sedimentation boundaries were subjected to analysis using the non-interacting discrete species model to determine the number of oligomers present and the fraction of each component (see Materials and Methods). Knowledge on the total loading concentration of ClpA and the fraction of this concentration in the hexameric state yields the concentration of hexamers present. Figure 3b shows the concentration of hexamers at the three different concentrations of ATPγS. The determined concentration of hexamers in our preincubation conditions (1 μM ClpA and 150 μM ATPγS) is (130 ± 11) nM, which is ~ 22% lower than the 167 nM hexamers predicted if one assumes that all of the ClpA is in the hexameric state.
ClpP can bind one or two hexamers to form a 1:1 or 2:1 complex, respectively. A mixture of 1:1 and 2:1 complexes will be present since the ClpP concentration is 86 nM and the ClpA hexamer concentration is ~130 nM under these conditions. However, there should not be a significant concentration of free hexamers based on an affinity constant of ~4 nM for ClpA hexamer binding to ClpP.6 Therefore, the observed signal shown in Fig. 2 should only reflect ClpAP bound to polypeptide substrate. The signal will represent the translocation activity of a mixture of 1:1 and 2:1 complexes. On the other hand, since the polypeptide substrate concentration in these experiments is 20 nM and the enzyme concentration is in large excess, on average, only one polypeptide should be bound per complex whether 2:1 or 1:1. It has been previously concluded that only one polypeptide can bind to one hexamer.35 Moreover, only one hexamer can bind to these short polypep-tide substrates and ClpA binds to the SsrA sequence ~ 6-fold tighter than to a random unstructured sequence (T. Li and A. L. Lucius, manuscript submitted). Thus, the time courses only reflect translocation catalyzed by ClpA at one side of the ClpAP complex, whether it is a 2:1 or a 1:1 ClpA-to-ClpP complex.
Analysis of the number of steps as a function of polypeptide substrate length
The kinetic mechanism that we previously reported for ClpA in the absence of ClpP exhibited a slow step with rate constant kC that was not involved in polypeptide translocation.21 To diagnose whether this step is present for ClpA when ClpP is present, that is, ClpAP, we investigated the dependence of the number of observed translocation steps, n, on the total length of polypeptide, L. To accomplish this, we subjected the time courses shown in Fig. 2 to nonlinear-least-squares (NLLS) analysis using the simplified n-step sequential model shown as Scheme 1. In Scheme 1, ClpAP begins prebound to polypeptide substrate, S, in both productive and nonproductive forms, (ClpAP•S)L and (ClpAP•S)NP, respectively, which accounts for the observed slow second phase. Upon mixing with ATP, (ClpAP•S)NP can isomerize with rate constant kNP into the productive form, (ClpAP•S)L, which can either dissociate from the polypeptide substrate with rate constant kd or translocate polypeptide substrate in discrete steps, with rate constant kT. Once the enzyme has taken a single translocation step, the first intermediate, I(L-m), of length L-m is formed, where L is the length of the polypeptide and m is the kinetic step size. The kinetic step size is defined here as the average number of amino acids translocated between two rate-limiting steps. ClpAP can then continue to translocate polypeptide through n translocation steps until reaching the end and dissociating to form free enzyme and free polypeptide substrate, S.
Scheme 1.
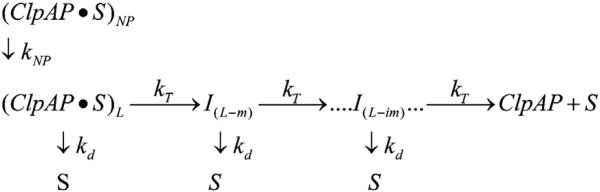
Simplest sequential n-step model. (ClpAP•S)L and (ClpAP•S)NP represent ClpAP bound to polypeptide substrate in the productive and nonproductive forms, respectively, and S is the unbound polypeptide substrate. kT is the translocation rate constant, kd is the dissociation rate constant, L is the polypeptide length, m is the average distance translocated between two steps with rate constant kT, and ‘i’ in I(L-im) represents i number of translocation steps.
In this analysis, the time courses collected for each length of fluorescein-labeled polypeptide were subjected to NLLS analysis using Scheme 1 by constraining kT and kNP to be the same for each substrate length and, thus, global parameters. In contrast, the amplitudes (Ax), the fraction of productively bound complexes (xx), and the observed number of translocation steps (nx) are treated as local parameters and are different for each polypep-tide length, where the subscript “x” represents the substrate length.
From the NLLS analysis, we determined the total number of steps, n, required to describe each time course and plotted n as a function of total polypeptide length. Figure 4 shows that when Scheme 1 is used for analysis, the number of steps required to describe each time course increases linearly with polypeptide length (red-filled circles in Fig. 4). This indicates that ClpAP must proceed through additional steps for each increase in substrate length, consistent with translocation initiating at the carboxy-terminal binding site and proceeding to the amino-terminal fluorophore. A linear-least-squares analysis of these data results in the observation of a positive y-intercept of approximately 1.3 (red line in Fig. 4). We have previously shown that the observation of a positive y-intercept in a plot of the number of steps, n, versus total polypeptide substrate length, L, can serve as a diagnostic for the presence of additional steps in the molecular mechanism that are not involved in translocation.21,25,26,29
Fig. 4.

The dependence on polypeptide substrate length of the observed number of steps, n, determined from the analysis of ClpAP polypeptide translocation time courses shown in Fig. 2. Each time course was analyzed by constraining the parameters kT, kC, kNP, and h to be global parameters, while Ax, xx, and nx were allowed to float for each time course. The red-filled circles represent the determination of the number of steps, n, required to describe each time course in Fig. 2 using Scheme 1 [Eqs. (1) and (3) with h = 0]. The red continuous line represents a linear-least-squares fit with a slope of 0.018 and y-intercept of 1.32. The blue-filled circles represent the analysis of each time course in Fig. 2 using Scheme 2 [Eqs. (1) and (3) with h = 1]. The blue continuous line represents a linear-least-squares fit with a slope of 0.08 and y-intercept of –0.92. The green-filled circles represent the analysis of each time course in Fig. 2 using Scheme 2, but with each polypeptide length lacking the 11-aa SsrA sequence in analysis. The green continuous line represents a linear-least-squares fit with a slope of 0.08 and y-intercept of 1.2 × 10⁻⁶.
To test the possibility that the observation of a positive n-intercept in the n versus L plot is the consequence of additional kinetic steps in the molecular mechanism for polypeptide translocation, we subjected the time courses shown in Fig. 2 for each length of fluorescein-labeled substrate to NLLS analysis using Scheme 2. Scheme 2 is identical to Scheme 1 with the exception of the inclusion of a step with rate constant kC. From this analysis, the number of steps required to describe each time course was determined and plotted as a function of substrate length (blue-filled circles in Fig. 4). Similar to the analysis using Scheme 1, the analysis using Scheme 2 also exhibited a linear increase in the number of steps, n, with increasing substrate length, L. When the number of steps, n, versus substrate length, L, is fit with a linear equation, a negative y-intercept is observed (blue line in Fig. 4). Moreover, the line intersects the x-axis at ~11 aa. Thus, Scheme 2 accounts for the observation of a rate-limiting step that is not part of repeating cycles of polypeptide translocation. The observation of an x-intercept at ~11 aa is consistent with a contact site size of ~11 aa, which is the same length as the SsrA binding sequence.
Scheme 2.
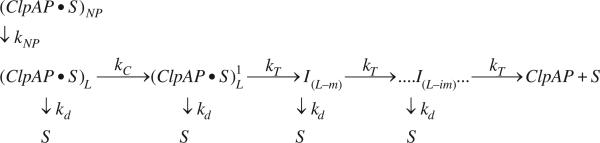
Sequential n-step model with slow step relative to kT. All parameters are the same as in Scheme 1, with the exception of kc , which represents a step slower than translocation.
We take the observation of a positive x-intercept to mean that some number of amino acids contained in the polypeptide substrate are in contact with the enzyme but should not be considered as part of the total length of the substrate.21,23,29 To account for this observation in our analysis, we have removed the contribution of the SsrA binding sequence to the translocation time courses by subtracting 11 from the total length of each polypeptide sequence shown in Table 1. This is illustrated in more detail in Fig. 4 (green line) by showing that when the number of observed translocation steps resulting from NLLS analysis using Scheme 2 is plotted as a function of the corrected polypeptide substrate length, the fit line extrapolates to the origin.
Scheme 2 describes all of the macroscopic observations of the three time courses shown in Fig. 2. Thus, the time courses in Fig. 2 were subjected to global NLLS analysis using Scheme 2 by relating the number of observed steps, n, to the substrate length, L, using a global kinetic step size, m, where n = L/m. In this analysis, kT, kC, kNP, and m were all constrained to be global parameters. The red continuous line in Fig. 2 represents the results of the global NLLS analysis. The resultant parameters are kT = (4.69 ± 0.09) s–1, kC = (0.12 ± 0.01) s–1, kNP = (0.02 ± 0.002) s–1, m = (4.6 ± 0.3) aa step–1, and mkT = (21.5 ± 1.1) aa s–1. Strikingly, at similar ATP concentrations, ClpA, in the absence of ClpP, exhibited an observed translocation rate of ~0.2 s–1 compared to ~4.7 s–1 observed here in the presence of ClpP. Likewise, the overall rate of translocation when ClpP is present is ~22 aa s–1 compared to ~3 aa s–1 when ClpP is absent.21 Equally, the kinetic step size is reduced ~3-fold from ~14 aa step–1 in the absence of ClpP compared to ~4.6 aa step–1 when ClpP is present.
We propose three potential explanations for the observation that the rate constant and kinetic step size are different in the presence and absence of ClpP. First, the observed rate-limiting step could be the same step as observed in the absence of ClpP, but it has been accelerated in the presence of ClpP and the frequency with which it repeats has been increased, that is, increased number of steps, n, to fully translocate the substrate and thus a reduced kinetic step size, m. Second, the kinetic time courses could be sensitive to a different step that repeats with greater frequency. Third, if the kinetic step size truly represents mechanical movement, then the distance traveled between two rate-limiting steps could be different for ClpAP than for ClpA.
Dependence of translocation mechanism on [ATP]
To begin to distinguish between the three possibilities, we examined the ATP concentration dependence of the kinetic parameters. Single-turnover fluorescence stopped-flow experiments were performed as schematized in Fig. 1 by varying the [ATP] in syringe 2. Time courses were collected using substrates I–III (see Table 1) at a final mixing concentration of ATP equal to 125, 200, 300, 500, and 750 μM and 1, 3, 5, 7, and 9 mM. Each data set was subjected to NLLS analysis to determine the parameters kT, m, mkT, kC, and kNP at each [ATP] (see Table 2).
Table 2.
CIpAP polypeptide translocation NLLS parameters as a function of [ATP]
| kt (s−1) | mkT (aas−1) | kc (s−1) | knp (s−1) | m (aa step−1) | |
|---|---|---|---|---|---|
| [ATP] (μM) | |||||
| 125 | 1.93 ± 7.04 | 12.8 ± 0.9 | 0.06 ± 0.01 | 0.011 ± 0.001 | 6.8 ± 1.9 |
| 200 | 4.7 ± 1.1 | 17.0 ± 0.1 | 0.09 ± 0.01 | 0.015 ± 0.0002 | 3.7 ± 0.8 |
| 300 | 4.9 ± 3.3 | 20.2 ± 0.4 | 0.11 ± 0.02 | 0.019 ± 0.002 | 5.3 ± 3.7 |
| 500 | 12 ± 9 | 25.6 ± 2.9 | 0.152 ± 0.002 | 0.026 ± 0.001 | 2.9 ± 2.4 |
| 750 | 9.8 ± 4.7 | 27.7 ± 2.1 | 0.17 ± 0.01 | 0.029 ± 0.0004 | 3.2 ± 1.3 |
| [ATP] (mM) | |||||
| 1 | 9.9 ± 5.6 | 28.2 ± 0.7 | 0.18 ± 0.01 | 0.032 ± 0.002 | 3±2 |
| 3 | 13.6 ± 0.02 | 33.4 ± 2.5 | 0.23 ± 0.02 | 0.042 ± 0.003 | 2.5 ± 0.2 |
| 5 | 6.6 ± 0.9 | 34.9 ± 1.9 | 0.23 ± 0.01 | 0.042 ± 0.002 | 5.3 ± 1.1 |
| 7 | 8.9 ± 1.9 | 32.8 ± 0.7 | 0.24 ± 0.02 | 0.042 ± 0.003 | 3.7 ± 0.8 |
| 9 | 9.4 ± 2.8 | 32.8 ± 1.4 | 0.24 ± 0.02 | 0.043 ± 0.001 | 3.7 ± 1.2 |
kT is the translocation rate constant, kNP is the rate constant for isomerization from the nonproductive to the productive form, kC is a slow conformational change defined by Scheme 2, m is the kinetic step size, and mkT is the macroscopic rate of translocation.
The kinetic step size and the translocation rate constant exhibit a high degree of negative parameter correlation. As such, the associated uncertainties on these parameters are large (see Table 2). However, the translocation rate constant clearly exhibits an ATP concentration dependence, while the kinetic step size appears to be constant with an average value of (4 ± 1) aa step–1.
In an attempt to determine the kinetic parameters with higher precision, all of the time courses collected at different ATP concentrations were combined and subjected to global NLLS analysis. The kinetic step size was constrained to be a global parameter for all 30 time courses since the kinetic step size appears to be independent of ATP concentration. In contrast, kT, kC, and kNP were local parameters to each ATP concentration. As seen in Table 3, the certainty on the kinetic parameters is substantially improved (compare values in Table 2 to Table 3). Similarly, the global kinetic step size was determined to be (4.6 ± 0.3) aa step–1.
Table 3.
CIpAP polypeptide translocation global NLLS parameters as a function of [ATP]
| kT (s−1) | mkT (aa s−1) | kC (S−1) | kNP (S−1) | ||
|---|---|---|---|---|---|
| [ATP] (μM) | |||||
| 125 | 2.83 ± 0.01 | 12.96 ± 0.90 | 0.063 ± 0.006 | 0.011 ± 0.001 | |
| 200 | 3.73 ± 0.26 | 17.04 ± 0.03 | 0.089 ± 0.004 | 0.015 ± 0.0002 | |
| 300 | 4.69 ± 0.09 | 21.47 ± 1.06 | 0.115 ± 0.011 | 0.019 ± 0.002 | |
| 500 | 5.55 ± 0.29 | 25.47 ± 3.06 | 0.161 ± 0.015 | 0.026 ± 0.001 | m (aa step−1) |
| 750 | 6.43 ± 1.39 | 29.21 ± 4.37 | 0.174 ± 0.007 | 0.029 ± 0.001 | 4.58 ± 0.31 |
| [ATP] (mM) | |||||
| 1 | 6.48 ± 0.68 | 29.55 ± 1.11 | 0.189 ± 0.002 | 0.032 ± 0.002 | kd (s−1) |
| 3 | 7.63 ± 0.53 | 34.86 ± 0.07 | 0.234 ± 0.014 | 0.042 ± 0.004 | ND |
| 5 | 8.04 ± 0.09 | 36.80 ± 2.10 | 0.232 ± 0.018 | 0.041 ± 0.002 | |
| 7 | 7.23 ± 0.30 | 33.04 ± 0.88 | 0.242 ± 0.021 | 0.042 ± 0.003 | |
| 9 | 7.41 ± 0.02 | 33.93 ± 2.22 | 0.252 ± 0.014 | 0.043 ± 0.0004 |
kT is the translocation rate constant, kd is the dissociation rate constant, kNP is the rate constant for isomerization from the nonproductive to the productive form, kC is a slow conformational change defined by Scheme 2, m is the kinetic step size, and mkT isthe macroscopic rate of translocation. ND, not determined.
The microscopic translocation rate constant, kT, and the macroscopic rate, mkT, are plotted as functions of [ATP] in Fig. 5a and b, respectively. This global fitting strategy produced results similar to the fitting strategy discussed above in which all data were fit individually. A plot of either the macroscopic rate or the microscopic rate constant of translocation exhibits a hyperbolic dependence on [ATP], rather than the sigmoidal dependence upon [ATP] that is observed for ClpA in the absence of ClpP.21 Despite this, both curves were initially subjected to NLLS analysis using an infinitely cooperative binding model given by Eq. (4) as was performed for ClpA in the absence of ClpP.21 For the analysis of kT and mkT, the Hill coefficient, t, is 1.2 ± 0.2 and 1.1 ± 0.1 and the equilibrium constant, Ka, is (4.8 ± 1.1) × 103 M–1 and (4.8 ± 1.1) × 103 M–1, respectively. Since the Hill coefficient is within error of one, the parameter was constrained to one, that is, a 1:1 binding isotherm, and the data were subjected to NLLS analysis. The results of this analysis are shown as continuous lines in Fig. 5a and b. The resultant parameter Ka for mkT and kT is (4.8 ± 0.5) × 103 M–1 and (4.8 ± 0.5) × 103 M–1, respectively. The analysis of kT and mkT also yielded estimates of the maximum translocation rate constant and maximum macroscopic rate of translocation as (7.9 ± 0.2) s–1 and (36.1 ± 0.7) aa s–1, respectively, at saturating ATP concentrations.
Fig. 5.

(a) Dependence of kT on [ATP], where the continuous line is the result of an NLLS fit to Eq. (4) with the Hill coefficient constrained to equal one for kT,max = (7.9 ± 0.2) s–1 and Ka = (4.8 ± 0.5) × 103 M–1. (b) Dependence of mkT on [ATP], where the continuous line is the result of a NLLS fit to Eq. (6) with the Hill coefficient constrained to equal one for mkT,max = 36.1 ± 0.7 aa s–1 and Ka = (4.8 ± 0.5) × 103 M–1. (c) Dependence of kC (filled circles) and kNP (filled squares) on [ATP], where the continuous line is the result of a NLLS fit to Eq. (4) with the Hill coefficient constrained to equal one. For kC and kNP, the equilibrium constant, Ka, is (2.8 ± 0.1) × 103 M–1 and (2.5 ± 0.1) × 103 M–1, respectively. The analysis of kC and kNP also yielded estimates of the maximum microscopic and macroscopic rates of translocation as 0.26 ± 0.003 s–1 and 0.045 ± 0.001 s–1, respectively.
Scheme 2 includes both a kinetic step, kC, that is slow relative to translocation and a pre-translocation equilibrium that proceeds from a nonproductive state to a productive state with rate constant kNP. As shown in Fig. 5c, both kC and kNP show a dependence on [ATP]. Similar to mkT and kT, kC and kNP exhibit rectangular hyperbolic character when plotted on a linear [ATP] scale. When kC and kNP were subjected to NLLS analysis using Eq. (4) with the Hill coefficient constrained to equal one, the equilibrium constant, Ka, was (2.8 ± 0.2) × 103 M–1 and (2.5 ± 0.1) × 103 M–1, respectively. The analysis of kC and kNP also yielded estimates of the maximum value at saturating [ATP] as (0.26 ± 0.003) s–1 and (0.045 ± 0.001) s–1, respectively.
Discussion
We recently developed and reported a single-turnover fluorescence stopped-flow method that is sensitive to polypeptide translocation catalyzed by ClpA in the absence of ClpP.21,36 Equally important, we developed methods to analyze the kinetic time courses and yield quantitative estimates of a number of parameters describing the elementary steps in the mechanism of ClpA catalyzed polypeptide translocation.29 These parameters include the kinetic step size, the elementary rate constants, the overall rate of translocation, and the processivity. With these methods in hand, we reported a minimal kinetic mechanism to describe a single round of polypeptide translocation catalyzed by ClpA in the absence of ClpP.
That work represented a significant advance because much of our knowledge regarding ClpA catalyzed polypeptide translocation had been elucidated by examining the steady-state proteolysis catalyzed by ClpAP with the assumption that ClpA catalyzes polypeptide translocation employing the same molecular mechanism whether or not bound to ClpP.6,18 Reid et al. reported the development of a FRET-based stopped-flow method, where a donor fluorophore is in the central cavity of ClpP and an acceptor fluorophore is on a substrate protein being translocated into the central cavity. Thus, upon arrival of the substrate into the cavity, a FRET signal change is observed. Because this approach also requires the presence of ClpP, one could not address the question of whether or not ClpP exerts allosteric control over the mechanism of ClpA catalyzed polypeptide translocation. An alternative FRET experiment was performed by Kolygo et al., where a donor–acceptor pair was placed far away from each other in the primary structure of a substrate protein but close in proximity in the folded protein.20 Upon translocation catalyzed by ClpA in the absence of ClpP, a FRET change was observed. However, none of the time courses acquired using either of these FRET methods were subjected to quantitative analysis that would lead to a determination of the elementary rate constants in the reaction cycle.
Analysis of translocating species
In the work reported here, we set out to determine the effect of ClpP on the kinetic mechanism of polypeptide translocation catalyzed by ClpA. However, one immediate question arises in the experimental design schematized in Fig. 1: what form of ClpAP is catalyzing translocation? This question arises because ClpAP can exist as a complex consisting of either one ClpA hexamer associated with one ClpP tetradecamer (1:1 complex) or two hexamers associated with one ClpP tetradecamer (2:1 complex).
To predict the concentrations of 1:1 ClpAP, 2:1 ClpAP, and free ClpA hexamers, one needs the interaction constant for ClpA hexamer binding to ClpP tetradecamers, the ClpP tetradecamer concentration, and the ClpA hexamer concentration. The dissociation equilibrium constant for ClpA hexamers associating with ClpP tetradecamers has been reported to be in the range 4–25 nM from activity assays.6,37 However, to determine the concentration of hexameric ClpA and tetradecameric ClpP, knowledge of the assembly state is required. In analytical ultracentrifugation experiments, ClpP sediments as a single ideal species with a molecular weight consistent with a tetradecamer.6 Thus, it is sufficient to determine the total monomer concentration and divide by 14 to yield the ClpP tetradecamer concentration. In the case of ClpA, we recently reported results from sedimentation velocity experiments showing that ClpA did not sediment as a single ideal species in the presence of saturating concentrations of nucleoside triphosphate.32 Thus, determining the concentration of ClpA hexamers under a given set of conditions is a more complex task than simply determining the total monomer concentration and dividing by 6.
Those previous sedimentation velocity experiments showing that ClpA resides in a mixture of oligomers were carried out at 18 μM ClpA monomer and 1 mM ATPγS.32 In contrast, the stopped-flow experiments reported here were performed with a pre-mixing concentration of 1 μM ClpA monomer and 150 μM ATPγS (Fig. 1, Syringe 1). Thus, the population of hexamers in the stopped-flow preincubation syringe (Fig. 1, Syringe 1) is predicted to be even lower than in our previously reported sedimentation velocity experiments. This prediction is made simply based on mass action. Consequently, the population of ClpA hexamers must depend on both the free ClpA monomer concentration and the free ATPγS concentration.
The sedimentation velocity experiments reported here show that ~78% of ClpA monomers reside in the hexameric state at 1 μM ClpA monomer and 150 μM ATPγS. Hence, the concentration of hexamers in the preincubation syringe would be ~130 nM. However, this assumes that neither ClpP binding nor polypeptide binding induces hexamer formation, which is an assumption we are currently investigating. Since the ClpP tetradecamer concentration is 86 nM, the hexamer concentration is in a 1.5-fold excess over the ClpP tetradecamer concentration. Thus, the kinetic time courses reported here likely reflect translocation catalyzed by a mixture of 1:1 and 2:1 complexes. Although this fact complicates our interpretation of the kinetic data, the results are comparable to a variety of published studies performed with similar ClpA and ClpP concentrations where it is assumed that ClpA resides only in the hexameric state and thus only the 2:1 complex is catalyzing the reaction.5,18,31
One natural question is why not simply increase the ATPγS concentration in syringe 1 to shift the equilibrium to hexamers. The answer is that we want to minimize the impact of competition in binding between hydrolyzable ATP and ATPγS upon mixing. We have found through sedimentation velocity experiments that the population of hexamers does not change significantly between 100 μM and 1 mM ATPγS (Lin et al., unpublished results). Consistently, Fig 3b suggests that the dependence of the concentration of hexameric ClpA on [ATPγS] is beginning to saturate at 150 μM ATPγS. In the experiments reported here, the concentration of ATPγS is 75 μM after mixing with 5 mM hydrolyzable ATP. Thus, the competition between ATP and ATPγS binding should be minimized while maintaining [ATPγS] sufficiently high to saturate ClpA hexamerization.
The interpretation of the kinetic time courses is complicated by the fact that there is a mixture of species present in solution. Nevertheless, we have reduced the complexity by maintaining enzyme concentration in excess of polypeptide substrate concentration. Under these conditions, binding of a single polypeptide to one hexamer in the 2:1 complex is favored. As such, our interpretation of the data assumes that a ClpA hexamer in a 2:1 complex translocates polypeptide with the same mechanism as a hexamer in a 1:1 complex. However, this assumption is currently being tested by determining the molecular mechanism of polypeptide translocation under a variety of ClpA-to-ClpP mixing ratios (J. Miller, unpublished results).
Rate of ClpAP catalyzed polypeptide translocation
Semiquantitative approaches have previously been used to propose that ClpAP translocates polypeptide with an overall rate of 50 aa s–1.20 In the same study, it was concluded from qualitative inspection of kinetic time courses resulting from ClpA translocating a polypeptide labeled with a FRET pair that ClpA, in the absence of ClpP, translocated polypeptide more slowly than ClpAP. We previously reported that ClpA, in the absence of ClpP, translocates at a rate of (19 ± 1) aa s–1 at saturating ATP concentrations.21 Here, we show that ClpAP translocates with a rate of (36.1 ± 0.7) aa s–1 at saturating ATP concentrations. Consistent with previous reports, ClpAP does translocate polypeptide with a faster rate than ClpA.
The overall rate of translocation is the product of the average distance translocated between two rate-limiting steps and the rate constant for the step. Thus, the difference in the overall rate of polypeptide translocation by ClpA versus ClpAP can be interpreted in terms of the effects on these two parameters. We previously reported that the translocation rate constant and kinetic step size for ClpA in the absence of ClpP is kT = (1.39 ± 0.06) s–1 and m = (14 ± 1) aa step–1 in the presence of 5 mM ATP.21 In contrast, we report here that the translocation rate constant and kinetic step size for ClpA in the presence of ClpP are kT = (7.9 ± 0.2) s–1 and m = (4.6 ± 0.3) aa step–1 at 5 mM ATP. The observed increase in overall rate for ClpAP is due to an increase in the rate constant by ~6-fold. However, the overall rate constant is only increased by ~1.5-fold, which is a consequence of the ~3-fold reduction in the kinetic step size.
Interpretation of the kinetic step size
Polypeptide translocation must occur through repeating cycles of ATP binding, hydrolysis, mechanical movement, various conformational changes, and ADP and Pi release, among other potentially significant kinetic steps as shown in Fig. 6b. This listing of potential kinetically significant steps is not intended to imply an order because the order of these events for ClpA and ClpAP is unknown. Figure 6b illustrates the cycle where enzyme, E, begins prebound to polypeptide substrate, S, which is represented as ES. The ES complex binds ATP with rate constant k1 to form the E–S–ATP ternary complex, followed by ATP hydro-lysis and simultaneous translocation to form the first intermediate bound to enzyme, E.I1, and ATP hydrolysis products. Upon ADP and Pi release, E.I1 can bind additional molecules of ATP to repeat the cycle. The observed rate constant (kobs in Fig. 6a) in the single-turnover experiments presented here represents the slowest step within the repeating cycle illustrated by Fig. 6b.
Fig. 6.

Schematic representation of polypeptide translocation. In the n-step sequential model of polypeptide translocation, enzyme that is prebound to polypeptide substrate translocates polypeptide in discrete steps until reaching the end of the substrate and dissociating (a). Polypeptide translocation must occur through repeating cycles of ATP binding, hydrolysis, mechanical movement, various conformational changes, and ADP and Pi release, among other potentially significant kinetic steps (b). The observed rate constant, kobs, in the single-turnover experiments presented here represents the slowest step within this repeating cycle.
An initial examination of translocation is typically performed with saturating ATP concentrations so that repeating cycles of ATP binding are not rate limiting.21,25 Under such conditions, the step being observed in each cycle would occur with rate constant k2 or k3 (see supplemental), where the rate constants are defined in Fig. 6b. If either step with rate constant k2 or k3 is rate limiting, then kobs = k2 or k3 [see Supplemental Eqs. (S.6), (S.7), and (S.8)]. Because each step repeats once per cycle, the number of times this step repeats is equal to the number of times the cycle repeats. Consequently, if the mechanical step occurs only once per cycle, the kinetic step size would equal the mechanical step size. Conversely, if k2 = k3, the observed number of translocation steps would be 2-fold larger than the actual number of steps required to physically translocate the substrate because one would observe two steps for every repetition of the cycle [see Supplemental Eq. (S.9)]. For example, if ClpA translocates a 50-aa substrate with a mechanical step size of 5 aa step–1 and ATP is saturating such that ATP binding is not rate limiting, the number of steps required to fully translocate the substrate would be n = 10 steps. If only a single step in the repeating cycle is rate limiting, that is, either k2 or k3 is rate limiting, the cycle would be observed to repeat 10 times [see Supplemental Eqs. (S.8) and (S.9)]. Hence, the kinetic step size would be determined to be 5 aa step–1, which would be equal to the mechanical step size, because the number of steps, n, is equal to the substrate length, L, divided by the kinetic step size, m (n = L/m). Alternatively, if k2 and k3 are equal and rate limiting, the observed rate constant would be kobs = k2 = k3, and two steps would be observed for every repetition of the cycle. The observed number of steps would increase to n = 20 instead of 10 [see Supplemental Eq. (S.9)]. Using the equation n = L/m would result in a kinetic step size of 2.5, which is 2-fold smaller than the mechanical step size. With these examples in mind, we conclude that it is imperative to determine the number of steps being observed per repeating cycle.
To test for these possibilities, we often examine the ATP concentration dependence of the kinetic parameters.25 If multiple steps per cycle are rate limiting under conditions where ATP binding is not rate limiting, that is, high [ATP], then a reduction in ATP concentration will lead to a corresponding change in the observed number of translocation steps and therefore a change in the observed kinetic step size. This is because, as the ATP concentration is reduced, the bimolecular ATP binding step must become rate limiting. Alternatively, if the ATP binding step is in rapid equilibrium ( in Fig. 6b) with the step immediately following ATP binding, then the step immediately following ATP binding will become rate limiting because it is kinetically coupled to ATP binding.25 In either case, a transition from observing multiple steps per cycle to observing only a single step per cycle will occur. Accordingly, a change in the observed number of steps to fully translocate a substrate will occur, and therefore, a change in the kinetic step size will be observed as the ATP concentration is reduced. This is a consequence of the ATP binding step or a step coupled to ATP binding becoming rate limiting.21,25
The kinetic step size will not exhibit an ATP concentration dependence if the ATP binding step is in rapid equilibrium relative to the next step and if the step immediately following ATP binding is rate limiting at saturating concentrations of ATP.25 Under these conditions, the step that immediately follows ATP binding is kinetically coupled to the ATP binding step. That is to say, kobs will exhibit an ATP concentration dependence given by kobs = k2(K1 [ATP]/(1 + K1[ATP])), where K1 = k1/k–1. Moreover, the same step is being observed at all concentrations of ATP and it only occurs one time per cycle of translocation.
The fact that the kinetic step sizes for both ClpA and ClpAP are observed to be independent of ATP concentration shows that only one step per repeating cycle of polypeptide translocation is being observed at all ATP concentrations. Equally important, we can conclude that the observed step is not ATP binding because kT does not exhibit a linear dependence. Rather, the observed rate constant exhibits a hyperbolic dependence. The hyperbolic dependence indicates that the step must be kinetically coupled to ATP binding and must be the step that immediately follows ATP binding. In order for this step to be kinetically coupled to ATP binding, it must immediately follow the ATP binding step and no other step can come between ATP binding and the step we are observing.25 Accordingly, the number of possibilities for what is being observed in our experiments is significantly reduced. The step being observed is ATP hydrolysis, a conformational change, or mechanical movement. However, it cannot be product release since product release must come after hydrolysis.
A proposed molecular model for translocation
Hinnerwisch et al. showed through cross-linking studies that polypeptide substrate cross-linked with the D2 loop in the central channel of ClpA.14 The D2 loop in the primary structure resides between the D2 Walker A and Walker B motifs that form the ATP binding pocket.12 From these observations, Hinnerwisch et al. proposed that the D2 loop was responsible for mechanical pulling on the substrate polypeptide being translocated. They proposed a cycle of translocation to consist of ATP binding at D2 with the D2 loop in the up conformation, followed by ATP hydrolysis that drives movement of the D2 loop to the down conformation and concurrent movement of the polypeptide substrate that is bound to the D2 loop. More recently, synchrotron footprinting data revealed that the D2 loop proceeds through a nucleotide-dependent conformational change, consistent with a prehydrolytic up conformation.38
From the single-turnover experiments reported here, we show that the step we observe in each repeating cycle of translocation is the step that immediately follows ATP binding. Combining our observations with the Hinnerwisch model, the step is either ATP hydrolysis or movement of the D2 loop. In either case, since we are observing a single step in each cycle, loop movement in ClpAP may represent movement by ~4.6 aa.
The suggestion that the D2 loop is responsible for movement of the distance of the kinetic step size m of ~4.6 aa assumes that there is not a significant concentration of free ClpA hexamers simultaneously catalyzing polypeptide translocation. This is because ClpA hexamers exhibit a kinetic step size of ~14 aa step–1. Similarly, the interpretation assumes that 1:1 and 2:1 ClpAP translocate with the same mechanism. This is important to note because we have observed from simulations that, if multiple species are translocating with different overall translocation rates and/or different step sizes, the observed kinetic step size will be overestimated (simulations not shown). From single-molecule measurements, this is the same as what has been described as heterogeneity or static disorder.39 At the single-molecule level, heterogeneity in the rate constant has been shown to give rise to overestimates of the kinetic step size determined in bulk experiments.40 Similarly, if there is a significant population of ClpA hexamers translocating in addition to ClpAP, then the kinetic step size will also be overestimated. As a result, we conclude that the kinetic step size of ~4.6 aa step–1 represents an upper limit since it could represent an overestimate as a consequence of both static disorder and structural heterogeneity, that is, hexameric ClpA, 1:1 ClpA:ClpP, and 2:1 ClpA:ClpP. Similarly, the kinetic step size for ClpA, in the absence of ClpP, of ~14 aa step–1 also may represent an upper limit since it could be overestimated if there are differences in the rate constant and/or step size from molecule to molecule. However, in the case of ClpA in the absence of ClpP, there is less structural heterogeneity since only hexameric ClpA catalyzes translocation.
If heterogeneity in the rate results in overestimation of the kinetic step size for both ClpA and ClpAP, then the heterogeneity is predicted to be independent of [ATP]. That is to say, the width of the distribution of rate constants that would be observed from single-molecule experiments would have to be the same at all ATP concentrations. If not, the kinetic step size that we observe in these bulk measurements would exhibit a change in kinetic step size as a consequence of changes in the heterogeneity in the rate as a function of [ATP]. Since both ClpAP and ClpA in the absence of ClpP exhibit a kinetic step size that is independent of [ATP], this predicts that the heterogeneity is independent of [ATP].
If the kinetic step size of less than 4.6 aa step–1 for ClpAP truly represents mechanical movement by less than 4.6 aa, then why does ClpA exhibit a different kinetic step size of ~14 aa step–1? The answer to this question appears to lie in the dependence of the overall translocation rate on [ATP]. We previously reported that kT for ClpA in the absence of ClpP exhibited a sigmoidal dependence on ATP concentration, which is consistent with cooperativity between ATP binding sites.21 The isotherm was not well described by a single site isotherm and therefore was analyzed with the Hill model, which assumes infinite cooperativity. This analysis resulted in a Hill coefficient of ~2.5. Since ClpA contains two ATP binding sites per monomer, the observation of a sigmoidal dependence of the rate of translocation on [ATP] suggests that there is cooperativity between multiple ATP binding sites that are involved in polypeptide translocation. In stark contrast, the ATP concentration dependence of kT for ClpAP can be described by a simple 1:1 binding model. This suggests that when ClpA is associated with ClpP, the cooperativity is reduced between ATP binding sites that are involved in translocation compared to ClpA alone.
With these observations in mind, we propose a working model for ClpA and ClpAP catalyzed polypeptide translocation that leads to a number of testable hypotheses that will require further investigation. Figure 7 illustrates our working model for both ClpA and ClpAP that incorporates known structural information, results from various biochemical/biophysical studies, and the work reported here. Figure 7a illustrates ClpA, in the absence of ClpP, with the D1 and D2 loops both in the up conformation and ATP bound to both domains. The polypeptide substrate is shown in black and is making contact with both D1 and D2 loops. Cross-linking studies have shown that contacts between polypeptide substrate and ClpA were only observed with the D2 loop, but mutations in the D1 loop abolished translocation activity.14 Moreover, our work indicates that both ATPase sites are involved in translocation for ClpA in the absence of ClpP.21 These two observations implicate the D1 loop in translocation. The next step would be for D1 to hydrolyze ATP and cause the D1 loop to move down and translocate the substrate by up to 14 aa creating a loop inside of ClpA. The loop in the substrate can be accommodated in ClpA since it has been shown that ClpA forms a cavity between the D1 and D2 loops.41,42 D1 would contain ADP and Pi in the ATP binding site, and therefore, the D1 loop would have a reduced affinity for the polypeptide, which would allow for rebinding at another D1 loop loaded with ATP in a neighboring subunit in the hexamer.32,43 The D2 loop would cycle through multiple rounds of ATP hydrolysis coupled to translocation of the substrate by 2–5 aa per cycle with a rate constant of ~4 s–1. This will occur several times thereby shortening the loop inside the cavity of ClpA before D1 translocates another ~14 aa into the cavity with a rate constant of 1.4 s–1.
Fig. 7.

Proposed model of polypeptide translocation. In the absence of ClpP, ClpA translocates polypeptide with a mechanism that includes contributions from both ATP binding domains on each ClpA monomer. The D1 domain translocates polypeptide into the central cavity of ClpA by ~14 aa. In the time before D1 takes another translocation step, D2 must take three translocation steps of ~5 aa step–1. Upon association of ClpP, the D1 domain of ClpA undergoes a conformational change such that repeated cycles of ATP binding and hydrolysis no longer limit translocation and the rate of polypeptide translocation is limited by ATP hydrolysis and/or conformational changes taking place at D2 with each translocation step.
Figure 7b illustrates our working model for how ClpA translocates when associated with ClpP. Since the ATP concentration dependence of the rate of ClpAP catalyzed polypeptide translocation suggests reduced cooperativity between ATP binding sites, we hypothesize that D2 drives translocation. Repeating cycles of ATP binding and hydrolysis could occur at D1, but they do not limit the observation of translocation. Therefore, this model predicts that repeating cycles of ATP binding and hydrolysis at D2 would lead to translocation of the substrate by distances of 2–5 aa step–1. The conclusion that D2 alone is responsible for translocation in ClpAP is based on the observation that the substrate makes contacts with the D2 loop from cross-linking studies. However, the cross-linking studies were not carried out in the presence of ClpP. Given the differences we observe between the mechanisms for ClpA versus ClpAP, revisiting the cross-linking studies in the presence of ClpP is warranted.
Our working model predicts that, in the absence of ClpP, D1 should hydrolyze ATP with a rate constant of (1.39 ± 0.06) s–1 and D2 should hydrolyze ATP with a rate constant of one-half of (7.9 ± 0.2) s–1 in the presence of polypeptide substrate. Kress et al. examined the steady-state rate of ATP hydrolysis catalyzed by ClpA both in the presence and in the absence of ClpP.31 Further, they made two variants of ClpA that are deficient in ATP hydrolysis at either D1 or D2, which allow for the examination of ATP hydrolysis at each domain in the absence of hydrolysis at the other domain, and in the presence or absence of ClpP and SsrA substrate. Interestingly, in the absence of ClpP and the presence of GFP-SsrA, D1 hydrolyzes ATP with a rate constant of (0.8 ± 0.2) s–1, which is comparable to the rate constant we determined for translocation of (1.39 ± 0.06) s–1. Similarly, in the presence of ClpP and GFP-SsrA, D2 hydrolyzes ATP with a rate constant of (6.3 ± 0.5) s–1, which is similar to our estimate of (7.9 ± 0.2) s–1.
In 2010, we reported the first estimate of a step size (aa step –1) for any AAA + polypeptide translocase.21,36 In 2011, single-molecule experiments on ClpXP were reported by both Aubin-Tam et al. and Maillard et al.44,45 Both groups showed that ClpX translocated with a step size of ~5–8 aa step–1. Unlike ClpA, ClpX contains only one nucleotide binding and hydrolysis site per monomer. However, the D2 ATPase site in ClpA is structurally related to the single site in ClpX. Thus, it is striking that the step size we observe to occur coupled to ATP hydrolysis at D2 is closer to that observed with ClpX.
Materials and Methods
Materials
All solutions were prepared in double-distilled water produced from a Purelab Ultra Genetic system (Siemens Water Technology) and using reagent-grade chemicals purchased commercially. All peptide substrates were synthesized by CPC Scientific (Sunnyvale, CA). All peptides were >90% pure as judged by HPLC and mass spectral analysis. Fluorescein was covalently attached to the free cysteine residue at the amino terminus of the polypeptide as previously described. Escherichia coli ClpA was purified as previously described.16
ClpP purification
E. coli ClpP was purified with several modifications according to the method previously reported by Maurizi et al.46 All purification steps were performed at 4 °C. E. coli ClpP was overexpressed from the pET30a vector in BL21(DE3). From the harvested cell paste, a solution (250 mg/mL) was made in cell lysis solution containing 2 mM 2-mercaptoethanol, 10 mM ethylenediaminetetraacetic acid (EDTA), 40 mM Tris (pH 8.0 at 4 °C), 200 mM NaCl, and 10% (w/v) sucrose. The resuspended cells were passed through a chilled French pressure cell multiple times at 20,000 psi to ensure optimal cell lysis. Nucleic acid was then precipitated through the addition of polyethyleneimine to the cell extract such that the final concentration was 0.1% (v/v) polyethyleneimine. The supernatant was precipitated using 35% saturation ammonium sulfate. The resulting supernatant was dialyzed overnight against buffer B [2 mM EDTA, 50 mM Tris, 2 mM 2-mercaptoethanol, and 10% (v/v) glycerol] supplemented with 50 mM NaCl. The sample was loaded onto a Q-Sepharose 6 FF column (GE Healthcare) that had previously been equilibrated with buffer B supplemented with 50 mM NaCl. The sample was eluted with a linear gradient from 50 mM NaCl to 400 mM NaCl. All ClpP-containing fractions were then pooled and loaded onto a Hiprep 26/60 Sephacryl S-300 HR column (GE Health-care) that had previously been equilibrated with buffer B supplemented with 200 mM NaCl. Previously constructed standard curves allow for the prediction of the elution volumes of all oligomeric species of ClpP. To ensure that active ClpP was being collected, we pooled only fractions corresponding to elution volumes of ClpP heptamers for further purification. Pooled fractions were then dialyzed overnight against buffer B [2 mM EDTA, 50 mM Tris, 2 mM 2-mercaptoethanol, and 10% (v/v) glycerol] supplemented with 50 mM NaCl. As a final purification step, the dialyzed sample was loaded onto a Blue Sepharose FF column (GE Healthcare) that had previously been equilibrated in buffer B supplemented with 50 mM NaCl. The sample was eluted with a linear gradient from 50 mM NaCl to 2 M NaCl and the ClpP-containing peak stored in the resulting elution conditions (buffer B with additional 1 M NaCl) at –80 °C. Prior to storage, purity was judged to be >95% by Coomassie staining. ClpP concentration was determined spectrophotometrically in buffer H using an extinction coefficient of ε280 = 9.1 × 10³ M–1 cm–1.
Methods
Analytical ultracentrifugation
Sedimentation velocity experiments were performed using a Beckman Optima XL-I analytical ultracentrifuge. Protein samples (380 μL) were loaded into a double-sector Epon charcoal-filled centerpiece and subjected to an angular velocity of 40,000 rpm. Absorbance scans as a function of radial position were collected by scanning the sample cells at a wavelength of 230 nm at intervals of 0.003 cm. Scans were collected every minute. For all analytical ultracentrifugation experiments, an identical concentration of nucleotide was included in both the sample and the reference sector. All experiments were prepared in buffer H [25 mM Hepes (pH 7.5 at 25 °C), 10 mM MgCl2, 2 mM 2-mercaptoethanol, 300 mM NaCl, and 10% (v/v) glycerol].
Sedimentation velocity
Sedimentation velocity experiments were performed with 1 μM ClpA and various concentrations of ATPγS. The apparent peak positions are independent of [ATPγS], indicating slow dissociation on the time scale of the sedimentation velocity experiments.47 As expected for a nucleotide-linked hexamerization reaction, the area under the apparent peak at ~4.5 S decreases and the area under the apparent peak at ~15.5 S increases with increasing [ATPγS].
The size and relative population of each species can be approximated using a non-interacting discrete species model using Sedfit (Peter Schuck, National Institutes of Health), since the oligomers are in slow exchange and are well resolved.48 The variance of the fit at the 68% confidence level was determined using the F-statistics in Sedfit.49
Single-turnover stopped-flow fluorescence experiments
Fluorescence stopped-flow experiments were performed as previously described and shown in Fig. 1.21 All reactions were prepared in buffer H [25 mM Hepes (pH 7.5 at 25 °C), 10 mM MgCl2, 2 mM 2-mercaptoethanol, 300 mM NaCl, and 10% (v/v) glycerol]. All experiments were performed in an SX.20 stopped-flow fluorometer, Applied Photophysics (Letherhead, UK). Prior to each reaction, 1 μM ClpA was preincubated with 150 μM ATPγS for 25 min. ClpP was then added such that the final concentration was 1.2 μM and incubated for another 25 min to allow for assembly of ClpAP complexes competent for polypeptide translocation. Fluorescently modified polypeptide substrate was then added such that the final concentration was 20 nM, and the mixture was loaded into syringe 1 of the stopped-flow fluorometer. Syringe 2 contained a solution of ATP and 300 μM SsrA peptide prepared in buffer H. The concentration of ATP in syringe 2 was varied from 250 μM to 18 mM. Prior to mixing, both solutions were incubated for an additional 10 min at 25 °C in the stopped-flow instrument. Increasing the incubation time of either solution in the stopped-flow instrument had no effect on the observed fluorescence time courses. Upon mixing, the final concentrations were 0.5 μM ClpA monomer, 0.6 μM ClpP monomer, 10 nM peptide substrate, 150 μM SsrA peptide, and 75 μM ATPγS, and the final concentration of ATP is indicated in the text. The fluorescein dye was excited at λex = 494 nm and fluorescence emission was observed above 515 nm with a 515-nm-long pass filter. All kinetic traces shown represent the average of at least eight individual determinations. The sequence of the polypeptide substrates shown in Table 1 are based on the sequence of the Titin I 27 domain and have been used previously in the study of both ClpXP and ClpA in the absence of ClpP.21,50
NLLS analysis
The system of coupled differential equations that result from Scheme 2 was solved using the method of Laplace transforms to obtain an expression for product formation as a function of the Laplace variable, S(s), given by Eq. (1):
| (1) |
where capital S represents the substrate and lower case s is the Laplace variable, h is the number of steps with rate constant kC, n is the number of steps with rate constant kT, kNP is the rate of transition from a nonproductive complex to the productive complex, and x is the fraction of ClpA bound in the productive form given by Eq. (2):
| (2) |
Equation (1) was then numerically solved using Eq. (3) to describe product formation as a function of time, S(t),
| (3) |
where AT is the total amplitude of the time course, and is the inverse Laplace transform operator. This was accomplished using the NLLS fitting routine, Conlin, and the inverse Laplace transform function using the IMSL C Numerical Libraries from Visual Numerics (Houston, TX), as previously described.26,29
The ATP concentration dependence of the rate and rate constant displayed in Fig. 5a–c was subjected to NLLS analysis using the infinitely cooperative model or the Hill model given by Eq. (4):
| (4) |
where kx,apparent is either the apparent translocation rate constant, kT, or the apparent translocation rate, mkT; kx,max is the maximum microscopic or macroscopic translocation rate constant; Ka is the association equilibrium constant; t is the Hill coefficient.
Supplementary Material
Acknowledgements
We would like to thank Karl Maluf and Clarissa Weaver for critical discussions of this manuscript. We thank Peter Prevelige and the Department of Microbiology for use of the Beckman XL-A analytical ultracentrifuge. We thank Walter Stafford and the Boston Biomedical Research Institute for gifting of a Beckman XL-I analytical ultracentrifuge. This work was supported by National Science Foundation grant MCB-0843746 to A.L.L., National Institute of Biomedical Imaging and Bioengineering grant number T32EB004312 to J.M.M., and the University of Alabama at Birmingham Department of Chemistry. The content discussed here is solely the responsibility of the authors and does not necessarily represent the official views of the National Institute of Biomedical Imaging and Bioengineering or the National Institutes of Health.
Abbreviations used
- ATPγS
adenosine 5′-(γ-thio)-triphosphate
- EDTA
ethylenediaminetetraacetic acid
- FRET
fluorescence resonance energy transfer
- GFP
green fluorescent protein
- NLLS
nonlinear least squares
Footnotes
Supplementary Data
Supplementary data to this article can be found online at http://dx.doi.org/10.1016/j.jmb.2013.04.019
References
- 1.Alberts B. The cell as a collection of protein machines: preparing the next generation of molecular biologists. Cell. 1998;92:291–294. doi: 10.1016/s0092-8674(00)80922-8. [DOI] [PubMed] [Google Scholar]
- 2.Neuwald AF, Aravind L, Spouge JL, Koonin EV. AAA+: A class of chaperone-like ATPases associated with the assembly, operation, and disassembly of protein complexes. Genome Res. 1999;9:27–43. [PubMed] [Google Scholar]
- 3.Gottesman S. Proteases and their targets in Escherichia coli. Annu. Rev. Genet. 1996;30:465–506. doi: 10.1146/annurev.genet.30.1.465. [DOI] [PubMed] [Google Scholar]
- 4.Sauer RT, Baker TA. AAA+ proteases: ATP-fueled machines of protein destruction. Annu. Rev. Biochem. 2011;80:587–612. doi: 10.1146/annurev-biochem-060408-172623. [DOI] [PubMed] [Google Scholar]
- 5.Maglica Z, Kolygo K, Weber-Ban E. Optimal efficiency of ClpAP and ClpXP chaperone-proteases is achieved by architectural symmetry. Structure. 2009;17:508–516. doi: 10.1016/j.str.2009.02.014. [DOI] [PubMed] [Google Scholar]
- 6.Maurizi MR, Singh SK, Thompson MW, Kessel M, Ginsburg A. Molecular properties of ClpAP protease of Escherichia coli: ATP-dependent association of ClpA and ClpP. Biochemistry. 1998;37:7778–7786. doi: 10.1021/bi973093e. [DOI] [PubMed] [Google Scholar]
- 7.Ishikawa T, Beuron F, Kessel M, Wickner S, Maurizi MR, Steven AC. Translocation pathway of protein substrates in ClpAP protease. Proc. Natl Acad. Sci. USA. 2001;98:4328–4333. doi: 10.1073/pnas.081543698. [DOI] [PMC free article] [PubMed] [Google Scholar]
- 8.Kress W, Maglica Z, Weber-Ban E. Clp chaperone-proteases: structure and function. Res. Microbiol. 2009;160:618–628. doi: 10.1016/j.resmic.2009.08.006. [DOI] [PubMed] [Google Scholar]
- 9.Hoskins JR, Pak M, Maurizi MR, Wickner S. The role of the ClpA chaperone in proteolysis by ClpAP. Proc. Natl Acad. Sci. USA. 1998;95:12135–12140. doi: 10.1073/pnas.95.21.12135. [DOI] [PMC free article] [PubMed] [Google Scholar]
- 10.Licht S, Lee I. Resolving individual steps in the operation of ATP-dependent proteolytic molecular machines: from conformational changes to substrate translocation and processivity. Biochemistry. 2008;47:3595–3605. doi: 10.1021/bi800025g. [DOI] [PubMed] [Google Scholar]
- 11.Thompson MW, Singh SK, Maurizi MR. Processive degradation of proteins by the ATP-dependent Clp protease from Escherichia coli. Requirement for the multiple array of active sites in ClpP but not ATP hydrolysis. J. Biol. Chem. 1994;269:18209–18215. [PubMed] [Google Scholar]
- 12.Guo F, Maurizi MR, Esser L, Xia D. Crystal structure of ClpA, an Hsp100 chaperone and regulator of ClpAP protease. J. Biol. Chem. 2002;277:46743–46752. doi: 10.1074/jbc.M207796200. [DOI] [PubMed] [Google Scholar]
- 13.Martin A, Baker TA, Sauer RT. Pore loops of the AAA+ ClpX machine grip substrates to drive translocation and unfolding. Nat. Struct. Mol. Biol. 2008;15:1147–1151. doi: 10.1038/nsmb.1503. [DOI] [PMC free article] [PubMed] [Google Scholar]
- 14.Hinnerwisch J, Fenton WA, Furtak KJ, Farr GW, Horwich AL. Loops in the central channel of ClpA chaperone mediate protein binding, unfolding, and translocation. Cell. 2005;121:1029–1041. doi: 10.1016/j.cell.2005.04.012. [DOI] [PubMed] [Google Scholar]
- 15.Veronese PK, Lucius AL. Effect of temperature on the self-assembly of the Escherichia coli ClpA molecular chaperone. Biochemistry. 2010;49:9820–9829. doi: 10.1021/bi101136d. [DOI] [PubMed] [Google Scholar]
- 16.Veronese PK, Stafford RP, Lucius AL. The Escherichia coli ClpA molecular chaperone self-assembles into tetramers. Biochemistry. 2009;48:9221–9233. doi: 10.1021/bi900935q. [DOI] [PubMed] [Google Scholar]
- 17.Singh SK, Maurizi MR. Mutational analysis demonstrates different functional roles for the two ATP-binding sites in ClpAP protease from Escherichia coli. J. Biol. Chem. 1994;269:29537–29545. [PubMed] [Google Scholar]
- 18.Weber-Ban EU, Reid BG, Miranker AD, Horwich AL. Global unfolding of a substrate protein by the Hsp100 chaperone ClpA. Nature. 1999;401:90–93. doi: 10.1038/43481. [DOI] [PubMed] [Google Scholar]
- 19.Reid BG, Fenton WA, Horwich AL, Weber-Ban EU. ClpA mediates directional translocation of substrate proteins into the ClpP protease. Proc. Natl Acad. Sci. USA. 2001;98:3768–3772. doi: 10.1073/pnas.071043698. [DOI] [PMC free article] [PubMed] [Google Scholar]
- 20.Kolygo K, Ranjan N, Kress W, Striebel F, Hollenstein K, Neelsen K, et al. Studying chaperone-proteases using a real-time approach based on FRET. J. Struct. Biol. 2009;168:267–277. doi: 10.1016/j.jsb.2009.07.003. [DOI] [PubMed] [Google Scholar]
- 21.Rajendar B, Lucius AL. Molecular mechanism of polypeptide translocation catalyzed by the Escherichia coli ClpA protein translocase. J. Mol. Biol. 2010;399:665–679. doi: 10.1016/j.jmb.2010.03.061. [DOI] [PubMed] [Google Scholar]
- 22.Ali JA, Lohman TM. Kinetic measurement of the step size of DNA unwinding by Escherichia coli UvrD helicase. Science. 1997;275:377–380. doi: 10.1126/science.275.5298.377. [DOI] [PubMed] [Google Scholar]
- 23.Fischer CJ, Lohman TM. ATP-dependent translocation of proteins along single-stranded DNA: models and methods of analysis of pre-steady state kinetics. J. Mol. Biol. 2004;344:1265–1286. doi: 10.1016/j.jmb.2004.10.004. [DOI] [PubMed] [Google Scholar]
- 24.Fischer CJ, Maluf NK, Lohman TM. Mechanism of ATP-dependent translocation of E. coli UvrD monomers along single-stranded DNA. J. Mol. Biol. 2004;344:1287–1309. doi: 10.1016/j.jmb.2004.10.005. [DOI] [PubMed] [Google Scholar]
- 25.Lucius AL, Lohman TM. Effects of temperature and ATP on the kinetic mechanism and kinetic step-size for E. coli RecBCD helicase-catalyzed DNA unwinding. J. Mol. Biol. 2004;339:751–771. doi: 10.1016/j.jmb.2004.04.010. [DOI] [PubMed] [Google Scholar]
- 26.Lucius AL, Maluf NK, Fischer CJ, Lohman TM. General methods for analysis of sequential “n-step” kinetic mechanisms: application to single turnover kinetics of helicase-catalyzed DNA unwinding. Biophys. J. 2003;85:2224–2239. doi: 10.1016/s0006-3495(03)74648-7. [DOI] [PMC free article] [PubMed] [Google Scholar]
- 27.Lucius AL, Vindigni A, Gregorian R, Ali JA, Taylor AF, Smith GR, Lohman TM. DNA unwinding step-size of E. coli RecBCD helicase determined from single turnover chemical quenched-flow kinetic studies. J. Mol. Biol. 2002;324:409–428. doi: 10.1016/s0022-2836(02)01067-7. [DOI] [PubMed] [Google Scholar]
- 28.Galletto R, Jezewska MJ, Bujalowski W. Unzipping mechanism of the double-stranded DNA unwinding by a hexameric helicase: quantitative analysis of the rate of the dsDNA unwinding, processivity and kinetic step-size of the Escherichia coli DnaB helicase using rapid quench-flow method. J. Mol. Biol. 2004;343:83–99. doi: 10.1016/j.jmb.2004.07.055. [DOI] [PubMed] [Google Scholar]
- 29.Lucius AL, Miller JM, Rajendar B. Application of the sequential n-step kinetic mechanism to polypeptide translocases. Methods Enzymol. 2011;488:239–264. doi: 10.1016/B978-0-12-381268-1.00010-0. [DOI] [PubMed] [Google Scholar]
- 30.Jankowsky E, Gross CH, Shuman S, Pyle AM. The DExH protein NPH-II is a processive and directional motor for unwinding RNA. Nature. 2000;403:447–451. doi: 10.1038/35000239. [DOI] [PubMed] [Google Scholar]
- 31.Kress W, Mutschler H, Weber-Ban E. Both ATPase domains of ClpA are critical for processing of stable protein structures. J. Biol. Chem. 2009;284:31441–31452. doi: 10.1074/jbc.M109.022319. [DOI] [PMC free article] [PubMed] [Google Scholar]
- 32.Veronese PK, Rajendar B, Lucius AL. Activity of Escherichia coli ClpA bound by nucleoside di- and triphosphates. J. Mol. Biol. 2011;409:333–347. doi: 10.1016/j.jmb.2011.02.018. [DOI] [PubMed] [Google Scholar]
- 33.Wang J, Hartling JA, Flanagan JM. The structure of ClpP at 2.3 Å resolution suggests a model for ATP-dependent proteolysis. Cell. 1997;91:447–456. doi: 10.1016/s0092-8674(00)80431-6. [DOI] [PubMed] [Google Scholar]
- 34.Choi KH, Licht S. Control of peptide product sizes by the energy-dependent protease ClpAP. Biochemistry. 2005;44:13921–13931. doi: 10.1021/bi0505060. [DOI] [PubMed] [Google Scholar]
- 35.Piszczek G, Rozycki J, Singh SK, Ginsburg A, Maurizi MR. The molecular chaperone, ClpA, has a single high affinity peptide binding site per hexamer. J. Biol. Chem. 2005;280:12221–12230. doi: 10.1074/jbc.M411733200. [DOI] [PubMed] [Google Scholar]
- 36.Lohman TM. Clipping along. J. Mol. Biol. 2010;399:663–664. doi: 10.1016/j.jmb.2010.04.063. [DOI] [PubMed] [Google Scholar]
- 37.Hinnerwisch J, Reid BG, Fenton WA, Horwich AL. Roles of the N-domains of the ClpA unfoldase in binding substrate proteins and in stable complex formation with the ClpP protease. J. Biol. Chem. 2005;280:40838–40844. doi: 10.1074/jbc.M507879200. [DOI] [PubMed] [Google Scholar]
- 38.Bohon J, Jennings LD, Phillips CM, Licht S, Chance MR. Synchrotron protein footprinting supports substrate translocation by ClpA via ATP-induced movements of the D2 loop. Structure. 2008;16:1157–1165. doi: 10.1016/j.str.2008.04.016. [DOI] [PMC free article] [PubMed] [Google Scholar]
- 39.Xie XS, Lu HP. Single-molecule enzymology. J. Biol. Chem. 1999;274:15967–15970. doi: 10.1074/jbc.274.23.15967. [DOI] [PubMed] [Google Scholar]
- 40.Park J, Myong S, Niedziela-Majka A, Lee KS, Yu J, Lohman TM, Ha T. PcrA helicase dismantles RecA filaments by reeling in DNA in uniform steps. Cell. 2010;142:544–555. doi: 10.1016/j.cell.2010.07.016. [DOI] [PMC free article] [PubMed] [Google Scholar]
- 41.Beuron F, Maurizi MR, Belnap DM, Kocsis E, Booy FP, Kessel M, Steven AC. At sixes and sevens: characterization of the symmetry mismatch of the ClpAP chaperone-assisted protease. J. Struct. Biol. 1998;123:248–259. doi: 10.1006/jsbi.1998.4039. [DOI] [PubMed] [Google Scholar]
- 42.Guo F, Esser L, Singh SK, Maurizi MR, Xia D. Crystal structure of the heterodimeric complex of the adaptor, ClpS, with the N-domain of the AAA+ chaperone, ClpA. J. Biol. Chem. 2002;277:46753–46762. doi: 10.1074/jbc.M208104200. [DOI] [PubMed] [Google Scholar]
- 43.Farbman ME, Gershenson A, Licht S. Single-molecule analysis of nucleotide-dependent substrate binding by the protein unfoldase ClpA. J. Am. Chem. Soc. 2007;129:12378–12379. doi: 10.1021/ja074168x. [DOI] [PubMed] [Google Scholar]
- 44.Aubin-Tam ME, Olivares AO, Sauer RT, Baker TA, Lang MJ. Single-molecule protein unfolding and translocation by an ATP-fueled proteolytic machine. Cell. 2011;145:257–267. doi: 10.1016/j.cell.2011.03.036. [DOI] [PMC free article] [PubMed] [Google Scholar]
- 45.Maillard RA, Chistol G, Sen M, Righini M, Tan J, Kaiser CM, et al. ClpX(P) generates mechanical force to unfold and translocate its protein substrates. Cell. 2011;145:459–469. doi: 10.1016/j.cell.2011.04.010. [DOI] [PMC free article] [PubMed] [Google Scholar]
- 46.Maurizi MR, Thompson MW, Singh SK, Kim SH. Endopeptidase Clp: ATP-dependent Clp protease from Escherichia coli. Methods Enzymol. 1994;244:314–331. doi: 10.1016/0076-6879(94)44025-5. [DOI] [PubMed] [Google Scholar]
- 47.Dam J, Velikovsky CA, Mariuzza RA, Urbanke C, Schuck P. Sedimentation velocity analysis of heterogeneous protein–protein interactions: Lamm equation modeling and sedimentation coefficient distributions c(s). Biophys. J. 2005;89:619–634. doi: 10.1529/biophysj.105.059568. [DOI] [PMC free article] [PubMed] [Google Scholar]
- 48.Schuck P. Size-distribution analysis of macromolecules by sedimentation velocity ultracentrifugation and Lamm equation modeling. Biophys. J. 2000;78:1606–1619. doi: 10.1016/S0006-3495(00)76713-0. [DOI] [PMC free article] [PubMed] [Google Scholar]
- 49.Straume M, Johnson ML. Comments on the analysis of sedimentation equilibrium experiments. In: Schuster TM, Laue TM, editors. Modern Analytical Ultracentrifugation. Birkhauser; Boston, MA: 1994. pp. 37–65. [Google Scholar]
- 50.Kenniston JA, Baker TA, Fernandez JM, Sauer RT. Linkage between ATP consumption and mechanical unfolding during the protein processing reactions of an AAA+ degradation machine. Cell. 2003;114:511–520. doi: 10.1016/s0092-8674(03)00612-3. [DOI] [PubMed] [Google Scholar]
Associated Data
This section collects any data citations, data availability statements, or supplementary materials included in this article.