

Abstract
The stiffness and structural integrity of the arterial wall depends primarily on the organization of the extracellular matrix and the cells that fashion and maintain this matrix. Fundamental to the latter is a delicate balance in the continuous production and removal of structural constituents and the mechanical state in which such turnover occurs. Perturbations in this balance due to genetic mutations, altered hemodynamics, or pathological processes result in diverse vascular phenotypes, many of which have yet to be well characterized biomechanically. In this paper, we emphasize the particular need to understand regional variations in the biaxial biomechanical properties of central arteries in health and disease and, in addition, the need for standardization in the associated biaxial testing and quantification. As an example of possible experimental methods, we summarize testing protocols that have evolved in our laboratory over the past 8 years. Moreover, we note advantages of a four fiber family stress – stretch relation for quantifying passive biaxial behaviors, the use of stored energy as a convenient scalar metric of the associated material stiffness, and the utility of appropriate linearizations of the nonlinear, anisotropic relations both for purposes of comparison across laboratories and to inform computational fluid-solid-interaction models. We conclude that, notwithstanding prior advances, there remain many opportunities to advance our understanding of arterial mechanics and mechanobiology, particularly via the diverse genetic, pharmacological, and surgical models that are, or soon will be, available in the mouse.
Keywords: mouse, biaxial testing, stiffness, stress, strain energy, linearized properties
Introduction
Central arteries (e.g., the aorta and common carotids) play fundamental biomechanical roles in development, health, and diverse cardiovascular, neurovascular, and renovascular diseases. For example, pathologic stiffening of central arteries, as in hypertension, aging, and multiple connective tissue disorders, can alter hemodynamics in vital organs and thereby be an initiator or indicator of an increased risk of heart failure, stroke, and end-stage kidney disease. 1,57,66 Conversely, loss of structural integrity of the aorta can result in potentially life threatening aneurysms or dissections having a significant rupture risk.61,67 There is, therefore, a pressing need to understand better the mechanisms underlying the stiffness and structural integrity of central arteries in health and disease, particularly progressive changes therein.
Murine models offer many advantages for studying the genetics, biology, mechanics, pathology, and pharmacological treatment of central arteries. For example, one can study arterial development in a time- and cost-efficient manner because gestation takes but 3 weeks and maturation occurs during the subsequent 5 to 8 weeks depending on sex. In addition, myriad antibodies are available for biological assays and it is now possible to create diverse mutant, pharmacological, and surgical models in mice that can provide the longitudinal data that are needed for modeling growth and remodeling processes.48 The goals of this paper are to review past successes and future needs in the quantification of stiffness and structural integrity of central arteries in diverse mouse models and to summarize particular approaches that have proven to be useful in our laboratory over the past 8 years. In particular, although tremendous attention has been directed toward identifying “vascular phenotypes” in many mouse models, including the existence of a narrowed lumen, thickened wall, tortuosity, atherosclerosis, aneurysm, dissection, and so forth, we submit that that one must biomechanically quantify, not just qualitatively identify, such phenotypes. We submit further that regional differences in biomechanics need to be quantified biaxially amongst all central arteries, but for purposes of brevity we illustrate preferred approaches for experimentation and quantification by focusing on common carotid arteries.
Background
Although seldom distinguished, there are two important measures of arterial stiffness: material stiffness, which reflects an intrinsic mechanical behavior, and structural stiffness, which reflects combined effects of material stiffness, geometry, and possibly perivascular tethering. For example, a thin-walled vessel having a high material stiffness and a thick-walled vessel having a low material stiffness could have the same overall structural stiffness. It is, of course, the structural stiffness that influences the hemodynamics and is most easily inferred clinically. Nevertheless, quantification of material stiffness is fundamental to understanding both the mechanics and the mechanobiology. Knowing the material stiffness allows one to compute stress and strain fields, which in turn can be used to assess risk of material failure or to be correlated with mechanobiological responses.46,50
A common measure of structural stiffness is the so-called pressure – strain modulus; its mathematical inverse is often referred to as distensibility (having units of kPa-1), namely
| (1) |
where the second of these relations is motivated by the often higher resolution achieved in vivo when measuring luminal area (π d2 / 4) rather than luminal diameter (d). Because these relations are defined based on empirical utility – not a theoretical basis despite possible misinterpretation of normalized differences in diameters as linearized or Green-type strains, respectively – they are appropriate metrics for comparison.
Experimental Methods
There are many different approaches to measure mechanical properties of arteries, but most of the related experiments can be classified as: (i) ring tests, (ii) uniaxial tests, (iii) in-plane biaxial tests, (iv) pressure-diameter tests at the in vivo length, and (v) biaxial tests consisting of cyclic pressure-diameter and axial force-length protocols. Ring tests are performed by isolating a thin circular ring of arterial wall and either holding the specimen at a fixed length while varying the contractility or cyclically stretching the ring at a fixed level of contractility. The former has been used extensively in vascular pharmacology whereas the latter has been used to assess arterial stiffness.9,10 Yet, Cox14 showed, and Humphrey47 confirmed, that ring tests cannot provide information on arterial stiffness relevant to the in vivo state primarily because of the lack of biaxial (i.e., axial) loading and the inability to rigorously interpret the data (i.e., to separate contributions due to finite bending and stretching). Uniaxial tests on excised strips of artery are also limited because of the inability to test the specimen under biaxial loads such as those that exist in vivo and because one can cover only a small range of the biaxial strain-strain plane. Hence, although paired uniaxial tests on circumferential and axial strips can provide useful information,43 they are not preferred.
Toward this end, we recall the wise direction given decades ago by Y.C. Fung, namely, that “the greatest need lies in the direction of collecting data in multiaxial loading conditions and formulating a [constitutive] theory for the general rheological behavior of living tissues”.27 Indeed, in-plane biaxial stretching tests on excised slabs of arteries74,75 can provide more comprehensive data sets than uniaxial tests performed on specimens taken from multiple directions within a sample. In-plane biaxial tests are difficult to perform well on murine arteries, however, because of the small size of the available tissue. Moreover, as in the ring tests, one must again be careful to separate possible finite bending and extension depending on the residual curvature of the excised unloaded slab. For these reasons, as well as the availability of small-scale commercial pressure myograph devices, pressure-diameter tests on excised cylindrical segments held at a single axial stretch are now commonly performed on mouse arteries.25,58,64 Although the particular axial stretch at which these tests is performed is often not documented, testing at the in vivo value of axial stretch has long been preferred;13,16 indeed, such tests remain so for mouse arteries7 for they provide data with direct relevance to the in vivo setting without the need for extensive cutting of the specimens as in the standard uniaxial and biaxial tests. These pressure-diameter tests can be enriched by repeating the data collection at multiple fixed lengths,38,77 typically slightly above and below the in vivo value, which renders subsequent parameter estimation more robust, particularly when including information on the associated axial forces during pressurization.
Finally, biaxial experiments on excised cylindrical segments that combine cyclic pressure-diameter (P-d) tests at multiple fixed lengths and cyclic axial force-length (f-l) tests at multiple fixed diameters or pressures can provide even more data, which facilitates identifying / verifying functional forms of the constitutive relations and calculating best-fit values of the material parameters.32 Yet, because it can be challenging to quantify equally well the P-d and the f-l behaviors with a single set of model parameters, some use the f-l data mainly to estimate the in vivo axial stretch and the P-d data to formulate the constitutive relation.12 This practice has been thought by many to be acceptable because one typically seeks to describe in vivo behavior, which for most vessels manifests at a fixed axial length (notable exceptions being coronary arteries and the ascending thoracic aorta).
Regardless of experimental approach, the preferred method of quantification is to identify a strain energy function W that describes the passive behavior, from which one can derive appropriate stress – strain relations. Active behavior can then be inferred and quantified separately by subtracting the passive from the total response of an activated artery. Quantification of mechanical behavior is discussed in more detail below. Also, see Humphrey47 for a general discussion.
Notwithstanding the small size of central arteries in mice (e.g., 400 – 1000 μm outer diameter and 3 – 5 mm length when unloaded), Gleason et al.31 showed that computer-controlled biaxial tests can be performed reliably on excised vessels. Amongst other important aspects of the associated experimental design, paired pressure transducers are symmetrically placed proximal and distal to the specimen to enable reliable estimates of the central intraluminal pressure during cyclic pressurization despite large geometric (fluid) losses in the system due to the small drawn cannulae,49 and changes in outer diameter are measured using a non-contacting video method. Although one can easily build such experimental systems to perform the desired tests, there remains a need for standardization therein. As noted many years ago,28 arterial behavior under cyclic loading is better described as pseudoelastic than elastic. That is, excised arteries require an initial “preconditioning period” to yield consistent behaviors under cyclic loading, which differ nonetheless in loading and unloading. Such preconditioning also helps to minimize effects of the load history incurred during excision and preparation of the specimen, which is important because it is impossible to perform truly repeatable preparatory manipulations. Yet, preconditioning protocols continue to vary from laboratory to laboratory and they can affect the subsequent results. Although it would be best for a committee of experts to recommend standards for testing, our experience with murine arteries is that 3 to 4 cycles of pressurization from 10 to 140 mmHg at the estimated in vivo length is sufficient for preconditioning when subsequent P-d and f-l tests are performed over 2 cycles, which allows repeatability in behavior to be checked (i.e., to confirm the sufficiency of the preconditioning). Note, for example, that when pressurizing at a fixed axial length, as with preconditioning or P-d testing, we tend to load the specimen at an average rate of 3 mmHg/sec (i.e., 4 mmHg/sec when loading and 2 mmHg/sec when unloading), and when axially extending at a fixed pressure, as with f-l testing, we tend to extend the specimen at a rate of 100 μm/sec. Flowchart 1 summarizes our typical procedure for testing and data analysis, with visual cues provided via data from representative mouse arteries. In particular, note on the left side of the Flowchart the illustrative P-d response over two successive cycles, which are difficult to discern because of the near repeatability as desired following preconditioning; note, too, the modest hysteresis, which supports the use of pseudoelasticity as suggested by Fung.
The response of vascular cells to applied loads can also be affected greatly by the physiological solution to which they are exposed. For example, murine carotid arteries tend to have increased vascular tone (i.e., contractility) when tested in standard cell / tissue culture media as compared with physiologic solutions such as Hank's balanced solutions18,23. It would be helpful, therefore, either to standardize the solutions used or to quantify solution-dependent differences. Only by standardization or categorization of experimental conditions will we be able to compare results across laboratories and thereby hasten overall understanding, particularly when trying to compare results for the many different available murine models. Based on our experience over the past 5 years, we prefer to use a Hank's balanced physiologic solution (containing, for example, 137.9 mM NaCl, 5.33 mM KCl, and 1.26 mM CaCl2) for the initial passive tests, with a 15 to 20 minute equilibration and reacclimation period at 37°C consisting of modest intraluminal flow and pressurization to 100 mmHg while the specimen is held at its estimated in vivo stretch (Flowchart 1). Like preconditioning, this initial period of exposure to temperature and the physiologic solution is thought to yield both more physiologic and reproducible responses.
Flowchart 1.
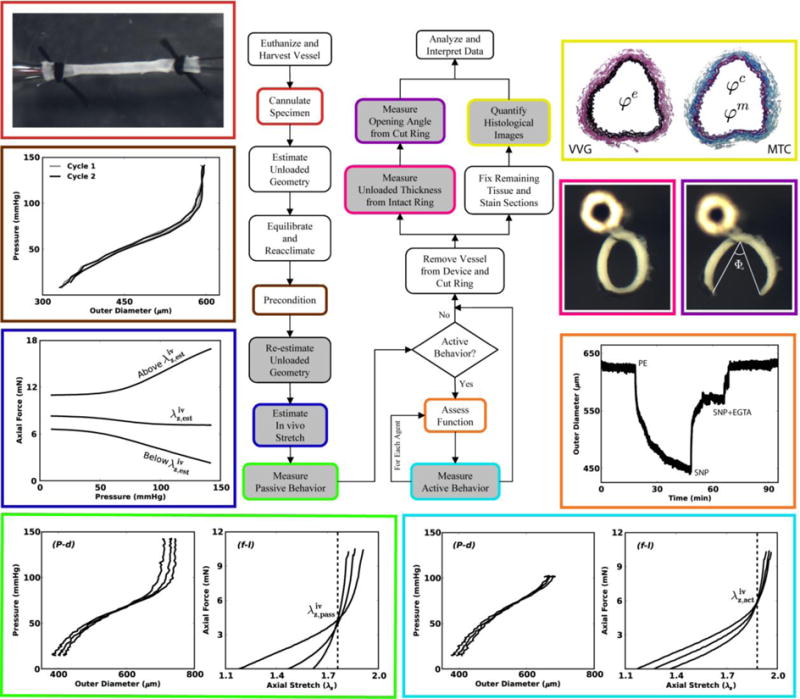
This illustrated schema shows possible sequences of experiments that can aid in the biomechanical phenotyping of mouse arteries. In particular, beginning in the upper left and moving counter-clockwise, we show a cannulated carotid artery secured using sutures, two cycles of pressure-diameter data that are nearly superimposed (which reveals the efficacy of the prior preconditioning) with little hysteresis (which reveals the utility of a pseudoelastic constitutive approach), estimation of the in vivo axial stretch ratio based on the near constancy of the transducer-measured force – pressure response during cyclic P-d testing, and typical P-d and f-l responses in passive (bottom left) and active (bottom right) states, for which the vertical lines highlight the intersection in the f-λz data (which reveal the in vivo axial stretches for passive and active states). Next, we show results from a functional test starting with a near passive state in a Hank's solution followed by contraction to phenylephrine ([PE]=10-5 M), relaxation in response to sodium nitroprusside ([SNP]=10-4 M), and recovery of the original passive state with sodium nitroprusside plus [EGTA] = 2 × 10⁻³ M in a calcium-free bath. Finally, we show images of tethered traction-free rings before and after introducing a residual stress relieving radial cut (with opening angle Φo), as well as Verhoeff van Gieson (VVG) and Masson's trichrome (MTC) stains to highlight elastic fibers (black in VVG), collagen fibers (blue in MTC), and cytoplasm (red in MTC, but very faint in this reduced image).
When evaluating the mechanical behavior (passive or active) of excised arteries, we first perform P-d tests about an estimated in vivo axial stretch that is identified via pilot tests for each type of artery. The particular value of is defined as the axial stretch at which the measured axial force remains nearly constant in response to changes in luminal pressure.83 By testing the specimen at axial stretches that are 5% below, 5% above, and at , we ensure that inflation data are collected near the actual value of in vivo axial stretch . The value of Is confirmed as that value of axial stretch where f-λz responses “cross-over” for multiple luminal pressures.76 As shown in the bottom panels of Flowchart 1, this value can differ depending on whether the testing is performed under passive or active conditions, which allows one to estimate independently the axial contribution of smooth muscle activation.
When functional behavior is of interest, we follow the passive tests with sequential 15 to 20 minute exposures of the vessel to phenylephrine (10-5 M), carbamylcholine chloride (10-5 M), and then sodium nitroprusside (10-4 M), all at 37°C, the in vivo axial stretch, and a constant pressure, typically 80 mmHg. Note that following exposure to vasoactive agents, one can again reach fully passive behavior (i.e., no basal smooth muscle tone) with a Ca++ free Hank's solution containing EGTA (2 × 10⁻³ M). See the right side of Flowchart 1. These three agents allow one to quantify smooth muscle contractility, endothelial-dependent relaxation, and endothelial-independent relaxation, respectively, and thus to test basic arterial function.17,18,19,31 By performing functional tests after the passive biaxial tests, one can also infer whether the biaxial loads induced significant cellular damage. In hindsight, it appears that early protocols for passive and active testing of arteries to 250 to 300 mmHg pressure13 caused significant damage. It is for this reason that our pressure ranges (e.g., up to 140 mmHg) are more modest in the passive tests. Indeed, we must remember that, unlike the in vivo setting where perivascular support can protect an artery from acute increases in blood pressure, there is no perivascular support in in vitro tests.
Following administration of each respective vasoactive agent, one can also perform “active” biaxial testing to quantify contraction- or relaxation-dependent changes in overall behavior, which can be compared to data from similar passive tests. Again see Flowchart 1 which suggests that comprehensive testing would involve passive and active biaxial tests, functional tests, determination of residual stress related opening angles,47 and diverse methods for assessing the microstructure from histological images.5 We emphasize, however, that that the actual extent of testing on a particular specimen depends upon the goals of the particular study. That is, we do not routinely perform all protocols on all specimens in part because of the time involved, particularly when comparing behaviors of vessels isolated from the same mouse.20
The concept of a residual stress related opening angle stems from the seminal work of Chuong and Fung.11 There are, however, three different, inter-related definitions of opening angle reported in the literature (denoted as Θo,Фo and Ф ),47 which is nonetheless often reported without specifying the particular definition. When the radially-cut, opened traction-free section is nearly circular, these opening angles are meaningful and easy to quantify via image analysis. Alternatively, one can quantify the inner and outer circumferences before and after introducing the cut and use the associated length changes to estimate the associated residual strains. Regardless of definition, note that we secure the excised rings to a vertical post within the physiologic solution (Flowchart 1) before introducing the radial cut to ensure that the vessel is unencumbered and free to open.
Quantification of the underlying microstructure is increasingly important as the field moves more towards the development of structurally-based constitutive relations. At the minimum, it is important to quantify mass or area fractions for elastic fibers, smooth muscle, collagen fibers, and mucoid material, which can be accomplished using standard histological stains. Amongst others, we have proposed methods to automate such quantification.5,19,40,45,85 In addition, advances in imaging methods such as two photon fluorescence (TPF) and second harmonic generation (SHG) in multiphoton microscopy provide important new information.37,81
Finally, note that it is common to use mean values to represent experimental data when assessing whether statistically significant differences exist in particular metrics across multiple groups. When dealing with P-d and f-l data, such averaging must be accomplished over ranges of biaxial loading. In this regard, we create an average P-d data set for each protocol and each group by directly selecting values of the experimentally controlled variables (e.g., transmural pressure ranging from 10 to 140 mmHg at each axial stretch) while interpolating and averaging the associated experimentally observed variables (e.g., outer diameters and axial forces) for all samples in a group at each imposed condition. The associated axial stretches 5% below, 5% above, and at are averaged individually across a group. Similarly, an average f-l data set is obtained using imposed values of axial force (ranging, for example, from 0 to 1 gram for murine common carotid arteries) and pressure (e.g., at fixed values of 10, 60, 100, and 140 mmHg for passive testing) as experimentally controlled variables while again interpolating and averaging the experimentally observed variables (axial stretches and outer diameters) across a group for each imposed value of axial force and pressure. These average mechanical data sets can be used to compare visually the mean behaviors amongst multiple experimental groups, but also to quantify average mechanical properties within individual experimental groups. In the latter case, average P-d and f-l data should be combined with average unloaded dimensions (e.g., outer diameter and wall thickness) to form a comprehensive average data set that summarizes the properties of the vessels tested within each group. Illustrative examples of such mean data sets are discussed below.
Quantification
An advantage of pressure-diameter tests performed at or near the in vivo stretch is that the specimens experience near physiologic conditions. A disadvantage, however, is that measured quantities – namely, pressure, outer diameter, axial force, and length – are global, not local. Hence, data cannot be analyzed directly in terms of stress or strain as needed to assess directly the material stiffness. Yet, given the discovery that residual stresses tend to homogenize the transmural distribution of stresses under in vivo conditions in health,29,47 one can often employ the mean values of in-plane biaxial Cauchy stresses, namely
| (2) |
where P is the measured transmural pressure, f = fT + πa2P is the axial load applied to the closed-end arterial specimen (with fT representing the axial load measured directly by the force transducer), a is the inner deformed radius, and h is the deformed thickness. Typically, however, neither a nor h is measured on-line for most arteries. Because of the wide acceptance of the incompressibility constraint (i.e., isochoric motions) during transient loading, it proves useful to calculate a and h in one of two ways. First, as introduced by Gleason et al.31, if one can interactively measure inner and outer radii under static loading conditions, as needed to calculate the mean volume of the specimen V̅ at multiple discrete, fixed deformations (where V̅ = π (b2 − a2) l, with b the measured deformed outer radius, a the measured deformed inner radius, and l the deformed length over which volume is measured), one can then calculate for all subsequent deformations
| (3) |
Second, if one can measure the mean unloaded thickness H (e.g., via image analysis of cross-sections of excised rings, as seen in Flowchart 1, to determine multiple appropriately oriented radial projections between the unloaded inner and outer radii around the circumference) in addition to the unloaded axial length L and unloaded outer radius B, one can then calculate the mean volume V̅ in the unloaded configuration (where, V̅ = π (B2 − (B−H)2)L). Equation (3) can then be used similarly to calculate the deformed values of a and h based on on-line measurements of outer radius and length. Note that the first proposed method of measurement inherently depends upon the experimental system and is more suitable for thinner walled arteries (e.g., mouse common carotid) that are translucent upon back illumination, which is needed to identify the inner and outer radii via interactive measurements. Thus, the more general second method may be preferred for it applies consistently across different types of arteries (e.g., from the thicker ascending aorta to the thinner carotid).
Finally, note that associated mean biaxial wall stretches can be estimated by
| (4) |
where A and H are undeformed inner radius and wall thickness, and l and L are deformed and undeformed overall length, respectively. If possible, one should measure this axial stretch within a central gauge length (e.g., a length approximately equal to the diameter for a specimen that is 5 to 10 diameters in length), but this can be difficult when testing murine arteries. Instead, one can use overall length, though it is best if a correlation is determined between the gauge and overall measures of stretch for each vessel of interest.
Conceptually, the 2-D constitutive behavior can be quantified in terms of in-plane components of the Cauchy stress t and left stretch V tensors (which are referred to the same current configurations and share the same basis and objectivity transformation). For example, for a 2-D analysis
| (5) |
where the “^” distinguishes the function (right hand side) from the value of the function (left hand side) at a particular biaxial deformation. Of course, similar relations can be formulated in terms of components of the second Piola-Kirchhoff stress S and Green strain E tensors (which are referred to the same original configuration and share the same basis and objectivity transformation; they also form a conjugate pair whereby S = ∂W / ∂E). There are cases in the literature, however, wherein Cauchy stresses are plotted versus Green strains,37,81 which is conceptually inappropriate since these metrics are defined relative to different configurations and do not share a common basis. Associated “mixed” measures of stiffness should be avoided.
Equation 5 and similar functional relations are direct reminders of the importance of biaxial tests or at least pressure-diameter tests at multiple fixed axial stretches. The primary challenges, however, are to identify an appropriate functional form for the constitutive response and then to calculate the associated best-fit values of the model parameters. Toward this end, many different relations have been proposed, ranging from inappropriate linear relations34 (where we recall that Fung26 appropriately noted this point decades earlier, writing “The main difficulty lies in the customary use of [the] infinitesimal theory of elasticity to the media which normally exhibit finite deformations”) to purely phenomenological Fung-type exponentials,38 and to microstructurally-motivated relations.35,63,82 It is axiomatic, of course, that macroscopic behavior results from the underlying microstructure, that is, the mass fractions, orientations, cross-linking, and integrity of, as well as interactions amongst, the many different structural constituents. Given the continuing lack of complete microstructural information, however, we continue to use a microstructurally-motivated, yet phenomenological “four-fiber family model” of the passive behavior (even though many suggest that such relations are “structurally-based”, no current model is sufficiently based on the actual microstructural detail to warrant this term. Hence, we prefer the term “structurally-motivated”). This model is given by a (pseudo)strain energy function W of the form4,18,22,32
| (6) |
where c, and (i = 1,2,3,4) are material parameters, C = FTF is the right Cauchy-Green tensor, and F is the deformation gradient tensor.47 is a unit vector that denotes the orientation of a family of locally parallel fibers, where the angle is computed relative to the axial direction in a reference configuration. Note, too, that IC = trC and are coordinate invariant measures of deformation given by
| (7) |
for F = diag(λr, λϑ, λz). Upon enforcing incompressibility, λr = 1/ (λϑλz). This form of W is an extension of the two-fiber family model proposed by Holzapfel et al.,41 which was motivated by the assumed separate contributions to overall passive load bearing by an isotropic elastin-dominated matrix and multiple embedded families of collagen fibers; actually one could add another family of smooth muscle “fibers”, typically oriented in the circumferential direction.8 In practice, however, it is difficult to separate passive responses of circumferentially oriented collagen and smooth muscle fibers, hence we generally “lump” these two responses together within the four fiber family model. Note, too, that although detailed histology reveals in some central arteries that most collagen fibers are oriented in diagonal, not circumferential or axial, directions (cf. the human data reported by Schreifl et al.69), sufficient details are not yet available on the lateral cross-linking of collagen fibers or the physical entanglements or interactions amongst the different primary families of collagen fibers and other components of the matrix (e.g., proteoglycans, which can orient orthogonal to the collagen fibers15). Hence, we allow the four-fiber family model to capture yet unquantified consequences of oriented fibers and/or lateral cross-links. Indeed, Zeinali-Davarani et al.86 showed that a four-fiber family model is superior to a two- or three-fiber family model whereas including more than four families confers little advantage. Wan et al.82 further confirmed the utility of the four-fiber family model to fit biaxial data although they suggested that a tri-Gaussian distribution based model can provide even better predictions of data. This latter model requires more model parameters and detailed information on the fibrillar collagen organization (e.g., via multiphoton microscopy), which nonetheless was approximated via three Gaussian distributions without any information on possible lateral cross-linking.
Hence, albeit not a perfect constitutive model, the four-fiber family model continues to provide reasonable descriptions of the passive behavior of many arteries and has guided the development of related constitutive relations for arterial growth and remodeling.84 Toward this end, it must be recognized that Eq. 6 has been used primarily to quantify the mean behavior of murine arteries, that is, for a homogenized single-layer wall. Such approximations can provide useful predictions, even for growth and remodeling.55 Nevertheless, models that account for the multilayered construction of the arterial wall are preferred in many applications. It is important to note, therefore, that the original two-fiber family model proposed by Holzapfel et al.41 was used to describe separately the behavior of the media and adventitia, which effectively represents a four-fiber family model of a mathematically homogenized wall. Whereas it is easier to separate and test the different layers of the wall (media and adventitia, and sometimes intima) in human arteries,42,44 this remains technically problematic for murine arteries. Of course, the many advantages of genetic, pharmacological, and surgical models in mice demand their continued use despite technical challenges. As is often the case, therefore, one must balance advantages and disadvantages, while continuing to seek clever ways to achieve the ultimate goal – to formulate a constitutive relation that accounts for material nonuniformity (i.e., different constituents within a representative volume element) and material heterogeneity (i.e., different spatial distributions of such representative elements across multiple layers).
Regardless of the specific form of W, given the common assumption of incompressibility under transient loading, the passive Cauchy stress can be determined in 3-D as
| (8) |
where p is a Lagrange multiplier that enforces isochoric motions.47 Mean values of the Cauchy stress can be obtained easily from this relation via integration through the wall. Using Eq. 2, one can either calculate the mean stresses directly from experimental data or solve for the applied loads given theoretically determined Cauchy stresses from Eq. 8, thus allowing the identification of unknown model parameters in the strain energy function W (Eq. 6) via regression analyses. Just as there are different constitutive relations for arterial behavior, so too there are different methods for calculating the best-fit values of the model parameters. That is, different laboratories have used different nonlinear regression methods (e.g., Marquardt-Levenberg) and even different objective functions e to minimize. Among others, three candidate objective functions are
| (9) |
where th denotes a theoretically determined value and exp denotes an experimentally determined value; the overbar in function e3 denotes a mean value over all measurements. It should be noted that e1 is particularly useful when computing 2-D (i.e., membrane) plane stresses whereas objective functions written in terms of the actual applied pressures and axial forces can be used in either 2-D or 3-D (i.e., thick-walled) formulations. It is our experience that in the analysis of biaxial data from cylindrical segments of murine arteries, e1 tends to fit better the data at high loads whereas e2 tends to fit better the data at low loads. For this reason, we have recently adopted objective function e3,81 which provides a good compromise between the desire to fit data at both low (to assess primarily the contributions due to elastin) and high (to assess primarily the contributions due to fibrillar collagen) loads. Other objective functions can be found in the literature,18,32 but often are straightforward modifications of those listed above70 and similarly result in fits to data that have a preference toward either high or low load ranges.
Additional methods can be used to assess better the reliability of such parameter estimations. For example, we have advocated the use of a nonparametric bootstrap,22 which allows one to approximate probability distributions of the best-fit parameters by resampling experimental data. In particular, we employ a bootstrap to determine confidence intervals of parameters estimated via nonlinear regression, where the normality assumption (commonly made in linear regression via Gaussian distributions) may not be valid. In addition, the bootstrap proved itself to be a valuable tool to determine the uniqueness of the best-fit parameters since it allows one to determine the possible existence of multiple local minima within the parameter search space. In our previous analysis of biaxial data from healthy human aorta and abdominal aortic aneurysms,22 this bootstrap allowed us to conclude that observed differences in best-fit parameters were likely due to microstructural differences between different groups of samples, not due to convergence to different local minima within our regression algorithm.
Having an appropriate 3-D formulation (Eq. 8) allows one to consider many different aspects of the material behavior. Related to this issue, many investigators are concerned primarily with the behavior under in vivo conditions, not the full stress – strain relation. Hence, various “incremental moduli” have been proposed,3,7,34,58 not all of which are justified theoretically. Material stiffness is defined as a change in stress with respect to a change in a conjugate measure of strain (e.g., K = ∂S / ∂E), which requires mathematically that one assess changes with respect to one strain while holding fixed all other strains. Except in special cases, this operation must be accomplished theoretically, with an appropriate nonlinear relation as a starting point. Again, there is need for standardization to facilitate comparisons across laboratories. We prefer to use the theory of “small deformations superimposed on large”,73 which yields appropriate linearizations of stiffness based on a fully nonlinear, anisotropic (pseudo)strain energy function.4 For example, it can be shown that the “incremental” Cauchy stress can be written
| (10) |
where ε and Ω are the linearized strain and rotation, respectively. More importantly, the linearized moduli (Cijkl) associated with infinitesimal deformations about a finitely deformed state, in the absence of rotations, are given by
| (11) |
where to and t̂o are, respectively, the total and the deformation-dependent Cauchy stresses in the configuration about which the linearization is performed (often near mean arterial pressure, whereby the small deformations are from near the mean to either the diastolic or the systolic pressure), Fo are similarly the deformation gradients from an appropriate undeformed reference to the finitely deformed configuration, and C are associated components of the right Cauchy-Green tensor. It is thus easy to see that these “linearized moduli” depend on prestresses and prestrains at the state about which the linearization is performed, which can include residual stresses naturally. Ultimately, it is such values of linearized stiffness that are needed to inform many computational models of fluid-solid-interactions or fluid-solid-growth.24 In closing, it should also be emphasized that Baek et al.4 showed that the linearization should be performed about a configuration between diastole and systole, rather than at either of these commonly used configurations.
In addition, it also proves useful to compute and compare values of the strain energy W as a function of particular values of principal stretch (i.e., to evaluate W and plot values relative to the λz – λϑ plane). For example, by fixing the axial stretch at (i.e., the cross-over point in the f-l tests), one can calculate an associated value of circumferential stretch by prescribing a physiologically relevant value of pressure (e.g., mean arterial pressure or systolic pressure) and solving numerically the nonlinear equation for the associated λϑ. This procedure can then be repeated for many different principal stretch pairs, about which the associated stored energy or linearized stiffness moduli can be calculated. Hence, it is also possible to visualize the strain energy function W by plotting iso-energy contours evaluated for each set of parameters obtained from nonlinear regression.41 Again, we illustrate such evaluations below.
Finally, biaxial active mechanics has attracted much less attention, but appears to be important based on computational simulations6 and recent experimental studies.2,80 There is clearly a need for much more research along these lines. At present, however, most models consider only the circumferential active contribution as, for example,
| (12) |
where TM is the maximum value of contractile stress (which depends on calcium level) and λM and λ0 are circumferential stretches at which the active stress is maximal or zero, respectively.65 Active behavior is typically assessed during P-d tests using vasoconstrictors such as phenylephrine (PE), endothelin-1 (ET-1), or angiotensin-II (Ang-II) and similarly vasodilators such as acetylcholine (or carbamylcholine chloride, CCh) or sodium nitroprusside (SNP). High KCl solutions (often 80 mM or more) are also used by some to induce a sustained contraction. An important caveat is that empirical observations suggest that it is possible to damage the actinomyosin apparatus if the specimens are “over-pressurized” in vitro,13 hence we tend to use conservative ranges of pressurization during active tests (e.g., P from 10 to 100 mmHg). Again, see Flowchart 1. Regardless of the specific functional forms employed to model the observed behavior, the total Cauchy stress is given by t = tp + ta. Although specific functional forms for active behavior have not been validated against biaxial experimental data, a recently proposed modeling approach similarly decomposes the energy into passive and active contributions W = Wp + Wa and may provide important guidance for experimental studies 56,62,71
Characteristic Behaviors
That “form follows function” is a central dogma in physiology is perhaps no better illustrated than in large arteries. As one moves from the ascending aorta towards the muscular arteries that supply blood to organs such as the heart, brain, and kidneys, one finds that the percentage of intramural elastin decreases and that of smooth muscle increases while the relative thickness of the media decreases and that of the adventitia increases40. Such variations should be expected given that elastic fibers contribute primarily to the extreme compliance and resilience needed in large (central) arteries to augment left ventricular function and to dampen the pulse wave that propagates distally towards vital organs whereas the smooth muscle provides increased vasoactive control of distal flow distribution and thus local autoregulation.
Consistent with the procedure listed in Flowchart 1, we obtained Institutional Animal Care and Use (IACUC) approval to perform biaxial experiments on central arteries excised from male mice of diverse genotypes. Mice were euthanized by an overdose of sodium pentobarbital (150 mg/kg) given via an intraperitoneal injection. Arteries were then excised carefully, cannulated, placed within the aforementioned biaxial testing system, equilibrated, preconditioned, and tested under passive conditions (Hanks balanced solution). Figure 1a shows mean pressure-diameter responses (n = 5 each), at individual fixed in vivo axial stretches, for the common carotid artery (CCA – from the aorta to the carotid bifurcation), ascending thoracic aorta (ATA – from the aortic root to the brachiocephalic trunk), descending thoracic aorta (DTA – from the left subclavian artery to the third pair of intercostals), and infrarenal abdominal aorta (IAA – from the left renal artery to the iliac bifurcation). Although mean blood pressure necessarily drops with increasing distance from the heart, the associated gradient (dP/dz) is modest, thus it is reasonable to compare structural stiffnesses of central arteries at similar pressures (e.g., systolic or even MAP ∼ Pdias + (Psys − Pdias )/3, where, for example, MAP = 93 mmHg for Psys = 120 mmHg and Pdias = 80 mmHg). Of course, local volumetric flow decreases significantly with distance from the heart due to the distribution of blood to tissues via proximal branches (e.g., subclavian, intercostal, or renal arteries) as one moves from the heart toward the infrarenal aorta. Kassab and colleagues33,53 document the location of the primary branches off the normal mouse aorta, with the associated diameters, mean volumetric flow rates, and percent flow splits. Noting that wall thickness tends to be modulated by circumferential stress (the mean value of which is given by Eq. 2a) and inner radius tends to be modulated by wall shear stress (the mean value of which is typically computed under the assumption of steady and fully developed flow as 4μQ / πa3, where Q is the volumetric flow rate and a the inner radius), it is not surprising that normal wall thicknesses and diameters are very different for these vessels. Given the decreasing inner radius a and wall thickness h, and thus cross-sectional area (= πh(2a+h)), one would also expect the in vivo axial force to drop with distance from the heart (cf. Eq. 2b), which is borne out by the data (Figure 1b). Given the importance of central arterial stiffness and structural integrity, however, there is a pressing need to quantify and compare constitutive properties along the arterial tree in diverse genetic, pharmacological, and surgical mouse models. For illustrative purposes, we focus below on the common carotid artery, for which there are more comprehensive data sets.
Figure 1.
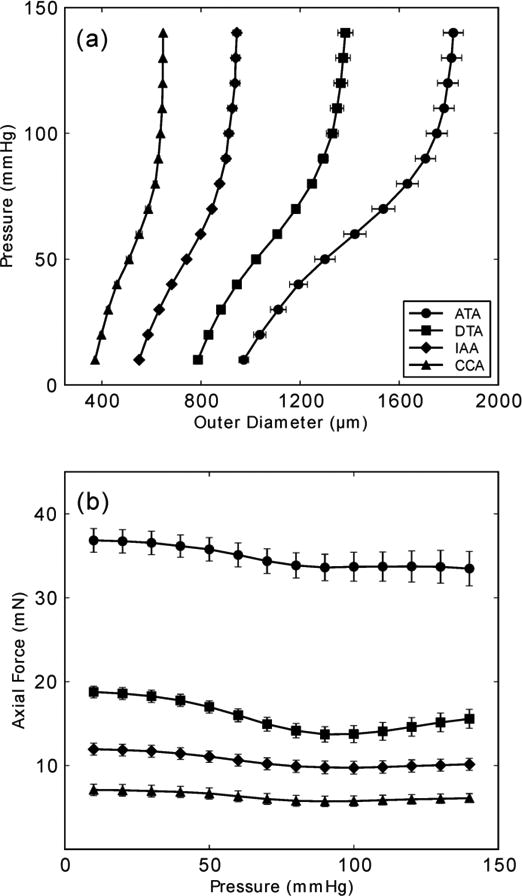
Mean pressure – diameter and transducer-measured axial force – pressure data from the ascending thoracic aorta (ATA), descending thoracic aorta (DTA), infrarenal abdominal aorta (IAA), and common carotid artery (CCA) from wild-type control mice (n = 5 each, with error bars denoting standard errors of the mean (SEM), which appear very small for vessels having a smaller caliber). All data shown was taken from unloading curves, which allows one to compute the stored energy that is available to do work on the blood during elastic recoil of the vessel. Note the significant differences in geometry and mechanics amongst these central arteries. Toward this end, note further that Collins et al.12 showed that the suprarenal abdominal aorta (SAA) and infrarenal abdominal aorta (IAA) exhibit a similar material stiffness despite a different structural stiffness (due to different inner radii and wall thicknesses), hence reducing the experimental need somewhat when mapping regional differences in the aorta.
Methods Illustrated For Carotids
Table 1 lists geometric, biomechanical, and associated information for common carotid arteries excised from control mice. Specifically, published data from heterozygous fibrillin-1 deficient mice (mgR/+)23 and unpublished data from α-smooth muscle actin wild-type mice (αSMA+/+) were grouped to obtain a large (n = 16) data set representative of normal carotid behavior in young (9 weeks of age) male mice. It should be noted that Eberth et al.18 previously showed that mgR/+ carotids have indistinguishable mechanical behavior relative to wild-type controls and, moreover, Hartner et al.36 reported similar blood pressures for mgR/+ and wild-type littermates in a study of induced hypertension. We also found no significant differences in the unloaded dimensions of αSMA+/+ and mgR/+ carotids in addition to no observed differences in the vessel geometry, Cauchy stresses, and linearized stiffnesses, each calculated at the average systolic blood pressure. Note that values of systolic blood pressure were obtained from the literature for each genotype (Schildmeyer et al.68 for αSMA+/+ and Hartner et al.36 for mgR/+). Overall, this compilation resulted in a low variability for many of the metrics reported in Table 1. This low variability within the data, combined with the genotypes sharing a common C57BL/6 background, confirms the homogeneity of the pooled data set.
Table 1.
Mean geometric, mechanical, and related information for common carotid arteries from n = 16 male control mice. All metrics depending on the model parameters (e.g., systolic dimensions, stress, and stiffness) were found by analyzing individual data and then averaging across the group. See Figures 2 – 5 for associated results from mechanical testing. A superscript “a” or “b” indicates data from Schildmeyer et al.68 or Hartner et al.,36 respectively.
| n | 16 |
| Age (weeks) | 9.0 ±1.5 |
| Body Mass (g) | 22.9 ± 3.5 |
| Systolic Blood Pressure (mmHg) | 116±7a,b |
| Unloaded Dimensions | |
| Outer Diameter (μm) | 394 ±34 |
| Wall Thickness (μm) | 94 ±15 |
| In vitro Axial Length (mm) | 4.66 ± 0.83 |
| Systolic Dimensions | |
| Outer Diameter (μm) | 647 ±38 |
| Wall Thickness (μm) | 26 ±3 |
| In vivo Axial Stretch | 1.72 ±0.07 |
| Systolic Cauchy Stresses (kPa) | |
| Circumferential | 177.4 ±20.4 |
| Axial | 199.8 ±29.5 |
| Systolic Stiffness (MPa) | |
| Circumferential | 1.46 ±0.38 |
| Axial | 3.03 ± 1.04 |
Figure 2 shows averaged responses for a subset of specimens (n = 5) subjected to both passive (top panels) and active (bottom panels) biaxial tests. The smooth muscle cells were activated with 10-5 M phenylephrine for the latter tests, which were initiated once the outer diameter reached a steady state at a constant pressure of 80 mmHg. The panels on the left and in the middle of Figure 2 show P-d and f-P responses during cyclic pressurization at three fixed axial stretches; the panels on the right show f-λz responses during cyclic extension at four different fixed pressures. The passive P-d data (top panels) revealed sigmoidal-type responses that are characteristic of elastic arteries in mice, which have higher ratios of elastin to collagen than those from larger mammals.52 The active data (bottom panels) revealed a characteristic leftward shift in the P-d responses, which is less marked in carotids than is common in muscular arteries.47,80 Note, too, that the pressure range was less in the active tests (i.e., up to 100 mmHg), which as discussed earlier serves to protect smooth muscle from mechanical damage. We confirmed that damage was minimized by checking for repeatable responses over multiple cycles. Such was not the case for earlier studies using active pressure-diameter testing.13
Figure 2.
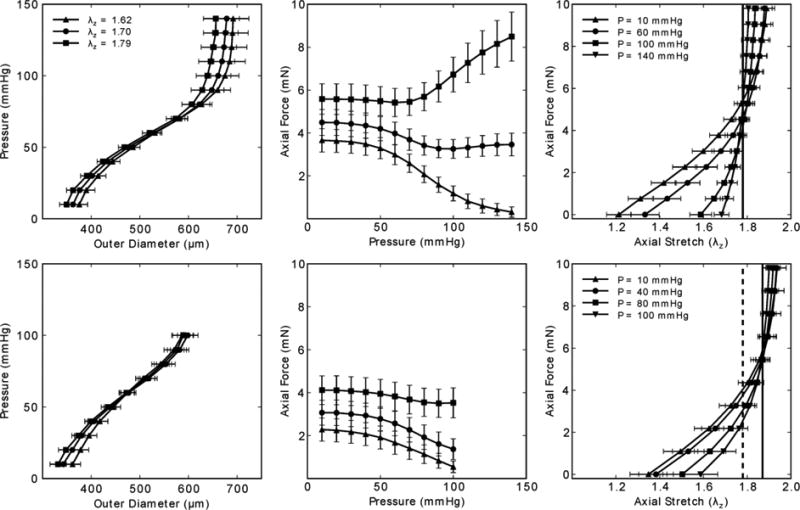
Mean pressure – diameter (left) and transducer-measured axial force – pressure (middle) data during cyclic P-d tests at multiple axial stretches, plus mean transducer-measured axial force – stretch data during cyclic f-l tests on common carotid arteries; the error bars show the SEM, with n = 5 each, which represents a sub-set of the overall n =16 control group. Note, too, that all data shown was taken from unloading curves. Passive results are shown in the top panels and active results (in response to [PE] = 10-5 M) in the bottom panels. Note in the bottom right panel that the “cross-over” point changed upon activation from (dashed vertical line) to (continuous vertical line).
The vertical lines in the f-λz data (right panels) mark the so-called “cross-over point” that van Loon et al.76 showed corresponds well with the in vivo axial stretch . Hence, as noted earlier, f-λz tests performed at multiple pressures represent a convenient method to assess in vitro. Indeed, for vessels that are likely deformed during surgical isolation, such as carotids due to the extension of the neck, this in vitro approach can be more reliable than direct in situ measurements. For vessels that do not undergo cyclic extension during the cardiac cycle (e.g., arteries other than the ascending thoracic aorta and coronaries), this unique characteristic of unchanging axial force during changes in pressure appears to be energetically favorable. For example, because work is defined as force acting through a distance, this characteristic behavior appears to minimize axial work. Further utility of this finding is reviewed for multiple studies on mouse carotid arteries by Humphrey et al.52 Notwithstanding the physiologic interpretation of , we submit that it also represents a consistent metric that can be used in vitro to compare biaxial mechanical properties of arteries from diverse genetically-modified, pharmacologically-treated, or surgically-altered mice as well as across different types of arteries (cf. Figure 1), which often experience different values of axial stretch in vivo. That is, although it can be informative to test different types of arteries at the same value of axial stretch,2,3 it is also important to compare responses measured at the individual axial stretches.17,21 Finally, the right panels in Figure 2 highlight the utility of in quantifying further the effects of smooth muscle cell contraction on the biaxial behavior. Consistent with the f-P data, the active f-λz responses show that increases upon contraction (e.g., a 5.1% increase from to ). Together with other results,2,6,80 such data remind us of limitations in commonly used models for active stress generation (e.g., Eq. 12), and thus the need for structurally-motivated modeling of multiaxial effects of smooth muscle activation.
Figure 3 illustrates the ability of the four fiber family model to simultaneously fit seven different biaxial protocols (three P-d and four f-l) from a representative data set, with associated best-fit parameters shown in Table 2. Although there is clearly a need for continued research to improve such fits, either via improved constitutive relations or improved regression methods, Figure 4 shows a reasonable ability of this constitutive relation to predict associated biaxial Cauchy stress – stretch data from multiple loading protocols. Given that such predictions are particularly good in the in vivo range, this gives added confidence for using the four-fiber family model to assess stiffness and to use it in clinically relevant stress analyses.
Figure 3.
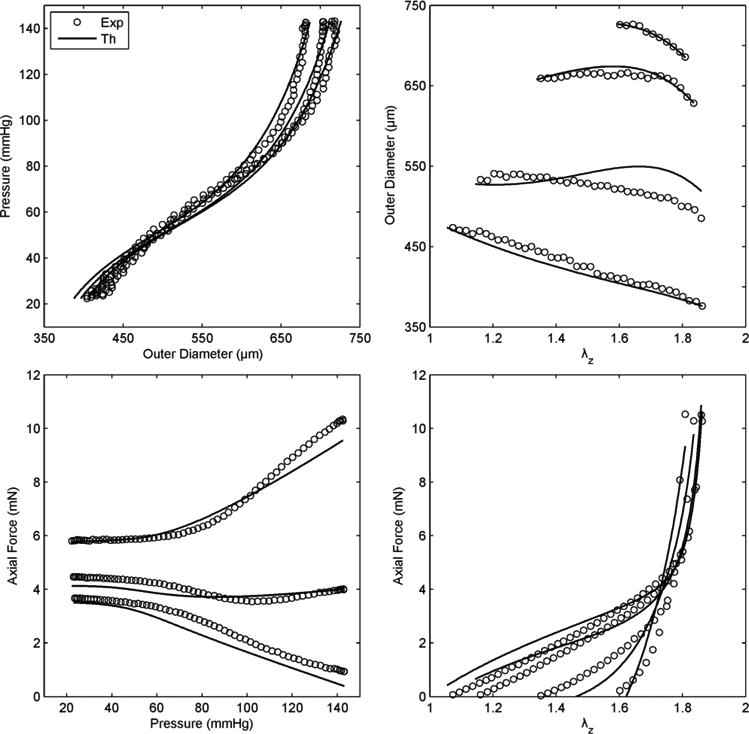
Representative fit (solid lines), via a single set of best-fit parameters for the four-fiber family model (Eq. 6, Table 2), to data (symbols, with only one-sixth of the actual data shown for visual clarity) for seven P-d and f-l protocols performed on a representative common carotid artery from a control mouse. Note the nearly constant force – pressure response (bottom left) indicating near in vivo stretch conditions.52
Table 2.
Best-fit values of model parameters for the four-fiber family model of the passive unloading behavior of common carotid arteries from n = 16 male control mice (cf Table 1). Shown in particular are comparisons of mean values based on fits to the individual specimens versus values based on fits to the averaged data. Also shown are comparisons for fits to the averaged data wherein different extents and types of data were used. See Figure 5 for associated implications of three particular approaches to calculate the stored energy and components of the linearized stiffness.
| Elastic Fibers | Axial Collagen | Circumferential Collagen | Diagonal Collagen | Error | |||||
|---|---|---|---|---|---|---|---|---|---|
|
|
|||||||||
| Averaging | c (kPa) | c11 (kPa) | c21 | c12 (kPa) | c22 | c13,4 (kPa) | c23,4 | a0 | RMSE |
| Data | 8.633 | 9.340 | 0.137 | 4.447 | 0.046 | 0.015 | 1.193 | 28.892 | 0.098 |
| Parameters | 9.028 | 10.554 | 0.172 | 4.572 | 0.056 | 0.695 | 1.270 | 31.080 | 0.117 |
|
| |||||||||
| Data Analysis | |||||||||
|
| |||||||||
| P-d, f-l | 8.633 | 9.340 | 0.137 | 4.447 | 0.046 | 0.015 | 1.193 | 28.892 | 0.098 |
| P-d, f | 9.598 | 12.402 | 0.054 | 3.215 | 0.060 | 0.013 | 1.241 | 30.966 | 0.068 |
| P-d | 7.628 | 3.251 | 1.056 | 6.426 | 6.68 × 10⁻⁹ | 9.91 × 10⁻⁵ | 1.646 | 43.144 | 0.059 |
Figure 4.
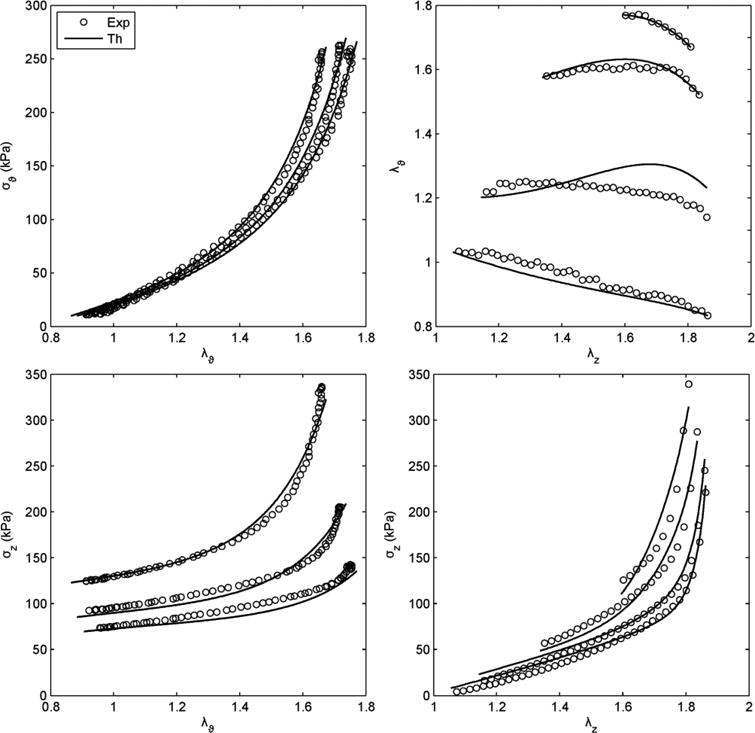
Prediction of Cauchy stress – stretch responses for the same data and fit shown in Figure 3. Note that the prediction was reasonable, particularly at the higher values of stretch.
Diverse approaches have been employed in the literature to reduce experimental data and quantify material and structural properties of tested specimens. Here, however, we analyze and discuss results obtained using our methods, which have evolved over the past 8 years. Averaging data has become common when plotting mechanical responses, but it is generally best to determine best-fit values of the model parameters for individual specimens and, if desired, to report either mean or median values thereof.22Table 2 shows, however, that in the case of common carotid arteries from control mice, mean values of the best-fit model parameters for all n = 16 passive specimens were very similar to the best-fit values determined via regressions on data averaged over these 16 specimens. Although one might prefer to use mean arterial pressure (MAP), herein we used the systolic pressure to evaluate the linearized stiffness due to the limited information on blood pressures in multiple mouse models. We found that Cϑϑϑϑ = 1.28 MPa (circumferential) and Czzzz = 2.99 MPa (axial) at end systole based on model parameters determined from the averaged data, which compared well with the values of 1.46 and 3.03 MPa that were based on mean values of parameters that were determined for individual specimens. Similarly, the cross-over point of for the average f-λz data at multiple pressures matched well the average in vivo axial stretch obtained from the cross-over points of individual extension (f-l) tests (cf. Table 1). Hence, we were able to use mean data that summarized accurately the biaxial mechanical properties of all specimens while exploiting the efficiency of using averages over large amounts of data. Albeit not shown, this close matching between averaged metrics (model parameters, stiffness, and in vivo stretch) and those obtained from averaged data has so far held across multiple genotypes and types of arteries, probably due to the relative homogeneity of specimens within each group of mice, which are fed and cared for in a standardized way. This observation illustrates further the utility of animal experiments in reducing the marked specimen-to-specimen variations that often exist when considering gender-and age-matched human samples.22
Given the different types of data used in the literature for parameter estimation, Table 2 shows further that best-fit values of model parameters depend strongly on both the type and extent of the data used in the regression. For example, we compared best-fit values determined from the mean data for three cases: (i) regressions including all data from seven combined P-d and f-l protocols, (ii) regressions including all data from three pressure-diameter protocols, with associated axial force information, and (iii) regressions based on pressure-diameter data alone. As it can be seen, the first two approaches yielded similar estimates whereas the third method yielded very different estimates, particularly for the axial parameters which varied randomly in each estimation given the absence of axial information. It should also be noted that the angle associated with the symmetric diagonally oriented fiber families increased with a decrease in the amount of axial data that was included in the estimation. Because of the importance of axial mechanics in both normal arterial homeostasis and adaptations,50,52 we recommend that axial data be included in all nonlinear regressions. Related to this issue, it is interesting that Cheng et al.8 chose to neglect an axial family of collagen fibers (while retaining diagonal families) despite including axial force data in their regression. Again, we recommend that the axial family be included based on some histological indication of its existence in mouse arteries,23 but even more so because of the yet unidentified contributions of possible lateral cross-links and physical entanglements amongst many of the families of collagen fibers. Figure 5 further illustrates the effects of including data from different protocols within the regression. The top panels show iso-energy contour plots of stored energy W for different theoretical combinations of circumferential and axial stretch. The left panel shows results for regressions that included data from all seven biaxial protocols (P-d, f-l); the middle panel shows results for the pressure-diameter protocols with the associated axial force included (P-d, f); and the right panel shows results based on pressure-diameter data alone (P-d). Again, one can see considerable agreement between the first two approaches, but poor results for the axial direction in the third approach as expected. Indeed, in the bottom panels we show associated results from the nonparametric bootstrap for linearized stiffness (cf. Eq. 11) for each case. Results are shown in circumferential and axial directions, with mean values of 1.28 MPa and 2.99 MPa, respectively. Again, the first two approaches gave similar results, with good fixed point estimates (cf. Table 2), whereas the third approach yielded unrealistic results for the axial component of stiffness. The histogram for the latter was nearly uniform and spread over a wide range of values as seen in the upper insert in the bottom right panel. Similarly to the collagen fiber angle, the predicted circumferential stiffness increased with less axial information included in the regression.
Figure 5.
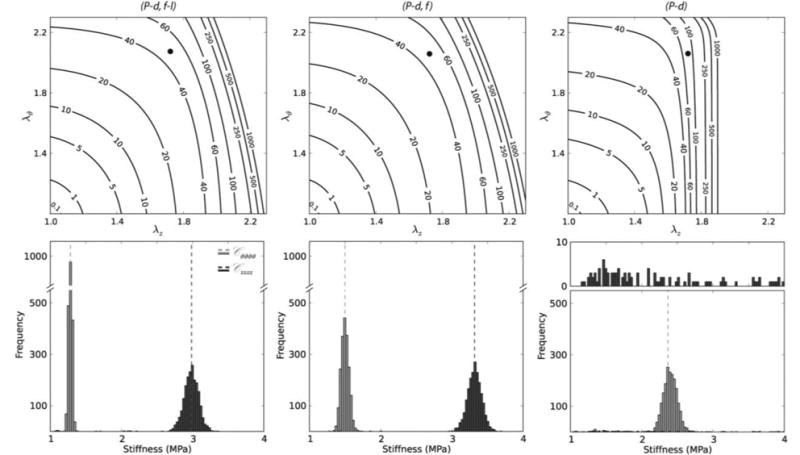
Stored energy W contours (top panels) and nonparametric bootstrap values of the circumferential and axial components of linearized stiffness (bottom panels), each based on the four-fiber family model and best-fit model parameters (Table 2) for averaged data for passive common carotid arteries from n = 16 control mice. Solid black dots in the top panels represent systolic values in the λz – λϑ plane at which the linearized stiffnesses were evaluated. The dashed vertical lines in the bottom panels represent values of circumferential (Cϑϑϑϑ) and axial (Czzzz) stiffness that were obtained using the averaged data set while the distributions were obtained via bootstrapping. In particular, results in the left panels are based on parameter estimations using the full biaxial data (P-d, f-l), results in the middle panels are based on parameter estimations using P-d data and associated axial forces (P-d, f), and results in the right panels are based on parameter estimations that used pressure-diameter data alone (P-d). See Table 1 for a comparison with values of stiffness obtained by analyzing individual data sets and Table 2 for the respective mean values of the model parameters. Note that the first two methods yielded similar results (P-d, f had slightly shifted distributions compared with those for P-d, f-l), but results based on pressure-diameter data (P-d) alone were markedly over estimated for the circumferential direction and simply not reliable for the axial direction (essentially yielding a random distribution with low frequency of occurrence over a wide range of stiffness values) as would be expected due to the absence of axial information.
Notwithstanding the in vivo importance of circumferential stress – stretch information, one must be careful not to over-interpret stiffness or anisotropy from data collected during a pressurization test at the in vivo stretch alone (i.e., data that are not from in-plane equibiaxial stretching tests47). For this reason, and because of the difficulty of biomechanically phenotyping arteries based on interpretations of differences in many model parameters across groups (cf. Table 2), it can be instructive to compare the energy W stored upon deformation, particularly at the in vivo state (see the filled circles in Figure 5, which denote energy stored at end systole). Albeit a subtle point, we suggest that because of the pseudoelastic behavior (i.e., slight energy dissipation as revealed by the different responses in loading and unloading; cf. Flowchart 1), it is more appropriate to compute W based on data obtained from the “unloading” curves for this reflects the energy that is actually stored in vivo (e.g., during systole) and is available to do work on the blood during diastole, one of the primary mechanical functions of central arteries. It is for this reason that we perform the nonlinear regressions on unloading data.
Referring back to Table 1, compilation of information on the animals (e.g., age, body mass, and genotype), geometry, and hemodynamic conditions is vital for comparison of results across different mouse models, including genetic, pharmacological, and surgical. In particular, reporting the unloaded geometry (axial length, outer or inner diameter, and wall thickness) together with the parameters of the strain energy function is fundamental to carry out rigorous biomechanical phenotyping and to allow exchange of information across different laboratories. Related to this, a question of importance is whether a particular artery can adapt well in response to perturbations in hemodynamic loading or whether compromised cellular function leads to mal-adaptation. Note, therefore, that many studies suggest that normal adaptive changes in arterial caliber and wall thickness tend to restore the mean wall shear stress (τw = 4μQ / πa3) and mean circumferential stress (σθ = Pa / h) toward homeostatic (i.e., original) values in response to sustained changes in blood flow and pressure, respectively.50 If in such cases we parameterize sustained changes in flow and pressure by the scalars ε and γ, respectively, then perturbed values of flow and pressure can be written as Q = εQo and P = γPo, with (°) denoting original values. It is then easy to show that restored wall shear and circumferential stress would require51
| (13) |
and associated changes in cross-sectional area, πh(2a+h), which can also be computed relative to homeostatic values. Such assessments will complement standard methods of quantification as we biomechanically phenotype different arteries and seek to correlate changes in structure, function, and mechanical properties with specific alterations in the function of endothelial cells, smooth muscle cells, and fibroblasts. Tabulated information should thus include both unloaded and in vivo dimensions, including the hemodynamic loads associated with the latter.
In summary, common carotid arteries are important conduits (with the vertebral arteries) of oxygenated blood to the brain. Diseases of the carotid arteries include atherosclerosis (often at or near the carotid bifurcation), stiffening with hypertension or aging, and sometimes dissection,59,60,72 hence they demand careful study. In addition, the nearly straight, circular, uniform thickness geometry devoid of major branches has long made the common carotid artery a favorite for biomechanical study, first in larger animals13,16 and now in mice. Whether testing common carotids or other central arteries, based on results presented in this section, we recommend that combined P-d and f-l protocols be used to assess biaxial mechanical behavior, but at the minimum one should include axial force information from pressure-diameter tests performed at multiple fixed axial stretches.
Conclusion
The stiffness and structural integrity of central arteries in the mouse stem primarily from the elastic fibers, fibrillar collagens, and smooth muscle, but other constituents as well (e.g., glycoproteins and glycosaminoglycans) – see Wagenseil and Mecham78 for an excellent discussion of arterial composition and Humphrey et al.52 for a discussion of correlations between elastin:collagen ratios and in vivo properties. Indeed, elastic fibers consist primarily of elastin (∼90%), but also microfibrils (mainly fibrillin-1, 2) and associated glycoproteins (e.g., fibulins, microfibrillar associated glycoproteins, and emilins). Similarly, fibrillar collagens include both type I and type III collagen, but associated collagens (e.g., type V) and proteoglycans (e.g., decorin and biglycan) as well. Finally, the primary structural constituents within smooth muscle are actin and myosin, but other proteins (e.g., intermediate filaments) are also important. There is clearly much to be done to uncover individual contributions by these many constituents, and their interactions, particularly given that such contributions can vary depending on the time of development or degree of aging or disease. Until such insight is realized, constitutive relations will remain, at best, microstructurally motivated, not microstructurally based.
Genetically modified mice, particularly those manifesting interesting or clinically relevant vascular phenotypes, provide a tremendous resource for delineating contributions to overall arterial stiffness or structural integrity by different extracellular matrix proteins, glycoproteins, and glycosaminoglycans, different types of cell-matrix interactions (e.g., via integrins or related complexes such as the sarcoglycan-delta complex), and different cell-cell interactions (e.g., different cadherins). The primary caveat, of course, is that compensatory mechanisms can manifest during development in genetically modified mice, which may or not be relevant to an inherited human disease depending on the time course of manifestation. Compensatory mechanisms can be avoided, in part, by studying conditional knockouts, which again should be motivated by clinical relevance; such studies remain an important need, however.
It should also be noted that consequences of genetic mutations may or may not manifest under normal hemodynamic conditions (e.g., some are even embryonic lethal) or at common ages of study (e.g., 9 – 12 weeks of age). There is often a need, therefore, to challenge genetically modified mice with imposed perturbations in hemodynamic loading (e.g., aortic banding20). Indeed, pharmacologically-treated and surgically-altered mice provide a tremendous opportunity to determine how arteries adapt, or mal-adapt, in response to altered mechano- and chemo-stimuli, information that is vitally important for understanding many aspects of disease progression and possible responses to treatment. Again complicating the interpretation of such data, however, are possible compensatory adaptations. Surgically-induced changes in blood pressure or flow in a particular large artery can change over time via adaptive changes in distal beds in an attempt by the vasculature to autoregulate or to maintain or restore homeostasis locally. There is, therefore, a pressing need for improved methods for long-term assessment of arterial geometry, biology, and mechanics as they change.
As discussed herein, and illustrated in Flowchart 1, it is now technically possible to perform a host of useful experiments on arteries excised from mice (see, too, the experiments performed on mice during development79). To exploit the many advantages of genetic, pharmacological, and surgical murine models, however, we as a community should begin to standardize testing protocols and methods for quantification or at least seek correlations between results obtained using different methods; the former would certainly be simpler, but the latter could yield a greater benefit. Moreover, we need to begin to compare more broadly across genetically modified models rather than the usual comparison of a single modified model versus an age-matched, wild-type control. For example, we have tested common carotid arteries from six different genetically modified mouse models (mgR/mgR,18,23 αSMA-/-, ApoE-/-,5 Fbln5-/-, mdx and sgcd-/- 17,32), but we have not carefully compared results across studies and there are certainly many more models that are available and have not been tested biaxially or compared quantitatively. Similarly, we and others have considered effects of a continuous 4-week infusion of angiotensin II,5,38 but additional pharmacological models merit detailed biomechanical phenotyping as well (e.g., β-aminopropionitrile (BAPN) treatment54). Of course, in some of these different models, the phenotype of interest results in complex geometries, which in turn necessitates more sophisticated methods of mechanical quantification. Toward this end, Hayenga et al.39 employed atomic force microscopy to assess regional variations in atherosclerotic plaque stiffness and Genovese et al.30 presented a new panoramic – Digital Image Correlation (p-DIC) method for quantifying full-field strains in mouse arteries having complex geometry. These and similar technical advances will be needed to assess mechanical properties rigorously, particularly when regional variations are expected. Clearly, much has been accomplished but much more work remains. We submit that increased standardization and collaboration across laboratories will enable our community to hasten the requisite data collection and thereby the rate at which we are able to learn from these many valuable murine models. Given the importance of changes in arterial stiffness and structural integrity in so many diseases, the importance of this work is evident.
Acknowledgments
This work was supported, in part, by grants from the NIH (R01 HL-105297, R21 HL-107768). We are grateful for the insightful comments by the reviewers, which resulted in a significant revision to present more details on methods for testing and quantification that might help lead to increased standardization. JF and MRB thank Dr. Sara Roccabianca for providing an implementation of the theory of “small on large” that was integrated within our custom code for data analysis. JDH also acknowledges colleagues (Drs. Vince Gresham, Emily Wilson, and Alvin Yeh) and former students (Rudy L. Gleason, Ph.D., Wendy W. Dye, M.S., John F. Eberth, Ph.D., Heather N. Hayenga, Ph.D., Anne I. Taucer, M.S., and Melissa J. Collins, Ph.D) who contributed so much to this overall work on murine arterial mechanics and mechanobiology.
Footnotes
Conflicts of Interest: none
References
- 1.Adji A, O'Rourke MF, Namasivayam M. Arterial stiffness, its assessment, prognostic value, and implications for treatment. Am J Hypertens. 2011;24:5–17. doi: 10.1038/ajh.2010.192. [DOI] [PubMed] [Google Scholar]
- 2.Agianniotis A, Rachev A, Stergiopulos N. Active axial stress in mouse aorta. J Biomech. 2012;45:1924–1927. doi: 10.1016/j.jbiomech.2012.05.025. [DOI] [PubMed] [Google Scholar]
- 3.Agianniotis A, Stergiopulos N. Wall properties of the apolipoprotein E-deficient mouse aorta. Atherosclerosis. 2012;223:314–320. doi: 10.1016/j.atherosclerosis.2012.06.014. [DOI] [PubMed] [Google Scholar]
- 4.Baek S, Gleason RL, Rajagopal KR, Humphrey JD. Theory of small on large: potential utility in computations of fluid–solid interactions in arteries. Comp Meth Appl Mech Engr. 2007;196:3070–3078. [Google Scholar]
- 5.Bersi MR, Collins MJ, Wilson E, Humphrey JD. Disparate changes in the mechanical properties of murine carotid arteries and aorta in response to chronic infusion of angiotensin-II. Int J Adv Engr Sci Appl Math. 2012 doi: 10.1007/s12572-012-0052-4. in press. [DOI] [PMC free article] [PubMed] [Google Scholar]
- 6.Cardamone L, Valentín A, Eberth JF, Humphrey JD. Modelling carotid artery adaptations to dynamic alterations in pressure and flow over the cardiac cycle. Math Med Biol. 2010;27:343–371. doi: 10.1093/imammb/dqq001. [DOI] [PMC free article] [PubMed] [Google Scholar]
- 7.Carta L, Wagenseil JE, Knutsen RH, Mariko B, Faury G, Davis EC, Starcher B, Mecham RP, Ramirez F. Discrete contributions of elastic fiber components to arterial development and mechanical compliance. Arterioscl Thromb Vasc Biol. 2009;29:2083–2089. doi: 10.1161/ATVBAHA.109.193227. [DOI] [PMC free article] [PubMed] [Google Scholar]
- 8.Cheng JK, Stoilov I, Mecham RP, Wagenseil JE. A fiber-based constitutive model predicts changes in amount and organization of matrix proteins with development and disease in the mouse aorta. Biomech Model Mechanobiol. 2012 doi: 10.1007/s10237-012-0420-9. in press. [DOI] [PMC free article] [PubMed] [Google Scholar]
- 9.Chung AWY, Yeung KA, Sandor GGS, Judge DP, Dietz HC, van Breemen C. Loss of elastic fiber integrity and reduction of vascular smooth muscle contraction resulting from the upregulated activities of matrix metalloproteinase-2 and -9 in the thoracic aortic aneurysm in Marfan syndrome. Circ Res. 2007;101:512–522. doi: 10.1161/CIRCRESAHA.107.157776. [DOI] [PubMed] [Google Scholar]
- 10.Chung AWY, Yang HHC, van Breeman C. Imbalanced synthesis of cyclooxygenase-derived thromboxane A2 and prostacyclin compromises vasomotor function of the thoracic aorta in Marfan syndrome. Brit J Pharmacol. 2007;152:305–312. doi: 10.1038/sj.bjp.0707391. [DOI] [PMC free article] [PubMed] [Google Scholar]
- 11.Chuong CJ, Fung YC. On residual stresses in arteries. J Biomech Engr. 1986;108:189–192. doi: 10.1115/1.3138600. [DOI] [PubMed] [Google Scholar]
- 12.Collins MJ, Bersi MR, Wilson E, Humphrey JD. Mechanical properties of suprarenal and infrarenal abdominal aorta: implications for mouse models of aneurysms. Med Engr Phys. 2011;33:1262–1269. doi: 10.1016/j.medengphy.2011.06.003. [DOI] [PMC free article] [PubMed] [Google Scholar]
- 13.Cox RH. Regional variation of series elasticity in canine arterial smooth muscle. Am J Physiol Heart Circ Physiol. 1978;234:H542–551. doi: 10.1152/ajpheart.1978.234.5.H542. [DOI] [PubMed] [Google Scholar]
- 14.Cox RH. Comparison of arterial wall mechanics using ring and cylindrical segments. Am J Physiol Heart Circ Physiol. 1983;244:H298–303. doi: 10.1152/ajpheart.1983.244.2.H298. [DOI] [PubMed] [Google Scholar]
- 15.Dingemans KP, Teeling P, Lagendijk JH, Becker AE. Extracellular matrix of the human aortic media: an ultrastructural histochemical and immunohistochemical study of the adult aortic media. Anat Rec. 2000;258:1–14. doi: 10.1002/(SICI)1097-0185(20000101)258:1<1::AID-AR1>3.0.CO;2-7. [DOI] [PubMed] [Google Scholar]
- 16.Dobrin PB. Biaxial anisotropy of dog carotid artery: Estimation of circumferential elastic modulus. J Biomech. 1986;19:351–358. doi: 10.1016/0021-9290(86)90011-4. [DOI] [PubMed] [Google Scholar]
- 17.Dye WW, Gleason RL, Wilson E, Humphrey JD. Altered biomechanical properties of carotid arteries in two mouse models of muscular dystrophy. J Appl Physiol. 2007;103:664–672. doi: 10.1152/japplphysiol.00118.2007. [DOI] [PubMed] [Google Scholar]
- 18.Eberth JF, Taucer AI, Wilson E, Humphrey JD. Mechanics of carotid arteries in a mouse model of Marfan Syndrome. Annls Biomed Eng. 2009;37:1093–1104. doi: 10.1007/s10439-009-9686-1. [DOI] [PMC free article] [PubMed] [Google Scholar]
- 19.Eberth JF, Gresham VC, Reddy AK, Popovic N, Wilson E, Humphrey JD. Importance of pulsatility in hypertensive carotid artery growth and remodeling. J Hyptertens. 2009;27:2010–2021. doi: 10.1097/HJH.0b013e32832e8dc8. [DOI] [PMC free article] [PubMed] [Google Scholar]
- 20.Eberth JF, Popovic N, Gresham VC, Wilson E, Humphrey JD. Time course of carotid artery growth and remodeling in response to altered pulsatility. Am J Physiol Heart Circ Physiol. 2010;299:H1875–1883. doi: 10.1152/ajpheart.00872.2009. [DOI] [PMC free article] [PubMed] [Google Scholar]
- 21.Eberth JF, Cardamone L, Humphrey JD. Evolving biaxial mechanical properties of mouse carotid arteries in hypertension. J Biomech. 2011;44:2532–2537. doi: 10.1016/j.jbiomech.2011.07.018. [DOI] [PMC free article] [PubMed] [Google Scholar]
- 22.Ferruzzi J, Vorp DA, Humphrey JD. On constitutive descriptors of the biaxial mechanical behaviour of human abdominal aorta and aneurysms. J Roy Soc Interface. 2011;8:435–50. doi: 10.1098/rsif.2010.0299. [DOI] [PMC free article] [PubMed] [Google Scholar]
- 23.Ferruzzi J, Collins MJ, Yeh AT, Humphrey JD. Mechanical assessment of elastin integrity in fibrillin-1-deficient carotid arteries: implications for Marfan syndrome. Cardiovasc Res. 2011;92:287–295. doi: 10.1093/cvr195. [DOI] [PMC free article] [PubMed] [Google Scholar]
- 24.Figueroa CA, Baek S, Taylor CA, Humphrey JD. A Computational Framework for Fluid-Solid-Growth Modeling in Cardiovascular Simulations. Comp Meth Appl Mech Engr. 2009;198:3583–3602. doi: 10.1016/j.cma.2008.09.013. [DOI] [PMC free article] [PubMed] [Google Scholar]
- 25.Fleenor BS, Marshall KD, Durrant JR, Lesniewski LA, Seals DR. Arterial stiffening with ageing is associated with transforming growth factor-β1 -related changes in adventitial collagen: reversal by aerobic exercise. J Physiol. 2010;588:3971–3982. doi: 10.1113/jphysiol.2010.194753. [DOI] [PMC free article] [PubMed] [Google Scholar]
- 26.Fung YC. Elasticity of soft tissues in simple elongation. Am J Physiol. 1967;213:1532–1544. doi: 10.1152/ajplegacy.1967.213.6.1532. [DOI] [PubMed] [Google Scholar]
- 27.Fung YC. Biorheology of soft tissues. Biorheology. 1973;10:139–155. doi: 10.3233/bir-1973-10208. [DOI] [PubMed] [Google Scholar]
- 28.Fung YC, Fronek K, Patitucci P. Pseudoelasticity of arteries and the choice of its mathematical expression. Am J Physiol Heart Circ Physiol. 1979;237:H620–H631. doi: 10.1152/ajpheart.1979.237.5.H620. [DOI] [PubMed] [Google Scholar]
- 29.Fung YC. Biomechanics: motion, flow, stress, and growth. Springer; NY: 1990. [Google Scholar]
- 30.Genovese K, Collins MJ, Lee YU, Humphrey JD. Regional finite strains in an angiotensin-II infusion model of dissecting abdominal aortic aneurysms. J Cardiovasc Engr Tech. 2012;3:194–202. [Google Scholar]
- 31.Gleason RL, Gray SP, Wilson E, Humphrey JD. A multiaxial computer-controlled organ culture and biomechanical device for mouse carotid arteries. J Biomech Engr. 2004;126:787–795. doi: 10.1115/1.1824130. [DOI] [PubMed] [Google Scholar]
- 32.Gleason RL, Dye WW, Wilson E, Humphrey JD. Quantification of the mechanical behavior of carotid arteries from wild-type, dystrophin-deficient, and sarcoglycan-delta knockout mice. J Biomech. 2008;41:3213–3218. doi: 10.1016/j.jbiomech.2008.08.012. [DOI] [PMC free article] [PubMed] [Google Scholar]
- 33.Guo X, Kono Y, Mattrey R, Kassab GS. Morphometry and strain distribution of the C57BL/6 mouse aorta. Am J Physiol Heart Circ Physiol. 2002;283:H1829–1837. doi: 10.1152/ajpheart.00224.2002. [DOI] [PubMed] [Google Scholar]
- 34.Guo X, Kassab GS. Variation in mechanical properties along the length of the aorta in C57bl/6 mice. Am J Physiol Heart Circ Physiol. 2003;285:H2614–2622. doi: 10.1152/ajpheart.00567.2003. [DOI] [PubMed] [Google Scholar]
- 35.Hansen L, Wan W, Gleason RL. Microstructurally motivated constitutive modeling of mouse arteries cultured under altered axial stretch. J Biomech Engr. 2009;131:101015. doi: 10.1115/1.3207013. [DOI] [PMC free article] [PubMed] [Google Scholar]
- 36.Hartner A, Schaefer L, Porst M, Cordasic N, Gabriel A, Klanke B, Reinhardt DP, Hilgers KF. Role of fibrillin-1 in hypertensive and diabetic glomerular disease. Am J Physiol Ren Physiol. 2006;290:F1329–1336. doi: 10.1152/ajprenal.00284.2005. [DOI] [PubMed] [Google Scholar]
- 37.Haskett D, Doyle JJ, Gard C, Chen H, Ball C, Estabrook MA, Encinas AC, Dietz HC, Utzinger U, Vande Geest JP, Azhar M. Altered tissue behavior of a non-aneurysmal descending thoracic aorta in the mouse model of Marfan syndrome. Cell Tiss Res. 2012;347:267–277. doi: 10.1007/s00441-011-1270-y. [DOI] [PubMed] [Google Scholar]
- 38.Haskett D, Speicher E, Fouts M, Larson D, Azhar M, Utzinger U, Vande Geest JP. The effects of angiotensin II on the coupled microstructural and biomechanical response of C57BL/6 mouse aorta. J Biomech. 2012;45:772–779. doi: 10.1016/j.jbiomech.2011.11.017. [DOI] [PubMed] [Google Scholar]
- 39.Hayenga HN, Trache A, Trzeciakowski J, Humphrey JD. Regional atherosclerotic plaque properties in ApoE-/- mice measured by atomic force, immunofluroescence, and light microscopy. J Vasc Res. 2011;48:495–504. doi: 10.1159/000329586. [DOI] [PubMed] [Google Scholar]
- 40.Hayenga HN, Hu JJ, Meyer CA, Wilson E, Hein TW, Kuo L, Humphrey JD. Differential progressive remodeling of coronary and cerebral arteries and arterioles in an aortic coarctation model of hypertension. Front Physio. 2012;3:420. doi: 10.3389/fphys.2012.00420. [DOI] [PMC free article] [PubMed] [Google Scholar]
- 41.Holzapfel GA, Gasser TC, Ogden RW. A new constitutive framework for arterial wall mechanics and a comparative study of material models. J Elast. 2000;61:1–48. [Google Scholar]
- 42.Holzapfel GA, Sommer G, Gasser CT, Regitnig P. Determination of layer-specific mechanical properties of human coronary arteries with nonatherosclerotic intimal thickening and related constitutive modeling. Am J Physiol Heart Circ Physiol. 2005;289:H2048–2058. doi: 10.1152/ajpheart.00934.2004. [DOI] [PubMed] [Google Scholar]
- 43.Holzapfel GA. Determination of material models for arterial walls from uniaxial extension tests and histological structure. J Theor Biol. 2006;238:290–302. doi: 10.1016/j.jtbi.2005.05.006. [DOI] [PubMed] [Google Scholar]
- 44.Holzapfel GA, Sommer G, Auer M, Regitnig P, Ogden RW. Layer-specific 3D residual deformations of human aortas with non-atherosclerotic intimal thickening. Annl Biomed Engr. 2007;35:530–45. doi: 10.1007/s10439-006-9252-z. [DOI] [PubMed] [Google Scholar]
- 45.Hu JJ, Ambrus A, Fossum TW, Miller MW, Humphrey JD, Wilson E. Time courses of growth and remodeling of porcine aortic media during hypertension: a quantitative immunohistochemical examination. J Histochem Cytochem. 2008;56:359–370. doi: 10.1369/jhc.7A7324.2007. [DOI] [PMC free article] [PubMed] [Google Scholar]
- 46.Humphrey JD. Stress, strain, and mechanotransduction in cells. J Biomech Engr. 2001;123:638–641. doi: 10.1115/1.1406131. [DOI] [PubMed] [Google Scholar]
- 47.Humphrey JD. Cells, Tissues, and Organs. Springer; NY: 2002. Cardiovascular Solid Mechanics. [Google Scholar]
- 48.Humphrey JD, Rajagopal KR. A constrained mixture model for growth and remodeling of soft tissues. Math Model Meth Appl Sci. 2002;12:407–430. [Google Scholar]
- 49.Humphrey JD, Delange SL. An Introduction to Biomechanics: Solids and Fluids, Analysis and Design. Springer; NY: 2004. [Google Scholar]
- 50.Humphrey JD. Vascular adaptation and mechanical homeostasis at tissue, cellular, and subcellular levels. Cell Biochem Biophys. 2008;50:53–78. doi: 10.1007/s12013-007-9002-3. [DOI] [PubMed] [Google Scholar]
- 51.Humphrey JD. Mechanisms of arterial remodeling in hypertension: coupled roles of wall shear and intramural stress. Hypertension. 2008;52:195–200. doi: 10.1161/HYPERTENSIONAHA.107.103440. [DOI] [PMC free article] [PubMed] [Google Scholar]
- 52.Humphrey JD, Eberth JF, Dye WW, Gleason RL. Fundamental role of axial stress in compensatory adaptations by arteries. J Biomech. 2009;42:1–8. doi: 10.1016/j.jbiomech.2008.11.011. [DOI] [PMC free article] [PubMed] [Google Scholar]
- 53.Huo Y, Guo X, Kassab GS. The flow field along the entire length of mouse aorta and primary branches. Annls Biomed Engr. 2008;36:685–699. doi: 10.1007/s10439-008-9473-4. [DOI] [PubMed] [Google Scholar]
- 54.Kanematsu Y, Kanematsu M, Kurihara C, Tsou TL, Nuki Y, Liang EI, Makino H, Hashimoto T. Pharmacologically induced thoracic and abdominal aortic aneurysms in mice. Hypertension. 2010;55:1267–74. doi: 10.1161/HYPERTENSIONAHA.109.140558. [DOI] [PMC free article] [PubMed] [Google Scholar]
- 55.Karšaj I, Sorić J, Humphrey JD. A 3-D framework for arterial growth and remodeling in response to altered hemodynamics. Int J Eng Sci. 2010;48:1357–1372. doi: 10.1016/j.ijengsci.2010.06.033. [DOI] [PMC free article] [PubMed] [Google Scholar]
- 56.Kroon M. A constitutive model for smooth muscle including active tone and passive viscoelastic behaviour. Math Med Biol. 2010;27:129–155. doi: 10.1093/imammb/dqp017. [DOI] [PubMed] [Google Scholar]
- 57.Lakatta EG, Wang M, Najjar SS. Arterial aging and subclinical arterial disease are fundamentally intertwined at macroscopic and microscopic levels. Med Clin N Am. 2009;93:583–604. doi: 10.1016/j.mcna.2009.02.008. [DOI] [PMC free article] [PubMed] [Google Scholar]
- 58.Mariko B, Pezet M, Escoubet B, Bouillot S, Andrieu JP, Starcher B, Quaglino D, Jacob MP, Huber P, Ramirez F, Faury G. Fibrillin-1 genetic deficiency leads to pathological ageing of arteries in mice. J Pathol. 2011;224:33–44. doi: 10.1002/path.2840. [DOI] [PMC free article] [PubMed] [Google Scholar]
- 59.Masson I, Boutouyrie P, Laurent S, Humphrey JD, Zidi M. Characterization of arterial wall mechanical properties and stresses from human clinical data. J Biomech. 2008;41:2618–2627. doi: 10.1016/j.jbiomech.2008.06.022. [DOI] [PMC free article] [PubMed] [Google Scholar]
- 60.Matlung HL, Neele AE, Groen HC, van Gaalen K, Tuna BG, van Weert A, de Vos J, Wentzel JJ, Hoogenboezem M, van Buul JD, Vanbavel E, Bakker ENTP. Transglutaminase activity regulates atherosclerotic plaque composition at locations exposed to oscillatory shear stress. Atherosclerosis. 2012;224:355–362. doi: 10.1016/j.atherosclerosis.2012.07.044. [DOI] [PubMed] [Google Scholar]
- 61.Milewicz DM, Guo DC, Tran-Fadulu V, Lafont AL, Papke CL, Inamoto S, Kwartler CS, Pannu H. Genetic basis of thoracic aortic aneurysms and dissections: focus on smooth muscle cell contractile dysfunction. Ann Rev Genom Hum Genet. 2008;9:283–302. doi: 10.1146/annurev.genom.8.080706.092303. [DOI] [PubMed] [Google Scholar]
- 62.Murtada SI, Kroon M, Holzapfel GA. A calcium-driven mechanochemical model for prediction of force generation in smooth muscle. Biomech Model Mechanobiol. 2010;9:749–762. doi: 10.1007/s10237-010-0211-0. [DOI] [PubMed] [Google Scholar]
- 63.Ning J, Xu S, Wang Y, Lessner SM, Sutton MA, Anderson K, Bischoff JE. Deformation measurements and material property estimation of mouse carotid artery using a microstructure-based constitutive relation. J Biomech Engr. 2010;132:121010. doi: 10.1115/1.4002700. [DOI] [PubMed] [Google Scholar]
- 64.Pezet M, Jacob MP, Escoubet B, Gheduzzi D, Tillet E, Perret P, Huber P, Quaglino D, Vranckx R, Li DY, Starcher B, Boyle WA, Mecham RP, Faury G. Elastin haplo-insufficiency induces alternative aging processes in the aorta. Rejuven Res. 2008;11:97–112. doi: 10.1089/rej.2007.0587. [DOI] [PMC free article] [PubMed] [Google Scholar]
- 65.Rachev A, Hayashi K. Theoretical study of the effects of vascular smooth muscle contraction on strain and stress distributions in arteries. Annls Biomed Engr. 1999;27:459–468. doi: 10.1114/1.191. [DOI] [PubMed] [Google Scholar]
- 66.Safar ME. Arterial aging – hemodynamic changes and therapeutic options. Nat Rev Cardiol. 2010;7:442–449. doi: 10.1038/nrcardio.2010.96. [DOI] [PubMed] [Google Scholar]
- 67.Sakalihasan N, Limet R, Defawe OD. Abdominal aortic aneurysm. Lancet. 2005;365:1577–1589. doi: 10.1016/S0140-6736(05)66459-8. [DOI] [PubMed] [Google Scholar]
- 68.Schildmeyer LA, Braun R, Taffet G, Debiasi M, Burns AE, Bradley A, Schwartz RJ. Impaired vascular contractility and blood pressure homeostasis in the smooth muscle alpha-actin null mouse. FASEB J. 2000;14:2213–2220. doi: 10.1096/fj.99-0927com. [DOI] [PubMed] [Google Scholar]
- 69.Schriefl AJ, Zeindlinger G, Pierce DM, Regitnig P, Holzapfel GA. Determination of the layer-specific distributed collagen fibre orientations in human thoracic and abdominal aortas and common iliac arteries. J Roy Soc Interface. 2012;9:1275–1286. doi: 10.1098/rsif.2011.0727. [DOI] [PMC free article] [PubMed] [Google Scholar]
- 70.Sommer G, Holzapfel GA. 3D constitutive modeling of the biaxial mechanical response of intact and layer-dissected human carotid arteries. J Mech Behav Biomed Mater. 2012;5:116–128. doi: 10.1016/j.jmbbm.2011.08.013. [DOI] [PubMed] [Google Scholar]
- 71.Stålhand J, Klarbring A, Holzapfel GA. A mechanochemical 3D continuum model for smooth muscle contraction under finite strains. J Theor Biol. 2011;268:120–130. doi: 10.1016/j.jtbi.2010.10.008. [DOI] [PubMed] [Google Scholar]
- 72.Stevic I, Chan HHW, Chan AKC. Carotid artery dissections: thrombosis of the false lumen. Thromb Res. 2011;128:317–324. doi: 10.1016/j.thromres.2011.06.024. [DOI] [PubMed] [Google Scholar]
- 73.Truesdell C, Noll W. The Nonlinear Field Theories of Mechanics. In: Flugge S, editor. Handbuch der Physik. Springer; Berlin,: 1965. [Google Scholar]
- 74.Vande Geest JP, Sacks MS, Vorp DA. Age dependency of the biaxial biomechanical behavior of human abdominal aorta. J Biomech Eng. 2004;126:815–822. doi: 10.1115/1.1824121. [DOI] [PubMed] [Google Scholar]
- 75.Vande Geest JP, Sacks MS, Vorp DA. A planar biaxial constitutive relation for the luminal layer of intra-luminal thrombus in abdominal aortic aneurysms. J Biomech. 2006;39:2347–2354. doi: 10.1016/j.jbiomech.2006.05.011. [DOI] [PubMed] [Google Scholar]
- 76.Van Loon P, Klip W, Bradley EL. Length-force and volume-pressure relationships of arteries. Biorheology. 1977;14:181–201. [PubMed] [Google Scholar]
- 77.Wagenseil JE, Nerurkar NL, Knutsen RH, Okamoto RJ, Li DY, Mecham RP. Effects of elastin haploinsufficiency on the mechanical behavior of mouse arteries. Am J Physiol. 2005;289:H1209–1217. doi: 10.1152/ajpheart.00046.2005. [DOI] [PubMed] [Google Scholar]
- 78.Wagenseil JE, Mecham RP. Vascular extracellular matrix and arterial mechanics. Physiol Rev. 2009;89:957–989. doi: 10.1152/physrev.00041.2008. [DOI] [PMC free article] [PubMed] [Google Scholar]
- 79.Wagenseil JE, Ciliberto CH, Knutsen RH, Levy MA, Kovacs A, Mecham RP. Reduced vessel elasticity alters cardiovascular structure and function in newborn mice. Circ Res. 2009;104:1217–1224. doi: 10.1161/CIRCRESAHA.108.192054. [DOI] [PMC free article] [PubMed] [Google Scholar]
- 80.Wagner HP, Humphrey JD. Differential passive and active biaxial mechanical behaviors of muscular and elastic arteries: basilar versus common carotid. J Biomech Engr. 2011;133:051009. doi: 10.1115/1.4003873. [DOI] [PubMed] [Google Scholar]
- 81.Wan W, Yanagisawa H, Gleason RL. Biomechanical and microstructural properties of common carotid arteries from fibulin-5 null mice. Annls Biomed Engr. 2010;38:3605–3617. doi: 10.1007/s10439-010-0114-3. [DOI] [PMC free article] [PubMed] [Google Scholar]
- 82.Wan W, Dixon JB, Gleason RL. Constitutive modeling of mouse carotid arteries using experimentally measured microstructural parameters. Biophys J. 2012;102:2916–2925. doi: 10.1016/j.bpj.2012.04.035. [DOI] [PMC free article] [PubMed] [Google Scholar]
- 83.Weiszäcker HW, Lambert H, Pascale K. Analysis of the passive mechanical properties of rat carotid arteries. J Biomech. 1983;16:703–715. doi: 10.1016/0021-9290(83)90080-5. [DOI] [PubMed] [Google Scholar]
- 84.Wilson JS, Baek S, Humphrey JD. Importance of initial aortic properties on the evolving regional anisotropy, stiffness and wall thickness of human abdominal aortic aneurysms. J Roy Soc Interface. 2012;9:2047–2058. doi: 10.1098/rsif.2012.0097. [DOI] [PMC free article] [PubMed] [Google Scholar]
- 85.Xu H, Hu JJ, Humphrey JD, Liu JC. Automated measurement and statistical modelling of elastic laminae in arteries. Comp Meth Biomech Biomed Engr. 2010;13:749–63. doi: 10.1080/10255840903580033. [DOI] [PMC free article] [PubMed] [Google Scholar]
- 86.Zeinali-Davarani S, Choi J, Baek S. On parameter estimation for biaxial mechanical behavior of arteries. J Biomech. 2009;42:524–530. doi: 10.1016/j.jbiomech.2008.11.022. [DOI] [PubMed] [Google Scholar]