

Significance
This work explains the long-standing puzzle of the physical mechanisms underlying acoustic droplet vaporization (ADV). ADV makes use of low-boiling-point perfluorocarbon droplets that become metastable once injected into the body, where they can be activated by high-intensity ultrasound. How ultrasound can physically trigger the vaporization remained elusive, also given the large mismatch between the ultrasound wavelength and the droplet size. Here we show that vaporization is preceded by nonlinear propagation of the ultrasound wave generating superharmonics. These high-frequency waves focus efficiently within the droplet, triggering vaporization. ADV shows great potential for advanced medical diagnosis and therapy. Our new understanding allows for further reduction of the required pressure amplitudes, thereby minimizing the adverse effects on healthy tissue.
Abstract
Acoustically sensitive emulsion droplets composed of a liquid perfluorocarbon have the potential to be a highly efficient system for local drug delivery, embolotherapy, or for tumor imaging. The physical mechanisms underlying the acoustic activation of these phase-change emulsions into a bubbly dispersion, termed acoustic droplet vaporization, have not been well understood. The droplets have a very high activation threshold; its frequency dependence does not comply with homogeneous nucleation theory and localized nucleation spots have been observed. Here we show that acoustic droplet vaporization is initiated by a combination of two phenomena: highly nonlinear distortion of the acoustic wave before it hits the droplet and focusing of the distorted wave by the droplet itself. At high excitation pressures, nonlinear distortion causes significant superharmonics with wavelengths of the order of the droplet size. These superharmonics strongly contribute to the focusing effect; therefore, the proposed mechanism also explains the observed pressure thresholding effect. Our interpretation is validated with experimental data captured with an ultrahigh-speed camera on the positions of the nucleation spots, where we find excellent agreement with the theoretical prediction. Moreover, the presented mechanism explains the hitherto counterintuitive dependence of the nucleation threshold on the ultrasound frequency. The physical insight allows for the optimization of acoustic droplet vaporization for therapeutic applications, in particular with respect to the acoustic pressures required for activation, thereby minimizing the negative bioeffects associated with the use of high-intensity ultrasound.
Over the last 15 y, nanomedicine has emerged as a promising field to address current problems of chemotherapy (1–4). Several drug-carrying constructs have been suggested to decrease the severe side effects of systemic injection on healthy tissue. The common strategy for such a local drug delivery application is the encapsulation of the drugs in polymeric micelles, hollow particles, liposomes, or emulsion droplets. The encapsulation allows for targeted and triggered release of the content and the administration of bioactive compounds that have low aqueous solubility (5).
One approach is the use of injectable phase-change emulsion microdroplets composed of a low-boiling-point perfluorocarbon (PFC), such as perfluoropentane (PFP, 29 °C boiling point). PFC emulsions have been studied in a wide variety of diagnostic and therapeutic applications such as drug delivery, tumor imaging, and embolotherapy (6). Ultrasound can be used to induce a phase transition of such droplets to gas bubbles, a process known as acoustic droplet vaporization (ADV) (7). Because ultrasound can be applied locally and noninvasively, ADV has been investigated as a means of localized drug delivery, especially for therapeutic agents with a narrow therapeutic index, such as chemotherapeutic drugs (5, 8–10). The droplets are stabilized by a surfactant shell to prevent their coalescence. The PFP emulsion does not spontaneously vaporize when injected in vivo at 37 °C (11, 12) until the droplets are exposed to ultrasound at sufficiently high pressure amplitude (7). Recent studies have also demonstrated that PFC nanodroplets (size ∼200 nm) may extravasate through leaky tumor vasculature, thus passively accumulating in the interstitial space, with the potential to enhance the therapeutic outcome (13, 14).
Even though the ADV approach for localized drug delivery shows great promise (13, 15), the physical mechanisms underlying the nature of the ADV process have not been well explained. The pressure amplitudes required to induce the phase transition of the acoustically sensitive droplets seem to be substantial, with mechanical indices (16) reported to be as high as four (7), well above the FDA-approved limit for diagnostic ultrasound. A pronounced thresholding behavior has been observed for the activation, meaning that there is negligible probability for detection up to some peak negative pressure amplitude, after which the probability increases linearly with the applied acoustic pressure (7, 17). Several groups have reported a dependence of the pressure threshold on the driving frequency (7, 17–19). The required threshold has been found to decrease with increasing frequency, whereas the cavitation threshold in liquids is expected to increase with increasing frequency (16). There is also an unexplained decrease of the threshold pressure with increasing size of the droplets (20, 21). Finally, ultrahigh-speed imaging has allowed for the construction of spatial and temporal nucleation maps (22). This showed that the nucleation spots inside the droplets were highly localized for some bubbles, whereas other bubbles had nucleation spots at random positions throughout the droplet. The authors suggested that the location of such spots may be a function of the droplet size (22). The authors also pointed out that temporally the initiation of the nucleation is shifted toward the end of the rarefactional half cycle of the ultrasound pulse.
Here we elucidate the physical mechanism that is responsible for all of the above phenomena. We show that acoustic droplet vaporization is initiated by the focusing of a nonlinear acoustic wave on a specific spot inside the droplet. The focusing results from the spherical shape of the droplet and the acoustic impedance mismatch between the PFC droplet and its exterior. The phenomenon is facilitated by the nonlinear propagation of ultrasound, which builds up superharmonics that are necessary to induce the focusing effect by having a wavelength of the order of the droplet size. Below we will present the theory for this problem. We will explain the approach for analyzing the distortion of the focused ultrasound wave and generation of superharmonics owing to nonlinear propagation and subsequently derive the expression for the diffracted ultrasound inside the droplet. We will then combine theory and numerical computations to quantify the effect of superharmonic focusing within the droplet, which allows for the exploration of the full parameter space of acoustic pressure, frequency, transducer geometry, and droplet size. Finally, our theoretical treatment is supported with precise ultrahigh-speed imaging experiments near the vaporization threshold of single microdroplets, which show the phenomena to be droplet size-dependent.
II. Theory
A. Nonlinear Propagation.
The acoustic pressure amplitudes required to nucleate the droplet have been observed to be very high. In a typical ADV experiment, before impinging on the droplet the ultrasound wave from a focused transducer travels a distance on the order of a few centimeters (7, 17–19, 22–24). Under these conditions the wave that arrives at the focus of the transducer can be highly distorted owing to nonlinear propagation (25, 26). The use of a focused transducer permits the nonlinearly distorted wave to be calculated using the Khokhlov–Zabolotskaya–Kuznetsov (KZK) equation (27, 28):
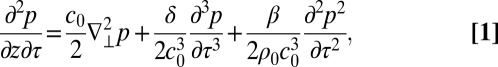 |
with p the pressure, β the coefficient of nonlinearity of the medium, and δ its sound diffusivity. The variable τ denotes that the retarded time 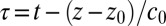 , with
  being the distance between the transducer and the droplet. The derivation of the KZK equation involves a parabolic approximation that is valid for forward propagating waves in a cone with a half-opening angle of up to 16° around the transducer axis (29–31). This requirement is often met for the waves emitted from a regular piston transducer.
All of the subsequent derivations are given in the complex representation. The pressure field at the acoustic focus of the transducer obtained from the solution of the KZK equation can be expanded in a Fourier series:
 |
where  and
and  are the amplitudes and the phases of the n-th harmonic component of the ultrasound wave. Because nonlinear waveform deformation builds up over distance and the droplet is four orders of magnitude smaller in size than the distance to the transducer, we disregard the additional nonlinear distortion inside the droplet. This implies that wave propagation inside the droplet is considered linear, so the superposition theorem holds and each harmonic component may be analyzed individually, as we will do in the following.
B. Diffraction Within a Spherical Droplet.
Let us consider an incident plane acoustic pressure wave composed of a single Fourier component  with pressure amplitude a propagating in the z direction in a medium with speed of sound
  , density of mass
  , and wavenumber (or spatial frequency)
  . It interacts with a spherical droplet with radius R, speed of sound
  , density of mass
  , and wavenumber
  . The angular frequency of the ultrasound wave is
  , with f the frequency of the ultrasound wave.
Let us now find the pressure wave inside the droplet. The time dependence of the refracted pressure waves (the one inside the droplet) and the scattered pressure wave (the one outside the droplet) is determined by the  multiplier. As a consequence, the acoustic wave equation
  reduces to the Helmholtz equation (32)
where  is again the wavenumber and
  is the spatial pressure wave (without the
  time dependency).
  represents the notation of the different media: 0 for the exterior and 1 for the interior. The wave outside the droplet can then be expressed as
  , where
  represents the incident plane wave (a known function) and
  the scattered wave, and the wave inside the droplet is indicated by
  (Fig. 1).
Fig. 1.

Schematic of the diffraction of an acoustic plane wave within a spherical droplet. Incoming plane wave  propagating from left to right, scattered wave
  outside the droplet and refracted wave
  inside the droplet.
At the droplet interface the pressure field must satisfy two boundary conditions:
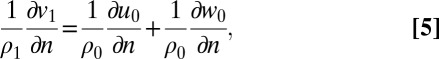 |
where  indicates the normal derivative to the droplet interface. The first boundary condition follows from the condition of continuous pressure at the droplet surface, because no force can be exerted on an infinitesimally small boundary. The second has the physical meaning of continuity of a fluid particle displacement normal to the surface. The incident plane wave can be expanded in spherical coordinates as follows (32):
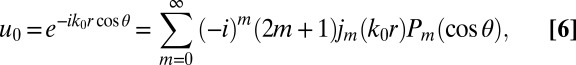 |
where  , with
  a Bessel function of the first kind of order
  and
and  the Legendre polynomial of order m. The symbols r and θ denote spherical coordinates with the
  direction being aligned along the propagation direction of the incident ultrasound wave
  . Based on symmetry considerations both refracted
  and scattered
  waves are axisymmetric functions and must both satisfy the Helmholtz wave equation Eq. 3. Let us find such solutions of the unknown functions
  and
and  in the form of Eq. 6:
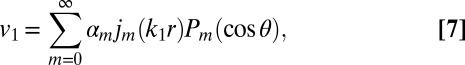 |
 |
where  ,
,  are unknown coefficients,
  as before, and
  with
with  the Hankel function of the second kind of order
  . Hankel functions of the second kind are chosen as a linearly independent basis for the expansion of the scattered wave
  , because they automatically satisfy the Sommerfeld radiation conditions at infinity. One can find the
  and
and  coefficients by substituting Eqs. 7 and 8 at the droplet interface
  into the two boundary conditions, Eqs. 4 and 5, and using the known function
  from Eq. 6. Equalizing the prefactors of
  [they must be equal, because all
  are linearly independent functions of
  ] gives
 |
where  and
and  and
and  denote the derivatives of the respective functions. The coefficients
  are now known and expressed in terms of the dimensionless parameters
  and
and  . Thus, by reintroducing the exponential time factor that was dropped earlier, the pressure wave inside the droplet at any given spatial point
  and any instant of time t can be written as
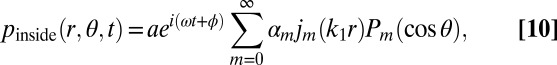 |
where ϕ is related to the phase of the incident field and a is the amplitude of the incident pressure wave.
Eq. 10 was obtained for an incident sinusoidal wave. It can now be extended to the case of a nonlinear pressure waveform. For the incident wave, we superimpose the Fourier components as in Eq. 2. With  and
and  known, the corresponding Fourier component inside the droplet is found when substituted into Eq. 10. Superposition of these internal Fourier components is then used to calculate how the nonlinear pressure wave is diffracted within the small spherical droplet:
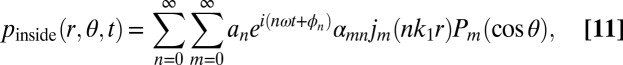 |
where  is computed by means of Eq. 9 with
  and
and  being replaced by
  and
and  , respectively.
III. Results and Discussion
The distorted wave is calculated from the real part of Eq. 2 and plotted in Fig. 2 in spatial coordinates in the propagation direction z, along the axis of symmetry, where the wave propagates from left to right. The black line represents one wavelength of the wave, λ0 = 438 μm, in the absence of a droplet. The red line represents the same wave in the presence of an R = 10-μm droplet, calculated using the real part of Eq. 11. The position of the droplet is indicated by the gray shaded region in Fig. 2. In contrast to the nondiffracted (distorted) wave, the diffracted wave changes its shape depending on how far it has propagated relative to the droplet position. The red curve shows the pressure right at that particular time instant when the maximal negative pressure is reached over the full period  . It can be observed that a focused pressure of
  is achieved within the droplet for an incoming wave with a peak negative pressure
  . A nearly sixfold increase in peak negative pressure amplitude is observed in a concentrated region on the proximal side around
  . We will call this position the focusing spot. For any given set of input parameter values the solution of Eq. 11 has an absolute minimum in (r, θ, t) space. Nucleation within the droplet is assumed to be most probable at such a minimum, where (and when) the focused pressure amplitude is maximal.
Fig. 2.

Snapshot of the superharmonic focusing effect within a spherical droplet. The black line represents the acoustic pressure waveform on the axis of symmetry (θ = 0) as a function of the z coordinate in the absence of a droplet. The red solid line is the focused pressure in the presence of the droplet. The snapshot is taken right at the moment of minimum focused pressure. The horizontal axis displays one full wavelength in the medium outside the droplet. The gray shaded region depicts the position of the droplet, R = 10 μm. The focusing spot lies around  and the pressure is amplified 5.8 times compared with the incident acoustic pressure
  .
.
The pressure amplification factor in the focusing spot as well as its location depend on the input parameter values (i.e., frequency, pressure amplitude, transducer geometry and size), which prescribe the propagation distance to the focal point. Owing to the nonlinear propagation of the ultrasound wave its shape, expressed in the coefficients  and
and  , depends on the pressure amplitude. The higher the pressure, the more nonlinear the wave becomes, as the amplitudes of the superharmonics build up roughly as
  , where
  is the pressure amplitude at the transducer surface and n is the number of that particular harmonic. Fig. 3A shows the dependence of the pressure amplification factor on the incident peak negative pressure
  at the focusing spot for droplet sizes R = 4, 7, and 10 μm. For instance, in the case of an R = 10-μm droplet, the pressure signal is not amplified until a pressure near
  .
.
Fig. 3.

Dependence of the pressure amplification factor at the focusing spot for three microdroplet radii (A) as a function of the incident acoustic peak negative pressure  at a driving frequency of 3.5 MHz and (B) as a function of the driving frequency f for a peak negative pressure of −4.5 MPa.
The focusing effect strongly depends on the frequency of the driving pressure field. Here two effects come into play. First, the nonlinear propagation depends on frequency and, second, there is a strong coupling between the frequency and the droplet size owing to diffraction. Both frequency and size appear in a combined way in the dimensionless parameters  and
and  (Eqs. 9 and 11). In Fig. 3B we plot the pressure amplification factor at the focusing spot as a function of frequency for the droplet sizes R = 4, 7, and 10 μm driven at a peak negative pressure
  . It shows that the pressure is amplified with increasing frequency, and this tendency is in agreement with the work of Kripfgans et al. (7).
Fig. 4A shows the superharmonic focusing effect as a function of the droplet size. It shows resemblance to Fig. 3B through the coupling through  . By comparing with Fig. 3B one can now discriminate between the effect of diffraction and nonlinear propagation. Both Figs. 3B and 4A display the same superharmonic focusing effect; however, only the first is governed by the nonlinear distortion as a function of frequency. The amount of focusing depends both on the degree of constructive interference of the various harmonics within the droplet and whether or not these harmonics are near the internal acoustic resonance of the droplet, which occurs once
  is close to 1. Because of this intricate interplay, the focusing effect will show rapid changes and significant peaks as a function of frequency and size, as shown in Figs. 3B and 4A.
Fig. 4.

(A) The dependence of the pressure amplification factor at the focusing spot as a function of the droplet radius R for three incident acoustic peak negative pressures  . (B) The position of the nucleation site as a function of the droplet size. The position is taken along the axis of ultrasound propagation on the axis of symmetry of the system. The solid lines represent the calculated positions of maximal peak negative pressure for a frequency of 3.5 MHz (red) and 5.0 MHz (blue), respectively. The circles represent measured nucleation spots for a range of droplet sizes for the two frequencies.
The position of the absolute minimum pressure in Eq. 11 was calculated numerically by an iterative method of successive displacement along the variables  . The absolute minimum was found to be always on the axis of symmetry
  . Fig. 4B shows how the measured position of the focusing spot depends on the droplet size for a fundamental frequency of 3.5 MHz (red curve). For example, for droplets with radii between 1 and 5 μm, nucleation is expected to occur homogeneously distributed through the droplet (24), whereas for bubble radii between 8 and 12 μm the focusing spot is located near
  and positioned at the proximal side (i.e., on the side where the nonlinear ultrasound wave hits the droplet). Note that Fig. 4B shows the result of the constructive interference of all superharmonics. Taking only the fundamental frequency, or any single harmonic, as in Eq. 10 will lead to a completely different diffraction pattern, and as a result into different focusing position and strength or to no focusing effect at all.
A total of 142 nucleation events were imaged experimentally using ultrahigh-speed imaging at up to 20 million frames per second (33, 34). A typical example of such a droplet vaporization event is shown in Fig. 5A. Nucleation is initiated between frames 3 and 4 at the position of minimum pressure, where the focused pressure increases the chance of nucleation. Once the nucleus is formed, rapid bubble growth follows with a typical expansion velocity on the order of  depending on the ambient temperature (22). The position of each focusing spot was measured from the geometrical center of the growing nucleus with a
  correction to account for the 45° inclination of the optical imaging plane with the direction of ultrasound propagation (Materials and Methods). Spatial nucleation maps were then constructed as displayed in Fig. 5B.
Fig. 5.

(A) A set of consecutive images showing acoustic droplet vaporization of a 7.4-μm-radius PFP droplet taken at a frame rate of 12.6 million frames per second. The droplet is triggered by an eight-cycle, 5-MHz frequency ultrasound pulse. The nucleation is initiated between frames 3 and 4. Frames 4 and 5 show the subsequent vapor bubble growth (24). (B) Nucleation maps for the two frequencies and for a range of droplet sizes. The histogram shows the focused positions z/R for a frequency of 3.5 MHz for the 10- to 14-μm droplet sizes and for a frequency of 5.0 MHz for the 6- to 10-μm droplet sizes. US, ultrasound.
The position of the focusing spot as a function of the droplet size is summarized in Fig. 4B. They are in good agreement with the theoretical prediction, being more scattered for smaller droplets and highly localized for the larger ones. This is to be expected because the pressure amplification factor (from Fig. 4A) is only slightly above unity for the smaller droplets, leading to a stochastic random nucleation behavior, whereas for the larger droplets a much higher amplification factor is achieved, leading to sharp focusing of the acoustic wave and instant nucleation in a well-defined spot. Fig. 4B was calculated for those positions with absolute minimum of pressure in the (r,θ,t) parameter space. However, one can calculate that for the larger bubbles in the parameter set considered here, Eq. 11 has a second local minimum on the axis of symmetry around  , that is, on the distal side, occurring at a different time than the first one. Owing to the stochastic nature of ADV, and provided that enough acoustic power is applied (i.e., above the vaporization threshold), acoustic vaporization can also be initiated at this second local minimum (22).
The nucleation maps of Fig. 5B show that for a driving frequency of 3.5 MHz (red) the smaller droplets are indeed nucleated in random position, with a tendency to focus for the sizes 6 μm to 10 μm, whereas for the larger droplet sizes (10–14 μm) the nucleation spots are highly localized. The data show that for a fundamental driving frequency of 5.0 MHz nucleation occurs in a focal spot already for smaller droplet sizes (6–10 μm). The histogram shows the positions z/R for 3.5 MHz for the 10- to 14-μm droplet sizes and 5.0 MHz for the 6- to 10-μm droplet sizes. For the 3.5-MHz frequency experiment the mean position is −0.37 (SD of 0.10; n = 28 events), whereas the corresponding theoretical prediction is −0.45. For the 5.0-MHz experiment the mean position is −0.54 (SD of 0.10; n = 58 events) with a corresponding theoretical prediction of −0.59. Thus, the focusing spot moves more proximal to the transducer for a higher frequency and its position is in quantitative agreement with the theory.
Although the presented model explains the tendency of the nucleation threshold with the driving pressure, frequency of the ultrasound wave, and size of the droplets, a detailed calculation of the probability of nucleation must also incorporate parameters such as the purity of the PFP liquid, the dissolved gas concentration, liquid temperature, vapor pressure associated with it, number of ultrasound cycles, droplet concentration, droplet size distribution, and so on. By using Eq. 11 one could match the peak negative pressure at the focusing spot (e.g., −26 MPa at R = 10 μm in Fig. 3A) with the incident peak negative pressure threshold measured in experiments as a function of these parameters. The numerical results presented here are calculated and compared with experiments performed in water. The shape of the nonlinearly distorted wave is strongly dependent on the parameters of the propagating media. For human tissue the Goldberg ratio is lower than for water (35). This indicates that nonlinear distortion is easier to achieve in water, compared with tissue. Therefore, the experiments performed in vivo are expected to have different nucleation patterns, notably with a higher nucleation threshold compared with the in vitro experiments.
The present theory shows that the larger the droplet size, the stronger the focusing. The smaller nanodroplets will require a higher frequency for activation. For the higher frequencies the harmonic content will be higher through nonlinear propagation and a higher number of superharmonics will be formed. Attenuation, however, will be stronger for higher frequencies. Thus, it is reasonable to assume that the combined effect will still be there, but probably less pronounced. A precise answer, however, cannot be provided given the computational effort of calculating nonlinear propagation effects for these high frequencies and given the lack of experimental tools for validation of pressures and amplitudes for these high frequencies and for optical imaging that would then be required at nanometer precision.
The physical insight allows for the optimization of acoustic droplet vaporization for therapeutic applications, in particular with respect to the acoustic pressures required for activation, thereby minimizing the negative bioeffects associated with the use of high-intensity ultrasound. This includes the design of droplets by mixing different liquids of different physical properties which allows to vary the acoustic impedance by a change of the density and speed of sound. Using dual or multiple frequency transducers, the amplitudes and phases of the transmit waves can be optimized to have maximal constructive interference within the droplets to maximize the focusing strength at any given acoustic input pressure.
IV. Materials and Methods
A. Numerics.
Several numerical codes (31, 36) based on the KZK equation, Eq. 1, are available to calculate the nonlinear pressure in the absence of a droplet. We use a numerical axisymmetric implementation written in C programming language developed in-house (37). It has been validated with calibrated hydrophone measurements and was found to be able to represent the experimental pressure waveform with a precision of 10% (37). The result of the simulation is the pressure field at the acoustic focus as a function of the position, time, and frequency for any given transducer geometry (i.e., diameter and focal distance). The following parameter values were used in the simulations: exterior medium water with speed of sound  = 1,520 m/s (at 37 °C), density
  , a nonlinear coefficient β = 3.5 and a sound diffusivity
  , interior medium PFP with speed of sound
  (at 37 °C), and density
  . In the numerical simulations the transducer dimensions were set to that used in experiment; the diameter was 19.05 mm (3/4 inch) and the focal distance was 38.1 mm (1.5 inches). The numerical code was initially run to calculate the pressure field at the focus of the transducer for a center frequency f = 3.5 MHz and f = 5.0 MHz for pressures ranging from 1 to 5 MPa peak negative pressure. The code was also run at frequencies ranging from 1 to 7 MHz with the incoming peak negative pressure at the focus kept constant at a value
  . Fig. S1 shows how the series expansion approach represents the original signal depending on how many expansion terms are taken into account. We used the first 10 harmonics to represent the nonlinear ultrasound pressure wave, Eq. 2. Eq. 11 allows one to calculate the pressure inside the droplet at any given spatial point
  at any instant of time t. To calculate the pressure inside the droplet, Eq. 11, for the parameters considered here (1 < R < 15 μm, 1 < f < 7 MHz) the first 45 terms of the series in Eq. 10 were used.
B. Experiments.
A PFP droplet emulsion was prepared using the methods adopted from refs. 22, 23, and 38. A highly diluted suspension of droplets was injected into an OptiCell (Thermo Fisher Scientific) to observe single microdroplets. The OptiCell was submerged in a 1-L temperature-controlled water tank kept at a temperature of 37 °C. Microdroplets were phase-transitioned with a focused 19-mm- (3/4-inch)-diameter single-element transducers (Olympus Panametrics) [3.5-MHz and 5.0-MHz center frequencies, focal length 38 mm (1 inch)]. The acoustic driving pulse was delivered from an arbitrary waveform generator (Tabor 8026; Tabor Electronics) amplified by an rf amplifier (ENI 350L; Electronic Navigation Industries, Inc.). Droplet samples were vaporized with a single ultrasound pulse, consisting of a burst between 6 and 10 cycles and a driving pressure with a peak negative pressure  at 45° angle to the horizontal OptiCell plane (22, 24). The pressure value was calibrated in the same setup at the position of the droplets using a 0.2-mm PVDF probe hydrophone (DC27/000658; Precision Acoustics Ltd.). The region of interest in the Opticell was imaged with an Olympus microscope equipped with a 40× water-immersed microscope objective (LUMPlanFl/IR, N.A. = 0.8) providing a resolution of 0.269 μm per pixel. The sample was illuminated from below with a 65-mJ xenon flash pulse (30-μs duration) through an optical light guide (Schott AG). The timing and positions of the focusing spots within the insonified droplets were captured with the ultrahigh-speed framing camera Brandaris 128 (33, 34). The camera was set to record 128 frames in a single run at a frame rate of up to 20 million frames per second, thus providing an interframe time as low as 50 ns. This allowed sampling of each cycle of the ultrasound wave with a ratio of 5–6. The uncertainty of the determination of the nucleation site from the optical images is one pixel size, which corresponds to a physical size of ∼250 nm. Our method assumes that nucleation occurs in the plane at a 45° angle with the imaging plane and parallel with the ultrasound propagation direction. However, nucleation may occur off this plane within the depth of field of the microscope, which may well be a source of error. A more precise determination of the position of the nucleation site will require orthogonal or 3D ultrahigh-speed imaging, which is not available at present.
Supplementary Material
Acknowledgments
We thank Tim Segers for his guidance in preparing the PFP emulsions and for experimental assistance. We also thank Andrea Prosperetti for his kind consultations. We acknowledge the Foundation for Fundamental Research on Matter, financially supported by The Netherlands Organization for Scientific Research, for funding this research.
Footnotes
The authors declare no conflict of interest.
This article is a PNAS Direct Submission.
This article contains supporting information online at www.pnas.org/lookup/suppl/doi:10.1073/pnas.1312171111/-/DCSupplemental.
References
- 1.Duncan R. The dawning era of polymer therapeutics. Nat Rev Drug Discov. 2003;2(5):347–360. doi: 10.1038/nrd1088. [DOI] [PubMed] [Google Scholar]
- 2.Ferrari M. Cancer nanotechnology: Opportunities and challenges. Nat Rev Drug Discov. 2005;5(3):161–171. doi: 10.1038/nrc1566. [DOI] [PubMed] [Google Scholar]
- 3.Torchilin VP. Recent advances with liposomes as pharmaceutical carriers. Nat Rev Drug Discov. 2005;4(2):145–160. doi: 10.1038/nrd1632. [DOI] [PubMed] [Google Scholar]
- 4.Davis ME, Chen Z, Shin D. Nanoparticle therapeutics: An emerging treatment modality for cancer. Nat Rev Drug Discov. 2008;7(9):771–782. doi: 10.1038/nrd2614. [DOI] [PubMed] [Google Scholar]
- 5.Rapoport N, Kennedy A, Shea J, Scaife C, Nam KH. Controlled and targeted tumor chemotherapy by ultrasound-activated nanoemulsions/microbubbles. J Contr Rel. 2009;138(3):268–276. doi: 10.1016/j.jconrel.2009.05.026. [DOI] [PMC free article] [PubMed] [Google Scholar]
- 6.Sheeran P, Dayton P. Phase-change contrast agents for imaging and therapy. Curr Pharm Des. 2012;18(15):2152–2165. doi: 10.2174/138161212800099883. [DOI] [PMC free article] [PubMed] [Google Scholar]
- 7.Kripfgans OD, Fowlkes JB, Miller DL, Eldevik OP, Carson PL. Acoustic droplet vaporization for therapeutic and diagnostic applications. Ultrasound Med Biol. 2000;26(7):1177–1189. doi: 10.1016/s0301-5629(00)00262-3. [DOI] [PubMed] [Google Scholar]
- 8.Wang C, et al. Aptamer-conjugated and drug-loaded acoustic droplets for ultrasound theranosis. Biomaterials. 2012;33(6):1939–1947. doi: 10.1016/j.biomaterials.2011.11.036. [DOI] [PubMed] [Google Scholar]
- 9.Fabiilli M, et al. Delivery of chlorambucil using an acoustically-triggered perfluoropentane emulsion. Ultrasound Med Biol. 2010;36(8):1364–1375. doi: 10.1016/j.ultrasmedbio.2010.04.019. [DOI] [PMC free article] [PubMed] [Google Scholar]
- 10.Fang J, Hung C, Hua S, Hwang T. Acoustically active pefluorocarbon nanoemulsions as drug delivery carriers for camptothecin: Drug release and cytoxicity against cancer cells. Ultrasonics. 2009;49(1):39–46. doi: 10.1016/j.ultras.2008.04.009. [DOI] [PubMed] [Google Scholar]
- 11.Kripfgans OD, et al. Acoustic droplet vaporization for temporal and spatial control of tissue occlusion: A kidney study. IEEE Trans Ultrason Ferroelectr Freq Control. 2005;52(7):1101–1110. doi: 10.1109/tuffc.2005.1503996. [DOI] [PubMed] [Google Scholar]
- 12.Zhang M, et al. Acoustic droplet vaporization for enhancement of thermal ablation by high intensity focused ultrasound. Acad Radiol. 2011;18(9):1123–1132. doi: 10.1016/j.acra.2011.04.012. [DOI] [PMC free article] [PubMed] [Google Scholar]
- 13.Rapoport NY, Gao Z, Kennedy A. Multifunctional nanoparticles for combining ultrasonic tumor imaging and targeted chemotherapy. J Natl Cancer Inst. 2007;99(14):1095–1106. doi: 10.1093/jnci/djm043. [DOI] [PubMed] [Google Scholar]
- 14.Mohan P, Rapoport N. Doxorubicin as a molecular nanotheranostic agent: Effect of doxorubicin encapsulation in micelles or nanoemulsions on the ultrasound-mediated intracellular delivery and nuclear trafficking. Mol Pharm. 2010;7(6):1959–1973. doi: 10.1021/mp100269f. [DOI] [PMC free article] [PubMed] [Google Scholar]
- 15.Couture O, et al. Ultrasound internal tattooing. Med Phys. 2011;38(2):1116–1123. doi: 10.1118/1.3548068. [DOI] [PubMed] [Google Scholar]
- 16.Apfel RE, Holland CK. Gauging the likelihood of cavitation from short-pulse, low-duty cycle diagnostic ultrasound. Phys Med Biol. 1991;17(2):179–185. doi: 10.1016/0301-5629(91)90125-g. [DOI] [PubMed] [Google Scholar]
- 17.Williams R, et al. Characterization of submicron phase-change perfluorocarbon droplets for extravascular ultrasound imaging of cancer. Phys Med Biol. 2013;39(3):475–489. doi: 10.1016/j.ultrasmedbio.2012.10.004. [DOI] [PubMed] [Google Scholar]
- 18.Giesecke T, Hynynen K. Ultrasound-mediated cavitation thresholds of liquid perfluorocarbon droplets in vitro. Ultrasound Med Biol. 2003;29(9):1359–1365. doi: 10.1016/s0301-5629(03)00980-3. [DOI] [PubMed] [Google Scholar]
- 19.Schad KC, Hynynen K. In vitro characterization of perfluorocarbon droplets for focused ultrasound therapy. Phys Med Biol. 2010;55(17):4933–4947. doi: 10.1088/0031-9155/55/17/004. [DOI] [PubMed] [Google Scholar]
- 20.Martz TD, Sheeran PS, Bardin D, Lee AP, Dayton PA. Precision manufacture of phase-change perfluorocarbon droplets using microfluidics. Ultrasound Med Biol. 2011;37(11):1952–1957. doi: 10.1016/j.ultrasmedbio.2011.08.012. [DOI] [PMC free article] [PubMed] [Google Scholar]
- 21.Sheeran PS, Luois SH, Mullin LB, Matsunaga TO, Dayton PA. Design of ultrasonically-activatable nanoparticles using low boiling point perfluorocarbons. Biomaterials. 2012;33(11):3262–3269. doi: 10.1016/j.biomaterials.2012.01.021. [DOI] [PMC free article] [PubMed] [Google Scholar]
- 22.Shpak O, et al. Ultrafast dynamics of the acoustic vaporization of phase-change microdroplets. J Acoust Soc Am. 2013;134(2):1610–1621. doi: 10.1121/1.4812882. [DOI] [PubMed] [Google Scholar]
- 23.Reznik N, et al. The efficiency and stability of bubble formation by acoustic vaporization of submicron perfluorocarbon droplets. Ultrasonics. 2013;53(7):1368–1376. doi: 10.1016/j.ultras.2013.04.005. [DOI] [PubMed] [Google Scholar]
- 24.Shpak O, Stricker L, Versluis M, Lohse D. The role of gas in ultrasonically driven vapor bubble growth. Phys Med Biol. 2013;58(8):2523–2535. doi: 10.1088/0031-9155/58/8/2523. [DOI] [PubMed] [Google Scholar]
- 25.Blackstock DT. On plane, spherical and cylindrical sound waves of finite amplitude in lossless fluids. J Acoust Soc Am. 1964;36(1):217–219. [Google Scholar]
- 26.Bacon DR. Finite amplitude distortion of the pulsed fields used in diagnostic ultrasound. Ultrasound Med Biol. 1984;10(2):189–195. doi: 10.1016/0301-5629(84)90217-5. [DOI] [PubMed] [Google Scholar]
- 27.Zabolotskaya EA, Khokhlov RV. Quasi-plane waves in the nonlinear acoustics of confined beams. Sov. Phys. Acoust. 1969;15:35–40. [Google Scholar]
- 28.Kuznetsov VP. Equation of nonlinear acoustics. Sov. Phys. Acoust. 1970;16:467–470. [Google Scholar]
- 29.Tjotta JN, Tjotta S, Vefring EH. Effects of focusing on the nonlinear interaction between two collinear finite amplitude sound beams. J Acoust Soc Am. 1991;89(3):1017–1027. [Google Scholar]
- 30.Lee D, Pierce A. Parabolic equation development in recent decade. J Comput Acoust. 1995;3(2):95–173. [Google Scholar]
- 31.Hart TS, Hamilton MF. Nonlinear effects in focused sound beams. J Acoust Soc Am. 1988;84(4):1488–1496. [Google Scholar]
- 32.Prosperetti A. Advanced Mathematics for Applications. Cambridge, UK: Cambridge Univ Press; 2011. [Google Scholar]
- 33.Chin CT, et al. Brandaris 128: A digital 25 million frames per second camera with 128 highly sensitive frames. Rev Sci Instrum. 2003;74(12):5026–5034. [Google Scholar]
- 34.Gelderblom EC, et al. Brandaris 128 ultra-high-speed imaging facility: 10 years of operation, updates and enhanced features. Rev Sci Instrum. 2012;83(10):103706. doi: 10.1063/1.4758783. [DOI] [PubMed] [Google Scholar]
- 35.Szabo TL, Clougherty F, Grossman C. Effects on nonlinearity on the estimation of in situ values of acoustic output parameters. Ultrasound Med Biol. 1999;18(1):33–42. doi: 10.7863/jum.1999.18.1.33. [DOI] [PubMed] [Google Scholar]
- 36.Lee YS, Hamilton MF. Time-domain modeling of pulsed finite-amplitude sound beams. J Acoust Soc Am. 1995;97(2):906–917. [Google Scholar]
- 37.Vos HJ, Goertz DE, de Jong N. Self-demodulation of high-frequency ultrasound. J Acoust Soc Am. 2010;127(3):1208–1217. doi: 10.1121/1.3298436. [DOI] [PubMed] [Google Scholar]
- 38.Fabiilli M, et al. The role of inertial cavitation in acoustic droplet vaporization. IEEE Trans Ultrason Ferroelectr Freq Control. 2009;56(5):1006–1017. doi: 10.1109/TUFFC.2009.1132. [DOI] [PMC free article] [PubMed] [Google Scholar]
Associated Data
This section collects any data citations, data availability statements, or supplementary materials included in this article.