

Significance
G protein-coupled receptors (GPCRs) comprise 2–3% of human proteins and are key for cellular communication in higher organisms. Thus, these receptors are essential in cell physiology, and their malfunction is commonly translated into pathological outcomes. Our structural knowledge of GPCRs has improved dramatically in recent years. The next big leap is deciphering the structure and function of their complexes with signaling proteins, and, specifically, the mechanisms by which these complexes form and activate. Our unbiased and complete scanning mutagenesis provides compelling functional insights into how a phosphorylated GPCR is desensitized by binding of arrestin. Combination of the discovered mutations will allow engineering of arrestins with either increased or reduced binding affinity with a broad range of applications in research, diagnostics, and pharmacology.
Keywords: visual system, scanning mutagenesis, membrane receptor, cell signaling, protein engineering
Abstract
Arrestins function as adapter proteins that mediate G protein-coupled receptor (GPCR) desensitization, internalization, and additional rounds of signaling. Here we have compared binding of the GPCR rhodopsin to 403 mutants of arrestin-1 covering its complete sequence. This comprehensive and unbiased mutagenesis approach provides a functional dimension to the crystal structures of inactive, preactivated p44 and phosphopeptide-bound arrestins and will guide our understanding of arrestin–GPCR complexes. The presented functional map quantitatively connects critical interactions in the polar core and along the C tail of arrestin. A series of amino acids (Phe375, Phe377, Phe380, and Arg382) anchor the C tail in a position that blocks binding of the receptor. Interaction of phosphates in the rhodopsin C terminus with Arg29 controls a C-tail exchange mechanism in which the C tail of arrestin is released and exposes several charged amino acids (Lys14, Lys15, Arg18, Lys20, Lys110, and Lys300) for binding of the phosphorylated receptor C terminus. In addition to this arrestin phosphosensor, our data reveal several patches of amino acids in the finger (Gln69 and Asp73–Met75) and the lariat loops (L249–S252 and Y254) that can act as direct binding interfaces. A stretch of amino acids at the edge of the C domain (Trp194–Ser199, Gly337–Gly340, Thr343, and Thr345) could act as membrane anchor, binding interface for a second rhodopsin, or rearrange closer to the central loops upon complex formation. We discuss these interfaces in the context of experimentally guided docking between the crystal structures of arrestin and light-activated rhodopsin.
The human genome encodes more than 800 G protein-coupled receptors (GPCRs), which mediate signaling between cells and provide an important link to our environment as the principal receptors for taste, smell, and vision. The visual system with its photoreceptor rhodopsin is an excellent system to understand GPCR signaling, as detailed information exists on the structures and dynamic interactions of the protein constituents (1). G protein-mediated signaling by light-activated rhodopsin is terminated by a process that begins with the phosphorylation of rhodopsin’s C terminus by the rhodopsin kinase GRK1. The phosphorylated, light-activated rhodopsin binds then to arrestin-1, which stops signaling by occluding the G protein-binding site. Further cloning efforts yielded two ubiquitously expressed nonvisual arrestins (arrestin-2 and arrestin-3 or β-arrestin-1 and β-arrestin-2) and the cone-specific arrestin-4. It seems clear today that most GPCRs share a common mechanism of signal termination involving receptor phosphorylation and the binding of arrestins. Arrestin-bound receptors may be internalized and degraded, internalized and recycled, and/or initiate G protein-independent signaling (2).
In recent years there has been tremendous progress in the structure determination of active GPCR states including those of light-activated rhodopsin (3–5) and the first GPCR-G protein complex (6). Detailed structural information on the inactive state of arrestin-1 has been available for some time (7, 8). These inactive structures have recently been complemented with structures of a preactivated state of the arrestin-1 splice variant p44 (9) and of arrestin-2 bound to a receptor phosphopeptide (10). Analysis of these 3D structures provides many clues of how arrestins function. However, structures alone do not tell the whole story, as they contain little information about which subset of residues stabilize a particular conformation or contribute to receptor binding. The approximate binding surface was established by peptide (11) and antibody (12) competition experiments. Series of targeted mutagenesis studies based on the cell-free expression of radiolabeled arrestin (13) were used to probe the function of specific arrestin regions. However, these targeted studies are difficult to compare quantitatively as they have been gathered in over 20 y of work. Here we present an unbiased and complete scan of the arrestin-1 sequence to compare the relative impact of each amino acid on binding to light-activated, phosphorylated rhodopsin. These data provide a functional dimension to the available crystal structures and will guide our molecular understanding of GPCR–arrestin interactions.
Results and Discussion
Scanning Mutagenesis of Arrestin-1.
Scanning mutagenesis is a powerful protein-engineering technique that has been particularly successful in the stabilization of GPCRs (14) or in the study of specific protein–protein interactions (for example, ref. 15). To facilitate large-scale mutagenesis projects, we recently developed software tools for primer design and sequence analysis (16). Here we have used these tools to scan the complete arrestin-1 sequence. We then compared the binding of all 403 mutants to the phosphorylated GPCR rhodopsin. To do this, we changed each arrestin-1 residue, except the first methionine, to alanine, or in case of a native alanine at a particular position, to glycine. These mutations remove all side-chain atoms beyond the β-carbon, which allows us to probe the functional role of side chains throughout the arrestin molecule with a direct binding assay to phosphorylated light-activated rhodopsin (Fig. S1). To facilitate the large-scale screening of mutants we labeled arrestin-1 by fusion to the fluorescent protein mCherry, which allowed binding experiments directly from Escherichia coli cell lysates. We obtained the highest level of binding to light-activated (*) phosphorylated rhodopsin in rod outer segment (P-ROS*) membranes, whereas dark phosphorylated (P-ROS) and light-activated unphosphorylated (ROS*) membranes did not bind arrestin-1 efficiently (Fig. 1A). These results are in agreement with the requirement of rhodopsin to be both activated and phosphorylated for high-affinity binding of arrestin (17). To compare the relative binding affinity of mutants, we developed a high-throughput assay that takes advantage of the dependency of arrestin–rhodopsin interactions on low ionic strength (17, 18). For each mutant, the amount of arrestin-1 bound to P-ROS* was determined at eight different salt concentrations to fit the data to sigmoidal dose–response curves (Fig. 1B). Importantly the half-maximal inhibitory concentration (IC50) for NaCl determined with this assay is largely independent from variations in the arrestin-1 expression level, as we chose a rhodopsin concentration of 1.25 µM, far in excess of the 5–50 nM apparent binding affinity of arrestin-1 (19, 20). As a further precaution we expressed wild-type arrestin in parallel with each set of mutants. The variation in expression level between these 59 independent experiments was ±61%, yet the determined dose–response curves yielded a very reproducible IC50 of 0.41 ± 0.04 M for wild-type arrestin-1 (a frequency distribution analysis is provided in Fig. S2). The obtained value is in good agreement with previous reports using radioactively (17) or fluorescently labeled arrestin-1 (18), suggesting that the mCherry fusion did not inhibit arrestin binding and can be used for the relative comparison of arrestin mutations. Besides the wild type, we measured dose–response curves and determined IC50 values for 403 arrestin mutations. (A selection of data is available as Table 1, and all mutations are listed in Table S1). From this dataset, we excluded 16 mutants from further analysis because they were binding at a level less than 10% of wild-type arrestin-1 expressed in parallel. Further analysis by in-gel fluorescence of mCherry showed that 12 of these mutants did express very poorly and the remaining 4 did not express at all within the detection limit. Once these low-expressing mutants had been excluded, the remaining dataset did not show a correlation between the expression level of a mutant and the determined IC50 value. In total our functional data thus covers 96% of the arrestin-1 sequence, providing an extensive dataset for single amino acid contributions to the binding of arrestin to phosphorylated rhodopsin.
Fig. 1.
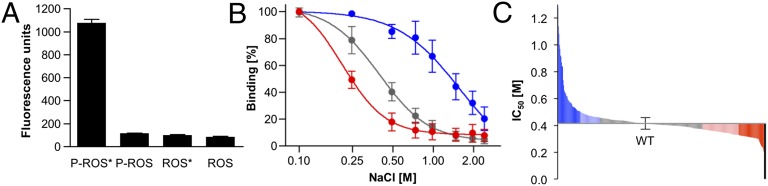
Arrestin–mCherry binding assay and scanning mutagenesis. (A) Binding of mCherry-labeled arrestin-1 to P-ROS and ROS in native ROS membranes. Binding experiments were performed either with dark-adapted or light-activated (*) rhodopsin. Mean and SD were obtained from three experiments. (B) To evaluate the relative binding affinity of arrestin mutants we compared their binding to light-activated, phosphorylated rhodopsin under increasing ionic strength (Fig. S1). Fluorescence values reflecting the amounts of mCherry-labeled arrestin were normalized and the data fitted to sigmoidal dose–response curves as shown here for Phe375Ala (blue, SD from 4 independent experiments), Arg29Ala (red, SD from 4 independent experiments), and wild-type arrestin (gray, SD from 59 independent experiments). (C) IC50 values (molar NaCl) obtained from the binding curves of 403 arrestin mutations covering the complete arrestin sequence. The number of mutations increasing (blue) is roughly equal to the number of mutants reducing (red) IC50 values with no bias toward polar or hydrophobic side chains. Four mutations resulted in no or very weak expression (black) and have been excluded from further analyses. A complete list of IC50 values is available in Table S1.
Table 1.
Summary of IC50 values from selected arrestin regions
| Polar core | ||||||||
| Mutant | D30A | R175A | D296A | D303A | T304A | R382A | ||
| IC50 [M] | 0.62 | 0.91 | 0.92 | 0.87 | 0.84 | 0.97 | ||
| 95% CI | 0.57–0.68 | 0.77–1.08 | 0.71–1.21 | 0.76–0.99 | 0.74–0.96 | 0.76–1.24 | ||
| Three-element interaction | ||||||||
| Mutant | H10A | V11A | F13A | L111A | F375A | V376A | F377A | F380A |
| IC50 [M] | 0.65 | 0.61 | 0.84 | 0.70 | 1.28 | 0.66 | 1.08 | 1.00 |
| 95% CI | 0.60–0.71 | 0.56–0.67 | 0.74–0.95 | 0.64–0.76 | 0.93–1.88 | 0.58–0.75 | 0.82–1.43 | 0.70–1.45 |
| Phosphate sensing | ||||||||
| Mutant | K14A | K15A | R18A | K20A | R29A | K110A | K166A | K300A |
| IC50 [M] | 0.30 | 0.33 | 0.33 | 0.34 | 0.24 | 0.37 | 0.38 | 0.33 |
| 95% CI | 0.26–0.33 | 0.30–0.38 | 0.28–0.38 | 0.32–0.37 | 0.22–0.26 | 0.34–0.41 | 0.33–0.42 | 0.31–0.35 |
| C edge | ||||||||
| Mutant | W194A | F196A | F197A | M198A | S199A | K232A | L339A | T343A |
| IC50 [M] | 0.24 | 0.30 | 0.31 | 0.32 | 0.31 | 0.31 | 0.30 | 0.32 |
| 95% CI | 0.22–0.28 | 0.27–0.34 | 0.28–0.34 | 0.28–0.36 | 0.28–0.33 | 0.27–0.53 | 0.27–0.34 | 0.31–0.33 |
| Finger and lariat loop | ||||||||
| Mutant | Q69A | D73A | V74A | M75A | L249A | Y250A | S251A | S252A |
| IC50 [M] | 0.24 | 0.31 | 0.32 | 0.26 | 0.31 | 0.31 | 0.33 | 0.32 |
| 95% CI | 0.20–0.28 | 0.29–0.32 | 0.27–0.38 | 0.24–0.28 | 0.28–0.33 | 0.27–0.48 | 0.31–0.35 | 0.31–0.33 |
CI, confidence interval.
About 50% of mutations leave the IC50 values basically unchanged, whereas the remaining values varied between 1.28 ± 0.17 M and 0.24 ± 0.01 M for the strongest and weakest binders (Fig. 1C), respectively. Increased ionic strength predominantly reduces the strength of hydrophilic interactions. Nevertheless out of 25 of the best-binding mutations, 13 affected polar residues including 10 residues that are charged under physiological conditions. Similarly, 10 of the worst 25 binding mutations affect polar residues including 4 charged residues. This even distribution between polar and hydrophobic residues throughout the dataset is in agreement with the idea that arrestin binding involves a multitude of hydrophilic and hydrophobic interactions, as well as specific conformational changes and is not dominated by a few charged interactions. However, weakening of polar interactions by increasing salt concentrations is sufficient to inhibit complex formation, an effect that is altered when additional hydrophobic interactions are weakened by mutagenesis. Principally, salt acts as a classical multisite inhibitor in a competition-binding experiment, allowing us to compare the relative effects of arrestin-1 mutations affecting both hydrophilic and hydrophobic interactions. Whereas many mutations affected specific arrestin activation sensors and receptor-binding sites (see Results and Discussion, Functional Map of Arrestin-1), several mutations affected the packing of the arrestin β-sheets. Mutation of all residues pointing from β-strand XIV into the C domain, for example, moderately increased binding, likely because they increase the structural flexibility of the protein. The identification of such stretches and structural regions within the protein is one of the strengths of our comprehensive approach, as it allows us to connect functional regions and overall increases the reliability of the individual measurements.
Functional Map of Arrestin-1.
Plotted on the crystal structure of the arrestin basal state (Fig. 2), our data highlight the regions involved in binding to rhodopsin and allow a quantitative interpretation of the mechanisms of arrestin regulation. Arrestins are elongated molecules consisting of two cup-like domains predominately formed by the N- and C-terminal parts of the protein. Each of the two domains, named “N domain” (residues 8–180) and “C domain” (residues 188–362) is constructed from a seven-strand sandwich whose loops form much of the interface between the domains. Mutations affecting rhodopsin binding were sparser in the C domain and had weaker effects compared with those in the N domain (Fig. 2). The strongest effect was achieved by several mutations along the arrestin C tail (C terminus starting from residue 375), which folds back over the N domain. This region is known as a three-element interaction site because the C tail interacts with β-strand I and α-helix I. Disruption of these interactions by mutagenesis yields constitutively active arrestins with dramatically reduced selectivity: high binding to P-ROS* and significantly enhanced binding to the nonpreferred forms of rhodopsin in inactive P-ROS and unphosphorylated ROS* (21, 22). In agreement with these results we observed increased binding after mutation of Phe375, Val376, and Phe377 of the C tail; His10, Val11, and Phe13 of β-sheet I; and Leu111 in α-helix I. Interestingly, mutation of Phe375 and Phe377 are among the strongest binding mutations with IC50 values of 1.28 ± 0.17 M and 1.08 ± 0.11 M respectively. In comparison the effect of mutations in β-strand I and α-helix I was less pronounced and increased salt tolerance to between 0.67 ± 0.06 M and 0.84 ± 0.06 M. The smaller effect of mutations in the two elements (β-strand I and α-helix I) that clamp the C tail in inactive arrestin-1, suggests that the main role of the three-element interaction is to restrain the C tail in the basal arrestin conformation. The critical role of the arrestin C tail is further confirmed by mutation of Phe380, whose phenolic side chain is buried deeply within arrestin where it interacts with Arg29 in the inactive conformation (Fig. 3). Two residues further along the polypeptide chain, Arg382 anchors the C tail within the polar core, one of the phosphate-sensing regions in arrestin (17, 21). The polar core is maintained by extensive charge–charge interactions between the N and C domains of the molecule and comprises charged residues from the very N terminus (Asp30), the body of the N domain (Arg175), the interfacial loop of the C domain (Asp303), and the C tail (Arg382). Disruption of either of these charged interactions by alanine mutations leads to increased IC50 values with the strongest effects observed by mutation Arg382Ala in the C tail. Besides mutagenesis of charged residues in the polar core, mutating the uncharged residue Gly297 strongly increased binding to rhodopsin. Likely the methyl group introduced by the Gly-to-Ala substitution introduces a steric disturbance into the polar core by clashing with the position of Thr304, another residue facing the polar core whose mutation leads to significantly increased binding. Altogether it is striking to note that 9 of the 10 best binding mutations are located in either the polar core or the C tail of arrestin, highlighting the special importance of these regions.
Fig. 2.

Functional map of arrestin-1 at single amino acid resolution. Relative binding of arrestin mutants (IC50 values shown as increasing ribbon width and as spectrum ranging from red over white to blue) plotted on the crystal structure of arrestin-1 in the basal conformation (8). Details of functional regions (circled) involved in binding to light-activated rhodopsin and phosphosensing are available as Figs. S6 and S7.
Fig. 3.

Phosphosensing mechanism in arrestin-1. Binding of arrestin mutants (blue and ribbon width indicate residues which increase binding to P-ROS* upon mutation; red indicates residues which decrease binding to P-ROS* upon mutation) plotted on the crystal structures of inactive (8), preactivated p44 arrestin (9), and a homology model of arrestin-1 based on the crystal structure of arrestin-2 bound to a receptor phosphopetide (10). Several residues including three hydrophobic phenylalanines (Phe375, Phe377, and Phe380) and the charged Arg382 anchor the C tail of arrestin-1 into the three-element interaction and polar core regulatory sites (Left). Mutation of these key residues and their interaction partners remove restraints that stabilize the inactive arrestin conformation leading to increased binding (blue) to phosphorylated, light-activated rhodopsin. In p44 arrestin with a truncated C tail (Center), reorganization of the three-element interaction site and the polar core increases solvent accessibility of Arg29 and several charged residues whose mutation leads to strongly reduced binding (red) to phosphorylated rhodopsin. Homology modeling of arrestin-1 on the structure of arrestin-2 with bound phosphopeptide (Right) shows how these residues can interact with phosphorylated serines and threonines in the vasopressin receptor peptide (green, V2Rpp). The C terminus of rhodopsin can be placed in a similar position (Fig. S4).
The importance of the arrestin C tail had been recognized early on based on limited proteolysis studies (23). Release of the C tail is one of the major conformational changes occurring during arrestin activation as suggested by the sequential multisite binding model (17) and confirmed by EPR (24) and NMR (20) spectroscopic studies. The recent crystal structure of p44 arrestin-1, lacking the arrestin C tail, revealed marked conformational changes compared with a previous structure of p44 arrestin-1 (25), including a 20° rotation between the C and N domains (9) as had previously been suggested based on arrestin truncations (26) and molecular modeling (27). It is yet unclear to what extent this structure represents arrestin in the receptor-bound conformation. However, plotting of our functional data against these conformational changes (Fig. S3) shows how the critical interactions along the C tail (described above) are released and result in reorganization of the three-element interaction and polar core regulatory sites (Fig. 3). Release of the C tail from its basal position and reorganization of the protein increases solvent accessibility of several positively charged residues that reduce binding to phosphorylated rhodopsin upon mutation. Among those are Lys14, Lys15, and Lys110 close to the three-element interaction site. Another one is Lys300 in the gate loop (residues Asp296–Asn305) that reorganizes during breakage of the polar core (9). The weakest binder revealed by our screen, Arg29, is located in the center of this positively charged region. Homology modeling of arrestin-1 on the structure of arrestin-2 containing the vasopressin receptor phosphopeptide V2Rpp (10) confirms this region as a direct interaction site for phosphorylated rhodopsin residues along the rhodopsin C terminus (Fig. S4). In the inactive conformation, the charged Arg29 side chain is exposed to the solvent but also interacts with Phe380, the phenylalanine that anchors the C tail between the polar core and the three-element regulatory site. This special location, together with the strong effect of Arg29 mutation on P-ROS* binding, support a phosphosensing mechanism in which Arg29 controls a switch between the arrestin-1 C tail for the phosphorylated C terminus of rhodopsin.
After arrestin-1 recognizes the phosphorylated C terminus of the receptor, the sequential multisite binding model predicts that arrestin detects the active receptor state (17). Suggested recognition sites in arrestin include the middle loop (Gln133–Ser142) (24, 28, 29), the finger loop (Gly68–Leu77) (24, 30, 31), and the lariat loop (Asn246–Tyr254) (11), all located in the central region between the C and N domains. Within our scan, mutations in the middle loop had only a marginal effect, whereas five mutations in the finger loop (Gln69, Asp73, Val74, Met75, and Leu77) and five in the lariat loop (Leu249, Tyr250, Ser251, Ser252, and Tyr254) diminished binding to light-activated rhodopsin (Fig. 2). Interestingly, only the middle and finger loops undergo large conformational changes during activation, whereas those in the lariat loop are much less pronounced (Fig. S3). Release of the C tail however exposes the lariat loop so that both finger and lariat loop are available as the major interaction site with the activated receptor.
Experimentally Guided Docking of the Arrestin–Rhodopsin Complex.
The binding stoichiometry between GPCRs and arrestins remains to be fully established. In the visual system, arrestin-1 saturates phosphorylated light-activated rhodopsin at a 1:1 molar ratio (32) and binds monomeric rhodopsin reconstituted into nanodiscs with high affinity (19, 33). Our mutagenesis data show that both arrestin grooves do not bind rhodopsin to the same extent (Fig. 1) with a clear preference for the N domain containing the phosphosensing region and the lariat and finger loops in the central region between the two domains. To study whether these interaction surfaces could be satisfied simultaneously in a 1:1 arrestin–receptor complex we modeled the C terminus of rhodopsin along the position of the V2Rpp peptide into arrestin-1 and performed molecular docking studies with the structure of light-activated rhodopsin (4) (Fig. 4). As initial constraints for the model of the complex, we placed H8 in a position where it could join the modeled rhodopsin C terminus and close to the arrestin-1 phosphosensor. It should be noted that the C terminus of the V2 receptor is four residues shorter compared with rhodopsin (Figs. S4 and S5) and differs in the relative position of phosphorylatable Thr and Ser residues. Rhodopsin, for example, lacks a phosphate that could interact with Gln69 in the arrestin finger loop (Fig. 3). Relative positions of phosphorylatable residues may thus be involved in determining receptor specificity.
Fig. 4.

Experimentally guided docking of an arrestin–GPCR complex (Left). The phosphorylated C terminus of rhodopsin binds along the arrestin N domain and interacts with several charged residues exposed during release of the arrestin C terminus. The finger and lariat loops (Right Top and Right Middle Insets) fit into the crevice opening during rhodopsin activation (34). The lariat loop mediates contacts to the cytoplasmic ends of TM6 and TM7–H8, two regions whose relative position is involved in the biased signaling of β-adrenergic receptors (36) and arrestin binding to rhodopsin (37). The edge of the C domain (Right Bottom Inset) contains a set of amino acids that could interact with the phospholipid membrane or form a secondary binding site for GPCR dimers. Alternatively, conformational changes in either rhodopsin or arrestin-1 could bridge the ∼15-Å distance to TM6. However, residues in the C edge are not particularly conserved with average sequence entropy of 0.46 among 39 proteins with more than 70% identity to bovine arrestin-1. In contrast the lariat loop, the finger loop, and phosphate-binding residues are more widely conserved with average sequence entropies of 0.04, 0.10, and 0.12, respectively. Sequence entropies were determined using protein interface evaluation with evolutionary analysis (51).
As a second anchoring point, beside the phosphorylated C terminus, we placed the finger loop into the central crevice that opens upon activation of rhodopsin and mediates interaction with the C terminus of the Gα subunit (34). This initial pose was optimized by multiple runs of molecular docking using Rosetta (35). Among the best-scoring hits we chose the model in best agreement with the experimental binding map. This experimentally guided model of the arrestin–rhodopsin complex shows the arrestin finger loop (Fig. 4, Right Top Inset) near the cytoplasmic side of TM4 and in close contact with the intracellular loop 1 connecting TM1 and TM2. On the other side of the finger loop, the tip of the lariat loop interacts with the cytoplasmic ends of TM6 and TM7–H8 in rhodopsin (Fig. 4, Right Middle Inset), whose relative position has been implicated in arrestin-biased agonism in β-adrenergic receptors (36) and arrestin binding to rhodopsin (37). Also, the introduction of a salt-bridge between TM3 and TM7 by the night blindness causing rhodopsin mutant G90D reduces its ability to bind arrestin (38, 39). Together, the finger and lariat loop could thus create an activity sensor that specifically interacts with helices critical for GPCR activation.
Although this binding mode explains the major interaction sites in the N domain, it does not account for two stretches of residues at the edge of the C domain (Trp194–Ser199 and Gly337–Thr345 of the C loop), whose mutation strongly reduces binding. This region is part of the arrestin dimerization interface with mutation of Phe197 directly interfering with arrestin oligomerization (40, 41). However, arrestin binds rhodopsin as a monomer and the high self-association constant of arrestin (KDtet = 7.5µM) (40) suggests that arrestin oligomerization is marginal at the assayed conditions. Interference with oligomerization is thus an unlikely reason for the lower binding upon mutagenesis of this region. Interestingly preactivation of arrestin leads to reorganization of the C edge into a continuous interface (Fig. 4, Right Bottom Inset and Figs. S6 and S7). Principally, the reorganized interface could thus provide a secondary binding site for the accommodation of a GPCR dimer. Indeed it has been suggested that the arrestin C loop binds a second rhodopsin molecule in disc membranes containing high levels of activated rhodopsin (18, 42). Site-directed spin-labeling studies, on the other hand, revealed a high flexibility of this arrestin region upon binding to both highly activated P-ROS* and nanodiscs containing only monomeric P-rhodopsin* (28). In absence of a second receptor, the mostly hydrophobic C edge could thus interface with the phospholipid membrane in agreement with the strong lipid dependence of arrestin–rhodopsin complex formation (19, 33, 43). Lys232 and Gln195 close to the C edge may interact with acidic phospholipids known to facilitate rhodopsin binding (43). As a third possibility, beside a rhodopsin dimer or interaction of the C edge with the phospholipid membrane, both arrestin and rhodopsin will undergo conformational changes that cannot be anticipated from the currently available crystal structures. Such conformational changes are in agreement with the structure of the β2-adrenergic receptor–G protein complex (6) which, in comparison with metarhodopsin-II (4, 5) and an active nanobody stabilized β2-adrenergic receptor state (44), showed a large outward movement of TM6 upon G protein binding. In addition to rearrangements in the receptor, solution NMR suggested a global transition of arrestin-1 upon binding to rhodopsin, due to the adaptation of a dynamic molten globule-like structure (20). Conformational changes in both arrestin and rhodopsin upon complex formation may thus explain the large distance between the major interaction surfaces revealed by our scanning mutagenesis.
Using high-throughput mutagenesis and binding assays we have compared 403 mutants covering the complete arrestin-1 sequence. This substantial effort provides a single amino acid resolution map of the residues involved in rhodopsin binding that will be of particular importance once a crystal structure of the arrestin–rhodopsin complex becomes available. Systematic mutagenesis has been tremendously successful for the conformational thermostabilization and structure determination of GPCRs (14). The methods described here provide the means to use a similar strategy for the crystallographic structure determination of the arrestin–rhodopsin complex. The combination of mutants will facilitate engineering of arrestin-1 with specific functional characteristics (45, 46). Transfer of mutations to arrestin-2 and arrestin-3 sets the stage to develop diagnostic and therapeutic tools to study diseases caused by hyperactivity of other GPCRs.
Materials and Methods
Preparation of Rhodopsin in ROS.
ROS were prepared from bovine retinas under dim red light as described (47). Rhodopsin was phosphorylated, essentially as described (48), yielding a mixture of rhodopsin species containing any number of phosphates up to seven phosphate groups per molecule with three phosphates sufficient for high-affinity rhodopsin binding (49).
Scanning Mutagenesis.
Bovine arrestin-1 was cloned into the EgWoMiPi vector for expression in bacterial and mammalian cells (Fig. S8). Mutations were introduced by PCR assisted by the AAscan program suite (16) available from our Web site, www.psi.ch/lbr/aascan. Scanning mutagenesis is further described in SI Materials and Methods.
Arrestin Binding Assay.
Arrestin mutants were expressed in E. coli in sets of 12, each including wild type as reference for relative expression levels. Per day, ROS-P* binding of mutants in 3 sets was compared using a 96-well centrifugal, pull-down assay (Fig. S1). The data were fitted to sigmoidal dose–response curves with variable slope to extract IC50 values. IC50 and R2 values, 95% confidence intervals, and the number of measurements are listed in Table S1.
Molecular Docking.
Peptide-bound bovine arrestin-1 was modeled with Modeller (50) using the structure of rat arrestin-2 bound to a GPCR phosphopeptide (10) as a template. Next we docked the model of peptide-bound arrestin-1 to the structure of light-activated rhodopsin (Protein Data Bank ID code 4A4M) (4) guided by the scanning mutagenesis data. Energy minimization was used to optimize the geometry of the side chains and the residue–residue interactions in the protein interface. Additional details are described in SI Materials and Methods.
Supplementary Material
Acknowledgments
We thank the staff at the Paul Scherrer Institute Protein Production Platform (P4) for general support and Dmitry Veprintsev and Seva Gurevich for discussions and critical reading of the manuscript. We also thank the Swiss National Science Foundation for financial support through Grants 31003A_132815 (to X.D. and J.S.), 31003A_146520 (to X.D.), and 31003A_141235 (to J.S.).
Footnotes
The authors declare no conflict of interest.
This article is a PNAS Direct Submission.
This article contains supporting information online at www.pnas.org/lookup/suppl/doi:10.1073/pnas.1319402111/-/DCSupplemental.
References
- 1.Deupi X, Standfuss J. Structural insights into agonist-induced activation of G-protein-coupled receptors. Curr Opin Struct Biol. 2011;21(4):541–551. doi: 10.1016/j.sbi.2011.06.002. [DOI] [PubMed] [Google Scholar]
- 2.Lefkowitz RJ, Shenoy SK. Transduction of receptor signals by beta-arrestins. Science. 2005;308(5721):512–517. doi: 10.1126/science.1109237. [DOI] [PubMed] [Google Scholar]
- 3.Standfuss J, et al. The structural basis of agonist-induced activation in constitutively active rhodopsin. Nature. 2011;471(7340):656–660. doi: 10.1038/nature09795. [DOI] [PMC free article] [PubMed] [Google Scholar]
- 4.Deupi X, et al. Stabilized G protein binding site in the structure of constitutively active metarhodopsin-II. Proc Natl Acad Sci USA. 2012;109(1):119–124. doi: 10.1073/pnas.1114089108. [DOI] [PMC free article] [PubMed] [Google Scholar]
- 5.Choe H-W, et al. Crystal structure of metarhodopsin II. Nature. 2011;471(7340):651–655. doi: 10.1038/nature09789. [DOI] [PubMed] [Google Scholar]
- 6.Rasmussen SG, et al. Crystal structure of the β2 adrenergic receptor-Gs protein complex. Nature. 2011;477(7366):549–555. doi: 10.1038/nature10361. [DOI] [PMC free article] [PubMed] [Google Scholar]
- 7.Granzin J, et al. X-ray crystal structure of arrestin from bovine rod outer segments. Nature. 1998;391(6670):918–921. doi: 10.1038/36147. [DOI] [PubMed] [Google Scholar]
- 8.Hirsch JA, Schubert C, Gurevich VV, Sigler PB. The 2.8 A crystal structure of visual arrestin: A model for arrestin’s regulation. Cell. 1999;97(2):257–269. doi: 10.1016/s0092-8674(00)80735-7. [DOI] [PubMed] [Google Scholar]
- 9.Kim YJ, et al. Crystal structure of pre-activated arrestin p44. Nature. 2013;497(7447):142–146. doi: 10.1038/nature12133. [DOI] [PubMed] [Google Scholar]
- 10.Shukla AK, et al. Structure of active β-arrestin-1 bound to a G-protein-coupled receptor phosphopeptide. Nature. 2013;497(7447):137–141. doi: 10.1038/nature12120. [DOI] [PMC free article] [PubMed] [Google Scholar]
- 11.Pulvermüller A, Schroder K, Fischer T, Hofmann KP. Interactions of metarhodopsin II. Arrestin peptides compete with arrestin and transducin. J Biol Chem. 2000;275(48):37679–37685. doi: 10.1074/jbc.M006776200. [DOI] [PubMed] [Google Scholar]
- 12.Smith WC, Dinculescu A, Peterson JJ, McDowell JH. The surface of visual arrestin that binds to rhodopsin. Mol Vis. 2004;10:392–398. [PubMed] [Google Scholar]
- 13.Gurevich VV, Benovic JL. Cell-free expression of visual arrestin. Truncation mutagenesis identifies multiple domains involved in rhodopsin interaction. J Biol Chem. 1992;267(30):21919–21923. [PubMed] [Google Scholar]
- 14.Tate CG. A crystal clear solution for determining G-protein-coupled receptor structures. Trends Biochem Sci. 2012;37(9):343–352. doi: 10.1016/j.tibs.2012.06.003. [DOI] [PubMed] [Google Scholar]
- 15.Cunningham BC, Wells JA. High-resolution epitope mapping of hGH-receptor interactions by alanine-scanning mutagenesis. Science. 1989;244(4908):1081–1085. doi: 10.1126/science.2471267. [DOI] [PubMed] [Google Scholar]
- 16.Sun D, et al. AAscan, PCRdesign and MutantChecker: A Suite of Programs for Primer Design and Sequence Analysis for High-Throughput Scanning Mutagenesis. PLoS ONE. 2013;8(10):e78878. doi: 10.1371/journal.pone.0078878. [DOI] [PMC free article] [PubMed] [Google Scholar]
- 17.Gurevich VV, Benovic JL. Visual arrestin interaction with rhodopsin. Sequential multisite binding ensures strict selectivity toward light-activated phosphorylated rhodopsin. J Biol Chem. 1993;268(16):11628–11638. [PubMed] [Google Scholar]
- 18.Sommer ME, Hofmann KP, Heck M. Distinct loops in arrestin differentially regulate ligand binding within the GPCR opsin. Nat Commun. 2012;3:995. doi: 10.1038/ncomms2000. [DOI] [PMC free article] [PubMed] [Google Scholar]
- 19.Bayburt TH, et al. Monomeric rhodopsin is sufficient for normal rhodopsin kinase (GRK1) phosphorylation and arrestin-1 binding. J Biol Chem. 2011;286(2):1420–1428. doi: 10.1074/jbc.M110.151043. [DOI] [PMC free article] [PubMed] [Google Scholar]
- 20.Zhuang T, et al. Involvement of distinct arrestin-1 elements in binding to different functional forms of rhodopsin. Proc Natl Acad Sci USA. 2013;110(3):942–947. doi: 10.1073/pnas.1215176110. [DOI] [PMC free article] [PubMed] [Google Scholar]
- 21.Vishnivetskiy SA, et al. How does arrestin respond to the phosphorylated state of rhodopsin? J Biol Chem. 1999;274(17):11451–11454. doi: 10.1074/jbc.274.17.11451. [DOI] [PubMed] [Google Scholar]
- 22.Gurevich VV. The selectivity of visual arrestin for light-activated phosphorhodopsin is controlled by multiple nonredundant mechanisms. J Biol Chem. 1998;273(25):15501–15506. doi: 10.1074/jbc.273.25.15501. [DOI] [PubMed] [Google Scholar]
- 23.Palczewski K, Buczyłko J, Imami NR, McDowell JH, Hargrave PA. Role of the carboxyl-terminal region of arrestin in binding to phosphorylated rhodopsin. J Biol Chem. 1991;266(23):15334–15339. [PubMed] [Google Scholar]
- 24.Hanson SM, et al. Differential interaction of spin-labeled arrestin with inactive and active phosphorhodopsin. Proc Natl Acad Sci USA. 2006;103(13):4900–4905. doi: 10.1073/pnas.0600733103. [DOI] [PMC free article] [PubMed] [Google Scholar]
- 25.Granzin J, et al. Crystal structure of p44, a constitutively active splice variant of visual arrestin. J Mol Biol. 2012;416(5):611–618. doi: 10.1016/j.jmb.2012.01.028. [DOI] [PubMed] [Google Scholar]
- 26.Vishnivetskiy SA, Hirsch JA, Velez M-G, Gurevich YV, Gurevich VV. Transition of arrestin into the active receptor-binding state requires an extended interdomain hinge. J Biol Chem. 2002;277(46):43961–43967. doi: 10.1074/jbc.M206951200. [DOI] [PubMed] [Google Scholar]
- 27.Modzelewska AA, Filipek SS, Palczewski KK, Park PS-HP. Arrestin interaction with rhodopsin: Conceptual models. Cell Biochem Biophys. 2006;46(1):1–15. doi: 10.1385/CBB:46:1:1. [DOI] [PubMed] [Google Scholar]
- 28.Kim M, et al. Conformation of receptor-bound visual arrestin. Proc Natl Acad Sci USA. 2012;109(45):18407–18412. doi: 10.1073/pnas.1216304109. [DOI] [PMC free article] [PubMed] [Google Scholar]
- 29.Vishnivetskiy SA, Baameur F, Findley KR, Gurevich VV. Critical role of the central 139-loop in stability and binding selectivity of arrestin-1. J Biol Chem. 2013;288(17):11741–11750. doi: 10.1074/jbc.M113.450031. [DOI] [PMC free article] [PubMed] [Google Scholar]
- 30.Feuerstein SE, et al. Helix formation in arrestin accompanies recognition of photoactivated rhodopsin. Biochemistry. 2009;48(45):10733–10742. doi: 10.1021/bi900544p. [DOI] [PubMed] [Google Scholar]
- 31.Sommer ME, Farrens DL, McDowell JH, Weber LA, Smith WC. Dynamics of arrestin-rhodopsin interactions: Loop movement is involved in arrestin activation and receptor binding. J Biol Chem. 2007;282(35):25560–25568. doi: 10.1074/jbc.M702155200. [DOI] [PubMed] [Google Scholar]
- 32.Hanson SM, et al. Each rhodopsin molecule binds its own arrestin. Proc Natl Acad Sci USA. 2007;104(9):3125–3128. doi: 10.1073/pnas.0610886104. [DOI] [PMC free article] [PubMed] [Google Scholar]
- 33. Tsukamoto H, Sinha A, DeWitt M, Farrens DL (2010) Monomeric rhodopsin is the minimal functional unit required for arrestin binding. J Mol Biol 399(3):501–511. [DOI] [PMC free article] [PubMed]
- 34.Scheerer P, et al. Crystal structure of opsin in its G-protein-interacting conformation. Nature. 2008;455(7212):497–502. doi: 10.1038/nature07330. [DOI] [PubMed] [Google Scholar]
- 35.Wang C, Bradley P, Baker D. Protein-protein docking with backbone flexibility. J Mol Biol. 2007;373(2):503–519. doi: 10.1016/j.jmb.2007.07.050. [DOI] [PubMed] [Google Scholar]
- 36.Liu JJ, Horst R, Katritch V, Stevens RC, Wüthrich K. Biased signaling pathways in β2-adrenergic receptor characterized by 19F-NMR. Science. 2012;335(6072):1106–1110. doi: 10.1126/science.1215802. [DOI] [PMC free article] [PubMed] [Google Scholar]
- 37.Kirchberg K, et al. Conformational dynamics of helix 8 in the GPCR rhodopsin controls arrestin activation in the desensitization process. Proc Natl Acad Sci USA. 2011;108(46):18690–18695. doi: 10.1073/pnas.1015461108. [DOI] [PMC free article] [PubMed] [Google Scholar]
- 38.Singhal A, et al. Insights into congenital stationary night blindness based on the structure of G90D rhodopsin. EMBO Rep. 2013;14(6):520–526. doi: 10.1038/embor.2013.44. [DOI] [PMC free article] [PubMed] [Google Scholar]
- 39.Vishnivetskiy SA, et al. Constitutively active rhodopsin mutants causing night blindness are effectively phosphorylated by GRKs but differ in arrestin-1 binding. Cell Signal. 2013;25(11):2155–2162. doi: 10.1016/j.cellsig.2013.07.009. [DOI] [PMC free article] [PubMed] [Google Scholar]
- 40.Hanson SM, et al. Structure and function of the visual arrestin oligomer. EMBO J. 2007;26(6):1726–1736. doi: 10.1038/sj.emboj.7601614. [DOI] [PMC free article] [PubMed] [Google Scholar]
- 41.Hanson SM, et al. A model for the solution structure of the rod arrestin tetramer. Structure. 2008;16(6):924–934. doi: 10.1016/j.str.2008.03.006. [DOI] [PMC free article] [PubMed] [Google Scholar]
- 42.Sommer ME, Hofmann KP, Heck MM. Arrestin-rhodopsin binding stoichiometry in isolated rod outer segment membranes depends on the percentage of activated receptors. J Biol Chem. 2011;286(9):7359–7369. doi: 10.1074/jbc.M110.204941. [DOI] [PMC free article] [PubMed] [Google Scholar]
- 43.Sommer ME, Smith WC, Farrens DL. Dynamics of arrestin-rhodopsin interactions: Acidic phospholipids enable binding of arrestin to purified rhodopsin in detergent. J Biol Chem. 2006;281(14):9407–9417. doi: 10.1074/jbc.M510037200. [DOI] [PubMed] [Google Scholar]
- 44.Rasmussen SGF, et al. Structure of a nanobody-stabilized active state of the β(2) adrenoceptor. Nature. 2011;469(7329):175–180. doi: 10.1038/nature09648. [DOI] [PMC free article] [PubMed] [Google Scholar]
- 45.Gimenez LE, Vishnivetskiy SA, Baameur F, Gurevich VV. Manipulation of very few receptor discriminator residues greatly enhances receptor specificity of non-visual arrestins. J Biol Chem. 2012;287(35):29495–29505. doi: 10.1074/jbc.M112.366674. [DOI] [PMC free article] [PubMed] [Google Scholar]
- 46.Vishnivetskiy SA, et al. Engineering visual arrestin-1 with special functional characteristics. J Biol Chem. 2013;288(5):3394–3405. doi: 10.1074/jbc.M112.445437. [DOI] [PMC free article] [PubMed] [Google Scholar]
- 47.Edwards PC, et al. Crystals of native and modified bovine rhodopsins and their heavy atom derivatives. J Mol Biol. 2004;343(5):1439–1450. doi: 10.1016/j.jmb.2004.08.089. [DOI] [PubMed] [Google Scholar]
- 48.McDowell JH, Nawrocki JP, Hargrave PA. Isolation of isoelectric species of phosphorylated rhodopsin. Methods Enzymol. 2000;315:70–76. doi: 10.1016/s0076-6879(00)15835-5. [DOI] [PubMed] [Google Scholar]
- 49.Vishnivetskiy SA, et al. Regulation of arrestin binding by rhodopsin phosphorylation level. J Biol Chem. 2007;282(44):32075–32083. doi: 10.1074/jbc.M706057200. [DOI] [PMC free article] [PubMed] [Google Scholar]
- 50.Eswar N, et al. Comparative Protein Structure Modeling Using Modeller. Hoboken, NJ: John Wiley & Sons; 2002. [Google Scholar]
- 51.Duarte JM, Srebniak A, Schärer MA, Capitani G. Protein interface classification by evolutionary analysis. BMC Bioinformatics. 2012;13:334. doi: 10.1186/1471-2105-13-334. [DOI] [PMC free article] [PubMed] [Google Scholar]
Associated Data
This section collects any data citations, data availability statements, or supplementary materials included in this article.