

Significance
We show that a nonlinear microscopy technique (femtosecond pump-probe microscopy) allows for nondestructive 3D imaging of paintings with molecular and structural contrast. Until now, studying the layering structure of a painting has generally required the physical removal of a cross-section sample. Pump-probe imaging has previously been shown on biological tissue, but applications to cultural heritage are more challenging: the variety of pigments in the artist’s palate is enormous compared with the biological pigments present in skin. Nonetheless, we show virtual cross-sectioning capabilities in mockup paintings and nondestructive imaging on an intact 14th century painting. This work represents a comprehensive collaborative effort between laser and biomedical imaging experts and scientists and conservators in national museums.
Keywords: nonlinear imaging, pigment spectroscopy
Abstract
The layering structure of a painting contains a wealth of information about the artist's choice of materials and working methods, but currently, no 3D noninvasive method exists to replace the taking of small paint samples in the study of the stratigraphy. Here, we adapt femtosecond pump-probe imaging, previously shown in tissue, to the case of the color palette in paintings, where chromophores have much greater variety. We show that combining the contrasts of multispectral and multidelay pump-probe spectroscopy permits nondestructive 3D imaging of paintings with molecular and structural contrast, even for pigments with linear absorption spectra that are broad and relatively featureless. We show virtual cross-sectioning capabilities in mockup paintings, with pigment separation and nondestructive imaging on an intact 14th century painting (The Crucifixion by Puccio Capanna). Our approach makes it possible to extract microscopic information for a broad range of applications to cultural heritage.
Identifying an artist’s choice of materials (e.g., support, pigments, binders, and varnishes in a painting) and working methods can lead to greater understanding of past cultures and enhance the ability of conservators to preserve that culture. In a painting, this information is contained in its layered structure, and it is generally studied by the physical removal of a small paint sample, which can be characterized by a plethora of analytical techniques (1). The sample needs to be representative of the painting but as small as possible (typically <0.5 mm), and only local information is obtained. Nondestructive analysis by traditional macroscopic methods, such as X-radiography, near-infrared reflectance imaging, and UV-visible fluorescence photography, can provide some information about a painting’s support, compositional paint changes, underdrawings, paint and varnish applications, and restorations (1). Materials can be identified in situ on the microscopic scale using Raman (2–4) or the macroscopic scale with reflectance imaging spectroscopy (5, 6) and X-ray fluorescence intensity mapping (7). Unfortunately, none of these techniques contain quantitative depth-resolved material information. Methods that could offer 3D information are under active research, such as confocal X-ray fluorescence, absorption near-edge structure imaging (8), optical coherence tomography (9), and terahertz imaging (10), but they are not yet widely used in conservation science laboratories because of their limitations: X-ray–based techniques have absorption limited depths, whereas optical coherence tomography and terahertz imaging produce image contrast that is largely based on refractive index mismatches and therefore, only provide structural contrast.
In general, conventional (linear) optical imaging into the paint layer of a painting is limited in its depth penetration by absorption and scattering from the pigment particles. In biology and biomedical applications, nonlinear imaging can provide optical sectioning in highly scattering and absorbing samples (11, 12). Traditional nonlinear imaging has found a few applications to cultural heritage; recent research includes the 3D imaging of wood and varnishes in a violin with second harmonic generation and two-photon excited fluorescence (13) and the mapping of oil and varnish interfaces with third harmonic generation (14). However, most inorganic pigments neither fluoresce nor generate appreciable harmonic light, leaving these techniques limited in their scope for cultural heritage.
Near-infrared femtosecond pump-probe optical microscopy expands the range of detectable molecular signatures (15) to include signals from excited state absorption, ground state depletion, and stimulated emission (16). This microscopy technique was mainly developed for biomedical imaging and has been used to provide high-resolution images for the biological pigments hemoglobin (17, 18), eumelanin, and pheomelanin (19, 20) that are present in skin (21) or ocular cancer (22).
Extension of pump-probe microscopy from biological pigments to samples of artist’s pigments has yielded promising preliminary results (23). However, achieving pump-probe contrast in fine art objects is more challenging than skin imaging, because artist colorants range from organic dyes to inorganic minerals, with colors spanning the entire visible spectrum. In contrast, the pigments in a sample of skin tissue are mainly limited to hemoglobin, eumelanin, and pheomelanin, which all provide image contrast with a single pump-probe wavelength combination (in this case, 720 and 810 nm, respectively). Here, we show that an increased spectral range of both the pump and the probe beams, from near-IR to visible, and a variable time delay of the pump-probe pulses help to address the complexity introduced by the large range of possible pigments in the paint layers and allow for in situ 3D imaging of paintings with molecular specificity. We first show virtual cross-sectioning capabilities in historically relevant mockup paintings and use specific pump-probe signatures to provide pigment separation. We then perform in situ 3D imaging on a 14th century painting (The Crucifixion by Italian artist Puccio Capanna) to highlight our ability to noninvasively image and create virtual cross-sections of complex pigment layers. Although we focus on historic paintings, our approach can be applied to a wide range of cultural heritage objects and provides information extremely relevant to current areas of interest in conservation science.
Results
Approach.
Pump-probe microscopy uses a sequence of ultrafast pulses (typically 0.2 ps in duration) to first electronically excite molecules and then probe their response at a later time (up to about 100 ps). A pump pulse moves a fraction of the ground state population into electronic excited states, creating a corresponding hole in the ground state spectral distribution. In response to the excitation, the population distributions in both ground and excited states rearrange (excited state population tends to eventually relax back to the ground state). The changes in population can be monitored by applying a second delayed (probe) pulse. Different molecular processes have different effects on the probe pulse as a function of pump intensity and pump-probe delay. For example, in sequential two-photon absorption, the probe is absorbed only by molecules in the excited state; hence, the presence of the pump increases the probe absorption (the absorption then diminishes for longer delays). In contrast, for ground state depletion, the probe is absorbed by molecules remaining in the ground state, which has been partially depleted by the pump; hence, the presence of the pump decreases the probe absorption (probe absorption increases back to the equilibrium value for long delays). Pump-probe spectroscopy has been a mainstay of chemical physics for decades using high-powered lasers; however, at the powers that we are willing to use on important artwork, the differences in absorption might typically be 1 part in 106 parts or a tiny signal on a large background. A schematic of our experimental setup (Fig. 1) shows our solution to this challenge (17, 18). The pump is an intensity-modulated, mode-locked pulse train, which is synchronized and combined with an unmodulated probe pulse train and coupled into a laser-scanning microscope. Nonlinear interactions in the focal volume within the sample will cause the modulation to transfer from the pump to the probe. The modulation frequency is several megahertz, chosen to overcome the noise spectrum of laser fluctuations. Pump-probe microscopy, like other nonlinear imaging methods, is much less affected by light scattering than conventional microscopy; the signal is proportional to the product of the intensities of the two lasers, causing scattered light to produce much less signal and giving the method its power in 3D imaging.
Fig. 1.

Schematic of experimental setup. Pump-probe imaging uses an intensity-modulated pump pulse train and a nonmodulated probe pulse train separated by a variable time delay. Nonlinear interactions at the sample cause the pump modulation to transfer to the probe, which is detected by a lock-in amplifier. The pump is filtered out, and a series of images is collected, each with a different interpulse delay. AOM, acousto-optic modulator.
Pump-Probe Specificity in Quinacridone Red and Ultramarine Blue.
In a typical painting, the 3D structure could consist of single to multiple colorants in layers, mixtures, or a combination of layers and mixtures. Given the limited available colorants in Italian renaissance paintings compared with contemporary works, purples were often made using combinations of red pigments, such as kermes or red madder (both substituted anthraquinone), mixed or layered with blue mineral pigments, such as natural ultramarine or azurite. The combination of kermes and natural ultramarine (lapis lazuli, which during the time, was more expensive than gold) gives a rich purple. Such a combination would be suitable for the robes of major characters of a painting, such as the Madonna’s robe, whereas a combination with the cheaper azurite can give a danker muted purple useful for less prominent figures.
To test our virtual cross-section capabilities to separate mixtures vs. layering of pigments, we began by creating a set of mockup paintings that features historically relevant pigment pairings. In one case, a blue pigment (synthetic ultramarine) has been covered with a thin glaze of red pigment (quinacridone red, a modern transparent, light-stable replacement for the natural substituted anthraquinone) to create a purple appearance. In another case, a blue pigment (lapis lazuli) has been mixed with the same red pigment to create a similar purple appearance. To take a virtual cross-section, we first determined the pump-probe wavelength combinations and interpulse delays that would fully separate ultramarine blue from quinacridone red by imaging a physical cross-section from the layered mockup at different wavelength combinations. In the future, we can build a pump-probe library with cross-section samples from a variety of historical artworks that have already been characterized with currently accepted analytical techniques. The spectroscopy results are seen in Fig. 2. The ground and excited state dynamics for each pigment are specific to that pigment, providing structured and complex pump-probe signatures. At a pump-probe wavelength combination of 615/810 nm, the signal in quinacridone red is positive (i.e., the amount of detected probe light decreases when the pump is turned on) and decays in time. In ultramarine blue, the signal is negative, also decaying in time. The combination of positive and negative pigment-specific transient absorption signals provides an ideal case for creating a virtual cross-section. Interestingly, shifting to pump-probe wavelengths of 655/810 nm, the transient absorption amplitudes for these pigments are reversed (although much weaker in magnitude for quinacridone red), although the linear absorption barely differs at our choice of pump wavelengths. The temporal decay characteristics of the pigments also vary with pump-probe wavelengths, providing yet another method of pigment separation.
Fig. 2.
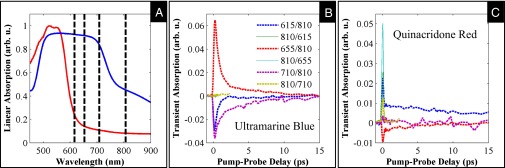
Multispectral pump-probe investigation of quinacridone red and ultramarine blue. (A) Linear absorption spectra of quinacridone red (red curve) and ultramarine blue (blue curve), with dashed lines indicating the different wavelengths that we used in the pump-probe imaging of the pigments. The pump-probe delay traces for (B) ultramarine blue and (C) quinacridone red at a variety of pump-probe wavelengths (indicated in the legend in nanometers) show vastly different time responses. All wavelength combinations were taken at a total power of 7 mW.
Bright-field microscopic images of the physical cross-sections taken from the two mockup paintings (Fig. 3) show that, in the layered case, the red glaze layer is ∼5-µm thick and the synthetic ultramarine is ∼25-µm thick, whereas the mixed sample has one layer with a varying thickness of 25–90 µm. Pump-probe images (at 615/810 nm) of the physical cross-sections were taken at different time delays to allow assignment of pigments. The pigments are assigned false colors according to their pump-probe response; the red glaze (colored red) has a positive response, and the ultramarine blue (colored cyan) has a negative response. There is no signal from the acrylic binder. The pump-probe images give similar results in terms of both the distribution of pigments and the layer thickness to the structure of the cross-section obtained from the bright-field microscope.
Fig. 3.
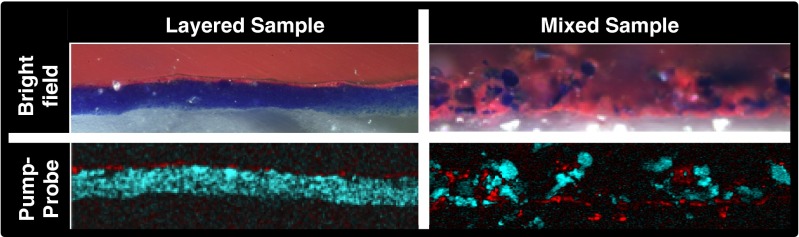
Pump-probe separation of quinacridone red and ultramarine blue using physical cross-section samples. Bright-field and pump-probe images of the physical cross-sections from the layered and mixed mockup painting. The pump-probe images were taken at an interpulse delay of 0.1 ps and a wavelength combination of 615/810 nm with a total power of 5 mW. Quinacridone red is false-colored red, whereas ultramarine blue is cyan. The pump-probe images are 365 × 90 µm in size.
Virtual Cross-Sections of the Mock Paintings.
Having found appropriate imaging parameters for the two pigments, we created virtual cross-sections from the mockups by taking a series of en face images (xy images perpendicular to the beam axis) at different depths (z direction) using the wavelength combination of 615/810 nm with an interpulse delay of 0.1 ps. We generated virtual cross-sections from this volume set by selecting a data slice in the xz or yz direction. In Fig. 4, we false-colored the images according to the previously discussed methodology; the red glaze has been colored red, and the blue pigment has been colored cyan. Although one mock painting features a layered structure and the other mock painting features a mixture, both cases present a purple color; the reflectance spectra acquired using fiber optic reflectance spectroscopy (FORS) from each mock-up painting are similar (Fig. 4) and give no indication of either painting’s stratigraphy. However, in both cases, the pump-probe virtual cross-sections not only distinguish between the layered and mixed stratigraphy but also, highlight variations in the paintings caused by the artist’s brushwork. In the virtual cross-section image in Fig. 4, Right Inset displays data acquired with a high-N.A. objective, clearly resolving the thin red glaze layer. At this particular pump wavelength (615 nm), our imaging depth in lapis lazuli was limited to roughly 10 µm because of absorption by ultramarine, but tuning the pump wavelength to 710 nm increased the penetration through this pigment sixfold, which is discussed below, and let us image through the entire ultramarine layer in the mockup (at the expense of a negligible signal from red glaze).
Fig. 4.

Reflectance spectra and virtual cross-sections of mock paintings. (Left) The linear reflectance spectrum from each painting indicates the presence of quinacridone red (peak at 600 nm) and ultramarine blue (increased reflection at 700 nm) but does not indicate which painting is layered and which is mixed. Inset shows photographs of the (Upper) layered and (Lower) mixed mockups. (Right) A volume set of pump-probe images of the intact mock paintings was taken at a wavelength combination of 615/810 nm, fixed interpulse delay of 0.1 ps, and total power of 3 mW with a 20× 0.7 N.A. objective. One image of each set is shown (false-colored red for quinacridone red and cyan for ultramarine blue). Virtual cross-section (xz) images immediately reveal the composition difference between the layered and mixed samples. Inset on the virtual cross-section of the layered sample was obtained with a higher-resolution 60× 0.9 N.A. objective. Each en face (xy) image is 365 × 365 µm, and the virtual cross-sections are 365 × 90 µm.
Our technique has several advantages over the removal of a physical cross-section other than its nondestructive nature. By mapping out an entire volume, we can create virtual slices from the entire field of view in any direction and visualize differences in brushwork or abrupt changes in layering that may not be evident in a physical cross-section, in which accessible information is dependent on the sampling orientation. In addition, we can sample many areas anywhere in the painting, which is not possible when acquiring physical cross-sections (generally conservators do not remove samples form pristine areas of the paintings).
Nondestructive Investigation of Intact Artwork.
The Crucifixion was painted by Puccio Capanna in roughly 1330 on a wooden panel using various pigments in egg tempera with gold leaf. We focused on two areas in the painting: the rich blue of the Virgin Mary’s robe and the light blue robe of a floating angel that is outlined with purple shading.
Prior cross-sectional analysis of the Virgin Mary’s robe indicates that the robe has been painted with a thick (up to 60 µm) layer of lapis lazuli. Thus, examination of the robe presented a unique opportunity to test our depth penetration capabilities in a real work of art in a relatively uncomplicated setting; previous work indicates no pump-probe signal in egg tempera binder or other binder materials. The results are presented in Fig. 5. Pump-probe imaging in the center of the robe gave virtual cross-sections consistent with the known thickness of the lapis lazuli, highlighting the ability of this method to noninvasively image deeply into pigment layers.
Fig. 5.

Virtual cross-section of the Virgin Mary’s blue robe in Puccio Cappana’s The Crucifixion. (Left) The painting was imaged in an area of Mary’s robe containing only a single layer of lapis lazuli with a wavelength combination of 720/810 nm and an interpulse delay of 0.2 ps with a total power of 2.7 mW. (Upper Right) The en face image shown (365 × 365 µm) was from roughly 30 µm beneath the surface of the robe. Here, the images have been false-colored cyan for lapis lazuli and magenta for mineral impurities that occur with natural lapis lazuli. (Lower Right) The virtual xz cross-section (365 × 60 µm) highlights the thickness of the lapis lazuli used to paint Mary’s robe.
To test the ability to obtain a virtual cross-section in a historic painting, we imaged in an area with known layering—specifically, the outline of the floating angel. Fig. 6 shows a bright-field image of a physical cross-section taken from this region of the angel’s robe. Bright-field microscopy and scanning electron microscopy with energy-dispersive X-ray spectroscopy (SEM-EDS) analysis of this cross-section indicates a very delicate and thin layering of pigments containing, from top to bottom, a faded red glaze, a mixture of lead white and lapis lazuli, iron oxide, an organic coating, gold leaf, an iron-rich mordant (a mixture of pigments and oil used to adhere the gold leaf) (24), and a gypsum ground. To image this area, we tuned the pump-probe pulses to a wavelength of 710/810 nm, for which we obtain signals from lapis lazuli, iron oxide, mordant, and gold (gold has a strong two-photon absorption response at this wavelength combination). We classified the temporal dynamics in the pump-probe signals using phasor analysis, a method that is commonly used to visualize decay times in fluorescence lifetime measurements (25) and was recently adapted to pump-probe work (26). We identified three distinct decay behaviors, consistent with previously observed data in lapis lazuli, iron oxide, and gold. Fig. 6 also displays the physical cross-section as a false-colored pump-probe image, correlating well with the bright-field image. At the chosen wavelength combination, we do not see a signal in the faded red glaze, lead white, organic coating, or gypsum, except for a few mineral impurities that may be present in those layers. We obtain signal from gold; however, the gilding is very thin and could not be spatially resolved. Also, at this wavelength combination, iron oxide and mordant showed signals with identical decay behaviors. The optical image was taken after pump-probe imaging, indicating no visible damage. We then imaged an area of the intact painting adjacent to the sample site. At this location, we acquired volume data with a fixed pump-probe delay of 0.2 ps, which yields positive pump-probe signals from iron oxide, gold, and mordant and negative signals from lapis lazuli. Because the pump-probe dynamics of iron oxide/mordant and gold are very similar, they can only be cleanly separated by acquiring data at many densely sampled time delays, which with our current setup, was not feasible during the loan period of the painting. Hence, in these pump-probe images, we color-coded the positive signals orange, encompassing any of the three materials, and negative signals cyan (lapis lazuli). At the probed location, we found a composition that is slightly different from the physical cross-section. The en face images show positive signal on the surface (most likely from iron oxide), negative signal in the center from lapis lazuli, and positive signal again underneath the lapis lazuli, which is most likely gold with possible contributions from mordant (the gilding in this region is heavily cracked, exposing the mordant underneath). This view is supported by virtual cross-sections extracted from this dataset. The virtual xz slice and even more so, the maximum intensity projection of the volume along the y direction suggest either a mixture or very thin layers of iron oxide with lapis lazuli and gold leaf with mordant underneath it.
Fig. 6.

Investigation of the angel’s purple robe in Puccio Cappana’s The Crucifixion. (Top) A bright-field image of the physical cross-section taken from the angel’s robe is shown. A pump-probe delay dataset was acquired (40 interpulse delays, pump-probe = 710/810 nm, total power = 1.5 mW, size is 545 × 55 µm). From this set, we created a false-colored image according to the pump-probe delay behavior (cyan for lapis lazuli, red for the two iron-rich pigments above and below the gold layer, and yellow for gold). Cumulative pump-probe traces of all identified pigments in the image are shown in Right. Note that the gold layer is thinner than the resolution of our microscope, and the gold-labeled trace likely contains some contribution from the adjacent mordant. (Middle) A pump-probe volume dataset was taken with a fixed 0.2-ps delay in the angel’s robe (pump-probe = 710/810 nm, total power = 1.5 mW). The images from this set have been false-colored according to the signal at this delay: cyan for negative signal (corresponding to lapis lazuli) and orange for positive (iron oxide/mordant and gold; with only a single delay, these three materials cannot be separated). Each image is 185 × 185 µm. (Bottom) An xz slice taken from the volume data shows a positive component mixed within the lapis lazuli layer (most likely iron oxide) with another positive component underneath (most likely gold and possibly, underlying mordant that we image through microscopic cracks in the gold layer). This composition is seen more clearly in a maximum intensity projection of the entire volume cube. The virtual cross-section dimension is 185 × 50 µm.
Discussion
These results represent a large step in the nondestructive 3D analysis of pigments and their composition in historical art works. In an intact 600-y-old painting, we have shown that our technique can noninvasively image through a relatively thick layer of paint and map multilayer structures. With our current microscope design, we can easily image volume data at fixed time delays or 2D images at varying pump-probe delays. Typical acquisition times of the three-parameter datasets in Fig. 6 were 30–60 min. Future improvements in detection sensitivity should decrease imaging time markedly, leading the path to acquisition of 4D datasets (3D space and delay) dense enough for 3D pigment-specific mapping. The achievable imaging depth depends on the structure and layering of the artwork. Certain flexibility is afforded by the choice of pump and probe wavelengths. For each pigment, there will be tradeoffs between signal strength (pumping close to an absorption line best excites electronic states but results in the largest linear absorption) and contrast (not all wavelength combinations yield usable signal). Efforts to establish a pump-probe database for the most common pigment types are currently underway. Some materials might not yield distinct pump-probe signals (a fact that we use to our advantage by rendering binders invisible), in which case combination of our microscopy technique with other optical contrasts in the same microscope might be beneficial. For example, to study organic glazes, binders, and varnishes, it is possible to incorporate nonlinear fluorescence or harmonic generation contrast, which was shown useful in some recent 3D imaging work (13, 14).
Our work with the iron-rich pigments in The Crucifixion further suggests interesting applications for earth pigments in a variety of objects from pottery (27) and ancient relics (28, 29) to Greek statuary, which was not white (as believed for centuries) but brightly colored (30–32). Other potential applications include the in situ mapping of degradation products. For example, The Joy of Life by Henri Matisse (1905) contains large areas of cadmium yellow that have degraded to browns and whites (33), an issue that has also affected masterworks by Van Gogh, Picasso, and others (34). Mapping degradation products could aid in understanding degradation processes (35, 36). Finally, 2D wavelet analysis of van Gogh’s brushstrokes has been applied to 101 high-resolution grayscale scans (37), and our work suggests that extensions to 3D brushstroke imaging are possible, presenting opportunities and challenges for data mining (38).
Pump-probe microscopy, in conjunction with current techniques in conservation science, could dramatically impact the study and understanding of our cultural heritage. Ultimately, the general application of our technique in situ will require a portable nonlinear microscope, but all of the miniaturization technology needed for such a device is being developed for biomedical applications (39); also, appropriate laser sources have recently dropped drastically in cost (40). We have shown that it is possible to leverage large societal investment in biomedical and molecular imaging to enable applications with a broader impact.
Methods
Approach.
A Ti:Sapphire mode-locked laser operating at a repetition rate of 80 MHz, with a wavelength in the near-IR and pulse duration of roughly 150 fs, pumps an optical parametric oscillator, with an output in the visible to the near-IR of a similar pulse duration. The pump pulse train is intensity-modulated at 2 MHz using an acousto-optic modulator. The probe pulse is unmodulated, and the interpulse delay is controlled by an adjustable optical path length in the probe arm. The two beams are overlapped on a dichroic mirror and sent collinearly into a laser-scanning microscope. The pulses are focused onto the sample with a 20× 0.7 N.A. or 60× 0.9 N.A. air objective. Any nonlinear interaction with the sample will transfer the modulation from the pump to the probe, and changes in the probe intensity are detected by a photodiode and a lock-in amplifier with a reference at the modulation frequency.
Mock Paintings of Quinacridone Red and Ultramarine Blue.
Layered painting.
Quinacridone red (1310; Golden) and synthetic lapis lazuli (45000; Kremer) were prepared in an acrylic medium. The synthetic lapis lazuli was painted onto a glass slide that had been prepared with a gesso ground. After the layer dried, a thin coat of quinacridone red was painted on top and allowed to dry. A small sample was extracted with a scalpel from the painting and mounted in Wards Bio-Plastic for the cross-section.
Mixed painting.
Quinacridone red (1310; Golden) and Afghan lapis lazuli (15300; Kremer) were prepared in an acrylic medium, mixed together in a roughly 1:1 ratio, and painted onto a glass slide that had been prepared with a gesso ground. A small sample was extracted with a scalpel from the painting and mounted in Wards Bio-Plastic for the cross-section.
FORS analysis.
A fiber optic spectroradiometer, FS3 (ASD Inc.), was used to obtain FORS spectra from the mock paintings. The spectrometer operates from 350 to 2,500 nm, with a spectral sampling of 1.4 nm from 350 to 1,000 nm. The spectral resolution at 700 nm is 3 nm. The light source of a leaf probe head (ASD Inc.) was used at a distance of 20 cm to illuminate the samples (∼400 lx), and the fiber was placed ∼1 cm from the object, giving an ∼3-mm spot size at the painting. We averaged two spectra, with a total acquisition time of <5 s per point.
Nondestructive Investigation of Intact Artwork.
The Crucifixion was the central compartment of one panel of a diptych altarpiece. The pigments—typical of an early Renaissance palette—include pure lapis lazuli, azurite, vermillion, red lake, red lead, terra verte, white lead, black, and earth colors. The medium is estimated to be egg yolk, and the panel support was identified as poplar. The gold was applied to the embroidered decoration by mordant gilding and the gold field by water gilding onto a red mordant. A small sample was extracted with a scalpel from the angel’s robe and mounted in Wards Bio-Plastic for the cross-section.
Acknowledgments
We acknowledge Prathyush Samineni for his help in beginning this research with the first paint samples and Jesse Wilson for helpful discussions and providing the schematic in Fig. 1. We thank the North Carolina Museum of Art and the National Gallery of Art for their collaboration and contribution of various art pieces. This material is based on work supported by National Science Foundation Grant CHE–1309017.
Footnotes
The authors declare no conflict of interest.
This article is a PNAS Direct Submission.
References
- 1.Steward B. Analytical Techniques in Materials Conservation. New York: Wiley; 2007. [Google Scholar]
- 2.Clark RJH. Raman microscopy as a structural and analytical tool in the fields of art and archaeology. J Mol Struct. 2007;834–836:74–80. [Google Scholar]
- 3.Vandenabeele P, Edwards HGM, Moens L. A decade of Raman spectroscopy in art and archaeology. Chem Rev. 2007;107(3):675–686. doi: 10.1021/cr068036i. [DOI] [PubMed] [Google Scholar]
- 4.Brambilla A, et al. A remote scanning Raman spectrometer for in situ measurements of works of art. Rev Sci Instrum. 2011;82(6):063109. doi: 10.1063/1.3600565. [DOI] [PubMed] [Google Scholar]
- 5.Delaney JK, et al. Visible and infrared imaging spectroscopy of Picasso’s Harlequin musician: Mapping and identification of artist materials in situ. Appl Spectrosc. 2010;64(6):584–594. doi: 10.1366/000370210791414443. [DOI] [PubMed] [Google Scholar]
- 6.Dooley KA, et al. Mapping of egg yolk and animal skin glue paint binders in Early Renaissance paintings using near infrared reflectance imaging spectroscopy. Analyst (Lond) 2013;138(17):4838–4848. doi: 10.1039/c3an00926b. [DOI] [PubMed] [Google Scholar]
- 7.Dik J, et al. Visualization of a lost painting by Vincent van Gogh using synchrotron radiation based X-ray fluorescence elemental mapping. Anal Chem. 2008;80(16):6436–6442. doi: 10.1021/ac800965g. [DOI] [PubMed] [Google Scholar]
- 8.Kanngießer B, Malzer W, Mantouvalou I, Sokaras D, Karydas AG. A deep view in cultural heritage—confocal micro X-ray spectroscopy for depth resolved elemental analysis. Appl Phys A Mater Sci Process. 2012;106(2):325–338. [Google Scholar]
- 9.Targowski P, Iwanicka M. Optical coherence tomography: Its role in the non-invasive structural examination and conservation of cultural heritage objects—a review. Appl Phys A Mater Sci Process. 2012;106(2):265–277. [Google Scholar]
- 10.Adam AJL, Planken PCM, Meloni S, Dik J. TeraHertz imaging of hidden paint layers on canvas. Opt Express. 2009;17(5):3407–3416. doi: 10.1364/oe.17.003407. [DOI] [PubMed] [Google Scholar]
- 11.Helmchen F, Denk W. Deep tissue two-photon microscopy. Nat Methods. 2005;2(12):932–940. doi: 10.1038/nmeth818. [DOI] [PubMed] [Google Scholar]
- 12.Denk W, Strickler JH, Webb WW. Two-photon laser scanning fluorescence microscopy. Science. 1990;248(4951):73–76. doi: 10.1126/science.2321027. [DOI] [PubMed] [Google Scholar]
- 13.Latour G, Echard J-P, Didier M, Schanne-Klein M-C. In situ 3D characterization of historical coatings and wood using multimodal nonlinear optical microscopy. Opt Express. 2012;20(22):24623–24635. doi: 10.1364/OE.20.024623. [DOI] [PubMed] [Google Scholar]
- 14.Nevin A, et al. Multi-photon excitation fluorescence and third-harmonic generation microscopy measurements combined with confocal Raman microscopy for the analysis of layered samples of varnished oil films. Appl Phys A Mater Sci Process. 2010;100(3):599–606. [Google Scholar]
- 15.Warren WS, Fischer MC, Ye T. Cellular imaging—novel nonlinear contrast improves deep-tissue microscopy. Laser Focus World. 2007;43(6):99–103. [Google Scholar]
- 16.Ye T, Fu D, Warren WS. Nonlinear absorption microscopy. Photochem Photobiol. 2009;85(3):631–645. doi: 10.1111/j.1751-1097.2008.00514.x. [DOI] [PMC free article] [PubMed] [Google Scholar]
- 17.Fu D, et al. High-resolution in vivo imaging of blood vessels without labeling. Opt Lett. 2007;32(18):2641–2643. doi: 10.1364/ol.32.002641. [DOI] [PubMed] [Google Scholar]
- 18.Fu D, Matthews TE, Ye T, Piletic IR, Warren WS. Label-free in vivo optical imaging of microvasculature and oxygenation level. J Biomed Opt. 2008;13(4):040503. doi: 10.1117/1.2968260. [DOI] [PubMed] [Google Scholar]
- 19.Fu D, Ye T, Matthews TE, Yurtsever G, Warren WS. Two-color, two-photon, and excited-state absorption microscopy. J Biomed Opt. 2007;12(5):054004. doi: 10.1117/1.2780173. [DOI] [PubMed] [Google Scholar]
- 20.Fu D, et al. Probing skin pigmentation changes with transient absorption imaging of eumelanin and pheomelanin. J Biomed Opt. 2008;13(5):054036. doi: 10.1117/1.2976424. [DOI] [PubMed] [Google Scholar]
- 21.Matthews TE, Piletic IR, Selim MA, Simpson MJ, Warren WS. Pump-probe imaging differentiates melanoma from melanocytic nevi. Sci Transl Med. 2011;3(71):71ra15. doi: 10.1126/scitranslmed.3001604. [DOI] [PMC free article] [PubMed] [Google Scholar]
- 22.Wilson JW, et al. Imaging microscopic pigment chemistry in conjunctival melanocytic lesions using pump-probe laser microscopy. Invest Ophthalmol Vis Sci. 2013;54(10):6867–6876. doi: 10.1167/iovs.13-12432. [DOI] [PMC free article] [PubMed] [Google Scholar]
- 23.Samineni P, deCruz A, Villafaña TE, Warren WS, Fischer MC. Pump-probe imaging of historical pigments used in paintings. Opt Lett. 2012;37(8):1310–1312. doi: 10.1364/OL.37.001310. [DOI] [PubMed] [Google Scholar]
- 24.Gettens RJ, Stout GL. Painting Materials: A Short Encyclopaedia. New York: Dover; 1966. [Google Scholar]
- 25.Redford GI, Clegg RM. Polar plot representation for frequency-domain analysis of fluorescence lifetimes. J Fluoresc. 2005;15(5):805–815. doi: 10.1007/s10895-005-2990-8. [DOI] [PubMed] [Google Scholar]
- 26.Robles FE, Wilson JW, Fischer MC, Warren WS. Phasor analysis for nonlinear pump-probe microscopy. Opt Express. 2012;20(15):17082–17092. [Google Scholar]
- 27.Sciau P, et al. Reverse engineering the ancient ceramic technology based on X-ray fluorescence spectromicroscopy. J Anal At Spectrom. 2011;26(5):969–976. [Google Scholar]
- 28.Edwards HGM, Villar SEJ, David AR, de Faria DLA. Nondestructive analysis of ancient Egyptian funerary relics by Raman spectroscopic techniques. Anal Chim Acta. 2004;503(2):223–233. [Google Scholar]
- 29.Colombini MP, et al. Integrated analytical techniques for the study of ancient Greek polychromy. Talanta. 2004;63(4):839–848. doi: 10.1016/j.talanta.2003.12.043. [DOI] [PubMed] [Google Scholar]
- 30.Gurewitsch M. Smithsonian. True colors. 2008 July. Available at www.smithsonianmag.com/arts-culture/true-colors.html. Accessed January 4, 2014. [Google Scholar]
- 31.Brinkmann V, Wunsche R. Gods in Color: Painted Sculpture of Classical Antiquity. Glypotothek, Munich: 2007. [Google Scholar]
- 32.Panzanelli R, Schmidt ED, Lapatin K. The Color of Life: Polychromy in Sculpture from Antiquity to the Present. Los Angeles: Getty Research Institute; 2008. [Google Scholar]
- 33.Mass JL, et al. The photodegradation of cadmium yellow paints in Henri Matisse's Le Bonheur de vivre (1905-1906) Appl Phys A Mater Sci Process. 2013;111(1):59–68. [Google Scholar]
- 34.Thoury M, et al. Near-infrared luminescence of cadmium pigments: In situ identification and mapping in paintings. Appl Spectrosc. 2011;65(8):939–951. doi: 10.1366/11-06230. [DOI] [PubMed] [Google Scholar]
- 35.Van der Snickt G, et al. Characterization of a degraded cadmium yellow (CdS) pigment in an oil painting by means of synchrotron radiation based X-ray techniques. Anal Chem. 2009;81(7):2600–2610. doi: 10.1021/ac802518z. [DOI] [PubMed] [Google Scholar]
- 36.Van der Snickt G, et al. Combined use of synchrotron radiation based micro-X-ray fluorescence, micro-X-ray diffraction, micro-X-ray absorption near-edge, and micro-fourier transform infrared spectroscopies for revealing an alternative degradation pathway of the pigment cadmium yellow in a painting by Van Gogh. Anal Chem. 2012;84(23):10221–10228. doi: 10.1021/ac3015627. [DOI] [PubMed] [Google Scholar]
- 37.Johnson CR, et al. Image processing for artist identification. IEEE Signal Processing Mag. 2008;25(4):37–48. [Google Scholar]
- 38.Chen G, Little AV, Maggioni M, Rosasco L. Applied and Numerical Harmonic Analysis. Basel: Birkhauser; 2011. [Google Scholar]
- 39.Ghosh KK, et al. Miniaturized integration of a fluorescence microscope. Nat Methods. 2011;8(10):871–878. doi: 10.1038/nmeth.1694. [DOI] [PMC free article] [PubMed] [Google Scholar]
- 40.Durfee CG, et al. Direct diode-pumped Kerr-lens mode-locked Ti:sapphire laser. Opt Express. 2012;20(13):13677–13683. doi: 10.1364/OE.20.013677. [DOI] [PMC free article] [PubMed] [Google Scholar]