Significance
The periodic pigment patterns of organisms, such as spots and stripes, have suggested the presence of a mathematical system generating the patterns. The most famous one is the reaction–diffusion system. Although the system explains the pattern formation well, the biological substances corresponding to the diffusive factors in the system have not been elucidated. Here, we observed the behavior of zebrafish pigment cells in vitro and found that WT cells showed run-and-chase movement in the direct interaction, whereas the pattern mutant cells showed different cell movement. These results suggested that gene mutations affect the reaction–diffusion system by changing the cell movement, which corresponds to the interaction of diffusive factors in the reaction–diffusion system.
Abstract
Pigment patterns of organisms have invoked strong interest from not only biologists but also, scientists in many other fields. Zebrafish is a useful model animal for studying the mechanism of pigment pattern formation. The zebrafish stripe pattern is primarily two types of pigment cells: melanophores and xanthophores. Previous studies have reported that interactions among these pigment cells are important for pattern formation. In the recent report, we found that the direct contact by xanthophores induces the membrane depolarization of melanophores. From analysis of jaguar mutants, it is suggested that the depolarization affects the movements of melanophores. To analyze the cell movement in detail, we established a unique in vitro system. It allowed us to find that WT xanthophores induced repulsive movement of melanophores through direct contact. The xanthophores also chased the melanophores. As a result, they showed run-and-chase movements. We also analyzed the cell movement of pigment cells from jaguar and leopard mutants, which have fuzzy stripes and spot patterns, respectively. jaguar cells showed inhibited run-and-chase movements, and leopard melanophores scarcely showed repulsive response. Furthermore, we paired mutant and WT cells and showed which of the melanophores and xanthophores have responsibility for the altered cell movements. These results suggested that there is a correspondence relationship between the cell movements and pigment patterns. The correspondence relationship highlighted the importance of the cell movements in the pattern formation and showed that our system is a quite useful system for future study in this field.
Many animals have characteristic patterns on their surface, and the mechanism by which these patterns are formed has been studied for a long time. Quite different patterns are often found in closely related species (1, 2). The mechanism by which various patterns are generated from similar machinery is an interesting issue. The mechanism has been approached using both mathematical and biological methods. Previous mathematical analyses have suggested that the skin pattern is generated by a reaction–diffusion system (3–5), which was originally proposed by Turing (3). A simulation based on the reaction–diffusion system reproduced not only the final patterns but also, the dynamic process of pattern formation in fish (6). In the reaction–diffusion system, periodic patterns autonomously emerge from mutual interactions between hypothetical diffusible factors. By tuning the interactions, the reaction–diffusion system is capable of generating different patterns (5, 7).
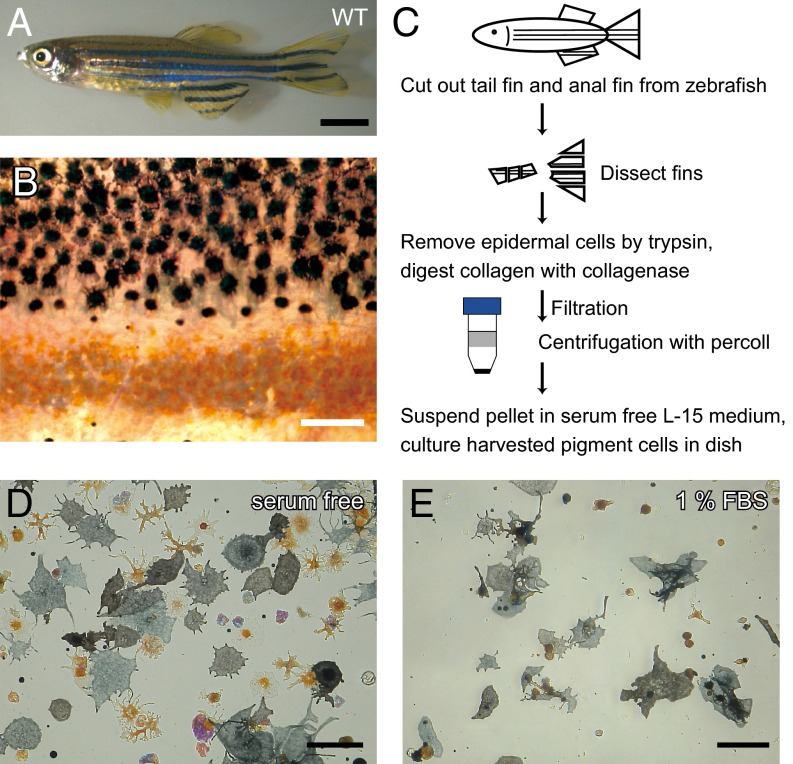
However, to prove that the reaction–diffusion system really underlies the pigment pattern formation, the mechanisms that occur at the cellular and molecular levels need to be elucidated. Pigment patterning mechanisms have been extensively studied in zebrafish over the past two decades (1, 6). The zebrafish skin pattern consists of arranged melanophores (black pigment cells) and xanthophores (yellow pigment cells) (Fig. 1 A and B). Mutants that lack either melanophores or xanthophores do not exhibit an apparent pattern, whereas a chimera between these mutants exhibits a normal stripe pattern (8, 9). It suggested that interactions between melanophores and xanthophores play a major role in the pattern formation.
Fig. 1.
Harvesting pigment cells from zebrafish fins. (A) Adult WT zebrafish. (B) Magnified image of the surface of a WT fish body. Black spots are melanophores, and yellow spots are xanthophores. Clear gaps exist between the regions containing melanophores and the regions containing xanthophores. (C) A schematic diagram describing the harvest of pigment cells from fins. (D and E) The effect of serum in the medium on cell spreading. Cell pellets were suspended in (D) serum-free L15 medium or (E) medium containing 1% FBS. (Scale bars: A, 5.0 mm; B, D, and E, 100 μm.)
In zebrafish, there are many pigment pattern mutants. Some of the responsible genes of these mutants have been identified by positional cloning (10–13). Despite the expectation of finding diffusible ligands, which correspond to the diffusible factors in the reaction–diffusion system, none of these genes encode diffusible factors. The responsible genes include many membrane-associated proteins, such as connexin, potassium channels, and receptors. These genes suggested that direct contacts between pigment cells play a significant role in patterning. In the previous study, we harvested cells from zebrafish fins and observed that the contact by xanthophores induced the membrane depolarization of melanophores. We found that jaguar melanophores, which were constitutively depolarized, showed different cell movement from WT; jaguar mutants have broader and fuzzy stripes, which are quite different from WT. From these results, we assumed that the difference in the cell movement in direct cell interactions is responsible for various pigment patterns.
In this study, to analyze the contact-induced cell movement of the pigment cells, we established a unique protocol to harvest fin pigment cells selectively. This protocol enabled us to analyze the cell movement statistically in the controlled condition. We analyzed the cell movement of pigment cells from jaguar and leopard mutants and showed that there is correspondence relationship between the cell movement and pigment pattern. Furthermore, we paired mutant and WT cells and analyzed which of the melanophores and xanthophores have responsibility for the altered cell movements. These analyses suggested that gene mutations generate various pigment patterns by alternating the cell movement, which is induced by direct cell interaction.
Results
Purifying and Culturing Pigment Cells from Zebrafish Fins.
We first used density gradient centrifugation to separate pigment cells from other cells (14). Because zebrafish pigment cells are quite vulnerable, we optimized the cell purification method to maintain viability, including optimization of the protease combination, digestion time and temperature, centrifuge conditions, dish coating, and culture media (Fig. 1C). Consequently, the viability and purity of the pigment cells were remarkably improved (a detailed protocol is in Materials and Methods). One of the important variables of the protocol was the centrifugation speed. We found that centrifugation at more than 30 × g caused drastic and severe damage to the cells. Therefore, the cells should be centrifuged at less than 30 × g. Another critical factor was the serum concentration. When pigment cells were cultured in serum-free medium, the cells attached very well to the bottom of the dish, although the cells showed little movement. We found that even 1% FBS severely reduced the number of attached cells (Fig. 1 D and E). Therefore, we used serum-free medium (L15 medium) for harvesting cells and added serum immediately before observation.
Cell Movement Induced by Contact Between Xanthophores and Melanophores.
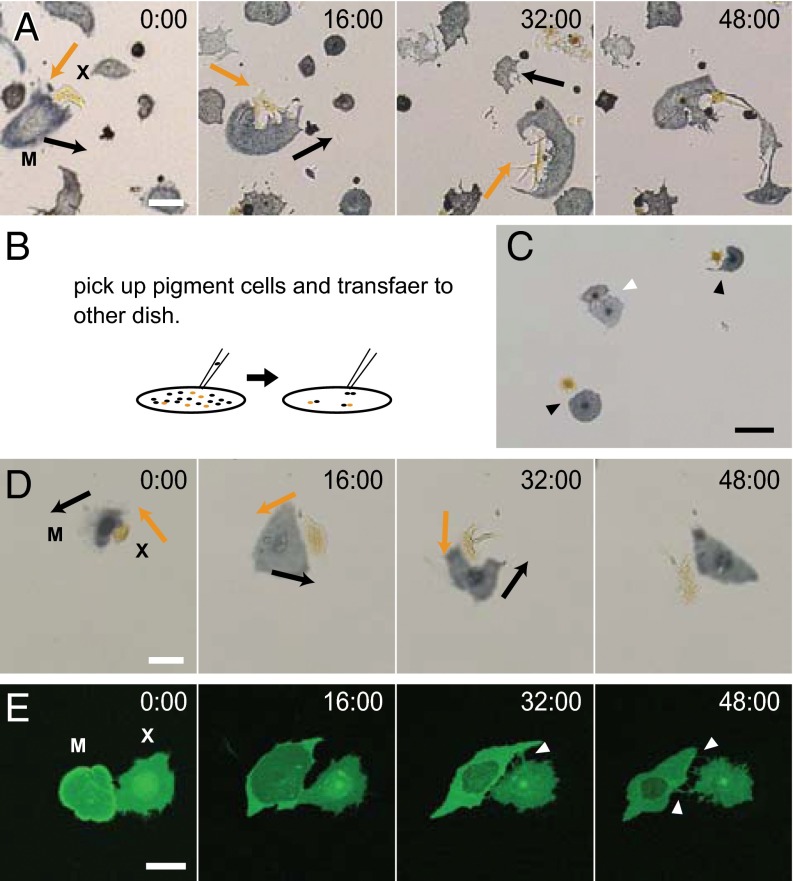
We exchanged the medium 24 h after cell harvest to induce pigment cell movements. Melanophores and xanthophores moved in random directions. Between the same type cells, they did not show an obvious interaction response (Movies S1 and S2). However, between xanthophores and melanophores, an interesting interaction was observed (Fig. 2A and Movie S3). Xanthophores actively extended pseudopodia to neighboring melanophores, and melanophores moved to avoid the pseudopodia. The xanthophores then extended pseudopodia and chased the melanophores.
Fig. 2.
Dynamic interactions between a melanophore and a xanthophore. (A) Cell interactions between a melanophore and a xanthophore. The xanthophore extended pseudopodia to the melanophore. The melanophore then moved away from the pseudopodia, and the xanthophore chased the melanophore. Arrows indicate the directions of cell movements. (B) A schematic diagram describing the manipulation of pigment cells. (C) Transferred pigment cells. Black arrowheads indicate pairs of melanophores and xanthophores. The white arrowhead indicates a pair of melanophores. (D) Interactions between a melanophore and a xanthophore. The transferred pigment cells exhibit interactions that are similar to the interactions observed in a mixed culture. Arrows indicate the directions of cell movements. (E) Interactions of a xanthophore and a melanophore-expressing membrane-targeting EGFP. A xanthophore extended pseudopodia to a melanophore during interaction, and pseudopodia kept contact with the surface of the melanophore. White arrowheads indicate the pseudopodia of the xanthophore. M, melanophore; X, xanthophore. (Scale bar, A, D, and E, 50 μm; C, 100 μm.)
In our previous study, we observed that a weak repulsive response of melanophores was triggered by contact with xanthophores (15). In this system, we found that the interaction was not a simple repulsive response but a more active and continuous run-and-chase movement. The run-and-chase movement was quite similar to the exclusive movement of melanophores in vivo (16). The similarity between these movements suggested that the cell movement observed in vitro was related to pattern formation in vivo.
However, we observed the run-and-chase movement only between xanthophores and melanophores that were paired by chance when pigment cells were spread as a mixture of xanthophores and melanophores. Therefore, to analyze cell interaction in a controlled condition, we isolated single pigment cells and transferred them to another dish (Fig. 2B). Using this method, we could arrange the cells as we liked and analyze the interactions in a controlled condition without interference from other cells (Fig. 2C). In this condition, the run-and-chase movement was observed similarly as in the mixed culture (Fig. 2D and Movie S4). Hereafter, we analyzed cell movement using this system.
Using this system, we observed the pseudopodia during interaction. We harvested pigment cells from the transgenic fish, which have a mitfa promoter-driving EGFP-caax transgene. The cell movement is expected to be the same as in WT, because the fish have WT stripe pattern. In these fish, all melanophores and some xanthophores expressed the membrane-targeted EGFP. During interaction, the xanthophore extended many pseudopodia to the melanophore. The pseudopodia kept contact with the surface of the melanophore (Fig. 2E and Movie S5). It suggested that the repulsive signal from xanthophores and the attractive signal from melanophores were transmitted through direct contact.
Statistical Analysis of Cell Movement.
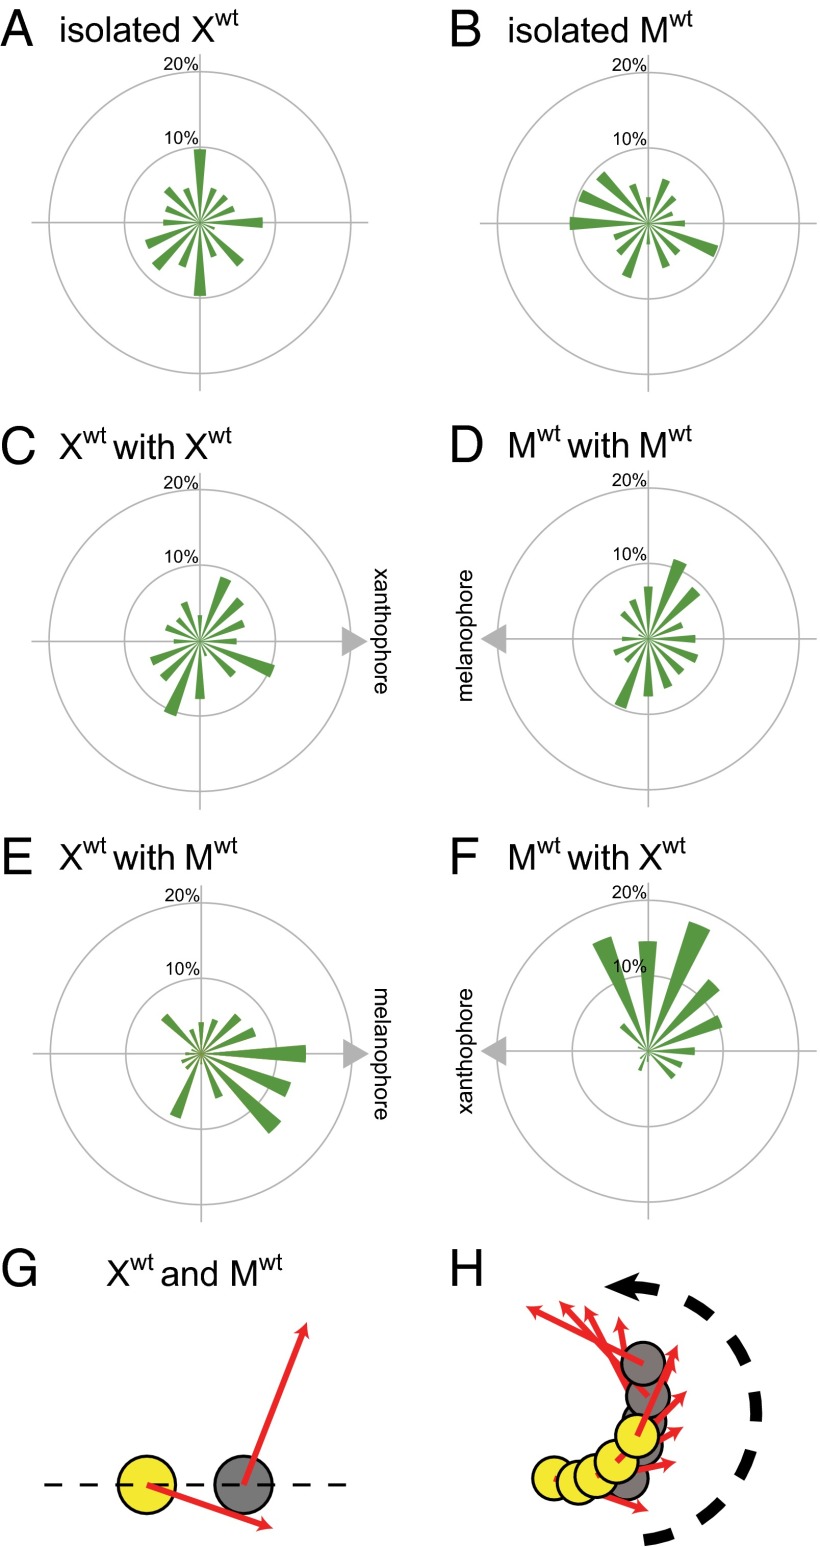
To analyze the cell movement statistically, we generated a migration profile by making the rose diagram from cell movements every 4 h (Fig. 3 A–F and Fig. S1). This profile presents the percentage of the cell movements in the direction of the fan. We analyzed the movement of isolated cells and three combinations of cells: melanophore–melanophore, xanthophore–xanthophore, and melanophore–xanthophore.
Fig. 3.
Statistical analysis of cell behavior. Cell movements were recorded for 48 h. (A–F) The cell movements every 4 h were analyzed with the rose diagram. (A) The migration profile of xanthophores without interactions with other cells (isolated condition). The mean scalar speed of xanthophores was 0.64 μm/h. (B) The migration profile of melanophores without interactions with other cells (isolated condition). The mean scalar speed of melanophores was 2.02 μm/h. (C) The movements of xanthophores interacting with other xanthophores. The mean scalar speed of xanthophores was 0.96 μm/h. (D) The migration profile of melanophores interacting with other melanophores. The mean scalar speed of melanophores was 2.03 μm/h. (E) The migration profile of xanthophores interacting with melanophores. The mean scalar speed of xanthophores was 1.60 μm/h. (F) The migration profile of melanophores interacting with xanthophores. The mean scalar speed of melanophores was 2.20 μm/h. (G) The merged movements of interacting melanophores and xanthophores. The red arrows represent the mean movement vectors calculated as the sum of the vector values of cell movements of every 4 h. (H) Typical movements of an interacting melanophore and xanthophore.
First, a xanthophore or melanophore was isolated without any contact with other cells (Fig. 3 A and B). Under these conditions, both xanthophores and melanophores moved randomly and changed direction frequently. We performed a Rayleigh test, which is commonly used to examine the uniformity of distribution of vector data (17). The P values of the movements of xanthophore and melanophore were 0.67 and 0.20, respectively. Therefore, these cell movements did not have significant anisotropy. During migration, xanthophores were shrunken and rarely extended pseudopodia, whereas melanophores had a flattened, extended shape. Melanophores moved approximately three times faster than xanthophores. The mean scalar speeds of the xanthophores and melanophores were 0.64 and 2.02 μm/h, respectively. In our previous study, we traced the track of melanophores during pattern formation (16). Melanophores moved 80–100 μm in 1 wk in vivo, which corresponds to 0.48–0.60 μm/h. Therefore, melanophores move three to four times faster in vitro than in vivo. We do not have precise data about the velocity of xanthophores in vivo. However, in vivo, xanthophores move much slower than melanophores. We assume that xanthophores also move faster in vitro than in vivo.
Second, we paired two xanthophores or two melanophores together to analyze interactions between the same types of cells (Fig. 3 C and D). The xanthophores became slightly more active, whereas the melanophores did not differ in motility from the isolated condition. The mean scalar speeds of melanophores and xanthophores under this condition were 0.96 and 2.03 μm/h, respectively. Xanthophores extended thin pseudopodia between the cells, whereas melanophores sometimes exhibited adhesive contact. In this condition, neither melanophores nor xanthophores showed obvious directed movements (Rayleigh test: xanthophore, P = 0.36; melanophore, P = 0.07).
Third, a xanthophore and a melanophore were paired together. The mean direction of the movement of the melanophore was away from the xanthophore, and the mean direction of the movement of the xanthophore was to the melanophore (Fig. 3 E and F). Both movements of xanthophores and melanophores had statistically significant anisotropy (P << 0.01; Rayleigh test). Xanthophores exhibited enhanced and directional movements (Fig. 3E). The mean scalar speed of xanthophores was 1.60 μm/h, which was more than two times faster than in the isolated condition. The mean scalar speed of melanophores was 2.20 μm/h, which was comparable with the level in the isolated condition. This result suggested that the direction of the melanophores (but not the motility) was affected by contact with the xanthophore. Curiously, xanthophores moved in an anticlockwise direction with respect to the melanophores. Melanophores also moved in an anticlockwise direction with respect to xanthophores (Fig. 3 E and F). Although we do not know why the direction of the xanthophore and melanophore movements was biased to the anticlockwise direction, the pair of cells often showed a trajectory of an anticlockwise spiral (Fig. 3 G and H and Movie S6). We speculate that the bias results from some intrinsic chirality of pigment cells. As shown here, xanthophores and melanophores showed distinctive movement only under the heterotypic interaction.
In Vitro Behaviors of Mutant Pigment Cells.
These results suggested that the cell movement under the heterotypic interaction was intrinsic and key to pigment pattern formation. To examine whether this view is correct, we analyzed pigment cells isolated from pattern mutants. Here, we chose jaguar and leopard mutants, because these mutants had sufficient numbers of melanophores and xanthophores. The different patterns of these mutants are caused by differences in pigment cell arrangement.
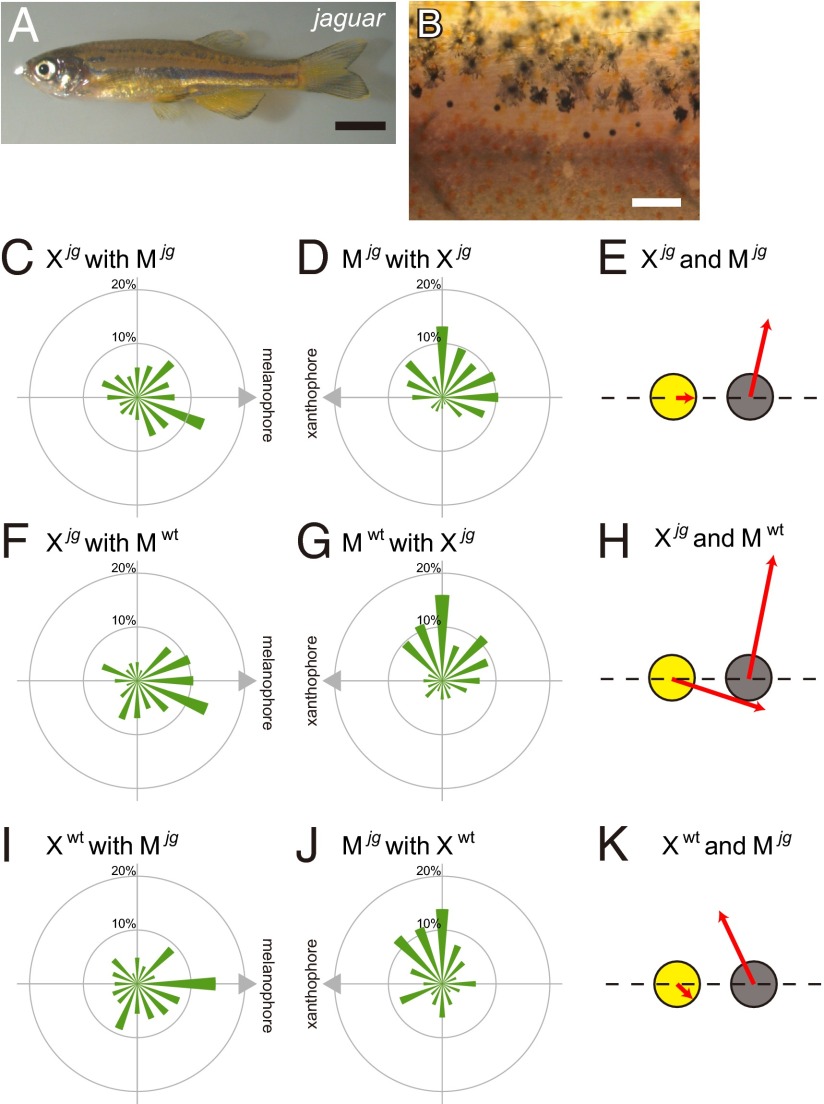
The mutants of jaguar have wider stripes than the WT (Fig. 4A). As shown in a magnified image, the stripe borders were fuzzy, and melanophores and xanthophores were intermingled at the border (Fig. 4B). We harvested pigment cells from jaguar mutants, arranged a melanophore and a xanthophore together as a pair, and analyzed the behavior of the cells. The migration profiles of jaguar pigment cells are shown in Fig. 4 C and D. The mean scalar speeds of jaguar xanthophores and melanophores were 1.01 and 2.02 μm/h, respectively. The movement of xanthophores to the melanophores was also severely inhibited (Fig. 4C). Although the motility of jaguar melanophores was almost identical to the WT, the directionality of migration was inhibited (Fig. 4D). In particular, the movement of melanophores away from the xanthophore was inhibited. In this mutant, melanophores moved around xanthophores rather than away from them (Fig. 4E and Movie S7). We performed a Mardia–Watson–Wheeler test to compare the migration profile of WT and jaguar (17). The movements of melanophores of WT and jaguar showed statistically significant difference (P << 0.001), whereas xanthophores did not show significant difference (P > 0.10).
Fig. 4.
Interactions among pigment cells from jaguar. (A) The appearance of a jaguar mutant, which has wild and fuzzy stripes. (B) Magnified image of the surface of jaguar. Xanthophores and melanophores intermingle in the border region. (C) The migration profile of jaguar xanthophores interacting with jaguar melanophores. The mean scalar speed of xanthophores was 1.01 μm/h. (D) The migration profile of jaguar melanophores interacting with jaguar xanthophores. The mean scalar speed of xanthophores was 2.02 μm/h. (E) Merged movements of jaguar xanthophores and jaguar melanophores. (F) The migration profile of jaguar xanthophores interacting with WT melanophores. The mean scalar speed of xanthophores was 1.91 μm/h. (G) The migration profile of WT melanophores interacting with jaguar xanthophores. The mean scalar speed of melanophores was 2.57 μm/h. (H) Merged movements of jaguar xanthophores and WT melanophores. (I) The migration profile of WT xanthophores interacting with jaguar melanophores. The mean scalar speed of xanthophores was 1.17 μm/h. (J) The migration profile of jaguar melanophores interacting with WT xanthophores. The mean scalar speed of melanophores was 1.79 μm/h. (K) Merged movements of interacting WT xanthophores and jaguar melanophores. (Scale bar: A, 5.0 mm; B, 100 μm.)
Because both of the pigment cells exhibited altered movement, it was unclear which pigment cell was responsible for the altered interaction. Next, we paired a mutant cell with a WT cell. First, we paired a WT melanophore and a jaguar xanthophore (Fig. 4 F–H and Movie S8). The mean scalar speeds of xanthophores and melanophores were 1.91 and 2.57 μm/h, respectively. In this pair, the pigment cells exhibited run-and-chase movements similar to a WT pair. In contrast, a jaguar melanophore and a WT xanthophore pair showed inhibited run-and-chase movements (Fig. 4 I–K and Movie S9). These results suggested that the jaguar mutant had a defect in melanophores. It is consistent with a previous report that the induction of responsible gene Kir 7.1 in jaguar melanophores recovered the WT stripe pattern (15).
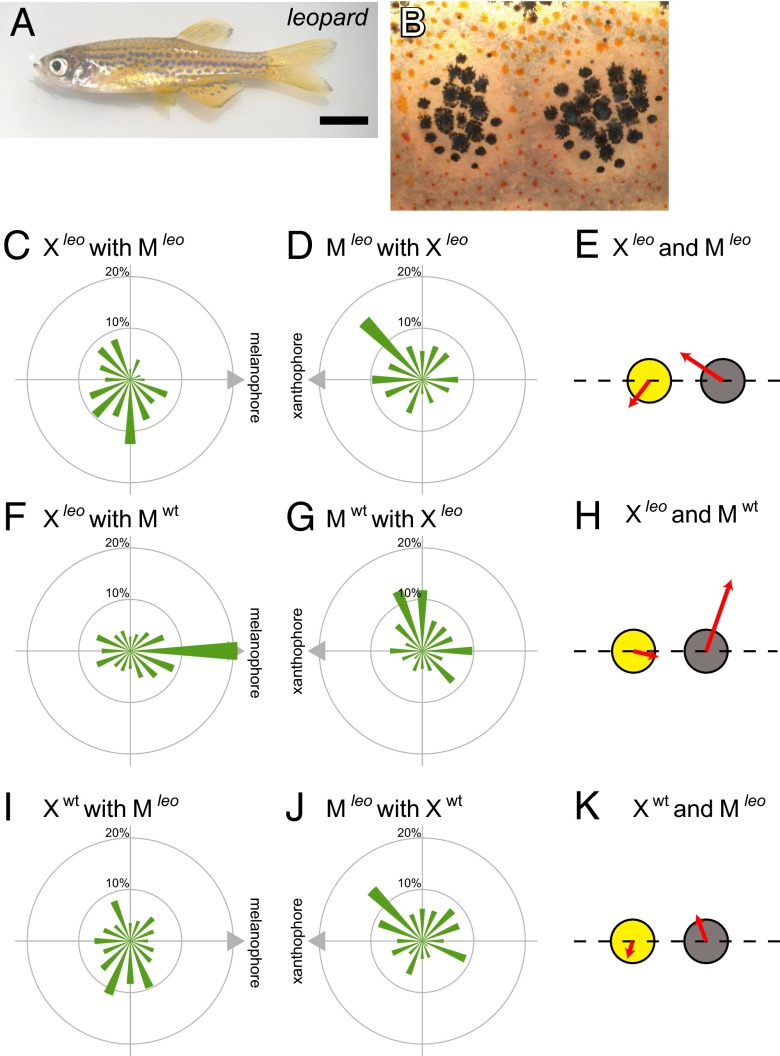
Second, we analyzed pigment cells from leopard. The leopard mutant has a spotted pattern instead of stripes (Fig. 5 A and B). The boundary between these two cell types is as distinct as in the WT. The connexin 41.8 gene is a responsible gene of leopard (11). When a leopard xanthophore contacted a leopard melanophore, the xanthophore actively extended pseudopodia to the melanophore. However, the melanophore did not move away from the xanthophore and rather, weakly moved to the xanthophore (Fig. 5E and Movie S10). The migration profiles showed that the directionality of xanthophores and melanophores became obscure (Fig. 5 C and D). The Mardia–Watson–Wheeler test showed that the directionality of leopard cell movements is significantly different from WT cells (xanthophore, P << 0.001; melanophore, P << 0.001). When a leopard xanthophore and a WT melanophore were paired, the leopard xanthophore extended pseudopodia to the melanophore but failed to chase the running melanophore. The WT melanophore showed normal escaping movements (Fig. 5 F–H and Movie S11). This result suggested that connexin 41.8 functions in xanthophore to move to the melanophore, whereas extension of pseudopodia was not affected by the defect of connexin 41.8.
Fig. 5.
Interactions among leopard pigment cells. (A) The appearance of a leopard mutant, which has a spotted pattern. (B) Magnified image of the surface of leopard. Melanophores are surrounded by xanthophores, and the separation between them is clear. (C) The migration profile of leopard xanthophores interacting with leopard melanophores. The mean scalar speed of xanthophores was 1.29 μm/h. (D) The migration profile of leopard melanophores interacting with leopard xanthophores. The mean scalar speed of melanophores was 1.65 μm/h. (E) Merged movements of interacting leopard xanthophores and melanophores. (F) The migration profile of leopard xanthophores interacting with WT melanophores. The mean scalar speed of xanthophores was 1.16 μm/h. (G) The migration profile of WT melanophores interacting with leopard xanthophores. The mean scalar speed of melanophores was 2.46 μm/h. (H) Merged movements of interacting leopard xanthophores and WT melanophores. (I) The migration profile of WT xanthophores interacting with leopard melanophores. The mean scalar speed of xanthophores was 0.91 μm/h. (J) The migration profile of leopard melanophores interacting with WT xanthophores. The mean scalar speed of melanophores was 1.31 μm/h. (K) Merged movements of interacting WT xanthophores and leopard melanophores. (Scale bar: A, 5.0 mm; B, 100 μm.)
When we placed a WT xanthophore and a leopard melanophore together, both cell movements were inhibited (Fig. 5 I–K and Movie S12). No melanophore repulsive response or xanthophore chasing movement was observed. This result suggested that melanophores also required connexin 41.8 in response to the touch by xanthophores. These experiments showed that the expression of connexin 41.8 is necessary in both the melanophore and the xanthophore for normal run-and-chase movements.
A previous report showed that the expression of connexin 41.8 in leopard melanophores recovered stripe pattern, but the stripe was narrower than WT. However, expression of connexin 41.8 in both melanophores and xanthophores recovered the WT stripe pattern (18). These results suggested that both the repulsive response of melanophores and the chasing response of xanthophores of run-and-chase movements are necessary for WT stripe pattern formation. Although the behavior of leopard pigment cells implied that connexin 41.8 is necessary for directed cell movement, future studies are required to elucidate the molecular mechanism of connexin 41.8 in this function. As shown above, in vitro cell movements in heterotypic interactions were altered in the pattern mutants (Fig. S2 shows summarized data). It suggested that there is a corresponding relationship between the pigment cell movement and the pigment pattern.
Discussion
Although pigment cell interaction has been suggested to play an important role in pigment patterning (16, 19), the details of the interaction remained to be elucidated, because an appropriate system for observation did not exist. In this report, we established a unique protocol to harvest pigment cells and observe them in vitro. This in vitro system enabled us to observe cell movement in detail. We found a unique cell interaction (run-and-chase movement) between WT melanophores and xanthophores. In the heterotypic interaction, xanthophores extended pseudopodia to melanophores, and melanophores showed a repulsive response to the pseudopodia. The xanthophore then extended pseudopodia and chased the running melanophore (Fig. 2 A, D, and E). It should be noted that these interactions are mediated by the direct contacts (Fig. 2E and Movie S5). The interaction resulted in the exclusion of melanophores by xanthophores, which could explain the mechanism by which black and yellow regions are distinctly segregated on the skin of fish.
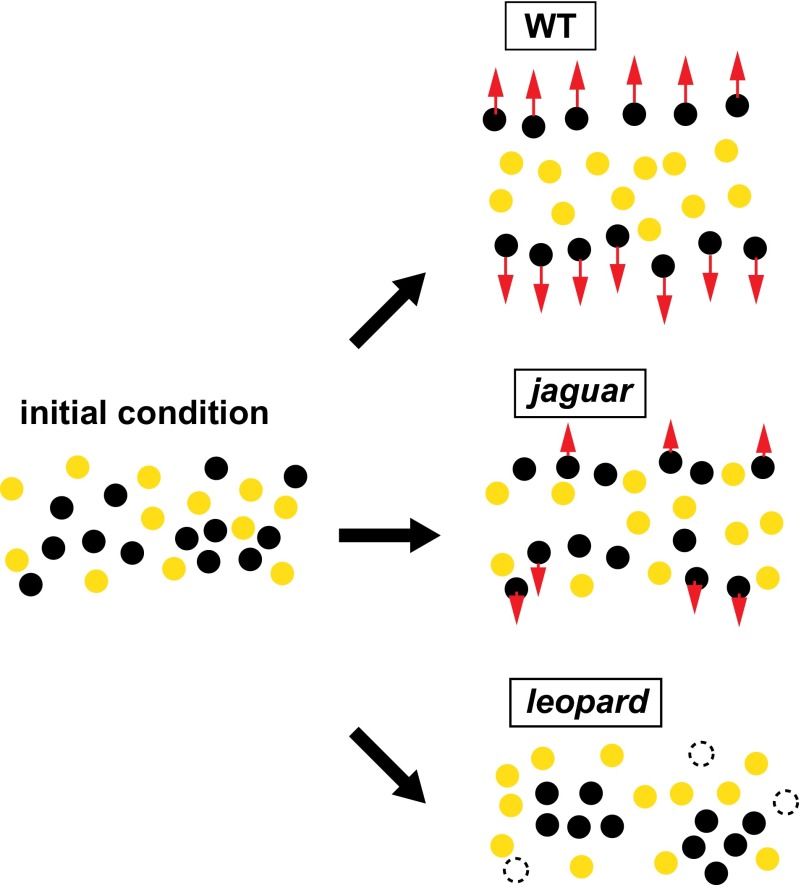
We also found that the pigment cells from pattern mutants exhibited different cell movements from WT cells. The results are summarized in Fig. S2. The difference in movement suggested a corresponding relationship between the cell movement and pigment patterning. In jaguar pigment cells, the repulsive response of melanophores was inhibited compared with WT (Fig. 4 C–E). The inhibited repulsion also inhibited the chasing movement of xanthophores. We assumed that the inhibited run-and-chase movement caused the incomplete segregation between xanthophores and melanophores, which resulted in the fuzzy stripes (Fig. 6).
Fig. 6.
Model of the pigment pattern formation of jaguar and leopard. At the initial condition, the pigment cells intermingle. In WT, melanophores are segregated to the outer region by the run-and-chase movement. Xanthophores remain in the inside region, because xanthophores move slower than melanophores. In the jaguar mutant, some melanophores are segregated to the outer region, but other melanophores remain intermingled with xanthophores because of the inhibited run-and-chase movement. In the leopard mutant, segregation hardly occurs, and some melanophores are gathered spontaneously. Too small groups of melanophores are eliminated by surrounding xanthophores.
In leopard pigment cells, the repulsive response was hardly observed (Fig. 5 C–E). In leopard fish, melanophores are scattered as small groups. It is assumed that run-and-chase movement functions to gather melanophores through repulsive response. Additionally, our previous report showed that a small group of melanophores was eliminated by the surrounding xanthophores (19). These mechanisms could explain why leopard has spot patterns (Fig. 6).
In previous studies, several genes that are responsible for pattern mutants have been detected. However, the mechanisms by which these gene mutations cause the pattern phenotypes have not been resolved. The corresponding relationship between the cell movement and pigment patterning sheds light on the functions of these responsible genes in pigment patterning. If the pigment pattern is determined by the cell movement induced by direct interactions, the gene mutation can alter the pigment pattern by changing the cell movement. Therefore, it leads to two open questions for additional study. What molecular mechanism controls the cell movements during interaction? What mechanism of the altered cell movement results in the altered patterns?
There are many models of pattern formation. One of the widely accepted models is a morphogen gradient model, where the diffusive factor forms a gradient pattern and the cells respond depending on the concentration of the factor. The specific patterns are formed by the difference in the cell differentiation or the selective cell elimination. Although these mechanisms can generate stripe or spot patterns, our proposed model is completely different in that cells themselves move actively to form patterns through mutual interactions. We assume that similar active pattern formation would be found in other systems than pigment pattern. For example, we should note that the repulsive response of pigment cells evokes the repulsive response in axon guidance. Our study also indicates the importance of cell interaction in the local environment. In multicellular organisms, cells are always surrounded by other cells. Therefore, the local cell interaction should have important roles in forming and maintaining patterns. Our in vitro system using primary culture will be quite useful for the analyses of these interactions in the future.
Materials and Methods
Zebrafish Stocks.
The following zebrafish stocks were used: jaguarb230 and leopardt1. The zebrafish mutant strain jaguarb230 was obtained from the Johnson Laboratory, and the zebrafish mutant strain leopardt1 was obtained from the stock center of the Max-Plank Institute. The WT Danio rerio fish used were not from an established line. The fish were maintained under standard laboratory conditions (20) and treated following the Osaka University guidelines.
Harvest and Culture of Pigment Cells from Zebrafish Fins.
Pigment cells were harvested from adult zebrafish ∼4 cm long. The fish were anesthetized with 0.4% Tricaine, and the tail and anal fins were removed and dissected into ∼3-mm squares. The dissected fins were shaken with 1 mL trypsin solution [2.5 mg/mL trypsin (TRL; Worthington), 1.2 mg/mL BSA (Sigma), 1 mM EDTA in PBS] at 1,000 rpm for 60 min at 28 °C. After washing five times with PBS, the fins were shaken with collagenase solution [1 mg/mL collagenase I (CLS-1; Worthington), 0.1 mg/mL DNase I (DP; Worthington), 0.1 mg/mL soybean trypsin inhibitor (SI; Worthington), 1.2 mg/mL BSA in PBS] at 1,000 rpm at 28 °C. The cell suspension was filtrated using a 22-μm mesh and then gradient-centrifuged with 50% Percoll (Sigma) at 30 × g and 28 °C. The pellet was resuspended in serum-free L15 (Gibco) medium and spread onto a collagen IV-coated 96-well dish.
Pigment Cell Manipulation.
A filtrated cell suspension was obtained as described above and then centrifuged at 30 × g without Percoll. The cell pellet was suspended in L15 medium containing 1% FBS, and the cells were then transferred onto an agar-coated dish. The pigment cells were transferred using a glass capillary into another dish coated with collagen IV (mouse; BD), which was then filled with serum-free L15 medium. Pigment cells were paired according to the analysis.
Time-Lapse Recording of Cell Behaviors and Migration Analysis.
At 24 h after spreading, the medium was changed to L15 medium containing 10% FBS by exchanging one-half of the volume of the medium. The behavior of pigment cells was recorded using time-lapse microscopy every 10 min for 48 h at 30 °C. Recorded pictures were integrated as Movies S1–S12. Cell movements were analyzed every 4 h. The center of each cell was defined as the position of the cell. The dataset for each condition was obtained from 12 cells (n = 12), and data for 12 time points for each cell were recorded. The anisotropy of cell movements was analyzed with the Rayleigh test. The comparison of cell movements of WT and mutants was with the Mardia–Watson–Wheeler test. Details of the analysis of cell movement are explained in Fig. S1.
Supplementary Material
Acknowledgments
We thank Dr. Yoshiaki Iwadate for useful advice on the cell manipulator. We also thank Yuji Amihama for helping with our experiment. This study was funded by Core Research for Evolutional Science and Technology (CREST) from the Japan Science and Technology Agency and a Grant-in-Aid for Scientific Research on Innovative Areas from the Ministry of Education, Culture, Sports, Science, and Technology in Japan.
Footnotes
The authors declare no conflict of interest.
This article is a PNAS Direct Submission.
This article contains supporting information online at www.pnas.org/lookup/suppl/doi:10.1073/pnas.1315416111/-/DCSupplemental.
References
- 1.Parichy DM. Evolution of danio pigment pattern development. Heredity (Edinb) 2006;97(3):200–210. doi: 10.1038/sj.hdy.6800867. [DOI] [PubMed] [Google Scholar]
- 2.Miyazawa S, Okamoto M, Kondo S. Blending of animal colour patterns by hybridization. Nat Commun. 2010;1:66. doi: 10.1038/ncomms1071. [DOI] [PMC free article] [PubMed] [Google Scholar]
- 3.Turing AM. The chemical basis of morphogenesis. Philos Trans R Soc Lond B Biol Sci Ser B. 1952;237:37–72. [Google Scholar]
- 4.Kondo S, Asai R. A reaction-diffusion wave on the skin of the marine angelfish Pomacanthus. Nature. 1995;376:765–768. doi: 10.1038/376765a0. [DOI] [PubMed] [Google Scholar]
- 5.Kondo S. The reaction-diffusion system: A mechanism for autonomous pattern formation in the animal skin. Genes Cells. 2002;7(6):535–541. doi: 10.1046/j.1365-2443.2002.00543.x. [DOI] [PubMed] [Google Scholar]
- 6.Yamaguchi M, Yoshimoto E, Kondo S. Pattern regulation in the stripe of zebrafish suggests an underlying dynamic and autonomous mechanism. Proc Natl Acad Sci USA. 2007;104(12):4790–4793. doi: 10.1073/pnas.0607790104. [DOI] [PMC free article] [PubMed] [Google Scholar]
- 7.Kondo S, Miura T. Reaction-diffusion model as a framework for understanding biological pattern formation. Science. 2010;329(5999):1616–1620. doi: 10.1126/science.1179047. [DOI] [PubMed] [Google Scholar]
- 8.Parichy DM. Pigment patterns: Fish in stripes and spots. Curr Biol. 2003;13(24):R947–R950. doi: 10.1016/j.cub.2003.11.038. [DOI] [PubMed] [Google Scholar]
- 9.Maderspacher F, Nüsslein-Volhard C. Formation of the adult pigment pattern in zebrafish requires leopard and obelix dependent cell interactions. Development. 2003;130(15):3447–3457. doi: 10.1242/dev.00519. [DOI] [PubMed] [Google Scholar]
- 10.Iwashita M, et al. Pigment pattern in jaguar/obelix zebrafish is caused by a Kir7.1 mutation: Implications for the regulation of melanosome movement. PLoS Genet. 2006;2(11):e197. doi: 10.1371/journal.pgen.0020197. [DOI] [PMC free article] [PubMed] [Google Scholar]
- 11.Watanabe M, et al. Spot pattern of leopard Danio is caused by mutation in the zebrafish connexin41.8 gene. EMBO Rep. 2006;7(9):893–897. doi: 10.1038/sj.embor.7400757. [DOI] [PMC free article] [PubMed] [Google Scholar]
- 12.Lang MR, Patterson LB, Gordon TN, Johnson SL, Parichy DM. Basonuclin-2 requirements for zebrafish adult pigment pattern development and female fertility. PLoS Genet. 2009;5(11):e1000744. doi: 10.1371/journal.pgen.1000744. [DOI] [PMC free article] [PubMed] [Google Scholar]
- 13.Eom DS, et al. Melanophore migration and survival during zebrafish adult pigment stripe development require the immunoglobulin superfamily adhesion molecule Igsf11. PLoS Genet. 2012;8(8):e1002899. doi: 10.1371/journal.pgen.1002899. [DOI] [PMC free article] [PubMed] [Google Scholar]
- 14.Lo SJ, et al. Isolation of xanthophores from the goldfish (Carassius auratus L.) In Vitro. 1982;18(4):356–360. doi: 10.1007/BF02796335. [DOI] [PubMed] [Google Scholar]
- 15.Inaba M, Yamanaka H, Kondo S. Pigment pattern formation by contact-dependent depolarization. Science. 2012;335(6069):677. doi: 10.1126/science.1212821. [DOI] [PubMed] [Google Scholar]
- 16.Takahashi G, Kondo S. Melanophores in the stripes of adult zebrafish do not have the nature to gather, but disperse when they have the space to move. Pigment Cell Melanoma Res. 2008;21(6):677–686. doi: 10.1111/j.1755-148X.2008.00504.x. [DOI] [PubMed] [Google Scholar]
- 17. Fisher NI: Statistical Analysis of Circular Data (Cambridge Univ Press, Cambridge, United Kingdom)
- 18.Watanabe M, Kondo S. Changing clothes easily: Connexin41.8 regulates skin pattern variation. Pigment Cell Melanoma Res. 2012;25(3):326–330. doi: 10.1111/j.1755-148X.2012.00984.x. [DOI] [PubMed] [Google Scholar]
- 19.Nakamasu A, Takahashi G, Kanbe A, Kondo S. Interactions between zebrafish pigment cells responsible for the generation of Turing patterns. Proc Natl Acad Sci USA. 2009;106(21):8429–8434. doi: 10.1073/pnas.0808622106. [DOI] [PMC free article] [PubMed] [Google Scholar]
- 20. Westerfield M: The Zebrafish Book: A Guide for the Laboratory Use of Zebrafish (Univ of Oregon Press, Eugene, OR)
Associated Data
This section collects any data citations, data availability statements, or supplementary materials included in this article.


