Significance
Increasing evidence suggests that certain acquired traits can be transmitted to the next generation. However, controversy over the inheritance of acquired traits remains, as the exact molecular and mechanistic basis for these observations remains largely unclear. In this study, using a nongenetic prediabetes mouse model, we have shown that environmentally induced epigenetic alterations in sperm can be inherited to the next generation. Paternal prediabetic conditions affect epigenetic marks in offspring and can be inherited for several generations. This finding provides a molecular basis for the inheritance of acquired traits and may have implications in explaining the prevalence of obesity, type 2 diabetes, and other chronic metabolic diseases.
Abstract
The global prevalence of prediabetes and type 2 diabetes (T2D) is increasing, and it is contributing to the susceptibility to diabetes and its related epidemic in offspring. Although the impacts of paternal impaired fasting blood glucose and glucose intolerance on the metabolism of offspring have been well established, the exact molecular and mechanistic basis that mediates these impacts remains largely unclear. Here we show that paternal prediabetes increases the susceptibility to diabetes in offspring through gametic epigenetic alterations. In our findings, paternal prediabetes led to glucose intolerance and insulin resistance in offspring. Relative to controls, offspring of prediabetic fathers exhibited altered gene expression patterns in the pancreatic islets, with down-regulation of several genes involved in glucose metabolism and insulin signaling pathways. Epigenomic profiling of offspring pancreatic islets revealed numerous changes in cytosine methylation depending on paternal prediabetes, including reproducible changes in methylation over several insulin signaling genes. Paternal prediabetes altered overall methylome patterns in sperm, with a large portion of differentially methylated genes overlapping with that of pancreatic islets in offspring. Our study uniquely revealed that prediabetes can be inherited transgenerationally through the mammalian germ line by an epigenetic mechanism.
The inheritance of acquired characteristics is an interesting and controversial topic. Whereas some of the Lamarckian ideas about environmental inheritance have been dismissed, increasing evidence suggests that certain acquired characteristics can be passed on to the next generation (1–6). One implication of the environmental inheritance system is that it provides a potential mechanism by which parents could transfer beneficial information to their offspring about the environment they experienced.
Despite theoretical considerations, at present there is only scant evidence for transgenerational effects of the environment in mammals. The majority of reported examples of transgenerational environmental inheritance described are related to maternal effects (5–8). However, it is difficult to separate maternal effects on germ cells from direct effects of in utero exposure on offspring. Paternal effects avoid such an issue because fathers contribute little more than sperm to offspring. A small number of paternal effects have been documented in the literature up to now (3, 4, 9, 10). Premating fasting of male mice has been found to affect blood glucose concentrations in offspring (9). Paternal low-dose streptozotocin (STZ)-induced diabetes is accompanied by insulitis and insulin secretion deficiency in mouse offspring (10). A chronic high-fat diet (HFD) in male rats influences pancreatic islet biology in female offspring (3), and a low-protein diet in male mice results in elevated hepatic expression of lipid biosynthetic genes in offspring (4). Furthermore, epidemiological studies in humans indicate that experience of famine in paternal grandfathers is associated with a changed risk of obesity and cardiovascular disease in grandchildren (11, 12). Despite these observations, the exact genetic and mechanistic basis remains largely unclear.
The global prevalence of prediabetes is increasing in modern societies. Although some alleles have been identified to be associated with impaired fasting blood glucose or impaired glucose tolerance (13–15), the majority (>95%) of the patients with impaired fasting blood glucose or impaired glucose tolerance is unrelated to genetic background but is environmentally induced or contributed by nongenetic factors, such as Western food or sedentary behavior (15, 16). It is therefore of great interest to determine the transgenerational effects of paternal prediabetes on offspring and to characterize the mechanisms that mediate these effects. Here, we describe a physiological and genomic screen for transgenerational effects of paternal prediabetes on metabolism and gene expression in offspring of mice (see Fig. S1 for schematic). Paternal prediabetes induced glucose intolerance and insulin resistance in offspring. Expression of hundreds of genes changed in the pancreatic islets of offspring of prediabetic fathers, with altered regulation of glucose metabolic and insulin signaling pathways. Epigenomic profiling in offspring identified changes in cytosine methylation at several insulin signaling genes, and these changes correlated with the expression of these genes. Interestingly, we also found effects of paternal prediabetes on methylation of these genes in sperm, and a large proportion of differentially methylated genes overlapped with that of pancreatic islets. These results reveal a mechanistic basis for the transgenerational inheritance of increase in diabetes risk.
Results
Paternal Prediabetes Leads to Glucose Intolerance and Insulin Resistance in Offspring.
We first generated a nongenetic prediabetes mouse model that closely simulates the metabolic abnormalities of human prediabetes. Insulin resistance was induced in male mice by feeding a high-fat diet, and impaired fasting glucose was induced by injecting these mice with a low dose of STZ, which does not cause diabetes in chow-fed mice, as described previously (17). As expected, prediabetic male founders displayed increased body weight, energy intake, adiposity, plasma glucose, insulin, leptin, cholesterol, and triglyceride levels (Fig. S2 and Table S1). Furthermore, upon glucose and insulin tolerance tests (GTTs and ITTs), they showed decreased insulin sensitivity as well as impaired glucose tolerance compared with controls (Fig. S2 C–E). The homeostasis model assessment of insulin resistance index (HOMA-IR) was also increased (Table S1).
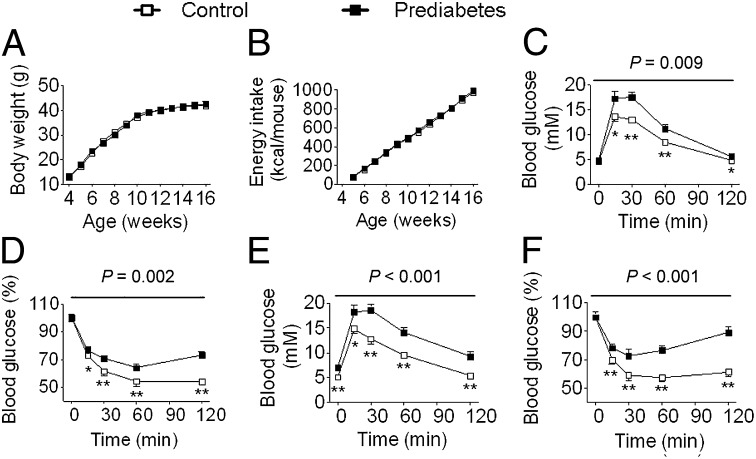
To determine the potential effects of paternal prediabetes on offspring, we mated male founders of prediabetes or control with females and examined physiological and metabolic changes in their offspring at 16 wk of age. Paternal prediabetes did not alter body weight, fat mass, or energy intake in offspring (Fig. 1 A and B, Fig. S3 A and B, and Table S1). Most serum biomarkers were unaffected, although leptin and insulin both showed trends to increased levels in offspring of prediabetic fathers (P = 0.06 and 0.07 in males, and P = 0.18 and 0.09 in females). Next we assessed glucose tolerance and insulin sensitivity in offspring. Paternal prediabetes showed increased blood glucose rise during a glucose tolerance test at 16 wk of age (Fig. 1C and Fig. S3C). A similar pattern was observed at 30 wk, but with a further impairment of glucose tolerance evidenced by a lower P value (Fig. S3 E and G). Concomitantly, the insulin tolerance test revealed a significant decrease in insulin sensitivity in offspring of prediabetic fathers, which worsened with increasing age of the offspring (Fig. 1D and Fig. S3 D, F, and H). Moreover, when these mice reached 12 mo, they exhibited increased fasting blood glucose levels (female control 5.23 ± 0.19 mM, prediabetes 7.38 ± 0.45 mM, P < 0.01; male control 5.15 ± 0.16 mM, prediabetes 7.27 ± 0.33 mM, P < 0.01), accompanied by more serious glucose intolerance and insulin insensitivity (Fig. 1 E and F) in males as seen in their fathers.
Fig. 1.
Paternal prediabetes leads to glucose intolerance and insulin insensitivity in male offspring. (A) Body weight trajectories (control, prediabetes: n = 13 and 16, respectively). (B) Cumulative energy intake (n = 6 and 5, respectively). (C) Blood glucose during GTT at 16 wk (n = 8 and 9, respectively). (D) Blood glucose during ITT at 16 wk (n = 10 and 7, respectively). (E) Blood glucose during GTT at 12 mo (n = 8 and 7, respectively). (F) Blood glucose during ITT at 12 mo (n = 8 and 7, respectively). Data are expressed as mean ± SEM; *P < 0.05, **P < 0.01, versus control. P values for significance between groups in repeated-measure analysis are shown (Upper, C–F).
Paternal Prediabetes Alters Gene Expression Patterns in the Pancreatic Islets of Offspring.
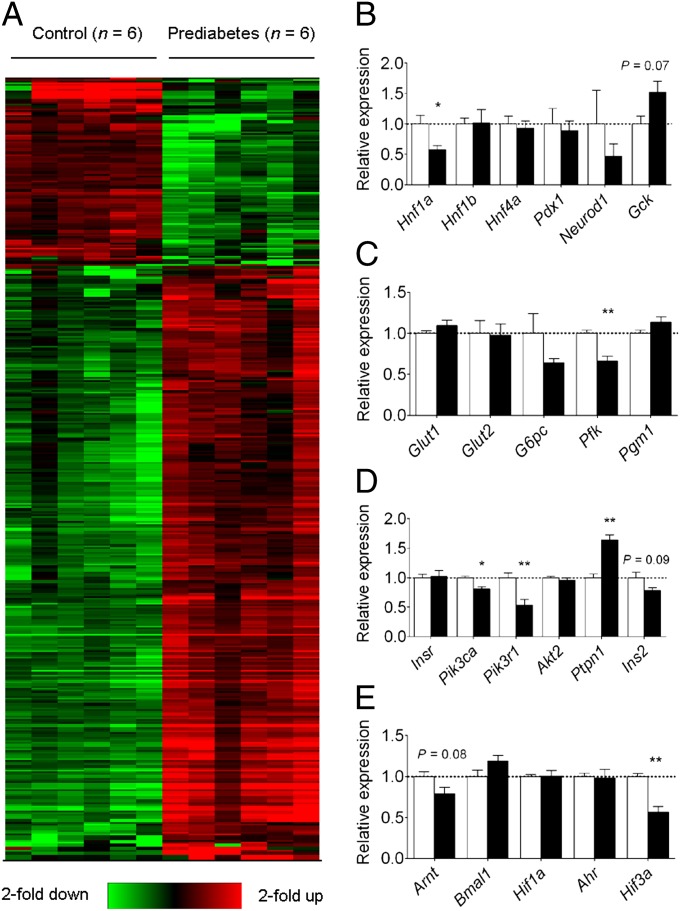
To determine the mechanisms of the glucose intolerance and insulin insensitivity observed in offspring, we performed genome-wide microarray analyses. Paternal prediabetes altered the expression of 402 genes (97 up-regulated and 305 down-regulated, P < 0.05, fold change >2; Fig. 2A and Dataset S1) in the pancreatic islets of offspring. A large proportion of these genes had enriched gene ontology terms associated with insulin and glucose metabolism, including GTPase activity, GTP and ATP binding, sugar binding, and calcium binding (Dataset S2).
Fig. 2.
Paternal prediabetes alters the expression of glucose metabolic and insulin signaling-related genes in the pancreatic islets of offspring. (A) Hierarchical cluster of differentially expressed genes. Six samples of prediabetes groups (Left) and six samples of control groups (Right) were analyzed. Red color indicates relatively up-regulated genes, and green color indicates down-regulated genes. Only genes passing the significance change (P < 0.05 and fold-change >2) are shown. (B–E) Expression levels of six MODY genes (B), glucose transporters and downstream enzymes involved in glycolysis (C), insulin signaling genes (D), and bHLH-PAS family members (E). Data are expressed as mean ± SEM. The dotted line (set as 1) represents the average of expression levels of each gene from controls. *P < 0.05; **P < 0.01; or P values are shown above the bars.
We further focused on three groups of genes that have been shown to affect glucose-stimulated insulin secretion: (i) maturity-onset diabetes of the young (MODY) genes, (ii) glucose uptake and metabolism genes, and (iii) insulin signaling genes. Of the six MODY genes, Hnf1a was significantly decreased in offspring of prediabetic fathers, with 57% expression compared with the control (Fig. 2B). Expression of other MODY genes did not differ significantly between groups. mRNAs for the glucose transporters Glut1 and Glut2 were all detectable in islets, but there were no significant differences in expression (Fig. 2C). In contrast to glucose transporter expression, one of the downstream enzymes in the glycolytic pathway, Pfk, was significantly decreased (Fig. 2C). Expression of G6pc and Pgm1 did not differ significantly. Among the insulin signaling genes, there were no significant differences in expression of insulin receptor (Insr) and Akt2 between the two groups (Fig. 2D). However, phosphatidylinositol (PI) 3-kinase subunits (Pik3ca and Pik3r1) mRNAs were significantly lower in the offspring of prediabetic fathers. On the other hand, expression of protein tyrosine phosphatase non-receptor type 1 (Ptpn1), a tyrosine phosphatase that inhibits insulin signaling, was significantly increased. Proinsulin (Ins2) showed a trend toward decreased expression (P = 0.09). These changes would be likely to lead to impaired insulin signaling in offspring of prediabetic fathers.
Another group of genes that has been reported to be associated with insulin resistance is the basic helix–loop–helix Per/AhR/Arnt/Sim (bHLH-PAS) family. Among the bHLH-PAS family members, Hif3a was significantly decreased and Arnt showed a trend toward decreased expression (P = 0.08; Fig. 2E). We confirmed our results by quantitative real-time PCR (qRT-PCR), which showed a similar expression difference in four genes normalized to two housekeeping genes across 12 animals examined (Fig. S4). Overall, these molecular findings are consistent with metabolic changes in offspring.
Paternal Prediabetes Affects Overall Methylation Patterns in Pancreatic Islets of Offspring.
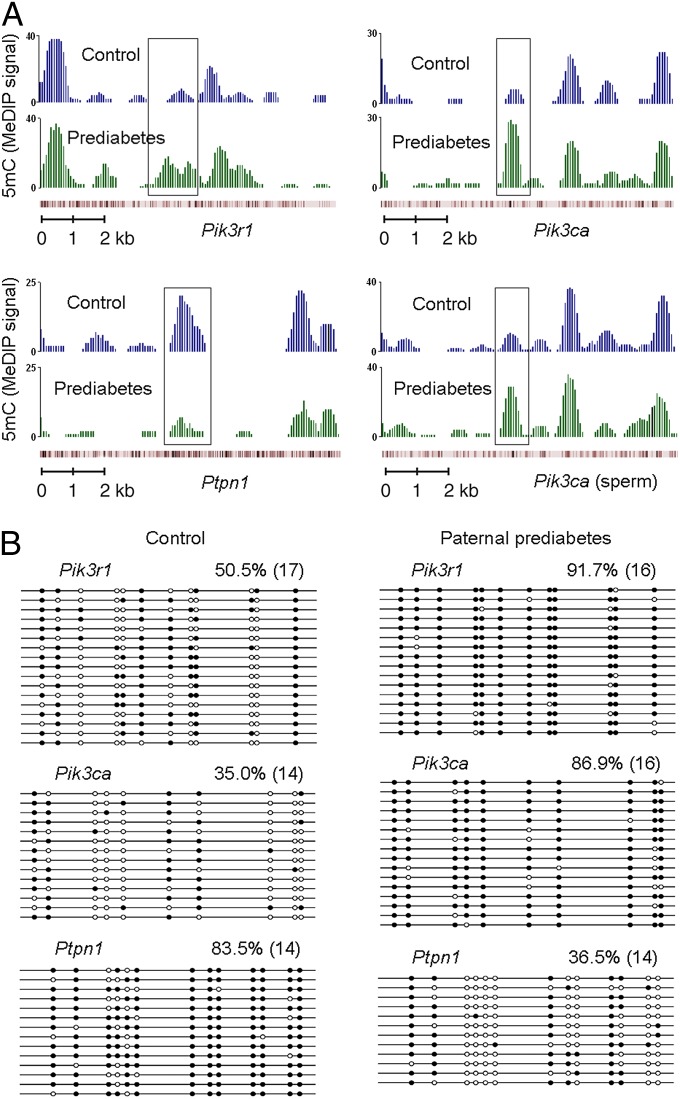
As cytosine methylation is a widespread DNA modification that carries heritable information between generations (6, 18), we therefore turned to genome-wide studies to search for differentially methylated loci between control and prediabetic offspring. We performed methylated DNA immunoprecipitation sequencing (MeDIP-Seq) to characterize cytosine methylation across the entire genome, and fraction of methylated cytosine was calculated for a variety of elements including upstream2k, downstream2k, 5′ untranslated region (5′UTR), 3′UTR, coding sequence (CDS), and intron. Paternal prediabetes altered the methylation of 446 upstream2k, 373 downstream2k, 173 5′UTR, 272 3′UTR, 1,634 CDS, and 5,602 intron element-associated genes (Dataset S3) in the pancreatic islets of offspring, respectively. However, changes in cytosine methylation did not globally correlate with changes in gene expression (Datasets S1 and S3), indicating that gene expression is unlikely to be epigenetically specified at each individual gene. Importantly, we found substantial increases in methylation at intragenic regions of Pik3r1 and Pik3ca (Fig. 3A), methylation at these loci is likely to inhibit transcriptional activity, as it is associated with their low expression levels (Fig. 2D). Bisulfite sequencing for these genes further confirms the methylation status (Fig. 3B). In addition, Ptpn1, which is up-regulated in the pancreatic islets of prediabetic offspring, exhibited decrease in cytosine methylation (Fig. 3 A and B), further suggesting that epigenetic regulation could drive a substantial fraction of the observed expression changes in offspring. Together, these results identify several differentially methylated loci that are strong candidates to be upstream controllers of the gene expression changes in offspring.
Fig. 3.
Paternal prediabetes alters the methylation status of several insulin signaling genes in offspring. (A) MeDIP-Seq data are shown for three insulin signaling genes, including Pik3r1 (Upper Left), Pik3ca (Upper Right) and Ptpn1 (Lower Left) in offspring, and Pik3ca (Lower Right) in sperm. The graphs show smoothed number of normalized reads, which represent output MeDIP signals. Genes are shown below the graphs, and red bars represent the position of the CpGs. The regions that are differentially methylated are shown in the box. (B) Bisulfite sequencing for the methylation status of indicated genes. White circles represent unmethylated CpGs, and black circles represent methylated CpGs. Values on each bisulfite grouping indicate the percentage of CpG methylation, with number of analyzed clones in parentheses.
Paternal Prediabetes Alters Overall Methylation Patterns in Sperm.
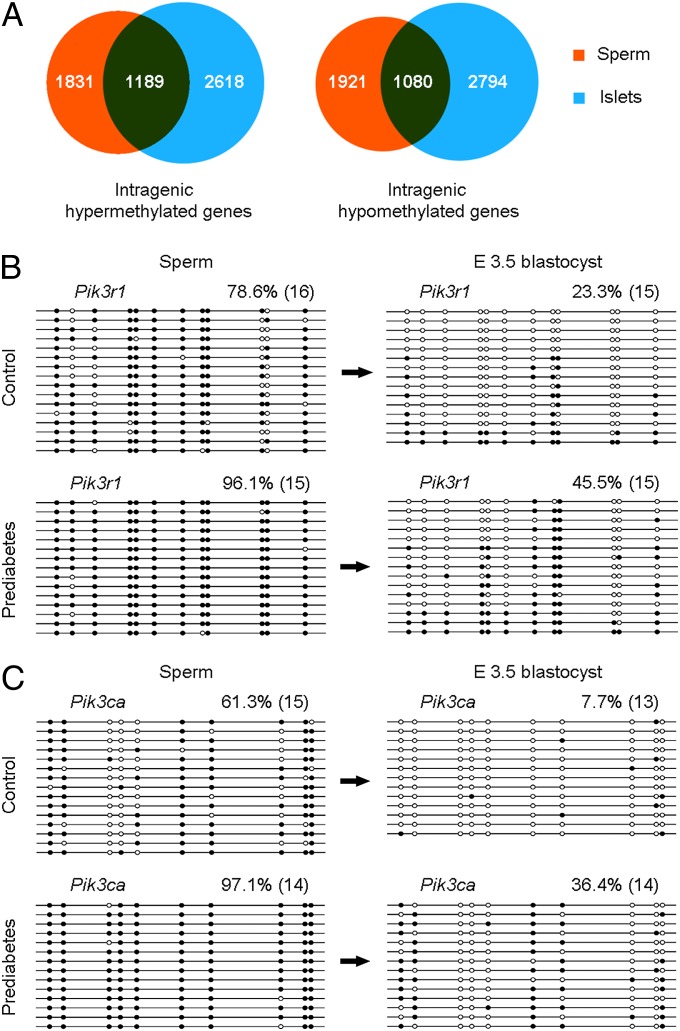
The above results led us to consider the hypothesis that paternal prediabetes affects cytosine methylation patterns in sperm. To globally investigate effects of paternal prediabetes on sperm methylation, we isolated sperm from control and prediabetic males, and surveyed cytosine methylation patterns across the entire genome by MeDIP-Seq. Notably, global cytosine methylation profiles were altered in prediabetes samples compared with controls, and the methylation of 263 upstream2k, 278 downstream2k, 121 5′UTR, 247 3′UTR, 1,299 CDS, and 4,354 intron element-associated genes were changed, respectively (Dataset S4). These results indicate that the sperm epigenome is largely responsive to environmental differences provided by males. Of particular interest, we observed that a large proportion of differentially methylated genes identified in sperm overlapped with that of pancreatic islets. In sperm, of the identified 3,020 intragenic element-associated (including intron, CDS, 5′UTR, and 3′UTR) hypermethylated genes, 1,189 (∼39%) were also hypermethylated in pancreatic islets, and of the 3,001 intragenic element-associated hypomethylated genes, 1,080 (∼36%) were also hypomethylated in pancreatic islets (Fig. 4A). On the other hand, of the 287 intergenic element-associated (including upstream2k and downstream2k) hypermethylated genes, only 9 (∼3%) were also hypermethylated in pancreatic islets, and of the 254 hypomethylated genes, only 7 (∼3%) were also hypomethylated in pancreatic islets (Fig. S5A). These results indicate that cytosine methylation in sperm (especially for intragenic regions) is a strong factor in determining methylation status in somatic tissues.
Fig. 4.
Comparison of DNA methylation patterns in sperm, islets, and E3.5 blastocysts. (A) Venn diagrams of differentially methylated intragenic element-associated genes show numerous overlaps between sperm and pancreatic islets. (B and C) Bisulfite sequencing of Pik3r1 (B) and Pik3ca (C) in sperm and E3.5 blastocysts show partial inheritance of DNA methylation from gametes. Genes are shown above the graphs. White circles represent unmethylated CpGs, and black circles represent methylated CpGs. Values on each bisulfite grouping indicate the percentage of CpG methylation, with number of analyzed clones in parentheses.
Most interestingly, we found a substantial increase in methylation at the same region of Pik3ca in sperm (Fig. 3A), which has been found to be hypermethylated in pancreatic islets. We then assayed the methylation status of this locus by bisulfite sequencing, and found an average difference of 35.8% methylation between control and prediabetes sperm (Fig. 4C). Given that MeDIP is unlikely to identify small differences (such as 10% or 20%) in methylation at a small number of cytosines, we performed bisulfite sequencing to determine the methylation status of Pik3r1 and Ptpn1 in sperm. The methylation level of Pik3r1 was increased in prediabetes samples compared with controls (78.6% vs. 96.1%; Fig. 4B). In contrast, methylation of Ptpn1 was unaltered between control and prediabetes sperm (Fig. S5B), indicating that differential methylation at this locus observed in islets is established at some point during development. To test whether genes differentially methylated are de novo methylated or potentially inherited DNA methylation from sperm, we performed bisulfite sequencing on embryonic day (E) 3.5 blastocysts. Both Pik3r1 and Pik3ca showed higher methylation levels in prediabetes samples compared with controls (Fig. 4 B and C), suggesting that these genes partially inherit methylated alleles from sperm. Together, these results indicate that cytosine methylation status in sperm strongly predisposes toward methylation in blastocysts, perhaps by incomplete postfertilization demethylation of methylated cytosines.
Effects of Paternal Prediabetes on Metabolic and Epigenetic Changes in the F2 Generation.
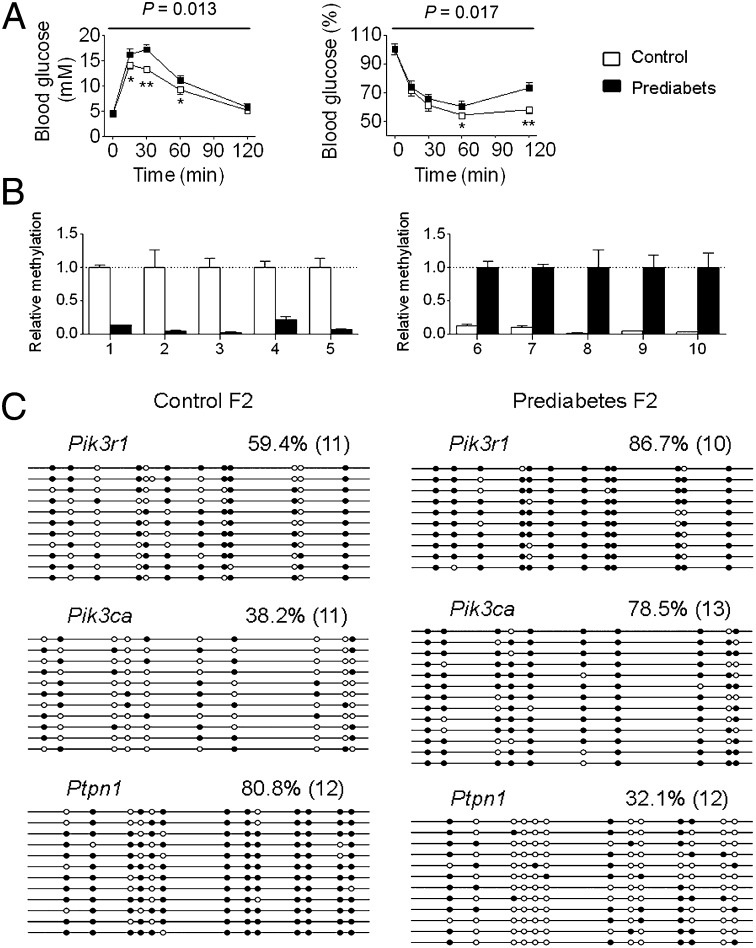
In our study, the offspring (F1 generation) derived from the prediabetic fathers (F0 generation) exhibited a prediabetes phenotype. We then asked whether the metabolic and epigenetic changes in the F1 generation can be passed to the next generation (F2 generation). We mated male F1 generation of prediabetes or control mice that were aged 12 mo with normal females and then examined metabolic and epigenetic changes in their offspring. We first assessed metabolic changes in the F2 generation at 16 wk of age and found that the F2 generation also exhibited impaired glucose tolerance and decreased insulin sensitivity (Fig. 5 A and B and Fig. S6 A and B), accompanied by nonalteration in fasting blood glucose levels (female control 4.53 ± 0.11 mM, prediabetes 4.64 ± 0.15 mM, P = 0.74; male control 4.51 ± 0.18 mM, prediabetes 4.72 ± 0.23 mM, P = 0.52) as seen in the F1 generation at 16 wk of age. We then assessed epigenetic changes in these animals. We randomly selected 10 regions distributed on different chromosomes that were most affected by paternal prediabetes from the islets MeDIP-Seq dataset. MeDIP-qPCR analysis showed that all of these regions were significantly affected in the F2 generation (Fig. 5B). Moreover, we examined the methylation status of Pik3r1, Pik3ca, and Ptpn1, and also found a similar methylation status compared with the F1 generation (Fig. 5C). Because the F1 generation animals lived in standard laboratory housing without any treatment and their offspring exhibited similar phenotypic and epigenetic changes, the observed effects of epigenetic inheritance are most likely due to the prediabetes-associated physiological and metabolic conditions in fathers, although we cannot completely rule out the effects of treatment on the F0 generation males.
Fig. 5.
Effects of paternal prediabetes on metabolic and epigenetic changes in the F2 generation. (A) Blood glucose during GTT (Left) and ITT (Right) at 16 wk of F2 generation males (n = 8 and 7, respectively). Data are expressed as mean ± SEM; *P < 0.05, **P < 0.01, versus control. P values for significance between groups in repeated-measure analysis are shown (Upper). (B) MeDIP-qPCR for the methylation levels of the randomly selected 10 regions (Left, five down-regulated; Right, five up-regulated) distributed on different chromosomes that were most affected by paternal prediabetes in islets of the F2 generation. Samples from four control and four prediabetes F2 generation offspring, each from a different father, were chosen for analysis. All of the detailed region information is described in SI Methods. (C) Bisulfite sequencing for the methylation status of indicated genes in islets of the F2 generation. Pooled DNA from three control and three prediabetic animals, each from a different father were included. White circles represent unmethylated CpGs, and black circles represent methylated CpGs. Values on each bisulfite grouping indicate the percentage of CpG methylation, with number of clones analyzed in parentheses.
Assessment of STZ’s Effects on Sperm and Offspring Epigenetic Alterations.
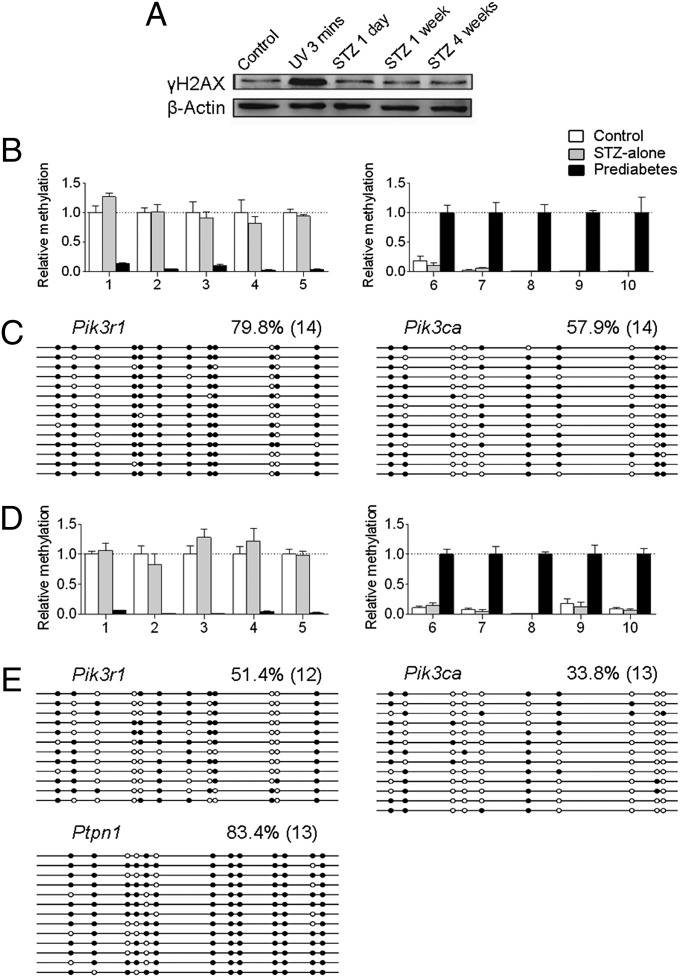
Although STZ is an alkylating agent, it is recognized and transported by Glut2; thus it is mainly targeted to pancreatic β cells, which express high levels of this protein (19, 20). Furthermore, the half-life of STZ is very short (∼5–15 min in vivo), which indicates that it cannot function for a prolonged time in vivo, but mating of animals occurs post 4 wk of STZ injection. These facts do not favor the low dose of injected STZ as the reason for sperm epigenetic alterations. To further assess STZ’s effects, an identical amount of STZ was injected in chow-fed mice, which does not cause diabetes but has the same effects of STZ on sperm DNA (17). Western blot analysis showed that expression of the sensitive DNA-damage marker γH2AX was unchanged post 1 d, 1 wk, or 4 wk of STZ injection (Fig. 6A), indicating that the low dose of STZ does not cause DNA damage in sperm. Next we asked whether the low dose of STZ causes epigenomic changes of sperm DNA. We randomly selected 10 regions distributed on different chromosomes that were most affected by paternal prediabetes from the sperm MeDIP-Seq data. MeDIP-qPCR analysis showed that none of these regions were affected in sperm of STZ-alone treated nondiabetic animals (Fig. 6B). Bisulfite sequencing analysis showed that the methylation status of Pik3r1 and Pik3ca was also unaffected by STZ-alone treatment (Fig. 6C). These results indicate that the low dose of STZ does not cause epigenomic alterations in sperm. To further clarify this issue, we mated STZ-alone–treated nondiabetic males with females and examined epigenetic changes in islets of offspring at 3 wk of age. Similarly, we used the randomly selected 10 regions distributed on different chromosomes that were most affected by paternal prediabetes as used in the F2 generation. MeDIP-qPCR analysis showed that none of these regions were affected by STZ-alone treatment (Fig. 6D). Bisulfite sequencing analysis showed that the methylation status of Pik3r1, Pik3ca, and Ptpn1 was also unaffected by STZ-alone treatment (Fig. 6E). These results largely exclude the possibility that the effects of epigenetic inheritance are due to the action of STZ on sperm DNA.
Fig. 6.
Assessment of STZ’s effects on sperm and offspring epigenetic alterations. (A) Western blot analysis of the sensitive DNA-damage marker γH2AX in sperm. The expression was unchanged at 1 d, 1 wk, and 4 wk post-STZ injection, but was significantly increased after a 3-min UV exposure. (B and D) MeDIP-qPCR for the methylation levels of the randomly selected 10 regions (Left, five down-regulated; Right, five up-regulated) distributed on different chromosomes that were most affected by paternal prediabetes in sperm (B) and islets of offspring (D). All of the detailed region information is described in SI Methods. (C and E) Bisulfite sequencing for the methylation status of indicated genes in sperm (C) and islets of offspring (E). White circles represent unmethylated CpGs, and black circles represent methylated CpGs. Values on each bisulfite grouping indicate the percentage of CpG methylation, with number of analyzed clones in parentheses.
Discussion
In the present study, we have shown that paternal prediabetes affects metabolic parameters and gene expression profiles in offspring, and that the epigenetic information carrier in sperm responding to environmental conditions is largely heritable. Our results provide evidence and a molecular basis for the intergenerational inheritance of an acquired trait, therefore supporting the Lamarckian idea of environmental inheritance. Given the rising evidence indicating the importance of 5-hydroxymethyl cytosine in epigenetic regulation, it should be noted that the bisulfite sequencing results represent pooled status of 5-methyl cytosine and 5-hydroxymethyl cytosine.
Paternal prediabetes could potentially affect the offspring’s metabolism via a number of different mechanisms. For example, paternal lifestyle changes can affect spermatogenesis and the composition of seminal fluid (21, 22), and parental information can also be passed to the next generations via social or cultural inheritance systems (7, 23, 24). Here we focused on the hypothesis that environmental information does reside in sperm epigenetic information carriers to control the offspring’s phenotype. First, increased testicular temperature resulting from more fat accumulation and increased concentrations of certain serum biomarkers (such as glucose, insulin, and leptin) may affect DNA reprogramming of the gamete (25, 26). Second, a subset of epigenetic modifications in gametes is known to be heritable (6, 27, 28), and our methylome analysis does find numerous genes that tend to be differentially methylated in sperm of prediabetic fathers. Specifically, we observed that certain genes (such as Pik3ca and Pik3r1) can partially resist global demethylation postfertilization and largely inherit cytosine methylation from sperm, further suggesting that there is intergenerational transmission of cytosine methylation at a substantial fraction of the genome. Whether paternal metabolic state-induced methylation changes in sperm-inherited genes can also be inherited to other somatic tissues is an open question. We have examined methylation levels of the sperm-inherited genes in the liver of offspring (Fig. S7) and included additional discussion in SI Methods.
Our results extend findings of researchers from a previous study (29), which identified some nonimprinted sequences that resist demethylation in preimplantation embryo development. Therefore, cytosine methylation status in gametes strongly predisposes toward methylation status in blastocysts. Together with previous work showing that histone modification can also be transmitted from gametes to embryos (28, 30), this indicates that epigenetic information linked to environmental factors participates in early steps of development and thereby offspring.
Together, we uniquely characterized the mechanistic basis for the transgenerational inheritance of susceptibility to diabetes. Our results suggest reconsideration of basic approaches to some epidemic and chronic disease, such as obesity and diabetes. These findings also imply that, in the near future, epigenetic factors, which are heritable, should be regarded as important as genetic factors in determining risk of some diseases.
Methods
Animal Care.
All animal care and use procedures were in accordance with guidelines of the Institutional Animal Care and Use Committee of the Institute of Zoology, Chinese Academy of Sciences. All experiments were performed with Institute of Cancer Research mice. We generated prediabetes mouse models according to a previous study, with slight changes (17). Male F0 founders were weaned from mothers at 3 wk of age, and sibling males were placed into cages with HFD (33% energy as fat) or control diet until 12 wk of age, at which point mice fed with HFD were injected intraperitoneally with a subdiabetogenic dose of STZ (100 mg/kg body weight) and kept on the same diet for 4 wk. Fasting blood glucose (2 h of fasting) was examined each week post-STZ for 4 wk, and only glucose levels at ∼7–11 mM were considered as prediabetes. At 16 wk, male F0 founders were mated with females. At 3 wk of age, a portion of the offspring were killed and islets were generated, each from a different father, which were used for further expression and methylation analysis. Phenotype data from one offspring per father, chosen at random, were generated at 16 wk of age. GTT and ITT were also performed in offspring at 30 wk and 12 mo of age. Additional details are provided in SI Methods.
Microarray Expression Profiling.
Pancreatic islets were isolated as previously described (31). Samples from six control and six prediabetic offspring (three females and three males for each group), each from different fathers, were chosen for microarray analysis using NimbleGen Mouse Gene Expression 12× 135K array (Roche NimbleGen), according to the manufacturer’s instructions. Additional details are provided in SI Methods.
qRT-PCR.
We analyzed mRNA levels by qRT-RCR after reverse transcription as described before (32). The same samples used for microarray analysis (one offspring per father; n = 6, prediabetes; n = 6, control) were used for qRT-PCR. Additional details are provided in SI Methods.
MeDIP-Seq and MeDIP-qPCR.
For offspring, the same animals used in the microarray analysis were used for the MeDIP study. For sperm, the animals used were exactly the fathers of offspring used for microarray analysis. The MeDIP method was adapted from a previous study (33). For qPCR following MeDIP, recovered DNA fractions were diluted 1/50 and measured using real-time PCR with an Applied Biosystems7500 system and SYBR Green SuperMix UDG (Invitrogen). Primers are summarized in Dataset S5. Additional details are provided in SI Methods.
Bisulfite Sequencing.
Bisulfite genomic sequencing was performed as previously described (32). For offspring, the same samples used in microarray were used for bisulfite sequencing. For sperm, the animals used were exactly the fathers of offspring used for the microarray analysis. For bisulfite sequencing, pooled DNA of six animals (equally from each animal) for each group was used for the analysis. For E3.5 blastocysts, each bisulfite treatment was performed on 18 pooled blastocysts derived from three animals (6 blastocysts randomly selected from each animal) for each group. Additional details are provided in SI Methods.
Statistical Analyses.
Phenotype data were analyzed by SPSS 16.0 after log transformation or square-root transformation unless raw data were normally distributed. Measurements at single time points were analyzed by ANOVA, or, if appropriate, by two-tailed Student t test. Time courses were analyzed by repeated-measurements ANOVA. All data are shown as mean ± SEM; P < 0.05 was considered statistically significant.
Supplementary Material
Acknowledgments
We thank all members of the State Key Laboratory of Reproductive Biology for their helpful discussions, CapitalBio Corporation for help with microarray experiments, and Beijing Genomics Institute for help with sequencing. This work was supported by the National Basic Research Program of China (2012CB944404, 2011CB944501).
Footnotes
The authors declare no conflict of interest.
This article is a PNAS Direct Submission.
Data deposition: The microarray and MeDIP-Seq data reported in this paper have been deposited in the Gene Expression Omnibus (GEO) database, www.ncbi.nlm.nih.gov/geo (accession no. GSE43239).
This article contains supporting information online at www.pnas.org/lookup/suppl/doi:10.1073/pnas.1321195111/-/DCSupplemental.
References
- 1.Seong KH, Li D, Shimizu H, Nakamura R, Ishii S. Inheritance of stress-induced, ATF-2-dependent epigenetic change. Cell. 2011;145(7):1049–1061. doi: 10.1016/j.cell.2011.05.029. [DOI] [PubMed] [Google Scholar]
- 2.Rechavi O, Minevich G, Hobert O. Transgenerational inheritance of an acquired small RNA-based antiviral response in C. elegans. Cell. 2011;147(6):1248–1256. doi: 10.1016/j.cell.2011.10.042. [DOI] [PMC free article] [PubMed] [Google Scholar]
- 3.Ng SF, et al. Chronic high-fat diet in fathers programs β-cell dysfunction in female rat offspring. Nature. 2010;467(7318):963–966. doi: 10.1038/nature09491. [DOI] [PubMed] [Google Scholar]
- 4.Carone BR, et al. Paternally induced transgenerational environmental reprogramming of metabolic gene expression in mammals. Cell. 2010;143(7):1084–1096. doi: 10.1016/j.cell.2010.12.008. [DOI] [PMC free article] [PubMed] [Google Scholar]
- 5.Champagne FA. Epigenetic mechanisms and the transgenerational effects of maternal care. Front Neuroendocrinol. 2008;29(3):386–397. doi: 10.1016/j.yfrne.2008.03.003. [DOI] [PMC free article] [PubMed] [Google Scholar]
- 6.Cropley JE, Suter CM, Beckman KB, Martin DI. Germ-line epigenetic modification of the murine A vy allele by nutritional supplementation. Proc Natl Acad Sci USA. 2006;103(46):17308–17312. doi: 10.1073/pnas.0607090103. [DOI] [PMC free article] [PubMed] [Google Scholar]
- 7.Weaver IC, et al. Epigenetic programming by maternal behavior. Nat Neurosci. 2004;7(8):847–854. doi: 10.1038/nn1276. [DOI] [PubMed] [Google Scholar]
- 8.Symonds ME, Sebert SP, Hyatt MA, Budge H. Nutritional programming of the metabolic syndrome. Nat Rev Endocrinol. 2009;5(11):604–610. doi: 10.1038/nrendo.2009.195. [DOI] [PubMed] [Google Scholar]
- 9.Anderson LM, et al. Preconceptional fasting of fathers alters serum glucose in offspring of mice. Nutrition. 2006;22(3):327–331. doi: 10.1016/j.nut.2005.09.006. [DOI] [PubMed] [Google Scholar]
- 10.Linn T, Loewk E, Schneider K, Federlin K. Spontaneous glucose intolerance in the progeny of low dose streptozotocin-induced diabetic mice. Diabetologia. 1993;36(12):1245–1251. doi: 10.1007/BF00400801. [DOI] [PubMed] [Google Scholar]
- 11.Kaati G, Bygren LO, Edvinsson S. Cardiovascular and diabetes mortality determined by nutrition during parents’ and grandparents’ slow growth period. Eur J Hum Genet. 2002;10(11):682–688. doi: 10.1038/sj.ejhg.5200859. [DOI] [PubMed] [Google Scholar]
- 12.Pembrey ME, et al. ALSPAC Study Team Sex-specific, male-line transgenerational responses in humans. Eur J Hum Genet. 2006;14(2):159–166. doi: 10.1038/sj.ejhg.5201538. [DOI] [PubMed] [Google Scholar]
- 13.Sladek R, et al. A genome-wide association study identifies novel risk loci for type 2 diabetes. Nature. 2007;445(7130):881–885. doi: 10.1038/nature05616. [DOI] [PubMed] [Google Scholar]
- 14.Scott LJ, et al. A genome-wide association study of type 2 diabetes in Finns detects multiple susceptibility variants. Science. 2007;316(5829):1341–1345. doi: 10.1126/science.1142382. [DOI] [PMC free article] [PubMed] [Google Scholar]
- 15.Meigs JB, et al. Genotype score in addition to common risk factors for prediction of type 2 diabetes. N Engl J Med. 2008;359(21):2208–2219. doi: 10.1056/NEJMoa0804742. [DOI] [PMC free article] [PubMed] [Google Scholar]
- 16.Kahn SE, Hull RL, Utzschneider KM. Mechanisms linking obesity to insulin resistance and type 2 diabetes. Nature. 2006;444(7121):840–846. doi: 10.1038/nature05482. [DOI] [PubMed] [Google Scholar]
- 17.Luo J, et al. Nongenetic mouse models of non-insulin-dependent diabetes mellitus. Metabolism. 1998;47(6):663–668. doi: 10.1016/s0026-0495(98)90027-0. [DOI] [PubMed] [Google Scholar]
- 18.Waterland RA, Jirtle RL. Transposable elements: Targets for early nutritional effects on epigenetic gene regulation. Mol Cell Biol. 2003;23(15):5293–5300. doi: 10.1128/MCB.23.15.5293-5300.2003. [DOI] [PMC free article] [PubMed] [Google Scholar]
- 19.Wang Z, Gleichmann H. GLUT2 in pancreatic islets: Crucial target molecule in diabetes induced with multiple low doses of streptozotocin in mice. Diabetes. 1998;47(1):50–56. doi: 10.2337/diab.47.1.50. [DOI] [PubMed] [Google Scholar]
- 20.Schnedl WJ, Ferber S, Johnson JH, Newgard CB. STZ transport and cytotoxicity. Specific enhancement in GLUT2-expressing cells. Diabetes. 1994;43(11):1326–1333. doi: 10.2337/diab.43.11.1326. [DOI] [PubMed] [Google Scholar]
- 21.Robertson SA. Seminal plasma and male factor signalling in the female reproductive tract. Cell Tissue Res. 2005;322(1):43–52. doi: 10.1007/s00441-005-1127-3. [DOI] [PubMed] [Google Scholar]
- 22.Sharpe RM. Environmental/lifestyle effects on spermatogenesis. Philos Trans R Soc Lond B Biol Sci. 2010;365(1546):1697–1712. doi: 10.1098/rstb.2009.0206. [DOI] [PMC free article] [PubMed] [Google Scholar]
- 23.Champagne F, Meaney MJ. Like mother, like daughter: Evidence for non-genomic transmission of parental behavior and stress responsivity. Prog Brain Res. 2001;133:287–302. doi: 10.1016/s0079-6123(01)33022-4. [DOI] [PubMed] [Google Scholar]
- 24.Meaney MJ, Szyf M, Seckl JR. Epigenetic mechanisms of perinatal programming of hypothalamic-pituitary-adrenal function and health. Trends Mol Med. 2007;13(7):269–277. doi: 10.1016/j.molmed.2007.05.003. [DOI] [PubMed] [Google Scholar]
- 25.Aitken RJ, Koopman P, Lewis SE. Seeds of concern. Nature. 2004;432(7013):48–52. doi: 10.1038/432048a. [DOI] [PubMed] [Google Scholar]
- 26.Du Plessis SS, Cabler S, McAlister DA, Sabanegh E, Agarwal A. The effect of obesity on sperm disorders and male infertility. Nat Rev Urol. 2010;7(3):153–161. doi: 10.1038/nrurol.2010.6. [DOI] [PubMed] [Google Scholar]
- 27.Brykczynska U, et al. Repressive and active histone methylation mark distinct promoters in human and mouse spermatozoa. Nat Struct Mol Biol. 2010;17(6):679–687. doi: 10.1038/nsmb.1821. [DOI] [PubMed] [Google Scholar]
- 28.Hammoud SS, et al. Distinctive chromatin in human sperm packages genes for embryo development. Nature. 2009;460(7254):473–478. doi: 10.1038/nature08162. [DOI] [PMC free article] [PubMed] [Google Scholar]
- 29.Borgel J, et al. Targets and dynamics of promoter DNA methylation during early mouse development. Nat Genet. 2010;42(12):1093–1100. doi: 10.1038/ng.708. [DOI] [PubMed] [Google Scholar]
- 30.Puschendorf M, et al. PRC1 and Suv39h specify parental asymmetry at constitutive heterochromatin in early mouse embryos. Nat Genet. 2008;40(4):411–420. doi: 10.1038/ng.99. [DOI] [PubMed] [Google Scholar]
- 31.Kulkarni RN, et al. Altered function of insulin receptor substrate-1-deficient mouse islets and cultured beta-cell lines. J Clin Invest. 1999;104(12):R69–R75. doi: 10.1172/JCI8339. [DOI] [PMC free article] [PubMed] [Google Scholar]
- 32.Wei Y, et al. Unfaithful maintenance of methylation imprints due to loss of maternal nuclear Dnmt1 during somatic cell nuclear transfer. PLoS ONE. 2011;6(5):e20154. doi: 10.1371/journal.pone.0020154. [DOI] [PMC free article] [PubMed] [Google Scholar]
- 33.Weber M, et al. Distribution, silencing potential and evolutionary impact of promoter DNA methylation in the human genome. Nat Genet. 2007;39(4):457–466. doi: 10.1038/ng1990. [DOI] [PubMed] [Google Scholar]
Associated Data
This section collects any data citations, data availability statements, or supplementary materials included in this article.


