

Abstract
Mycobacterium marinum infected zebrafish are used to study tuberculosis pathogenesis, as well as for antitubercular drug discovery. The small size of zebrafish larvae coupled with their optical transparency allows for rapid analysis of bacterial burdens and host survival in response to genetic and pharmacological manipulations of both mycobacteria and host. Automated fluorescence microscopy and automated plate fluorimetry (APF) are coupled with facile husbandry to facilitate large-scale, repeated analysis of individual infected fish. Both methods allow for in vivo screening of chemical libraries, requiring only 0.1 μmol of drug per fish to assess efficacy; they also permit a more detailed evaluation of the individual stages of tuberculosis pathogenesis. Here we describe a 16-h protocol spanning 22 d, in which zebrafish larvae are infected via the two primary injection sites, the hindbrain ventricle and caudal vein; this is followed by the high-throughput evaluation of pathogenesis and antimicrobial efficacy.
Introduction
Tuberculosis remains a grave problem through much of the world, with an increase in both drug-sensitive and drug-resistant disease. There is an urgent need for a deeper understanding of its immunopathogenesis and for the identification of new drugs. Traditionally, the mouse, guinea pig and rabbit have been used for studies of mycobacterial pathogenesis1. Each has its advantages and disadvantages. The mouse is replete with immunological and genetic tools, whereas the guinea pig and rabbit mimic the pathology of human tuberculosis more closely. More recently, primates have been used for tuberculosis studies; although primates mirror human tuberculosis the most closely, this model presents additional ethical and cost concerns1. The zebrafish is a natural host to M. marinum, a pathogen of ectotherms that is the closest genetic relative of the M. tuberculosis organism complex1. Adult zebrafish develop tuberculosis-like disease with pathology that is strikingly similar to that of humans.
We have developed the zebrafish larva as a model in order to study in unprecedented detail the early events of mycobacterial pathogenesis: macrophage recruitment to the site of infection, phagocytosis of the bacteria and the transit of infected macrophages back into deeper tissues in which granuloma formation occurs2, 3, 4. By using this model, we have revisited and overturned long-standing dogmas about mycobacterial pathogenesis, e.g., the role of the macrophage and the granuloma3, 4, 5, 6. We have identified a role for excess inflammation as a driver of pathogenesis and have validated these findings in humans5, 7. Finally, we have developed the zebrafish as a model for antitubercular drug discovery, wherein both traditional antimicrobials and new classes of host-targeting antimicrobials can be identified8, 9.
Zebrafish are increasingly being used to study the pathogenesis of a variety of other bacterial, viral and fungal infections10, 11, 12, 13, 14, 15, 16, 17, of host interactions with commensal bacteria18 and of noninfectious diseases such as cancer19, 20. The protocol we describe here should be broadly adaptable to the study of other infectious and inflammatory conditions.
Experimental Design
Infection experiments are initiated by choosing the ideal fluorescent strain, which is then cultured and processed to yield a single-cell preparation. Adult zebrafish are spawned as previously described21 to produce zebrafish larvae, which are then infected with M. marinum by microinjection into either the hindbrain ventricle at 30 h post fertilization (h.p.f.) or the caudal vein at 30–48 h.p.f. After hindbrain injection, the number of recruited macrophages to the hindbrain ventricle is enumerated by differential interference contrast (DIC) microscopy and compared with control, i.e., larvae that have been hindbrain-injected with vehicle alone. The recent engineering of zebrafish lines with fluorescent macrophages should allow for this assay to be performed by fluorescence microscopy as well22. After systemic infection via microinjection into the caudal vein, intracellular bacterial burden can be assessed by direct counting of bacteria per macrophage. In addition, overall bacterial burden of whole larvae can be quantified by high-throughput fluorescence microscopy followed by fluorescence quantification of images via fluorescent pixel count (FPC) or by APF. If desired, infection burden and larval survival can be used as an output for antimicrobial compound efficacy by the addition of compounds directly to fish water.
Fluorescent Bacterial Strains
Initial fluorescence-based work using M. marinum was limited to the basic green and red fluorescent proteins EGFPmut3 and dsRed. To take advantage of the improved brightness and spectral options available, as well as to enhance the ability to use multiple combinations of bacterial and host fluorescent reporters, a variety of newly available fluorescent proteins were cloned into the constitutively expressed mycobacterial pmsp12 vector (Table 1). For simple experiments in which only a single fluor is required, tdTomato provides optimal brightness with low larval autofluorescence. For APF, which is less sensitive than fluorescence microscopy, the bright, far-red tdKatushka2 fluorescent protein is required to maximize fluorescent signal while minimizing autofluorescence of larval tissue.
Table 1.
Fluorescent protein and expression construct library
| Protein | Plasmid | Ex | Em | Brightness |
|---|---|---|---|---|
| EBFP2 | pTEC18 | 383 | 448 | 17920 |
| Teal | pTEC17 | 399 | 456 | 54400 |
| Wasabi | pTEC15 | 493 | 509 | 56000 |
| mOrange2 | pTEC16 | 549 | 565 | 34800 |
| tdTomato | pTEC27 | 554 | 581 | 95220 |
| tdKatushka2 | pTEC22 | 588 | 633 | 49025 |
| mKate2 | pTEC20 | 588 | 635 | 15300 |
| E2-Crimson | pTEC19 | 611 | 646 | 28980 |
Single-cell preparations
Because M. marinum cultures contain a mixture of clumps of various sizes, as well as single cells, processing of culture is required to produce a homogenous, quantitatively controlled preparation for consistent microinjections and infection dosing. Previously, mycobacterial cultures were grown to mid-log phase and then repeatedly passaged through a 27-gauge needle to reduce the size and abundance of bacterial aggregates, while also generating single-cell bacteria23. Although this produced a more homogenized preparation of bacteria, aggregates of variable size were still present, making exact enumeration and control of infection dose impossible. Alternatively, passage of culture through a 5-μm filter resulted in the isolation of single-cell mycobacteria, thus allowing for exact enumeration and infection dosing; however, loss of bacteria during filtration resulted in low yields. Thus, both methods were combined: syringe passaging to generate larger numbers of single cells, followed by filtration to isolate them (Fig. 1). In addition, normal growth medium lacking Tween, 7H9OADC, was used for suspension of bacteria to avoid potential bacterial cell death in PBS. Tests comparing the survival of larvae injected with 7H9OADC or PBS showed that neither had any detrimental effect on larval health. Finally, the procedure was scaled up and followed by storage of prepared aliquots at −80 °C to eliminate the time and labor required for repeated preparation of bacterial preps for each experiment, while also improving the consistency of infection dose from experiment to experiment24.
Figure 1. Single-cell preparation.

(a, b) Representative images (a) and enumeration (b) of bacterial aggregates and single cells at sequential stages of single-cell preparation; unprocessed culture, syringed culture and culture filtrate. Repeated passage through a 27-gauge needle reduces bacterial aggregate size and abundance while also generating single cells. Passage of the syringed culture through a 5-μm filter isolates single cells. Scale bar, 100 μm.
Injection sites
Although many anatomical structures can be targeted for infection, the two primary injection sites are the hindbrain ventricle and the caudal vein (Fig. 2). The hindbrain ventricle is normally devoid of macrophages and has thus been the standard for assessing the recruitment of macrophages to the site of infection2, 3, 8 or the ability of chemoattractant molecules to stimulate chemotaxis9. Infection via the caudal vein is used for producing systemic infections and analyzing multiple infection outcomes, such as bacteria per macrophage7, 25, granuloma formation5, 6, overall infection burden5, 26 and drug efficacy24, 26. Because of changes in larval physiology during development, including shrinking of the hindbrain ventricle and increased rigidity of the larval epithelium making penetration of larvae difficult, the optimal time for injection into the hindbrain ventricle is 30 h.p.f., whereas the caudal vein may be injected between 30 and 48 h.p.f.
Figure 2. Microinjection sites.

The hindbrain (HB) ventricle can be injected directly, or injection into the hindbrain may be performed via penetration through the forebrain (FB). The optimal time for hindbrain and forebrain injection is 30 h.p.f. In contrast, the caudal vein (CV) can be injected between 30 and 48 h.p.f.
Hindbrain injections were traditionally performed using a standard microprobe23, which serves as a simple L-shaped prod for pushing and pulling the larva into position. Although the standard microprobe has been in use for several years, its simple design combined with the curved shape of the larval yolk sac, the anatomical structure leveraged for injecting into the hindbrain, makes it difficult to maintain a secure grasp of the larva. Because of this, hindbrain injections were a tedious and error-prone process for even those with a high degree of user skill and hand coordination. To eliminate this difficulty and to increase the speed and efficiency in which hindbrain injections could be performed, a new microprobe titled the VAMP (Vacuum-Assisted MicroProbe) was developed (Fig. 3 and Supplementary Videos 1 and 2).
Figure 3. VAMP.
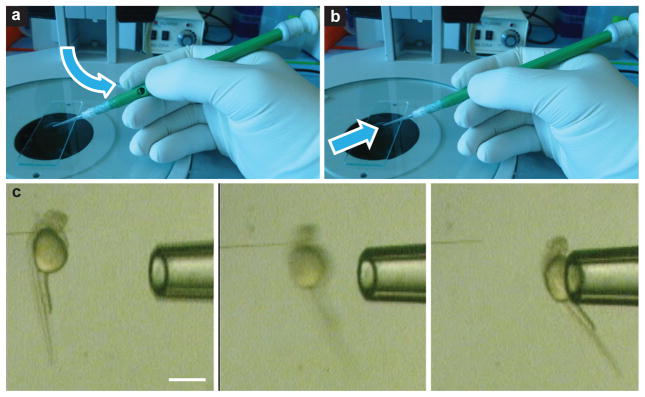
(a–c) Open (a) and closed (b) position of the VAMP is achieved via thumb placement over the side port, and it results in vacuum-assisted grasp of larvae for controlled handling during microinjection (c). Air flow and suction pressure are represented by arrows. Scale bar, 500 μm.
Caudal vein injections have been the standard method for producing systemic infections, which allow for the enumeration of bacteria within individual macrophages7, 25; they also allow for fluorescence-based measurements of overall bacterial burden for comparing virulence between various host6, 27 and bacterial strains5, 7, 26, and for assessing the efficacy of drug and other small-molecule treatment24, 26.
Fluorescence quantification of bacterial burden
Infection burdens have been traditionally determined by enumeration of colony-forming units (c.f.u.) after lysis of infected larvae and plating on 7H10 agar plates23. This method has the following limitations: it allows for only a single, terminal time point for the collection of data; it is not very sensitive, as a large proportion of bacteria are killed by the lysis buffer; and this killing disproportionately affects certain bacterial mutants relative to the wild type. Therefore, we developed two methods for rapid, serial quantification of bacterial burden in live larvae via fluorescence: FPC and APF. For both methods, larvae are transferred to 96-well optical-bottom plates, one larva per well. To reversibly anesthetize the larvae to prevent movement during the imaging process, while avoiding the labor-intensive addition and removal of chemical anesthetics, larval cryo-anesthesia was developed, in which the 96-well plate is incubated on ice24. Cryo-anesthetized larvae are then rapidly imaged using an inverted fluorescence microscope with an automated stage. The resulting images are then quantified for fluorescence by FPC using a custom macro developed for the open-source image analysis software, ImageJ.
APF can be used for a more rapid and facile, albeit less-sensitive readout of bacterial fluorescence. Cryo-anesthesia is not required; the 96-well plate is simply loaded into a fluorescence plate reader and bacterial fluorescence is measured in the far-red channel. In addition, the natural spike in green autofluorescence after larval death can be used as a simultaneous automated readout of larval death. Thus, both efficacy and toxicity of drugs and small molecules can be measured24.
In summary, by combining larval housing, microscopy and fluorescence quantification into a 96-well-plate format, time-consuming and labor-intensive handling steps are eliminated, while also allowing for small, one-time administration of compounds that can affect infection22, 24.
Assessment of individual infection steps
For a more detailed understanding of pathogenesis, macrophage microbicidal capacity can be assessed by enumerating bacteria within individual macrophages by fluorescence microscopy. This capacity is influenced by the host’s ability to kill bacteria and the bacterium’s ability to resist being killed. Therefore, both bacterial and host mutants affect it7, 24, 25, 28.
In addition, because various bacterial and host mutants affect not only the overall bacterial burden but also the ability to form granulomas, the hallmark pathological structure of tuberculosis, quantification of infection focus size6 can be performed; tools for this are included in the FPC software.
Materials
Reagents
-
Zebrafish larvae (30–48 h.p.f.) spawned from adult zebrafish. Adult zebrafish can be obtained from the Zebrafish International Resource Center (http://zebrafish.org). For spawning procedure, see ref. 21
Caution: Experimental procedures must adhere to all relevant governmental and institutional regulations and must be approved by the institution’s animal use committee.
PTU (1-phenyl-2-thiourea; Sigma, cat. no. P7629)
PTU stock solution (Reagent Setup)
Instant Ocean (Marine Depot, cat. no. AS9521)
Fish water (Reagent Setup)
FWPTU (Reagent Setup)
Tricaine (Sigma, cat. no. A504025G)
Tricaine stock solution (Reagent Setup)
FWPTU + tricaine (Reagent Setup)
-
M. marinum carrying the desired plasmid for fluorescent protein expression. Plasmids are available through Addgene (Table 1)
Caution: Because M. marinum is a natural pathogen of fish, all liquids must be disinfected before disposal. Disinfection can be achieved using TBQ at a final concentration of 0.8% (vol/vol), Amphyl or Lysol IC at a final concentration of 1% (vol/vol), bleach at a final concentration of 10% (vol/vol) or by autoclaving. Disinfection of equipment and surfaces can be achieved using 70% (vol/vol) ethanol, 0.004% (vol/vol) NPD (Steris Corporation), 0.8% (vol/vol) TBQ or 1% (vol/vol) Lysol. Infected carcasses should be treated as biohazardous waste and disposed of according to institutional guidelines
Caution: In addition to being a fish pathogen, M. marinum is a biosafety level 2 (BSL-2) organism capable of causing superficial granulomatous skin infections in humans, typically by entry via needle sticks or contact with open wounds29, 30. Safety precautions should be followed according to the US National Institutes of Health guidelines for handling BSL-2 pathogens, including the use of a laboratory coat, gloves and face shield. In the event of accidental exposure, the affected area should be immediately washed and a qualified physician should be consulted.
Oleic acid (Sigma, cat. no. O1008)
Oleic acid, 2.5% (wt/vol), in 0.2 N NaOH
OADC (Reagent Setup)
Tween-80 (Sigma, cat. no. P5188)
Tween-80, 20% (Reagent Setup)
Hygromycin B (Mediatech, cat. no. 30-240-CR)
7H9 Middlebrook broth base (Difco, cat. no. 271310)
7H9OADC and 7H9C (Reagent Setup)
Phenol red (Sigma, cat. no. P5530)
Phenol red stock, 20% (wt/vol) (Reagent Setup)
Fraction V BSA
Glucose
NaCl
dH2O
Glycerol
NaHCO3
Parafilm
PBS
Low-melting-point (LMP) agarose (1%, wt/vol)
Equipment
Tuberculin syringes with 27-gauge needles, 1 ml (VWR Scientific, cat. no. BD305109)
Filter, 5 μm (Pall, cat. no. 28144-095)
Aluminosilicate capillaries, 1 × 0.53 mm outer/inner diameter (Warner Instruments, cat. no. SM100F-10)
Micropipette puller (Sutter Instruments, cat. no. P-2000)
Microinjection needles (EQUIPMENT SETUP)
Microloader Tip (Eppendorf, cat. no. 930001007)
Microinjector system (Eppendorf, Femtojet Express)
Dissecting microscope (Nikon, cat. no. SMZ-800)
Depression slide (VWR Scientific, cat. no. 48324-001)
Jeweler’s no. 5 forceps (VWR Scientific, cat. no. 21909-464)
Microprobe (EQUIPMENT SETUP)
VAMP (EQUIPMENT SETUP)
Pipette pump (Bel-Art Products, cat. no. 378980000)
Wide-bore Pasteur pipette (Kimble Chase, cat. no. 63A53WT)
Micromanipulator (Narishige, cat. no. M-152)
Iron baseplate for micromanipulator (Narishige, IP)
Inverted microscope and fluorescence imaging system (Nikon, Eclipse Ti-E)
Objective, 2× (Nikon, ×2/0.10 Plan Apochromat)
Objective, 20× (Nikon, CFI Plan Fluor)
Objective, 40× (Nikon, CFI Plan Fluor)
Half-area 96-well plates (Greiner, cat. no. 675090)
Wide-bore P1000 pipette tip (EQUIPMENT SETUP)
Microplate reader (Tecan, GENios Pro)
Microplate reader fluorescence filters (TECAN, 485/20-nm and 535/25-nm or 595/10-nm and 650/10-nm filters for green and far-red fluorescence measurements, respectively)
Incubator, 28 °C (Fisher Scientific, Isotemp 11-690-637D)
ImageJ software (http://rsbweb.nih.gov/ij/)
ImageJ FPC macro (Supplementary Methods or ref. 24)
Small Petri plate, 60 × 15 mm (Falcon, cat. no. 351007)
Standard Petri plate, 100 × 15 mm (Falcon, cat. no. 351029)
Ballpoint pen (Papermate, cat. no. 33311)
Spring steel wire (Small Parts, cat. no. SMW-005-18-10)
Micropipette tips (PakRak, cat. no. 53503-816)
Hemocytometer
Glass-bottom plate (Greiner, Cellview)
Reagent Setup
-
OADC
Dissolve 50 g of fraction V BSA, 20 g of glucose and 8.5 g of NaCl in 700 ml of dH2O. Add 20 ml of 2.5% (wt/vol) oleic acid in 0.2 N NaOH. Adjust the volume to 1 liter using dH2O. Filter-sterilize the solution and store it at 4 °C for up to 1 year.
-
Tween-80, 20% (vol/vol)
Add 160 ml of dH2O to a glass beaker. Warm it over a medium heat and slowly add 40 ml of Tween-80 while stirring. After dissolution of Tween-80 (solution may still be yellow), sterilize it by filtration or by autoclaving. Store the solution at room temperature (22 °C) for up to 2 years.
-
7H9OADC and 7H9C
Dissolve 4.7 g of 7H9 broth base in 800 ml of dH2O. Add 4 ml of 50% (vol/vol) glycerol and adjust the final volume to 900 ml using dH2O. Autoclave to sterilize the solution and store it at 22 °C for up to 1 year. For 7H9OADC, add 100 ml of OADC. For 7H9C, add 250 μl of 20% (vol/vol) Tween-80 and 100 μl of 50 mg ml–1 hygromycin B per 100 ml of 7H9OADC. After adding OADC, store it at 4 °C for up to 3 months.
-
Phenol red stock
Dissolve 2 g of phenol red in 10 ml of molecular-grade water. Filter-sterilize the solution. Store phenol red stock at 22 °C for up to 2 years.
-
PTU stock solution (20×)
Dissolve 0.3 g of PTU powder in 500 ml of dH2O using low heat and constant stirring. PTU may take several hours to dissolve. Filter-sterilize the solution and store it up to 1 month at 4 °C.
Caution: This solution is highly toxic and skin sensitizing. Wear appropriate protective clothing and avoid ingestion, inhalation or contact with skin or eyes.
-
Fish water
Dissolve 1 g of Instant Ocean in 1 liter of dH2O. Adjust the pH to 7.0 with 0.5 M NaHCO3. Store at room temperature for up to 3 months.
-
FWPTU
Add 50 ml of PTU stock solution to 1 liter of fish water. Store the solution at 22 °C for up to 2 weeks.
-
Tricaine stock solution
Dissolve 0.4 g of tricaine (3-amino benzoic acid ethyl ester) in 100 ml of dH2O. Adjust the pH to 7.0 with 0.5 M NaHCO3. Store the solution for up to 1 month at 4 °C.
Caution: Tricaine is an irritant. Wear appropriate protective clothing and avoid ingestion, inhalation or contact with skin or eyes.
-
FWPTU + tricaine
Add 630 μl of tricaine stock solution to 10 ml of FWPTU. Discard the solution after use.
Equipment Setup
-
Microinjection needles
Prepare microinjection needles by pulling aluminosilicate capillaries using a Sutter P-2000 micropipette puller with the following settings: Heat = 350, FIL = 4, VEL = 50, DEL = 225, PUL = 150.
-
Microprobe
By using a pair of pliers, remove the tip and ink capillary from a standard ballpoint pen. Cut a 5-cm piece of 0.005-inch-diameter spring steel wire, and then roll 0.5 cm of double-sided tape around the end of the wire and insert the taped end into the tip of the pen. Create a small 90° bend at the tip of the wire using a pair of tweezers. To create a protective case for storage, cut a serological pipette −6 inches from the tip, and then wrap the cut end of the pipette and the end of the probe in tape. For assembly, see http://www.youtube.com/watch?v=gnY-PPGMxN4.
-
VAMP
By using a pair of pliers, remove the tip and ink capillary from a standard ballpoint pen. Drill a 3/16-inch hole 3–5 cm from the tip of the pen. Attach a micropipette tip to the front end and vacuum tubing to the back end. Seal and secure the arrangement by wrapping it with Parafilm. Attach it to vacuum equipped with a biohazard liquid collection flask and use it with minimal suction. For assembly, see http://www.youtube.com/watch?v=bqdaF5forkw.
-
Wide-bore P1000 pipette tip
Cut a standard P1000 pipette tip −0.5 cm from the tip using a razor blade.
-
Microinjection station setup
Set up the micromanipulator station as shown in Supplementary Fig. 1. On the micromanipulator, angle the needle holder downward to −30° from the horizontal plane.
Steps 1 – 16: Single-cell preparation of M. marinum
-
1
Inoculate 10 ml of 7H9C from a 80 °C strain collection in a 50-ml tissue culture flask, and then incubate it at 33 °C for 8–10 d.
Critical step: If multiple bacterial strains are to be compared, they should all be prepared simultaneously by using the same batch of medium.
-
2
Measure the optical density at 600 nm (OD600) and then inoculate 50 ml of 7H9C in a 250-ml tissue culture flask to a final concentration of 0.1 OD600. Incubate the flask at 33 °C for 5–7 d until the OD600 reaches 0.5–1.0.
-
3
Pellet the culture by centrifugation for 15 min at 4,000g at room temperature. Remove the supernatant by decanting or pipetting.
-
4
Resuspend the pellet in 1 ml of 7H9OADC, and then aliquot 200 μl into a 1.5-ml microcentrifuge tube. Transfer further 200 μl aliquots into four additional microcentrifuge tubes.
-
5
By using a 27-gauge tuberculin syringe, aspirate and eject each 200 μl of resuspended bacteria ten times (Supplementary Video 3).
Caution: To prevent injury and self-infection, handle infected needles carefully.
-
6
Add 1 ml of 7H9OADC to each 200-μl aliquot; mix each aliquot by inversion or briefly vortex and then centrifuge it at 100g for 1 min.
-
7
Collect and transfer 1 ml of the supernatant to a 15-ml centrifuge tube.
-
8
Repeat Steps 5–7 with the remaining 200 μl twice more. The final collected syringed culture will be 15 ml.
-
9
Pass 5 ml of processed culture through a sterile 5-μm filter to isolate single-cell bacteria. Repeat this twice more for the remaining 10 ml, by using a new filter for each 5 ml of processed culture.
-
10
Transfer the filtrate to microcentrifuge tubes and then centrifuge the filtrate at 20,000g for 5 min at room temperature. Discard the supernatant.
-
11
Resuspend and combine all pellets in a total volume of 200 μl of 7H9OADC.
-
12
Dilute 1 μl of processed bacteria in 999 μl of dH2O, and then spot 1 μl to a slide and allow it to dry.
-
13
Enumerate the number of fluorescent bacteria by fluorescence microscopy using a ×20 objective. At this dilution, 100 fluorescent bacteria on the slide corresponds to a single-cell preparation of 100 fluorescent bacteria per nl, which will yield an infection dose of ~100 bacteria.
-
14
If necessary, dilute the single-cell preparation with 7H9OADC to the desired final concentration, typically 100–500 fluorescent bacteria per nl. For recommended concentrations, see Table 2.
-
15
Prepare 5-μl aliquots and store them at −80 °C.
Pause point: Frozen aliquots can be stored at −80 °C indefinitely.
-
16
To verify bacterial concentration, thaw and serially dilute a single-cell prep in PBS, and then plate it onto 7H10 for enumeration of c.f.u.
Table 2.
Recommended infection doses for macrophage recruitment (MøR), bacteria per macrophage (BPM), FPC, and APF assays.
| Assay | Site | Volume | Infection Dose | Concentration | Fluor |
|---|---|---|---|---|---|
| MøR | HB | 1–1.5nL | 50–150 CFU | 5×10⁷–1.5×10⁸ | Any |
| BPM | CV | 1–1.5nL | 50–150 CFU | 5×10⁷–1.5×10⁸ | Any |
| FPC | CV | 1–1.5nL | 50–500 CFU | 5×10⁷–5×10⁸ | Any |
| APF | CV | 1–1.5nL | 250–500 CFU | 2.5×10⁸–5×10⁸ | tdKatushka2 |
Steps 17 – 26: Infection of zebrafish larvae via hindbrain or caudal vein injections
-
17
Incubate zebrafish larvae at 28 °C.
-
18
Transfer the larvae to FWPTU between 8 and 24 h.p.f. to prevent pigment formation. Maintain the larvae in the presence of PTU for the duration of the experiment.
-
19
Dechorionate the larvae within 30 h.p.f. by grasping the chorion at two points using a pair of jeweler’s forceps, and then carefully tearing the chorion open.
Critical step: To avoid injuring the larvae, do not allow the forceps or the chorion itself to make contact with the larvae.
-
20
Anesthetize 30–48-h.p.f. larvae by incubation in FWPTU + tricaine for 3 min. Maintain the larvae in anesthetized state until the injection procedure is complete.
-
21
By using a wide-bore Pasteur pipette, transfer 10–20 larvae to a depression slide. By using the microprobe, group the larvae together on the side nearest you.
-
22
Thaw a 5-μl aliquot of single cells and add 0.25 μl of phenol red stock; mix it by gentle flicking.
Critical step: If necessary, dilute the thawed single-cell prep to the desired concentration using 7H9OADC. For recommended concentrations, see Table 2.
-
23
Aspirate the single-cell prep using a microloader tip, and then backfill a microinjection needle. Load the microinjection needle onto the micromanipulator. For micromanipulator setup, see Supplementary Figure 1.
Caution: Handle microinjection needles with caution in order to avoid accidental needle sticks.
-
24
Adjust the microinjection pressure to 250 hPa and the injection time to 0.2 s. Alternatively, injection time can be set to manual, in which case the injection time is controlled by the length of time in which the foot pedal is depressed. Adjust the constant pressure to 10 hPa to ensure a constant positive pressure, thus preventing aspiration of fish water into the microinjection needle.
-
25
Break the microinjection needle close to the tip using jeweler’s forceps (Supplementary Video 4). The tip of the broken needle should be ~10 μm in diameter, and may be blunt, beveled or irregular. Although some users have a preference, all injections can be performed with any type of tip (Supplementary Fig. 2a).
-
26
To proceed with hindbrain injections, follow option A and see Supplementary Videos 1 and 2. To proceed with caudal vein injections, follow option B. Also see Supplementary Video 5.
Troubleshooting
-
Infection of zebrafish larvae via hindbrain injections
-
By using the VAMP, grab each larva by the yolk for injection directly into the hindbrain, or by the tail for injection into the hindbrain via the forebrain.
Critical step: Thumb pressure over the side port is directly related to the degree of occlusion of the port, and thus to suction pressure. Use gentle thumb pressure to avoid excessive suction, which can cause injury to the larva, including yolk rupture and aspiration of the larva entirely.
-
Gently push the larva into the tip of the needle until it just pierces the desired ventricle of the brain.
Critical step: Use caution to avoid overpenetration and injury to the surrounding tissues.
-
Depress the foot pedal to inject.
Critical step: Infection dose is dependent on the concentration of the single-cell prep and the volume injected, whereas the injection volume is dependent on the microinjection needle bore size, injection pressure and time. Because the microinjection needle bore size is variable depending on slight variations in where the needle is broken, injection pressure and time will need to be adjusted to produce the desired injection volume. Typically, injection pressure and time settings range from 250 to 500 hPa and 0.2 to 0.4 s. To control for consistent injection volume from larva to larva, and from experiment to experiment, the visual indicator dye should fill ~50–100% of the hindbrain ventricle. Alternatively, the user may decide to use a larger injection volume that fills both the hindbrain and forebrain ventricles. To adjust the infection dose, users typically adjust the concentration of bacteria in the single-cell prep while keeping the injection volume constant. To verify injection volume, one injection volume can be injected into mineral oil on a hemocytometer and the diameter of the droplet can be measured (Supplementary Fig. 2b). To verify infection dose, spot 100 μl of PBS onto 7H10 and then inject one injection volume into the PBS spot and spread it. Incubate the plate for 8–10 d and then enumerate c.f.u.
After injection, remove the larva from the needle and move it to the far end of the slide.
-
Repeat injection (Step 26A(i–iv)) with up to 30 larvae per needle.
Critical step: Despite maintaining a constant injection volume, the number of c.f.u. per injection can decrease over time. To reduce variance of infection dose, limit the number of injected larvae to 30–100 per needle.
-
When this step is complete, transfer injected larvae to a small Petri plate containing 10 ml of FWPTU without tricaine and resume incubation at 28 °C.
Critical step: An equal number of larvae should be injected with a microinjection needle loaded with 5 μl of 7H9OADC combined with 0.25 μl of phenol red stock as a negative control.
-
-
Infection of zebrafish larvae via caudal vein injections
Raise the needle upward, away from the bottom of the depression slide.
By using the microprobe, position the larva so that the caudal vein region is directly below the tip of the needle.
Lower the needle until it makes contact with the caudal vein region of the larva. When contact is made, the larva will rotate slightly along its dorsoventral axis.
Gently push the larva into the tip of needle until it just pierces the caudal vein region.
-
Depress the foot pedal to inject.
Critical step: To control for injection volume, the visual indicator dye should fill the caudal vein without extending into the yolk circulation valley or heart. This caudal vein microinjection corresponds with an injection volume of approximately 1–1.5 nl. If necessary, adjust the injection pressure and time to produce the proper injection volume. For more information on adjusting injection parameters, see Step 26A(iii).
After injection, remove the larva from the needle and place it at the far end of the slide.
-
Repeat the injection (Step 26B(i–vi)) with 30–100 larvae per needle.
Critical step: Despite maintaining a constant injection volume, the number of c.f.u. per injection can decrease over time. To reduce variance of infection dose, limit the number of injected larvae to 30–100 per needle.
When injections are complete, transfer the injected larvae to a small Petri plate containing 10 ml of FWPTU without tricaine and resume incubation at 28 °C.
-
Step 27: Analysis of infection
Although many methods of analyzing infected larvae can be performed, the following options outline three common methods for analysis: the macrophage recruitment assay (option A); enumeration of bacteria per macrophage (option B); and analysis of overall bacterial burden via fluorescence microscopy (option C) and APF (option D).
Critical step: Option A can only be used after hindbrain injection.
-
Macrophage recruitment assay
Anesthetize the hindbrain-infected larvae at 3–6 hours post infection (h.p.i.) in FWPTU + tricaine and then mount them in 1% (wt/vol) LMP agarose on a 0.17-mm glass-bottom plate. For more detailed information on the mounting procedure, see ref. 21.
By using either an ×20 or ×40 objective and a DIC filter, slowly scan through the z axis of the hindbrain region, counting the number of macrophages observed (Fig. 4a,b and Supplementary Video 6). Macrophage morphology is observed as round or irregular, sometimes with pseudopodia. Although different types of phagocytes can be distinguished by the use of fluorescently labeled transgenic larvae, or by in situ or antibody staining of fixed larvae, we find that DIC microscopy is sufficient for the enumeration of macrophages, as we have not observed other cell types within the hindbrain within 36 h.p.f. in response to mycobacterial infection.
-
Bacteria per macrophage via fluorescence microscopy
Anesthetize the larvae at 2–5 days after infection in FWPTU + tricaine and then transfer them to a 0.17-mm glass-bottom plate. To avoid counting bias, blind groups.
By using either an ×20 or ×40 objective, scan the region between the yolk extension and the tip of the tail (Fig. 4c), counting the number of fluorescent bacteria per macrophage. Because M. marinum growth in vivo occurs as long filaments, accurate enumeration is only possible at earlier time points, when the number of bacteria per macrophage remain in the range of 1–4. When the number of bacteria per macrophage exceeds 4, macrophage infection burden is classified as <5, 5–10 or >10 bacteria per macrophage. An intracellular counting scale can be seen in Figure 4d,e.
-
Quantification of bacterial burden via fluorescence microscopy
Prepare a half-area 96-well plate by pipetting 100 μl of dH2O to the interwell space using a multichannel pipette. The addition of dH2O to the interwell space reduces evaporation within wells, and also increases the thermal mass to lengthen the duration in which larvae remain cryo-anesthetized.
Transfer larvae to the prepared 96-well plate, one larva per well, each in 200 μl of FWPTU (without tricaine) using a wide-bore P1000 pipette tip. Include 3–5 uninfected larvae for threshold determination during image analysis. If compound testing is desired, 2 μl of compound in dH2O or 100% DMSO can be added to each well, followed by transferring the larva in 198 μl of FWPTU. Alternatively, drug-containing FWPTU can be prepared first, and larvae can be added to it and then transferred to each well in 200 μl of FWPTU containing the drug.
-
Cryo-anesthetize the larvae by incubating them on ice for 10 min.
Critical step: Larvae must be thoroughly cryo-anesthetized to ensure that the larvae remain immobile during the imaging procedure.
-
Image each well via inverted ×2 fluorescence microscopy.
Critical step: Imaging should be performed on an inverted microscope fitted with an automated stage calibrated to rapidly image each well. If imaging is performed at room temperature, the entire plate should be imaged within 10 min to ensure that larvae remain cryo-anesthetized.
After imaging is complete, return the larval plate to 28 °C. Larvae can be kept for up to 14 d, with microscopy repeated daily, as desired.
Before image analysis, view each image for quality control.
For quantification of infection burden via image analysis, open the ImageJ software. For a visual walkthrough of the image analysis procedure, see http://www.youtube.com/watch?v=7jbeHp5yBl4.
Within ImageJ, open 1–5 images of uninfected larvae taken during the desired experiment.
-
To determine the required threshold for image analysis, press CTRL+SHIFT+T and then move the bottom slider in the threshold window to the right until the image becomes completely black. Record the corresponding value. (Note that the top slider should be at zero.) Close the control image and threshold window.
Critical step: Images must be in an 8-bit grayscale tiff format.
Go to Plugins → Macros → Run
Open the ImageJ FPC macro (Supplementary Methods).
Follow the prompts: locate the folder of images to be measured and then enter the threshold as previously determined. Hit ‘OK’ to perform FPC analysis.
Copy and paste the data from the summary window to Excel, Prism or the desired software for data analysis. The first, third and fourth columns, ‘Slice’, ‘Total Area’ and ‘Average Size’, correspond with the image name, FPC value and average infection focus size for each individual larva.
-
Quantification of bacterial burden via automated plate fluorimetry
Transfer the larvae to 96-well plates, one larva per well, each in 200 μl of FWPTU (without tricaine), by using a wide-bore P1000 pipette tip. Include three to five uninfected larvae, which will be used to provide a baseline reading for normalization.
Transfer the plate to a fluorescence plate reader and measure far-red fluorescence using a 12-point 4 × 4 beam pattern to maximize the measured surface area per well. For appropriate fluorescence filters, see EQUIPMENT.
-
If survival data are desired, measure green autofluorescence. Larvae with relative fluorescent unit (r.f.u.) readings above 3,000 are scored as dead.
Critical step: The optimal threshold may vary on different fluorescence plate readers, and should initially be experimentally determined by comparing green autofluorescence and mortality for 10–20 larvae daily for 14 d. Mortality is assessed by the absence of a heartbeat by stereomicroscopy. We have found that an experimentally determined optimal threshold of 3,000 consistently predicts mortality from experiment to experiment.
After APF, return the larval plate to 28 °C. The larval plate can be incubated at 28 °C for up to 14 d, with APF repeated daily as desired.
Figure 4. Experimental results.

(a) DIC image of the hindbrain ventricle 6 hours after infection showing four recruited macrophages (arrowheads). Scale bar, 100 μm. Additional macrophages are visible within additional z planes, requiring scanning through the hindbrain ventricle. (b) Comparison of the number of macrophages recruited per hindbrain in wild-type (WT) and mock-injected larvae. (c) Scoring region for enumeration of bacteria per macrophage, starting at the urogenital opening and ending at the tip of the tail. Scale bar, 300 μm. (d, e) Because M. marinum grows as long filaments within macrophages, a rough counting scale is required in which each infected macrophage is classified as containing <5, 5–10 or >10 bacteria (d); however, at earlier time points when the number of bacteria per macrophage remains <5 (e), more precise enumeration is possible. Scale bar, 10 μm. (f) Enumeration of bacteria per macrophage at 3 days after infection, comparing WT bacteria with the intracellular growth–defective Δerp mutant. n = 10 larvae per group. (g, h) Larvae at 5 days after infection with WT bacteria and the virulence-attenuated Δerp mutant show a marked reduction of infection level in images and with fluorescence image quantification of infection by FPC. Scale bar, 300 μm. ***P < 0.0001. (i) Serial quantification of infection level by automated plate fluorimetry comparing untreated (UNT) larvae with those treated with 400 μM isoniazid (INH), ethambutol (EMB), moxifloxacin (MOX) or rifampicin (RIF). Error bars show s.e.m.; n = 12. (j) Detailed analysis at 4 days after treatment, the last time point before any death has occurred, allows for the best resolution between treatment groups. (k) Survival data generated by APF measurement of green autofluorescence provide additional information regarding drug efficacy.
? TROUBLESHOOTING
Troubleshooting advice can be found in Table 3.
TABLE 3.
Troubleshooting table.
| Step | Problem | Possible Reason | Solution |
|---|---|---|---|
| 26 | Infection dose is too variable | Injection volume is inconsistent Infection dose has diminished over time |
Pay critical attention to the visual indicator to ensure that injection volume is consistent for each injected larva Do not exceed 100 larvae or 1 hour of injection per needle |
| 26 | Infection dose is too high or low | Injection volume is too high or low Bacterial concentration of single-cell prep is too high Bacterial concentration of single-cell prep is too low |
Use the visual indicator to ensure appropriate injection volume Dilute single-cell prep using 7H9OADC to reduce bacterial concentration Repeat single-cell preparation, ensuring that final concentration is between 100–500 FB/nL |
| 27C | Image has blurred artifact following cryo-anesthesia | Condensation has formed on the bottom of optical-bottom plate Condensation has formed due to high humidity and temperature |
Wipe the bottom of the plate with an anti-fog solution consisting of 1:1 dishsoap and water Adjust climate control to ensure an imaging room of low humidity and temperature |
| 27C | Cryo-anesthesia wears off prematurely | Cryo-anesthesia was incomplete Larvae have returned to 22°C Room temperature exceeds 22°C |
Incubate plate with the lid on, buried in ice to ensure complete cryo-anesthesia Reincubate larvae on ice for an additional 5–10 minutes and then image remaining wells Adjust climate control to ensure that room temperature does not exceed 22°C |
| 27C | Fluorescence outside of larva | Image contains autofluorescent debris which was present on bottom of plate Bacteria were shed from infected larva |
In an image editing program, black out any autofluorescent debris The amount of shed bacteria tends to be proportional to infection level; they may be blacked out if desired, or included for image analysis |
TIMING
Steps 1–16, single-cell preparation of M. marinum: 6 h
Step 17, spawning of adult zebrafish: 2 h
Steps 18–26, infection of zebrafish larvae: 4 h
Step 27, analysis of infection: 4 h
Anticipated results
Single-cell preparation from 50 ml of culture of M. marinum is typically sufficient to yield 100–200 aliquots of 5 × 10⁷ to 5 × 10⁸ c.f.u. ml−1. However, in some cases the yield is lower, requiring a compromise in either final concentration or the number of aliquots. Microinjection of M. marinum into the hindbrain ventricle results in a marked recruitment of macrophages within 6 h.p.i. (Fig. 4a, b), as compared with mock larvae injected with medium lacking bacteria. Caudal vein injections with both the wild-type and the virulence-attenuated Δerp mutant M. marinum produce systemic infections in which the attenuation can be quantified either as a reduction of intracellular bacterial burden per macrophage (Fig. 4f) or as an overall reduction of infection level as determined by fluorescence microscopy and FPC of images (Fig. 4g, h). Figure 4i–k shows results from compound screening performed with wild type–infected larvae housed in 96-well plates in the presence of 400 μM antibiotic. Infection level can be quantified daily by APF (Fig. 4i); the optimal time point for comparison as late as possible but before larval death is 4 days after treatment for this experiment (Fig. 4j). Survival data can be generated from green autofluorescence, and it is complementary to infection level (Fig. 4k). For confirmation of survival status, the presence or absence of a heartbeat can be determined by microscopy.
Supplementary Material
General setup of microinjection station and micromanipulator. (a) Safe and efficient injection of larval zebrafish is achieved with a well-designed injection station. (b) The micromanipulator should be setup at right angles, with each knob giving exclusive control to x, y, and z-planes, and with the needle angled downwards to approximately 30°. After the initial setup, and during injections, the micromanipulator will only be moved in the z-plane by control of the z-knob (red arrow).
Microinjection Metrics (a) High resolution image of microinjection needle. Outer diameter of needle tip is approximately 10 μm. Note that the point of the needle may be beveled, blunt or irregular. Although some users prefer one type over another, microinjection can be performed with all types of needle points. Scale bar 50 μm. (b) Microinjection into mineral oil corresponding with caudal vein and hindbrain microinjection volumes. Microinjection diameters average at 139 nm with a calculated volume of 1.4 nL. Scale bar 200 μm.
ImageJ FPC Macro
Supplementary Video 1 (Hindbrain injections)
Supplementary Video 2 (Hindbrain injections via the forebrain)
Supplementary Video 3 (Syringing bacteria)
Supplementary Video 4 (Needle break)
Supplementary Video 5 (Caudal vein injection)
Supplementary Video 6 (Macrophage recruitment)
Acknowledgments
We thank F. Roca for images of intracellular bacteria and larval illustrations; C.J. Cambier for macrophage recruitment images and movies; and C. Cosma, M. Troll, D. Berry, D. Tobin, J. Cameron and R. Berg for helpful discussion and protocol development.
Footnotes
Contributions
J.M.D. developed the caudal vein injection technique and macrophage recruitment assay. K.T. conceived and developed the single-cell protocol, VAMP, cryo-anesthesia, high-throughput microscopy and the autofluorescence-based survival assay. K.T. developed the fluorescence constructs and APF. K.T. performed the experiments and tutorial videos. K.W. developed FPC. L.R. conceived the larval infection model and FPC and guided the development of all protocols. K.T. and L.R. wrote the manuscript.
Competing financial interests
The authors declare no competing financial interests.
Contributor Information
Kevin Takaki, Department of Microbiology, University of Washington, Seattle, Washington, USA.
J Muse Davis, Department of Microbiology, University of Washington, Seattle, Washington, USA.
Kathryn Winglee, Department of Microbiology, University of Washington, Seattle, Washington, USA.
Lalita Ramakrishnan, Department of Microbiology, University of Washington, Seattle, Washington, USA, Department of Medicine, University of Washington, Seattle, Washington, USA, Department of Immunology, University of Washington, Seattle, Washington, USA.
References
- 1.Ramakrishnan L. Revisiting the role of the granuloma in tuberculosis. Nat Rev Immunol. 2012;12:352–366. doi: 10.1038/nri3211. [DOI] [PubMed] [Google Scholar]
- 2.Davis JM, et al. Real-time visualization of mycobacterium-macrophage interactions leading to initiation of granuloma formation in zebrafish embryos. Immunity. 2002;17:693–702. doi: 10.1016/s1074-7613(02)00475-2. [DOI] [PubMed] [Google Scholar]
- 3.Clay H, et al. Dichotomous role of the macrophage in early Mycobacterium marinum infection of the zebrafish. Cell Host Microbe. 2007;2:29–39. doi: 10.1016/j.chom.2007.06.004. [DOI] [PMC free article] [PubMed] [Google Scholar]
- 4.Davis JM, Ramakrishnan L. The role of the granuloma in expansion and dissemination of early tuberculous infection. Cell. 2009;136:37–49. doi: 10.1016/j.cell.2008.11.014. [DOI] [PMC free article] [PubMed] [Google Scholar]
- 5.Volkman HE, et al. Tuberculous granuloma formation is enhanced by a mycobacterium virulence determinant. PLoS Biol. 2004;2:e367. doi: 10.1371/journal.pbio.0020367. [DOI] [PMC free article] [PubMed] [Google Scholar]
- 6.Volkman HE, et al. Tuberculous granuloma induction via interaction of a bacterial secreted protein with host epithelium. Science. 2010;327:466–469. doi: 10.1126/science.1179663. [DOI] [PMC free article] [PubMed] [Google Scholar]
- 7.Cosma CL, Klein K, Kim R, Beery D, Ramakrishnan L. Mycobacterium marinum Erp is a virulence determinant required for cell wall integrity and intracellular survival. Infect Immun. 2006;74:3125–3133. doi: 10.1128/IAI.02061-05. [DOI] [PMC free article] [PubMed] [Google Scholar]
- 8.Herbomel P, Thisse B, Thisse C. Ontogeny and behaviour of early macrophages in the zebrafish embryo. Development. 1999;126:3735–3745. doi: 10.1242/dev.126.17.3735. [DOI] [PubMed] [Google Scholar]
- 9.Yang CT, et al. Neutrophils exert protection in the early tuberculous granuloma by oxidative killing of mycobacteria phagocytosed from infected macrophages. Cell Host Microbe. 2012;12:301–312. doi: 10.1016/j.chom.2012.07.009. [DOI] [PMC free article] [PubMed] [Google Scholar]
- 10.Brannon MK, et al. Pseudomonas aeruginosa Type III secretion system interacts with phagocytes to modulate systemic infection of zebrafish embryos. Cell Microbiol. 2009;11:755–768. doi: 10.1111/j.1462-5822.2009.01288.x. [DOI] [PMC free article] [PubMed] [Google Scholar]
- 11.Neely MN, Pfeifer JD, Caparon M. Streptococcus-zebrafish model of bacterial pathogenesis. Infect Immun. 2002;70:3904–3914. doi: 10.1128/IAI.70.7.3904-3914.2002. [DOI] [PMC free article] [PubMed] [Google Scholar]
- 12.Ludwig M, et al. Whole-body analysis of a viral infection: vascular endothelium is a primary target of infectious hematopoietic necrosis virus in zebrafish larvae. PLoS Pathog. 2011;7:e1001269. doi: 10.1371/journal.ppat.1001269. [DOI] [PMC free article] [PubMed] [Google Scholar]
- 13.Phelan PE, et al. Characterization of snakehead rhabdovirus infection in zebrafish (Danio rerio) J Virol. 2005;79:1842–1852. doi: 10.1128/JVI.79.3.1842-1852.2005. [DOI] [PMC free article] [PubMed] [Google Scholar]
- 14.Lu MW, et al. The interferon response is involved in nervous necrosis virus acute and persistent infection in zebrafish infection model. Mol Immunol. 2008;45:1146–1152. doi: 10.1016/j.molimm.2007.07.018. [DOI] [PubMed] [Google Scholar]
- 15.Chao CC, et al. Zebrafish as a model host for Candida albicans infection. Infect Immun. 2010;78:2512–2521. doi: 10.1128/IAI.01293-09. [DOI] [PMC free article] [PubMed] [Google Scholar]
- 16.Burgos JS, Ripoll-Gomez J, Alfaro JM, Sastre I, Valdivieso F. Zebrafish as a new model for herpes simplex virus type 1 infection. Zebrafish. 2008;5:323–333. doi: 10.1089/zeb.2008.0552. [DOI] [PubMed] [Google Scholar]
- 17.Davis JM, Haake DA, Ramakrishnan L. Leptospira interrogans stably infects zebrafish embryos, altering phagocyte behavior and homing to specific tissues. PLoS Negl Trop Dis. 2009;3:e463. doi: 10.1371/journal.pntd.0000463. [DOI] [PMC free article] [PubMed] [Google Scholar]
- 18.Pham LN, Kanther M, Semova I, Rawls JF. Methods for generating and colonizing gnotobiotic zebrafish. Nat Protoc. 2008;3:1862–1875. doi: 10.1038/nprot.2008.186. [DOI] [PMC free article] [PubMed] [Google Scholar]
- 19.Haldi M, Ton C, Seng WL, McGrath P. Human melanoma cells transplanted into zebrafish proliferate, migrate, produce melanin, form masses and stimulate angiogenesis in zebrafish. Angiogenesis. 2006;9:139–151. doi: 10.1007/s10456-006-9040-2. [DOI] [PubMed] [Google Scholar]
- 20.Eguiara A, et al. Xenografts in zebrafish embryos as a rapid functional assay for breast cancer stem-like cell identification. Cell Cycle. 2011;10:3751–3757. doi: 10.4161/cc.10.21.17921. [DOI] [PubMed] [Google Scholar]
- 21.Westerfield M. The Zebrafish Book: A Guide for the Laboratory Use of Zebrafish (Danio rerio) 4. University of Oregon Press; 2000. [Google Scholar]
- 22.Ellett F, Pase L, Hayman JW, Andrianopoulos A, Lieschke GJ. mpeg1 promoter transgenes direct macrophage-lineage expression in zebrafish. Blood. 2011;117:e49–56. doi: 10.1182/blood-2010-10-314120. [DOI] [PMC free article] [PubMed] [Google Scholar]
- 23.Cosma CL, Swaim LE, Volkman H, Ramakrishnan L, Davis JM. Zebrafish and frog models of Mycobacterium marinum infection. Curr Protoc Microbiol. 2006;3:10B.2.1–10B.2.33. doi: 10.1002/0471729256.mc10b02s3. [DOI] [PubMed] [Google Scholar]
- 24.Takaki K, Cosma CL, Troll MA, Ramakrishnan L. An in vivo platform for rapid high-throughput antitubercular drug discovery. Cell Rep. 2012;2:175–184. doi: 10.1016/j.celrep.2012.06.008. [DOI] [PMC free article] [PubMed] [Google Scholar]
- 25.Tobin DM, et al. Host genotype-specific therapies can optimize the inflammatory response to mycobacterial infections. Cell. 2012;148:434–446. doi: 10.1016/j.cell.2011.12.023. [DOI] [PMC free article] [PubMed] [Google Scholar]
- 26.Adams KN, et al. Drug tolerance in replicating mycobacteria mediated by a macrophage-induced efflux mechanism. Cell. 2011;145:39–53. doi: 10.1016/j.cell.2011.02.022. [DOI] [PMC free article] [PubMed] [Google Scholar]
- 27.Tobin DM, et al. The lta4h locus modulates susceptibility to mycobacterial infection in zebrafish and humans. Cell. 2010;140:717–730. doi: 10.1016/j.cell.2010.02.013. [DOI] [PMC free article] [PubMed] [Google Scholar]
- 28.Clay H, Volkman HE, Ramakrishnan L. Tumor necrosis factor signaling mediates resistance to mycobacteria by inhibiting bacterial growth and macrophage death. Immunity. 2008;29:283–294. doi: 10.1016/j.immuni.2008.06.011. [DOI] [PMC free article] [PubMed] [Google Scholar]
- 29.Wolinsky E. Nontuberculous mycobacteria and associated diseases. Am Rev Respir Dis. 1979;119:107–159. doi: 10.1164/arrd.1979.119.1.107. [DOI] [PubMed] [Google Scholar]
- 30.Ramakrishnan L. Images in clinical medicine. Mycobacterium marinum infection of the hand. N Engl J Med. 1997;337:612. doi: 10.1056/NEJM199708283370906. [DOI] [PubMed] [Google Scholar]
Associated Data
This section collects any data citations, data availability statements, or supplementary materials included in this article.
Supplementary Materials
General setup of microinjection station and micromanipulator. (a) Safe and efficient injection of larval zebrafish is achieved with a well-designed injection station. (b) The micromanipulator should be setup at right angles, with each knob giving exclusive control to x, y, and z-planes, and with the needle angled downwards to approximately 30°. After the initial setup, and during injections, the micromanipulator will only be moved in the z-plane by control of the z-knob (red arrow).
Microinjection Metrics (a) High resolution image of microinjection needle. Outer diameter of needle tip is approximately 10 μm. Note that the point of the needle may be beveled, blunt or irregular. Although some users prefer one type over another, microinjection can be performed with all types of needle points. Scale bar 50 μm. (b) Microinjection into mineral oil corresponding with caudal vein and hindbrain microinjection volumes. Microinjection diameters average at 139 nm with a calculated volume of 1.4 nL. Scale bar 200 μm.
ImageJ FPC Macro
Supplementary Video 1 (Hindbrain injections)
Supplementary Video 2 (Hindbrain injections via the forebrain)
Supplementary Video 3 (Syringing bacteria)
Supplementary Video 4 (Needle break)
Supplementary Video 5 (Caudal vein injection)
Supplementary Video 6 (Macrophage recruitment)