

Abstract
Background
Worldwide clinical practice guidelines for dyslipidemia emphasize allocating statin therapy to those at the highest absolute atherosclerotic cardiovascular disease (CVD) risk.
Methods and Results
We examined 5,534 MESA participants who were not on baseline medications for dyslipidemia. Participants were classified by baseline CAC score (>0, ≥100) and the common clinical scheme of counting lipid abnormalities (LA), including LDL-C ≥3.36 mmol/L (130 mg/dL), HDL-C <1.03 mmol/L (40 mg/dL) for men or <1.29 mmol/L (50 mg/dL) for women, and triglycerides ≥1.69 mmol/L (150 mg/dL). Our main outcome measure was incident CVD (myocardial infarction, angina resulting in revascularization, resuscitated cardiac arrest, stroke, cardiovascular death). Over a median follow-up of 7.6 years, more than half of events (55%) occurred in the 21% of participants with CAC≥100. Conversely, 65% of events occurred in participants with zero or one LA. In those with CAC≥100, CVD rates ranged from 22.2 to 29.2 per 1,000 person-years across LA categories. In contrast, with CAC=0, CVD rates ranged from 2.4 to 6.2 per 1,000 person-years across LA categories. Individuals with zero LA and CAC≥100 had a higher event rate compared to individuals with three LA but CAC=0 (22.2 vs 6.2 per 1,000 person-years). Similar results were obtained when classifying LA using dataset-quartiles of TC/HDL-C, LDL-C, non-HDL-C, or LDL particle concentration and guideline-categories of LDL-C or non-HDL-C.
Conclusions
CAC may have the potential to help match statin therapy to absolute CVD risk. Across the spectrum of dyslipidemia, event rates similar to secondary prevention populations were observed for patients with CAC≥100.
Keywords: Atherosclerosis, Cardiovascular disease risk factors, Cholesterol, Computed tomography
International clinical practice guidelines on dyslipidemia emphasize the importance of matching the use and intensity of statin therapy with the absolute risk of atherosclerotic cardiovascular disease (CVD).1–4 Indeed, independent of the baseline level of dyslipidemia, patients who have entered the intervention arms of randomized clinical trials of statin therapy with similar absolute risks of CVD, and achieved similar absolute LDL-C reductions, have benefitted similarly from therapy.5 The continued refinement of absolute risk assessment in clinical practice is an area of intense interest.
Coronary artery calcium (CAC), a noninvasive measure of subclinical coronary atherosclerosis, adds incremental absolute risk information to traditional risk factors,6–9 is particularly discriminatory in intermediate-risk individuals,8,9 and appears superior to other novel risk markers.9 Accordingly, current guidelines assign a Class IIa recommendation for CAC measurement in asymptomatic intermediate-risk patients (10–20% 10-year risk), and Class IIb recommendation in low- to intermediate-risk patients (6–10% 10-year risk).10 However, CAC measurement is not currently incorporated into treatment algorithms in dyslipidemia guidelines in the United States or abroad.1–4
In considering its potential role in such algorithms, the question arises: how well does CAC stratify risk across dyslipidemia categories? Therefore, we sought to evaluate the interplay between CAC and dyslipidemia in relation to CVD outcomes in the Multi-Ethnic Study of Atherosclerosis (MESA). We hypothesized that 1) many subjects with dyslipidemia would have no CAC and vice versa, and that 2) CAC would consistently stratify CVD risk across categories of dyslipidemia.
METHODS
Study participants
Details on the MESA study’s prospective design and organization are available in previous reports.6,11 From July 2000 to September 2002, 6,814 adults from the general community were enrolled at six field centers in the United States (Baltimore, Maryland; Chicago, Illinois; Forsyth County, North Carolina; Los Angeles, California; New York, New York; and St. Paul, Minnesota). Participants were aged 45–84 years at enrollment, free of clinical CVD, and identified themselves as white, black, Hispanic, or Chinese. The study was approved by the Institutional Review Boards at each site and all participants provided written informed consent.
For the purposes of the present study, 1,194 participants (18%) who were on baseline dyslipidemia medications were excluded (figure 1). Dyslipidemia medications were statins, niacin, fibrates, ezetimibe, bile acid sequestrants, or fish oil. Of the remaining 5,620 participants, 86 had missing lipid data and were excluded. The resulting study population consisted of 5,534 MESA participants.
Figure 1.

Flowchart illustrating study population. MESA = Multi-Ethnic Study of Atherosclerosis.
CAC measurements
Details on the MESA study’s methods for computed tomography scanning and interpretation have been published.12 At baseline, each center performed CAC scanning with either a cardiac-gated electron-beam CT scanner (Chicago, Los Angeles, New York) or multidetector CT system (Baltimore, Forsyth County, St. Paul) by a standardized protocol using calcium phantoms to facilitate image calibration. Patients were scanned twice and images were interpreted at the MESA CT reading center (Los Angeles Biomedical Research Institute at Harbor–University of California Los Angeles Medical Center, Torrance, CA).
The CAC score was determined by the Agatston method13 and the mean of the two scores was used in all analyses. Intraobserver and interobserver agreements were high (kappa, 0.93 and 0.90, respectively).6 Participants were told either that they had no coronary calcification or that the amount was less than average, average, or greater than average and that they should discuss the results with their physicians.
Lipid measurements
At baseline, total cholesterol, high-density lipoprotein cholesterol (HDL-C), and triglyceride measurements were performed at the Collaborative Studies Clinical Laboratory at Fairview-University Medical Center (Minneapolis, MN) in blood samples obtained after a 12 hour fast. Total cholesterol was measured from plasma using a cholesterol oxidase method (Roche Diagnostics, Indianapolis, IN) on a Roche COBAS FARA centrifugal analyzer. The laboratory coefficient of variance (CV) was 1.6%. HDL-C was measured in EDTA plasma using the cholesterol oxidase method (Roche Diagnostics, Indianapolis, IN) after precipitation of non-HDL-C with magnesium/dextran (CV 2.9%). Triglycerides were measured in EDTA plasma using Triglyceride GB reagent (Roche Diagnostics, Indianapolis, IN) on a Roche COBAS FARA centrifugal analyzer (CV 4.0%).
Low-density lipoprotein cholesterol (LDL-C) was estimated by the Friedewald equation if triglycerides were <4.52 mmol/L (400 mg/dL).14 Non-HDL-C was calculated as total cholesterol minus HDL-C. LDL particle number was measured by Nuclear Magnetic Resonance (NMR) spectroscopy using the commercially available LipoProfile-II spectral analysis process (LipoScience, Raleigh, NC) (CV <4%).
Non-lipid risk factors
At baseline, resting blood pressure was measured 3 times using a Dinamap Pro 1000 automated oscillometric sphygmomanometer (Critikon); the mean of the last 2 readings was used. Hypertension was defined by JNC 6 criteria or history of anti-hypertensive therapy. Diabetes mellitus was defined as either the presence of a fasting plasma glucose level ≥7.00 mmol/L (126 mg/dL) or a history of treatment with diabetes medications. Participants were categorized as current cigarette smokers, former smokers, or persons who had never smoked based on self-report. A family history of CHD was considered present if any immediate family member had suffered a myocardial infarction or undergone coronary revascularization. Socioeconomic status was defined by level of education.
Ascertainment of Incident CVD
Every 9–12 months, through May 2011, trained personnel called to inquire about hospital admissions, outpatient diagnoses of cardiovascular disease, or deaths. Follow-up telephone interviews were completed in 92% of living participants. Medical records were obtained for 98% of hospital admissions and 95% of outpatient diagnoses. For reported out of hospital deaths, the next of kin were interviewed and copies of death certificates were requested. CVD events were adjudicated by a MESA study committee of cardiologists, physician epidemiologists, and neurologists.
Our main outcome measure is CVD because it is the focus of the latest prevention guidelines and because statin therapy reduces the risk of both coronary and cerebrovascular events.3–5,15–17 CVD events included myocardial infarction, angina resulting in revascularization, resuscitated cardiac arrest, stroke, or cardiovascular death. Because knowledge of the CAC score might have affected the ascertainment and management of angina resulting in revascularization, we conducted a sensitivity analysis of ‘hard CVD” events in which we excluded angina resulting in revascularization. Additional details on follow-up methods and event adjudication are available on the MESA web site (http://www.mesa-nhlbi.org).
Statistical analysis
The CAC score was examined as a binary variable (presence or absence) and as a categorical variable (0, 1–99, ≥100).18 Participants were classified as having zero, one, two, or three lipid abnormalities (LA; a categorical variable), including LDL-C ≥3.36 mmol/L (130 mg/dL), HDL-C <1.03 mmol/L (40 mg/dL) for men or <1.29 mmol/L (50 mg/dL) for women, and triglycerides ≥1.69 mmol/L (150 mg/dL). We judged that this scheme of counting abnormalities in core lipid measures, which are each associated with CVD risk,19 reflects the way that many clinicians and patients think about an increasing burden of dyslipidemia from a clinical standpoint. We prioritized this scheme in analyses given its simplicity and conceptual similarity to risk factor counting, as used in clinical practice guidelines.1,2 In parallel with these analyses, we present results in which dyslipidemia in classified by TC/HDL-C quartiles.
Baseline characteristics were analyzed by number of LA. We calculated proportions for categorical variables and mean ± standards deviation continuous variables. Chi-square tests (for categorical variables) and analysis-of-variance tests (for continuous variables) were used to compare characteristics across LA categories. Framingham Risk Score was calculated based on the National Cholesterol Education Program Adult Treatment Panel III Guideline.1,2 We used an unadjusted Kaplan-Meier failure function to describe the occurrence of CVD events over time across strata of CAC and LA or TC/HDL-C quartiles. Next, we compared absolute CVD event rates and Cox multivariable-adjusted hazard ratios for CAC categories by LA or TC/HDL-C quartiles. There were no violations of the proportional hazards assumption by Schoenfeld residuals.
We performed hierarchical multivariable modeling in which Model one was unadjusted, Model two was adjusted for age, sex, ethnicity, education, and MESA site, and Model three was adjusted for Model two variables, plus hypertension, diabetes mellitus, smoking, body mass index, and family history. We tested for interaction between dyslipidemia and CAC, dyslipidemia and sex, and dyslipidemia and ethnicity.
We further examined CVD event rates by CAC and guideline categories of LDL-C or non-HDL-C and dataset quartiles of LDL-C (Friedewald), non-HDL-C, or LDL particle concentration. We also conducted three sensitivity analyses of the multivariable Cox model: 1) adding adjustment dyslipidemia medication initiation during follow-up; 2) excluding those initiating dyslipidemia medications during follow-up; and 3) including those taking dyslipidemia medications at any time.
All analyses were performed with Stata software version 11.0 (StataCorp, College Station, Texas). We considered a two-tailed p value of <0.05 nominally significant. This data analysis plan was peer reviewed and approved by the MESA Publications & Presentations committee. A complete copy of the a priori statistical analysis plan (SAP)20 is available upon request.
RESULTS
Study population by LA
Table 1 shows baseline characteristics of the study cohort by LA burden. There were 1,975 (36%) participants with zero LA, 2,021 (37%) with one LA, 1,208 (22%) with two LA, and 330 (6%) with three LA. Age was modestly lower in participants with three LA (60.3±10.0) compared to those with zero LA (62.0±10.7). The burden of multiple other CVD risk factors, and the Framingham Risk Score, generally increased as the number of LA increased.
Table 1.
Baseline characteristics by dyslipidemia category
| Number of Lipid Abnormalities | |||||
|---|---|---|---|---|---|
|
| |||||
| 0 N=1,975 |
1 N=2,021 |
2 N=1,208 |
3 N=330 |
p value | |
|
| |||||
| Age (years) | 62.0 (10.7) | 61.3 (10.1) | 61.1 (10.1) | 60.3 (10.0) | 0.01 |
|
| |||||
| Female | 1,067 (54.0%) | 1,076 (53.2%) | 598 (49.5%) | 189 (57.3%) | 0.03 |
|
| |||||
| Ethnicity | |||||
| White | 781 (39.5%) | 752 (37.2%) | 410 (33.9%) | 140 (42.4%) | |
| Chinese | 235 (11.9%) | 229 (11.3%) | 165 (13.7%) | 36 (10.9%) | <0.0001 |
| African American | 644 (32.6%) | 602 (29.8%) | 255 (21.1%) | 41 (12.4%) | |
| Hispanic | 315. (16%) | 438 (21.7%) | 378 (31.3%) | 113 (34.2%) | |
|
| |||||
| Body mass index (kg/m2) | 26.9 (5.3) | 28.5 (5.6) | 29.3 (5.3) | 30.0 (5.1) | <0.0001 |
|
| |||||
| Waist circumference (cm) | 93.6 (14.7) | 98.2 (13.9) | 101.3 (13.7) | 102.1 (12.6) | <0.0001 |
|
| |||||
| LDL-C ≥3.36 mmol/L (130 mg/dL) | 0 (0%) | 1,013 (50.1%) | 592 (49.0%) | 330 (100%) | N/A |
|
| |||||
| HDL-C <1.03 mmol/L (40 mg/dL) in men or <1.29 mmol/L (50 mg/dL) in women | 0 (0%) | 677 (33.5%) | 961 (79.6%) | 330 (100%) | N/A |
|
| |||||
| Triglycerides ≥1.69 mmol/L (150 mg/dL) | 0 (0%) | 331 (16.4%) | 863 (71.4%) | 330 (100%) | N/A |
|
| |||||
| Systolic blood pressure (mm Hg) | 124.5 (22.1) | 126.0 (21.9) | 127.3 (20.7) | 127.7 (21.5) | <0.0001 |
|
| |||||
| Diastolic blood pressure (mm Hg) | 71.4 (10.5) | 72.1 (10.3) | 72.6 (10.2) | 72.9 (10.2) | 0.005 |
|
| |||||
| Hypertension | 852 (43.1%) | 892 (44.1%) | 561 (46.4%) | 147 (44.6%) | 0.34 |
|
| |||||
| Fasting glucose (mmol/L) | 5.08 (1.21) | 5.32 (1.55) | 5.72 (2.11) | 5.62 (1.84) | <0.0001 |
|
| |||||
| Diabetes mellitus | 143 (7.2%) | 194 (9.6%) | 204 (16.9%) | 37 (11.2%) | <0.0001 |
|
| |||||
| Creatinine (μmol/L) | 83.2 (25.7) | 84.0 (20.6) | 84.3 (23.0) | 82.7 (20.8) | 0.43 |
|
| |||||
| Non-smoker | 967/1,964 (49.3%) | 1,043/2,017 (51.7%) | 600/1,202 (49.9%) | 173/330 (52.4%) | 0.03 |
|
| |||||
| Former smoker | 755/1,964 (38.4%) | 700/2,017 (34.7%) | 425/1,202 (35.4%) | 102/330 (30.9%) | |
|
| |||||
| Current smoker | 242/1,964 (12.3%) | 274/2,017 (13.6%) | 177/1,202 (14.7%) | 55/330 (16.7%) | |
|
| |||||
| Family history of heart disease | 715/1,854 (38.6%) | 809/1,885 (42.9%) | 451/1,129 (40.0%) | 139/308 (45.1%) | 0.02 |
|
| |||||
| Aspirin | 334/1,886 (17.7%) | 308/1,927 (16.0%) | 195/1,169 (16.7%) | 48/321 (15.0%) | 0.42 |
|
| |||||
| No alcohol use | 429/1,957 (21.9%) | 411/2,007 (20.5%) | 288/1,195 (24.1%) | 79/330 (23.9%) | <0.0001 |
|
| |||||
| Former alcohol use | 343/1,957 (17.5%) | 492/2,007 (24.5%) | 296/1,195 (24.8%) | 93/330 (28.2%) | |
|
| |||||
| Current alcohol use | 1,185/1,957 (60.6%) | 1,104/2,007 (55.0%) | 611/1,195 (51.1%) | 158/330 (47.9%) | |
|
| |||||
| Education, completed high school or GED | 1,691/1,963 (86.2%) | 1,651/2,017 (81.9%) | 923/1,202 (76.9%) | 255/330 (77.3%) | <0.0001 |
|
| |||||
| 10-year FRS* | 6.2% (6.1%) | 7.7% (6.9%) | 9.9% (8.0%) | 10.9% (8.0%) | <0.0001 |
|
| |||||
| Qualifies for statin* | 95/1,574 (6.0%) | 478/1,633 (29.3%) | 373/1,005 (37.1%) | 175/266 (65.8%) | <0.0001 |
Continuous variables are presented as means (SD) and categorical variables as percentages; denominator is that shown at the top of the table, unless otherwise specified.
GED = general educational development; FRS = Framingham Risk Score; N/A = not applicable (by definition, these lipid abnormalities will vary across the dyslipidemia categories)
CAC distribution by dyslipidemia categories
As shown in figure 2A, more than half of individuals with no LA had CAC=0 (58%), whereas those with increasing LA were less likely to demonstrate CAC=0 (p<0.0001). CAC scores of 1–99 and ≥100 were seen in 22% and 20% of individuals with no LA. In comparison, the respective prevalence was 29% and 21% among those with three LA. Similar results were seen when categorizing dyslipidemia by TC/HDL-C quartiles (figure 2B).
Figure 2.
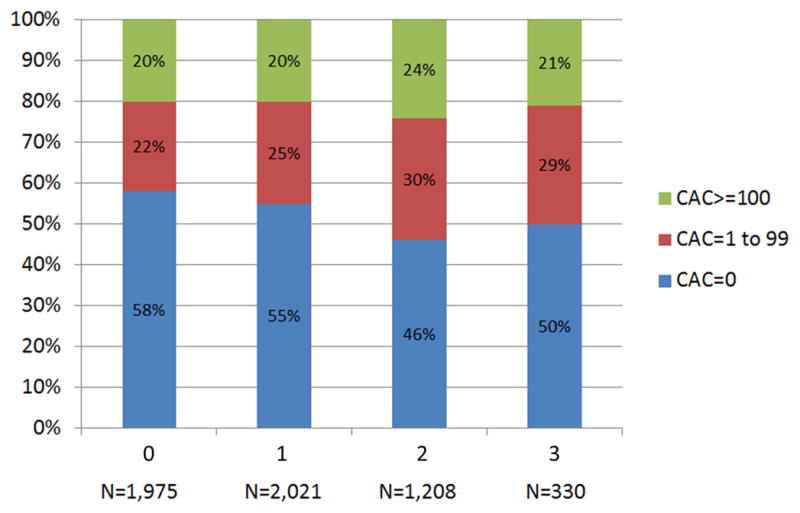

Distribution of CAC by (A) LA and (B) TC/HDL-C Quartiles. CAC = coronary artery calcium score; LA = lipid abnormality; TC/HDL-C = ratio of total cholesterol to high-density lipoprotein cholesterol.
CVD events
Overall, 353 (6%) CVD events occurred during 7.6 years of median follow-up. Those with any CAC accounted for 288 events (82%). More than half of events (194; 55%) occurred in the 1,155 participants (21%) with CAC≥100. Conversely, 65% of events occurred in participants with zero or one LA.
The CVD rate was 7.1 per 1,000 person-years (95% CI 5.8–8.7) for those with no LA as compared to 9.3 (95% CI 7.8–11.0), 11.6 (95% CI 9.5–14.2), and 13.9 (95% CI 9.8–19.8) per 1,000 person-years among those with one, two, and three LA, respectively. Overall, 2.2%, 6.7% and 16.8% absolute CVD events were seen in those with CAC=0, CAC 1–99 and ≥100, respectively. During study follow-up, the corresponding CVD event rates were 3.0 per 1,000 person-years (95% CI 2.4–3.9) for those with CAC=0 as compared to 9.8 (95% CI 8.0–12.0) and 26.5 (95% CI 23.0–30.5) per 1,000 person-years among those with CAC scores of 1–99 and ≥100, respectively.
Figure 3 shows increased cumulative incidence of CVD by CAC score among individuals stratified by the number of LA (panel A) or TC/HDL-C (panel B). Figure 4 shows that the lowest event rate was observed in those with no CAC and no LA (or in the lowest TC/HDL-C quartile), whereas those with CAC≥100 and three LA (or in the highest TC/HDL-C quartile) had the highest CVD event rate. Of note, individuals with no LA and CAC≥100 had a higher event rate compared to individuals with three LA but CAC=0 (22.2 vs 6.2 per 1,000 person-years). Similar results were obtained using guideline categories of LDL-C or non-HDL-C (figure 5) and dataset quartiles of Friedewald LDL-C, non-HDL-C, or LDL particle concentration (supplemental figure 1).
Figure 3.


Cumulative incidence of CVD events associated with CAC strata by (A) LA and (B) TC/HDL-C Quartiles. An unadjusted Nelson-Aalen cumulative function was used. CVD = atherosclerotic cardiovascular disease; abbreviations otherwise per Figure 2.
Figure 4.
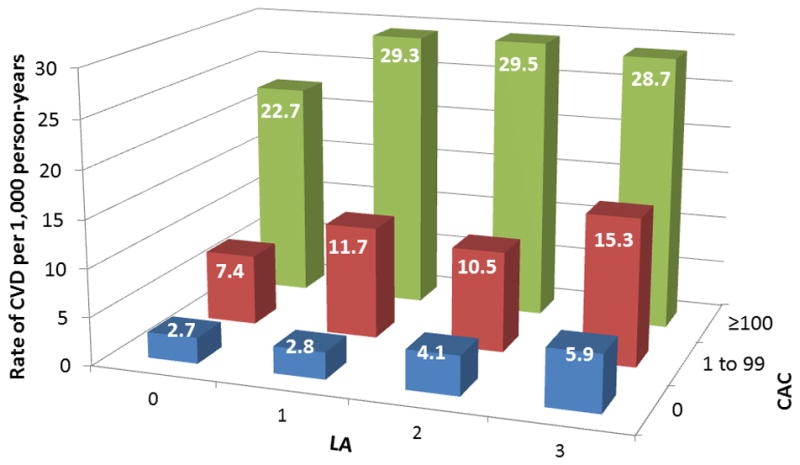
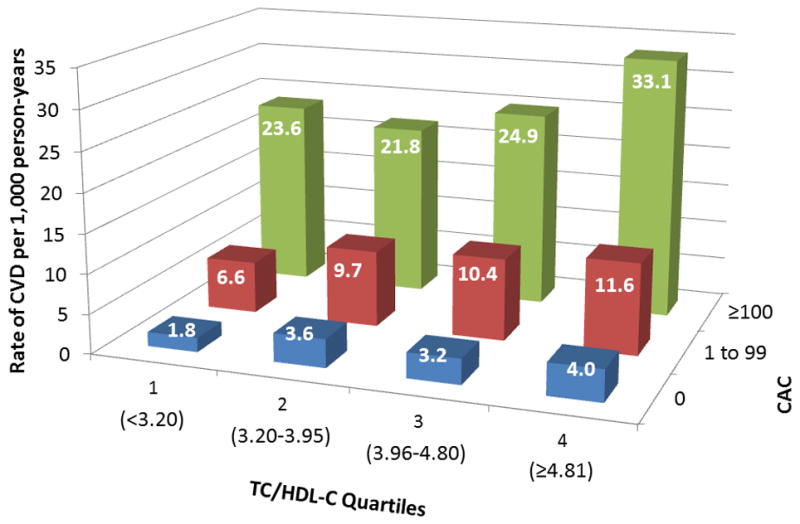
CVD events per 1,000 person-years by strata of CAC and (A) LA or (B) TC/HDL-C Quartiles. Abbreviations per Figure 2.
Figure 5.
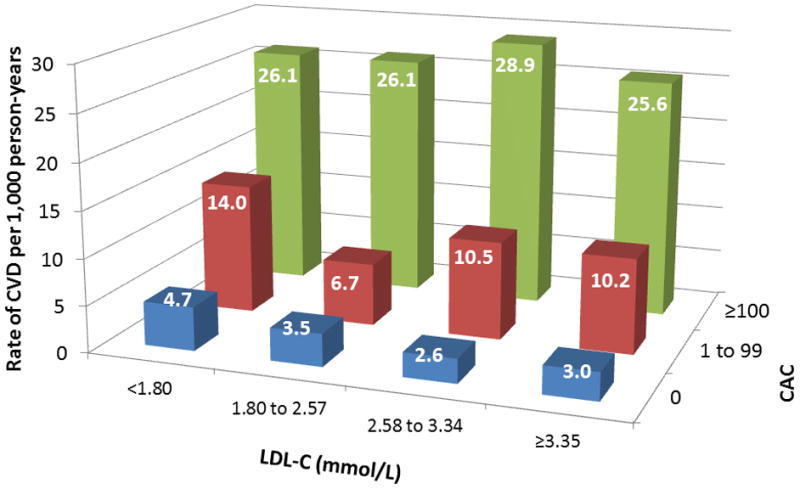
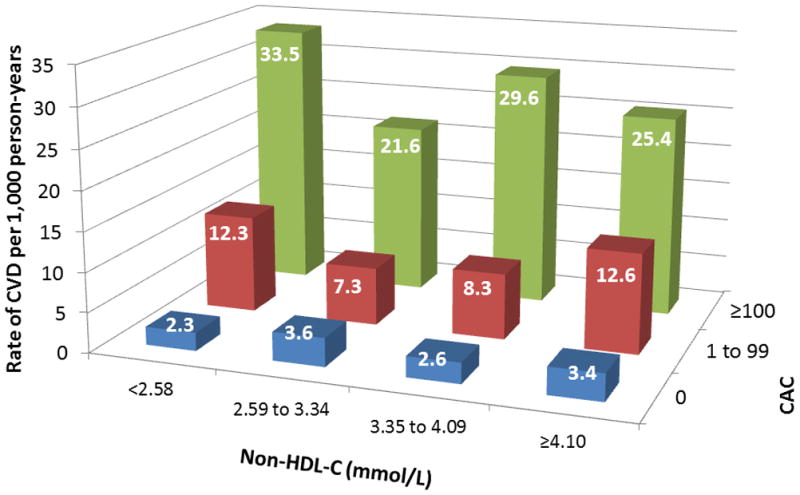
CVD events per 1,000 person-years by strata of CAC and (A) LDL-C or (B) non-HDL-C levels based on NCEP ATP categories. LDL-C = low-density lipoprotein cholesterol; non-HDL-C = non-high-density lipoprotein cholesterol; NCEP ATP = National Cholesterol Education Program Adult Treatment Panel; abbreviations otherwise per Figures 2 and 3.
Table 2 shows unadjusted and incrementally adjusted HRs for CVD events associated with the presence of CAC and CAC≥100 stratified by dyslipidemia burden. Compared to CAC=0, CAC≥100 was associated with a significant three- to six-fold increased risk of CVD across the spectrum of dyslipidemia. There was no interaction between dyslipidemia and CAC, dyslipidemia and sex, or dyslipidemia and ethnicity. Risk associated with CAC was mostly insensitive to baseline and follow-up dyslipidemia medications (supplemental table 1). Among those with CAC=0 at baseline (n=2,977), the respective median 7.6 year CVD free survival was 98.1%, 97.9%, 96.7% and 95.3% in those with zero, one, two, and three LA, respectively (supplemental figure 2). In age, sex, and risk factor adjusted Cox regression analyses, increasing LA were associated with a higher HRs for CVD across CAC score categories (supplemental table 2).
Table 2.
Multivariable-adjusted hazard ratios of CVD events for any CAC and CAC 100 by dyslipidemia category
| CAC>0 vs CAC=0 | CAC≥100 vs CAC=0 | |||||
|---|---|---|---|---|---|---|
| Model 1 | Model 2 | Model 3 | Model 1 | Model 2 | Model 3 | |
| # Lipid Abnormalities | ||||||
| 0 LA (N=1,975) | 5.87 (3.59–9.59) | 2.88 (1.68–4.94) | 2.32 (1.30–4.15) | 9.28 (5.56–15.49) | 4.31 (2.39–7.77) | 3.27 (1.73–6.19) |
| P<0.0001 | P=0.0001 | P=0.005 | P<0.0001 | P<0.0001 | P=0.0003 | |
| 1 LA (N=2,021) | 6.68 (4.19–10.66) | 4.65 (2.82–7.67) | 3.96 (2.39–6.57) | 10.66 (6.57–17.32) | 7.51 (4.35–12.96) | 5.80 (3.32–10.16) |
| P<0.0001 | P<0.0001 | P<0.0001 | P<0.0001 | P<0.0001 | P<0.0001 | |
| 2 LA (N=1,208) | 4.24 (2.51–7.16) | 2.36 (1.34–4.15) | 1.95 (1.10–3.47) | 6.65 (3.84–11.49) | 3.40 (1.84–6.31) | 2.74 (1.46–5.13) |
| P<0.0001 | P=0.003 | P=0.02 | P<0.0001 | P=0.0001 | P=0.002 | |
| 3 LA (N=330) | 3.57 (1.54–8.28) | 2.59 (1.07–6.30) | 2.45 (0.98–6.13) | 4.65 (1.86–11.67) | 3.28 (1.18–9.17) | 3.21 (1.18–8.73) |
| P=0.003 | P=0.04 | P=0.06 | P=0.001 | P=0.02 | P=0.02 | |
|
| ||||||
| TC/HDL-C Quartiles | ||||||
| 1st Quartile (N=1,380) | 7.83 (4.06–15.11) | 3.80 (1.88–7.66) | 3.23 (1.52–6.85) | 13.58 (6.87–26.82) | 6.16 (2.91–13.04) | 5.11 (2.28–11.46) |
| P<0.0001 | P=0.0002 | P=0.002 | P<0.0001 | P<0.0001 | P=0.0001 | |
| 2nd Quartile (N=1,385) | 4.11 (2.48–6.80) | 2.45 (1.41–4.26) | 2.29 (1.29–4.06) | 6.03 (3.51–10.37) | 3.34 (1.79–6.25) | 3.08 (1.61–5.90) |
| P<0.0001 | P=0.002 | P=0.005 | P<0.001 | P=0.0002 | P=0.0007 | |
| 3rd Quartile (N=1,386) | 5.13 (3.02–8.70) | 3.20 (1.80–5.68) | 2.23 (1.24–4.02) | 7.74 (4.44–13.50) | 4.40 (2.32–8.35) | 2.66 (1.36–5.21) |
| P<0.0001 | P=0.0001 | P=0.008 | P<0.0001 | P<0.0001 | P=0.004 | |
| 4th Quartile (N=1,383) | 5.30 (3.18–8.84) | 3.79 (2.21–6.49) | 3.11 (1.81–5.35) | 8.16 (4.82–13.80) | 5.98 (3.36–10.63) | 4.69 (2.62–8.37) |
| P<0.0001 | P<0.0001 | P<0.0001 | P<0.0001 | P<0.0001 | P<0.0001 | |
Hazard ratios are for the presence of CAC/high CAC by increasing LA; the reference group is CAC=0 within each LA category.
Model 1: unadjusted; Model 2: adjusted for age, sex, ethnicity, education, and MESA site, and; Model 3: adjusted for Model 2 variables plus hypertension, diabetes mellitus, smoking, body mass index, and family history. LA = lipid abnormality; CVD = atherosclerotic cardiovascular disease; CAC = coronary artery calcium. CVD events included myocardial infarction, angina resulting in revascularization, resuscitated cardiac arrest, stroke, cardiovascular death.
Hard CVD events
Overall, 256 (5%) hard CVD events (excludes angina leading to revascularization) occurred during 7.6 years of median follow-up. Those with any CAC accounted for 202 events (79%). Half of events (128) occurred in the 21% of participants with CAC≥100. Overall, the absolute incident hard CVD event rates were 1.8%, 5.3% and 11.1% among those with CAC=0, CAC 1–99 and ≥100, respectively. Taking follow-up duration into account, the corresponding hard CVD event rates were 2.5 per 1000 person-years (95% CI 1.9–3.3) for those with CAC=0 as compared to 7.7 (95% CI 6.1–9.6) and 16.9 (95% CI 14.2–20.1) per 1,000 person-years among those with CAC scores of 1–99 and ≥100, respectively.
Hazard ratios were attenuated, but largely similar to the main results of all CVD events, and remained statistically significant in the fully-adjusted model for CAC≥100 with the exception of the group with 3 LA (table 3). In this group (N=330), the hazard ratio of 2.71 (95% CI 0.80–9.13) was suggestive of inadequate power rather than a true absence of association. Indeed, results remained highly statistically significant in the highest TC/HDL-C quartile (N=1383) with a hazard ratio of 3.19 (95% CI 1.60–6.36). In those with 0 LA or in the lowest TC/HDL-C quartile, CAC>0 and CAC≥100 were significantly associated with hard CVD events in fully-adjusted models.
Table 3.
Multivariable-adjusted hazard ratios of hard CVD events for any CAC and CAC≥100 by dyslipidemia category
| CAC>0 vs CAC=0 | CAC≥100 vs CAC=0 | |||||
|---|---|---|---|---|---|---|
| Model 1 | Model 2 | Model 3 | Model 1 | Model 2 | Model 3 | |
| # Lipid Abnormalities | ||||||
| 0 LA (N=1,975) | 4.47 (2.62–7.63) | 2.45 (1.35–4.43) | 1.91 (1.00–3.65) | 6.64 (3.77–11.69) | 3.48 (1.80–6.75) | 2.41 (1.17–4.98) |
| P<0.0001 | P=0.003 | P=0.05 | P<0.0001 | P=0.0002 | P=0.02 | |
| 1 LA (N=2,021) | 5.59 (3.30–9.46) | 3.42 (1.94–6.04) | 3.00 (1.69–5.33) | 8.26 (4.75–14.36) | 4.70 (2.52–8.77) | 3.73 (1.97–7.08) |
| P<0.0001 | P<0.0001 | P=0.0002 | P<0.0001 | P<0.0001 | P=0.0001 | |
| 2 LA (N=1,208) | 3.57 (1.98–6.42) | 3.05 (1.08–3.88) | 1.68 (0.88–3.22) | 5.31 (2.86–9.87) | 2.78 (1.37–5.61) | 2.14 (1.04–4.40) |
| P<0.0001 | P=0.02 | P=0.12 | P<0.0001 | P=0.004 | P=0.04 | |
| 3 LA (N=330) | 3.89 (1.45–10.43) | 2.88 (1.02–8.15) | 2.26 (0.77–6.62) | 4.33 (1.45–12.92) | 2.99 (0.88–10.16) | 2.71 (0.80–9.13) |
| P=0.007 | P=0.05 | P=0.14 | P=0.009 | P=0.08 | P=0.11 | |
|
| ||||||
| TC/HDL-C Quartiles | ||||||
| 1st Quartile (N=1,380) | 6.87 (3.29–14.33) | 3.42 (1.55–7.55) | 2.88 (1.22–6.78) | 11.00 (5.09–23.79) | 5.15 (2.20–12.08) | 4.09 (1.61–10.36) |
| P<0.0001 | P=0.002 | P=0.02 | P<0.0001 | P=0.0002 | P=0.003 | |
| 2nd Quartile (N=1,385) | 3.16 (1.85–5.41) | 1.95 (1.08–3.52) | 1.82 (0.99–3.36) | 4.61 (2.58–8.26) | 2.67 (1.35–5.27) | 2.40 (1.19–4.86) |
| P<0.0001 | P=0.02 | P=0.05 | P<0.0001 | P=0.005 | P=0.01 | |
| 3rd Quartile (N=1,386) | 4.88 (2.66–8.96) | 3.12 (1.62–6.02) | 2.26 (1.15–4.46) | 6.68 (3.49–12.76) | 3.73 (1.79–7.79) | 2.32 (1.06–5.06) |
| P<0.0001 | P=0.0007 | P=0.02 | P<0.0001 | P=0.0005 | P=0.03 | |
| 4th Quartile (N=1,383) | 4.39 (2.43–7.93) | 3.02 (1.61–5.66) | 2.46 (1.30–4.64) | 6.18 (3.34–11.45) | 4.04 (2.04–8.01) | 3.19 (1.60–6.36) |
| P<0.0001 | P=0.0006 | P=0.006 | P<0.0001 | P=0.0001 | P<0.0001 | |
Hazard ratios are for the presence of CAC/high CAC by increasing LA; the reference group is CAC=0 within each LA category.
Model 1: unadjusted; Model 2: adjusted for age, sex, ethnicity, education, and MESA site, and; Model 3: adjusted for Model 2 variables plus hypertension, diabetes mellitus, smoking, body mass index, and family history. LA = lipid abnormality; CVD = atherosclerotic cardiovascular disease; CAC = coronary artery calcium. Hard CVD events included myocardial infarction, resuscitated cardiac arrest, stroke, cardiovascular death.
DISCUSSION
In multi-ethnic, asymptomatic, middle-aged to elderly men and women from the general community, our study examines two paradigms of risk assessment: dyslipidemia (risk factor) and CAC (measurable atherosclerosis). Evaluating interplay between the two, we show that many individuals with dyslipidemia have no CAC, while many individuals without dyslipidemia have CAC. We find that CAC stratifies CVD risk regardless of the burden of dyslipidemia and regardless of how dyslipidemia is defined. An event rate similar to that seen in secondary prevention populations (≥20 events per 1,000 person-years) is estimated for patients with CAC≥100 throughout the spectrum of dyslipidemia. In contrast, when CAC=0, absolute event rates remain relatively low across varying levels of dyslipidemia.
Allocating statin therapy: To prevent events, there must be events
We focused on patients who were not on statin therapy at baseline but could have been considered for therapy. We do not propose that our single study can determine the proper management of any individual patient; however, this information is thought provoking and can help guide discussions regarding the most optimal strategies to identify at-risk individuals. In the absence of data for years to come from a randomized clinical trial testing CAC in the allocation of statin therapy, it is important to consider that to prevent events, there must be events. The vast majority of events, at least over 7.6 years in MESA, occur in patients with CAC. So it is highly unlikely that clinical trial populations would have had enough events to demonstrate a benefit of statin therapy unless enriched with patients who had at least some coronary calcium.
“Normal” lipids but detectable CAC
The term “normal” is often applied to lipids. Consistent with guidelines and clinical trials, we classified a LDL-C of <3.36 mmol/L (130 mg/dL) as “normal.” It is important to recognize, however, that a LDL-C of 3.36 mmol/L may be two- to three-fold higher than what is biologically normal or clinically ideal.15 Relatively few individuals in the western world have truly normal lipids. Therefore, it is no surprise that patients have consistently benefitted from statin therapy in clinical trials regardless of the baseline the lipid profile.5
In individuals in our study without any dyslipidemia by traditional definitions, one in five had CAC≥100, where absolute risk was high. Therefore, considering detectable subclinical atherosclerosis by CAC for such patients could help weigh absolute risk more heavily in decision making, in line with the stated goal of guidelines. While CAC itself is not generally modifiable with statin therapy, whereas dyslipidemia is, CAC may have the potential to give the clinician and patient a more reliable understanding of the probability of the patient having an event in the near future.
Dyslipidemia but CAC=0
Even in the presence of three LA, when CAC=0, the absolute event rate was <5% over 7.6 years and less than a third of the event rate in participants with zero LA and CAC≥100. However, some events do occur when CAC=0; CAC does not measure non-calcified plaques, and as a snapshot of information up to that point in time, CAC does not capture ongoing exposure to risk from dyslipidemia and other risk factors. We do not propose a single way to manage a middle-aged to elderly patient with dyslipidemia and CAC=0, but if treatment is instituted, we would submit that the discussion with the patient should specify that the primary treatment goal is to reduce long-term accumulation of atherosclerosis and not to reduce near-term events.
Estimating the Number Needed to Treat
In order to provide the most clinically relevant information, it may be useful to interpret these results in light of findings from statin trials to project an estimated risk reduction onto the MESA population across categories of lipid abnormalities and CAC scores. This extrapolation allows estimation of a 5-year number needed to treat (NNT5) for LDL-C lowering by statins using previously described methods. 18,21 If we apply the 30% relative risk reduction associated with a 1.00 mmol/L (39 mg/dL) reduction in LDL-C from a Cochrane meta-analysis of statin therapy in primary prevention,17 the estimated NNT5 across dyslipidemia categories in this MESA cohort ranges from 23 to 30 in those with CAC≥100. It is 30 in participants with no LA and CAC ≥100, whereas the NNT5 is 154 in those with three LA and CAC=0.
However, we caution that the risk reduction and NNT5 with statin therapy, as extrapolated from efficacy demonstrated in randomized controlled trials, may or may not reflect the actual effectiveness of statins in the MESA cohort, and may or may not apply equally to the different subgroups in this study. In particular, CAC testing was not performed in the statin intervention trials, and, therefore, the meta-analyses have not assessed the efficacy of treatment across CAC subgroups.
Integrating into the Framingham approach
The Framingham risk score is an important paradigm in absolute risk assessment, and US guidelines1,2 recommend it to synthesize risk from traditional risk factors. Multiple prior studies have shown value of CAC in further refining absolute risk assessment beyond traditional risk factors or the Framingham risk score.6–9 In MESA participants classified as intermediate risk by the Framingham risk score, CAC provided superior discrimination and risk reclassification for incident CHD/CVD compared with other novel risk factors, including carotid intima-media thickness, ankle-brachial index, high-sensitivity CRP, and family history.9 Adding CAC to the Framingham risk score yielded a net reclassification improvement of 0.466 for CVD events (net correct reclassification: 10.6% events; 36.0% nonevents).
Nevertheless, only 1% of women and 15% of men in the Dallas Heart Study were classified as intermediate risk by the Framingham risk score, and <0.1% and 1.1%, respectively, changed from intermediate to high risk using a CAC threshold of ≥400.22 An imaging strategy targeted at persons classified as low risk by the Framingham risk score was more efficient. Indeed, in a prior MESA study of women classified as low risk by the Framingham risk score, the prevalence of CAC>0 was 32%, and compared with women with no detectable CAC, there was an increased risk of CVD events (hazard ratio, 5.2; 95% CI 2.5–10.8).23 Overall, clinically integrating CAC assessment with global risk scores appears to supplement risk stratification and potentially identify appropriate candidates who may be more likely, and less likely, to benefit from established treatment strategies, such as statins. Further studies are needed to specifically define the optimal strategy for integrating CAC assessment into the Framingham approach.
Limitations
CAC has several potential limitations. First, image acquisition and interpretation adds healthcare costs. Nevertheless, the cost is generally ~$90, which is 18 months of therapy with a generic statin priced at $5 per month. Second, radiation exposure is required; the average measured dose of radiation was 0.89 mSv in MESA, while the dose with modern technology is as low at 0.5 mSv compared with background radiation of 3 mSv per year. Third, incidental non-cardiac findings (e.g., nodules) can generate recommendations for additional follow-up imaging in about 5% of adults without a history of smoking, though some data suggest less downstream spending in those with CAC=0.24
Our study itself also has potential limitations to consider. First, participants and their physicians were informed of their CAC score, which may have modified the use of preventive medical therapies during follow-up, and cardiovascular event rates (particularly angina resulting in revascularization). Addressing these possible sources of bias, we performed sensitivity analyses examining the extent to which risk associated with CAC was sensitive to baseline and follow-up dyslipidemia medications, as well as inclusion of angina resulting in revascularization in the combined CVD endpoint. In these analyses, the overall pattern of findings was largely similar to our main results. Finally, while our study was designed to examine risk stratification, we could not directly test whether incorporation of CAC into clinical decision making would translate into improved clinical outcomes and be cost-effective.
CONCLUSION
Measurable atherosclerosis by CAC appears to stratify CVD risk across the spectrum of dyslipidemia in asymptomatic middle-aged to elderly men and women from the general community. At the patient-level, CAC may help further “personalize” efforts to weigh expected benefits and costs of statin treatment, especially in patients with a history of side effects from statin treatment. At the population-level, CAC might help prioritize decisions about statin therapy in a cost-constrained healthcare system, directing it to the patients at highest absolute risk, in accordance with the goal of worldwide clinical practice guidelines.
Supplementary Material
Acknowledgments
The authors thank the other investigators, the staff, and the participants of the MESA study for their valuable contributions. A full list of participating MESA investigators and institutions can be found at http://www.mesa-nhlbi.org.
Funding Sources: The MESA study, which supplied the data for this analysis, was supported by contracts N01-HC-95159 through N01-HC-95169 from the National Heart, Lung, and Blood Institute (NHLBI). A group of individual investigators proposed and undertook the present study, for which we did not have any specific funding. NHLBI-sponsored MESA committees reviewed and approved the proposal, abstract, and manuscript from the present study. SSM and KN had full access to all the data in the study and take responsibility for the integrity of the data and the accuracy of the data analysis.
Footnotes
Conflict of Interest Disclosures: Dr. Budoff serves on the speakers’ bureau for GE Healthcare. Dr. Virani had a grant through Merck related to dyslipidemia ending in 12/2011. The other authors have no potential conflicts of interest relevant to this article.
References
- 1.Third Report of the National Cholesterol Education Program (NCEP) Expert Panel on Detection, Evaluation, and Treatment of High Blood Cholesterol in Adults (Adult Treatment Panel III) final report. National Cholesterol Education Program (NCEP) Expert Panel on Detection, Evaluation, and Treatment of High Blood Cholesterol in Adults (Adult Treatment Panel III) Circulation. 2002;106:3143–421. [PubMed] [Google Scholar]
- 2.Grundy SM, Cleeman JI, Merz CN, Brewer HB, Jr, Clark LT, Hunninghake DB, Pasternak RC, Smith SC, Jr, Stone NJ. Coordinating Committee of the National Cholesterol Education Program. Circulation. 2004;110:227–39. doi: 10.1161/01.CIR.0000133317.49796.0E. [DOI] [PubMed] [Google Scholar]
- 3.Reiner Z, Catapano AL, De Backer G, Graham I, Taskinen MR, Wiklund O, Agewall S, Alegria E, Chapman MJ, Durrington P, Erdine S, Halcox J, Hobbs R, Kjekshus J, Filardi PP, Riccardi G, Storey RF, Wood D European Association for Cardiovascular Prevention & Rehabilitation. ESC Committee for Practice Guidelines (CPG) 2008–2010 and 2010–2012 Committees. ESC/EAS Guidelines for the management of dyslipidaemias: the Task Force for the management of dyslipidaemias of the European Society of Cardiology (ESC) and the European Atherosclerosis Society (EAS) Eur Heart J. 2011;32:1769–1818. doi: 10.1093/eurheartj/ehr158. [DOI] [PubMed] [Google Scholar]
- 4.Genest J, McPherson R, Frohlich J, Anderson T, Campbell N, Carpentier A, Couture P, Dufour R, Fodor G, Francis GA, Grover S, Gupta M, Hegele RA, Lau DC, Leiter L, Lewis GF, Lonn E, Mancini GB, Ng D, Pearson GJ, Sniderman A, Stone JA, Ur E, Genest J, McPherson R, Frohlich J. 2009 Canadian Cardiovascular Society/Canadian guidelines for the diagnosis and treatment of dyslipidemia and prevention of cardiovascular disease in the adult - 2009 recommendations. Can J Cardiol. 2009;25:567–79. doi: 10.1016/s0828-282x(09)70715-9. [DOI] [PMC free article] [PubMed] [Google Scholar]
- 5.Baigent C, Blackwell L, Emberson J, Holland LE, Reith C, Bhala N, Peto R, Barnes EH, Keech A, Simes J, Collins R Cholesterol Treatment Trialists’ (CTT) Collaboration. Efficacy and safety of more intensive lowering of LDL cholesterol: a meta-analysis of data from 170,000 participants in 26 randomised trials. Lancet. 2010;376:1670–81. doi: 10.1016/S0140-6736(10)61350-5. [DOI] [PMC free article] [PubMed] [Google Scholar]
- 6.Detrano R, Guerci AD, Carr JJ, Bild DE, Burke G, Folsom AR, Liu K, Shea S, Szklo M, Bluemke DA, O’Leary DH, Tracy R, Watson K, Wong ND, Kronmal RA. Coronary calcium as a predictor of coronary events in four racial or ethnic groups. N Engl J Med. 2008;358:1336–45. doi: 10.1056/NEJMoa072100. [DOI] [PubMed] [Google Scholar]
- 7.Polonsky TS, McClelland RL, Jorgensen NW, Bild DE, Burke GL, Guerci AD, Greenland P. Coronary artery calcium score and risk classification for coronary heart disease prediction. JAMA. 2010;303:1610–16. doi: 10.1001/jama.2010.461. [DOI] [PMC free article] [PubMed] [Google Scholar]
- 8.Greenland P, LaBree L, Azen SP, Doherty TM, Detrano RC. Coronary artery calcium score combined with Framingham score for risk prediction in asymptomatic individuals. JAMA. 2004;291:210–5. doi: 10.1001/jama.291.2.210. [DOI] [PubMed] [Google Scholar]
- 9.Yeboah J, McClelland RL, Polonsky TS, Burke GL, Sibley CT, O’Leary D, Carr JJ, Goff DC, Greenland P, Herrington DM. Comparison of novel risk markers for improvement in cardiovascular risk assessment in intermediate-risk individuals. JAMA. 2012;308:788–95. doi: 10.1001/jama.2012.9624. [DOI] [PMC free article] [PubMed] [Google Scholar]
- 10.Greenland P, Alpert JS, Beller GA, Benjamin EJ, Budoff MJ, Fayad ZA, Foster E, Hlatky MA, Hodgson JM, Kushner FG, Lauer MS, Shaw LJ, Smith SC, Jr, Taylor AJ, Weintraub WS, Wenger NK, Jacobs AK American College of Cardiology Foundation/American Heart Association Task Force on Practice Guidelines. 2010 ACCF/AHA guideline for assessment of cardiovascular risk in asymptomatic adults: a report of the American College of Cardiology Foundation/American Heart Association Task Force on Practice Guidelines. Circulation. 2010;122:e584–636. doi: 10.1161/CIR.0b013e3182051b4c. [DOI] [PubMed] [Google Scholar]
- 11.Bild DE, Detrano R, Peterson D, Guerci A, Liu K, Shahar E, Ouyang P, Jackson S, Saad MF. Ethnic differences in coronary calcification: the Multi-Ethnic Study of Atherosclerosis (MESA) Circulation. 2005;111:1313–20. doi: 10.1161/01.CIR.0000157730.94423.4B. [DOI] [PubMed] [Google Scholar]
- 12.Carr JJ, Nelson JC, Wong ND, McNitt-Gray M, Arad Y, Jacobs DR, Jr, Sidney S, Bild DE, Williams OD, Detrano RC. Calcified coronary artery plaque measurement with cardiac CT in population-based studies: standardized protocol of Multi-Ethnic Study of Atherosclerosis (MESA) and Coronary Artery Risk Development in Young Adults (CARDIA) study. Radiology. 2005;234:35–43. doi: 10.1148/radiol.2341040439. [DOI] [PubMed] [Google Scholar]
- 13.Agatston AS, Janowitz WR, Hildner FJ, Zusmer NR, Viamonte M, Jr, Detrano R. Quantification of coronary artery calcium using ultrafast computed tomography. J Am Coll Cardiol. 1990;15:827–32. doi: 10.1016/0735-1097(90)90282-t. [DOI] [PubMed] [Google Scholar]
- 14.Friedewald WT, Levy RI, Fredrickson DS. Estimation of the concentration of low-density lipoprotein cholesterol in plasma, without use of the preparative ultracentrifuge. Clin Chem. 1972;18:499–502. [PubMed] [Google Scholar]
- 15.Martin SS, Metkus TS, Horne A, Blaha MJ, Hasan R, Campbell CY, Yousuf O, Joshi P, Kaul S, Miller M, Michos ED, Jones SR, Gluckman TJ, Cannon CP, Sperling LS, Blumenthal RS. Waiting for the National Cholesterol Education Program Adult Treatment Panel IV Guidelines, and in the Meantime, Some Challenges and Recommendations. Am J Cardiol. 2012;110:307–13. doi: 10.1016/j.amjcard.2012.03.023. [DOI] [PubMed] [Google Scholar]
- 16.Ridker PM, Danielson E, Fonseca FA, Genest J, Gotto AM, Jr, Kastelein JJ, Koenig W, Libby P, Lorenzatti AJ, MacFadyen JG, Nordestgaard BG, Shepherd J, Willerson JT, Glynn RJ JUPITER Study Group. Rosuvastatin to prevent vascular events in men and women with elevated C-reactive protein. N Engl J Med. 2008;359:2195–2207. doi: 10.1056/NEJMoa0807646. [DOI] [PubMed] [Google Scholar]
- 17.Taylor F, Huffman MD, Macedo AF, Moore TH, Burke M, Davey Smith G, Ward K, Ebrahim S. Statins for the primary prevention of cardiovascular disease. Cochrane Database Syst Rev. 2013;1:CD004816. doi: 10.1002/14651858.CD004816.pub5. [DOI] [PMC free article] [PubMed] [Google Scholar]
- 18.Blaha MJ, Budoff MJ, DeFilippis AP, Blankstein R, Rivera JJ, Agatston A, O’Leary DH, Lima J, Blumenthal RS, Nasir K. Associations between C-reactive protein, coronary artery calcium, and cardiovascular events: implications for the JUPITER population from MESA, a population-based cohort study. Lancet. 2011;378:684–92. doi: 10.1016/S0140-6736(11)60784-8. [DOI] [PMC free article] [PubMed] [Google Scholar]
- 19.Di Angelantonio E, Sarwar N, Perry P, Kaptoge S, Ray KK, Thompson A, Wood AM, Lewington S, Sattar N, Packard CJ, Collins R, Thompson SG, Danesh J Emerging Risk Factors Collaboration. Major lipids, apolipoproteins, and risk of vascular disease. JAMA. 2009;302:1993–2000. doi: 10.1001/jama.2009.1619. [DOI] [PMC free article] [PubMed] [Google Scholar]
- 20.Thomas L, Peterson ED. The value of statistical analysis plans in observational research: defining high-quality research from the start. JAMA. 2012;308:773–4. doi: 10.1001/jama.2012.9502. [DOI] [PubMed] [Google Scholar]
- 21.Altman DG, Andersen PK. Calculating the number needed to treat for trials where the outcome is time to an event. BMJ. 1999;319:1492–5. doi: 10.1136/bmj.319.7223.1492. [DOI] [PMC free article] [PubMed] [Google Scholar]
- 22.Patel MJ, de Lemos JA, McGuire DK, See R, Lindsey JB, Murphy SA, Grundy SM, Khera A. Evaluation of coronary artery calcium screening strategies focused on risk categories: the Dallas Heart Study. Am Heart J. 2009;157:1001–9.21. doi: 10.1016/j.ahj.2009.03.018. [DOI] [PMC free article] [PubMed] [Google Scholar]
- 23.Lakoski SG, Greenland P, Wong ND, Schreiner PJ, Herrington DM, Kronmal RA, Liu K, Blumenthal RS. Coronary artery calcium scores and risk for cardiovascular events in women classified as “low risk” based on Framingham risk score: the multi-ethnic study of atherosclerosis (MESA) Arch Intern Med. 2007;167:2437–42. doi: 10.1001/archinte.167.22.2437. [DOI] [PubMed] [Google Scholar]
- 24.Rozanski A, Gransar H, Shaw LJ, Kim J, Miranda-Peats L, Wong ND, Rana JS, Orakzai R, Hayes SW, Friedman JD, Thomson LE, Polk D, Min J, Budoff MJ, Berman DS. Impact of coronary artery calcium scanning on coronary risk factors and downstream testing the EISNER (Early Identification of Subclinical Atherosclerosis by Noninvasive Imaging Research) prospective randomized trial. J Am Coll Cardiol. 2011;57:1622–32. doi: 10.1016/j.jacc.2011.01.019. [DOI] [PMC free article] [PubMed] [Google Scholar]
Associated Data
This section collects any data citations, data availability statements, or supplementary materials included in this article.