

Abstract
Streptococcus sanguinis is a Gram-positive bacterium that is indigenous to the oral cavity. S. sanguinis, a primary colonizer of the oral cavity, serves as a tether for the attachment of other oral pathogens. The colonization of microbes on the tooth surface forms dental plaque, which can lead to the onset of periodontal disease. We examined a comprehensive mutant library to identify genes related to cellular chain length and morphology using phase-contrast microscopy. A number of hypothetical genes related to the cellular chain length were identified in this study. Genes related to the cellular chain length were analysed along with clusters of orthologous groups (COG) for gene functions. It was discovered that the highest proportion of COG functions related to cellular chain length was ‘cell division and chromosome separation’. However, different COG functions were also found to be related with altered cellular chain length. This suggested that different genes related with multiple mechanisms contribute to the cellular chain length in S. sanguinis SK36.
Introduction
Streptococcus sanguinis, previously known as Streptococcus sanguis, is a Gram-positive facultative anaerobe belonging to the viridans group of streptococci (Kilian & Holmgren, 1981; Kilian et al., 1989; Xu et al., 2007; Truper & De’clari, 1997). The cells of S. sanguinis grow in chains and clusters that directly bind to the salivary pellicle of the tooth surface. Using different mechanisms of attachment, S. sanguinis serves as a tether for the colonization of other micro-organisms. Oral micro-organisms then organize and cooperate to develop biofilms on dental surfaces. The formation of this biofilm plays an essential role in the establishment of periodontal disease (Kolenbrander, 2000; Kolenbrander & London, 1993; Socransky et al., 1977; Xu et al., 2007; Truper & De’clari, 1997). S. sanguinis is also one of the recognized causative agents of infective endocarditis when it enters the bloodstream, which can lead to serious health complications (Ahmed et al., 2003).
One factor that may contribute to S. sanguinis biofilm formation and endocarditis virulence is cellular chain length. For instance, the length of the chain can affect the physical behaviour of cells in biofilm formation. The longer the cell chains are, the easier it is for cells to aggregate with each other. Cellular chain length was shown to be related to bacterial invasion in Streptococcus pneumoniae (Dalia & Weiser, 2011) and was also found to have a negative correlation with phagocytosis susceptibility in Streptococcus mutans (Nakano et al., 2005; Wen & Burne, 2002). Cellular chain formation is dependent on the geometry of cell division during binary fission. Cellular division occurring within two planes perpendicular to each other results in a tetrad formation of daughter cells, while divisions that occur within three planes result in the arrangement of daughter cells in an eight member cubic structure (Zapun et al., 2008). Irregular patterns of cell division that occur in random planes result in clustered bunches of bacteria, while a regular pattern of cell division occurring along one plane or axis results in the formation of cellular chains (Zapun et al., 2008). In streptococci, cell division usually occurs along one plane and results in chains composed of two or more cells. However, as streptococcal cellular chain length is influenced by a number of factors, it should be noted that cellular morphology and chain formation in streptococci are highly variable and are known to differ from strain to strain (Higgins et al., 1970; Nakano et al., 2005; Thibodeau & Ford, 1991).
Chain formation in S. sanguinis has been shown to affect competitiveness altering endocarditis virulence (Turner et al., 2009). Some studies predict conditions that may affect cellular chain length may also affect adhesion (Murchison et al., 1982) and aggregation (Murchison et al., 1982; Nakano et al., 2005), which can contribute to virulence.
The streptococcal cellular chain length and morphology are influenced by a number of factors. Previous studies suggest that cell wall components such as peptidoglycan, lipoteichoic acids and cell wall anchor proteins greatly affect the morphology of cells (Thibodeau & Ford, 1991). Factors such as environmental conditions or genetic and chemical mutations that control or affect these cellular components can contribute to streptococcal cell adhesion and morphology (Higgins et al., 1970; Nakano et al., 2005; Thibodeau & Ford, 1991). We recently created a comprehensive bank of gene deletion mutants in S. sanguinis SK36 strain (Xu et al., 2011). In the present study, using phase-contrast microscopy, we analysed morphological changes of these gene deletion mutants and identified a number of genes related to cellular chain length.
Methods
Bacterial strains and mutants.
S. sanguinis SK36 single gene deletion mutants with a promoterless kanamycin cassette and complemented strains with a promoterless erythromycin cassette were previously constructed using a PCR-based recombinant method as described (Xu et al., 2011). Mutants are indicated by ‘Ssx’ followed by their corresponding gene ‘SSA’ numbers.
S. sanguinis gene deletion mutants were cultured in brain heart infusion (BHI) broth (BD Sciences) supplemented with kanamycin (Fisher Scientific) to 500 µg ml−1 using 1 ml 96-deep-well plates (Fisher Scientific). Deletion mutants from frozen stock plates were transferred to 96-deep-well plates. The mutants were grown overnight at 37 °C under microaerobic conditions (6 % O2, 7.2 % CO2, 7.2 % H2 and 79.6 % N2) (Xu et al., 2007; Chen et al., 2011). Slower growing mutants were cultured for 2 days to allow for complete growth. The failed growing mutants were re-inoculated no more than twice. Each 96-deep-well plate contained approximately 90 mutants, two wells contained wild-type strain SK36 (as controls) and four wells contained sterile BHI medium to monitor cross contamination. Except for BHI supplemented with 10 µg ml−1 erythromycin, the conditions for culturing complemented strains were the same as above.
Phase-contrast microscopy.
Cellular morphology of each deletion mutant and wild-type of S. sanguinis SK36 was observed using phase-contrast microscopy. Samples were carefully collected from each well of a 96-deep-well plate, avoiding disruption of the cellular chains and clusters. Clustered mutants or cultures that displayed excessive growth were diluted twofold with BHI prior to observation.
Each mutant was examined at ×200 total magnification using a Carl Zeiss AxioVision microscope. To determine cellular chain length, 50 chains were randomly selected and measured using the AxioVision Le Rei 4.3 program. The geometric mean of the 50 measured chains for each mutant was compared with the geometric mean of the SK36 control. Student’s t-test was used to determine significant differences among the cellular chain lengths. The Bonferroni correction was used to adjust for the comparison of mutants in the 96-well plates and the total number of mutants being evaluated. Therefore, mutants that were shorter or longer than SK36 (13.86–17.36 µm) with a P-value <0.0005 were considered to be short or long.
Auto-aggregation assay.
The auto-aggregation of S. sanguinis wild-type, mutants and their complemented strains was determined as described by Luo et al. (2008). Briefly, each overnight culture in BHI medium was mixed, transferred into a 1 ml cuvette and kept at room temperature. The absorbance of the culture at 600 nm was measured at 0 h (A0) and 8 h (A8) using a BioMate spectrophotometer (Thermo Scientific). Auto-aggregation ability was expressed as auto-aggregation percentage (Ag%) and calculated using Ag% = [(A0−A8)/A0]×100.
Gene function assignment.
To determine putative gene function, protein sequences were searched against the previously annotated S. sanguinis SK36 genome (Xu et al., 2007). The cluster of orthologous groups (COG) annotation was downloaded from the NCBI database and pathways were analysed via the Kyoto Encyclopedia of Genes and Genomes (KEGG), combined with manual curation and validation. Once each mutant was examined and measured, its putative gene function and COG were recorded. The ratio of the number of cellular chain length mutants for each COG and the total number of non-essential gene mutants belonging to the COG was calculated.
Scanning electron microscopy (SEM).
Following overnight incubation, 0.5 ml of each culture was deposited onto a 0.1 µm disposable Millipore filter to remove BHI broth. The samples were fixed using 2 % glutaraldehyde in 0.1 M sodium cacodylate buffer, followed by 1 % osmium tetroxide in 0.1 M sodium cacodylate buffer. Samples embedded in the filters were then dehydrated in ethanol and hexamethyldisilazane (HMDS) and finally allowed to air-dry. The filters were sectioned and mounted. Prior to visualization samples were coated with gold for 3 min (EMS-550 Automated Sputter Coater; Electron Microscopy Sciences). Micrographs were taken at ×20 000, ×30 000 and ×40 000 total magnification using a ZEISS EVO50 XVP scanning electron microscope (Carl Zeiss).
Microarray analysis.
RNA samples were isolated from exponential phase cells (OD660 0.6–1.0) of the two-component system (TCS) gene mutants. RNA samples from SK36 strain cells were used as the control. RNA isolations were performed in triplicate. Microarray analysis was performed as previously described (Xu et al., 2011). Briefly, RNA was isolated with the RNeasy mini kit (Qiagen) from cells lysed by lysozyme treatment and mechanical disruption. DNA was removed from the RNeasy mini kit column by DNase I treatment. RNA samples were labelled by Cy3 or Cy5 in cDNA synthesis. The labelled cDNA of the test and the control samples was mixed and hybridized with the S. sanguinis SK36-spotted microarray version 2 (produced by the Pathogen Functional Genomics Resource Center at J Craig Venter Institute). Following hybridization and scanning, signals were calculated, normalized and analysed statistically to identify modulations in transcriptional activity. The microarray data were deposited in the NCBI Gene Expression Omnibus (GEO) with access number GSE48940.
Results
Collection of longer and shorter chain mutants
We first classified four basic mutant groups based on the chain morphology observed: longer, shorter, clustered and normal chains. Fig. 1 shows the different morphologies of three mutants compared with the wild-type S. sanguinis SK36 strain.
Fig. 1.
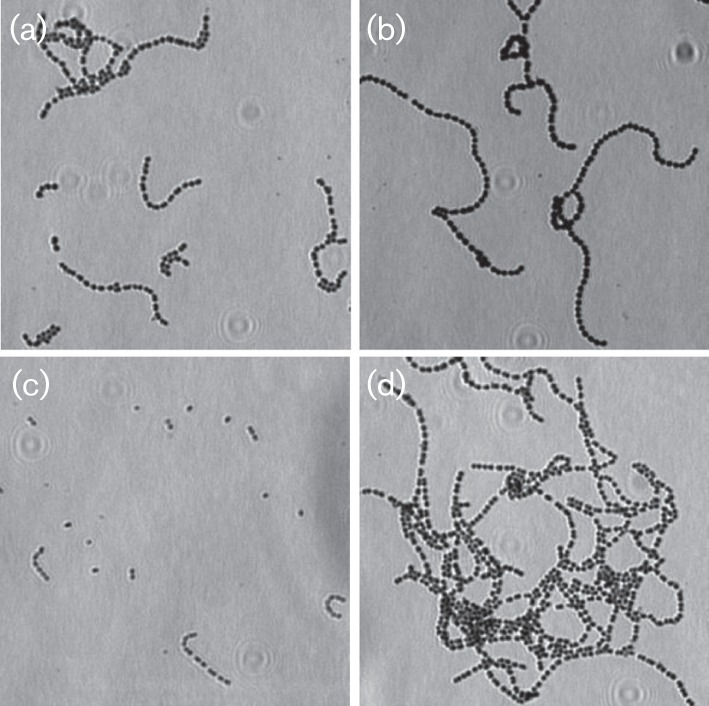
Chain morphologies of mutants. (a) SK36, the wild-type strain. (b) A longer chain mutant with deletion of SSA_0933 gene for acetyltransferase. (c) A shorter chain mutant with deletion of SSA_0422 gene for phosphoglycerate mutase family protein. (d) A chain clustered mutant with deletion of SSA_0285 gene for formate acetyltransferase 3.
Each mutant was observed using phase-contrast microscopy. Three to four images were photographed for length analysis. Initially, images of the mutants were visually inspected to select those with different cellular morphology (longer, shorter or clustered chains) from the wild-type strain, SK36, in the same 96-well culture plate. The cellular chain lengths of the selected mutants were then carefully measured. Fifty chains were randomly selected from the images and manually measured using the AxioVision Le Rei 4.3 program. The statistical significance of mutant cellular chain lengths compared with SK36 was calculated. Over 300 of 2000 mutants, or approximately 15 % of genes in the genome, were identified to have significant changes in the morphological cellular chain length. Of these, 156 mutants had longer chains and 151 mutants had shorter chains (Table S1, available in the online Supplementary Material). In Table 1, we list the 20 longest cellular chain mutants and in Table 2, the 20 shortest cellular chain mutants. From the top 20, we picked the three mutants Ssx_1796, Ssx_0655 and Ssx_0816 with shorter, longer and clustered phenotypes, respectively, to create their complemented strains. The cellular chain length of these complemented strains was recovered to the same level as the wild-type (Fig. 2). By examining these longer and shorter mutants, we found 27 mutants showed clustered cellular morphology. These clusters were not dissolved by twofold BHI dilution. Comparing these clustered mutants with cellular chain length, we found that all of the clustered mutants formed longer chains. In addition, we examined the auto-aggregation of the mutants Ssx_1796, Ssx_0655 and Ssx_0816. The results showed that auto-aggregation ability was significantly reduced in Ssx_1796 with shorter chain length and increased in Ssx_0655 with longer chain length as well as in Ssx_0816 with clustered chains compared with the wild-type (Fig. 2). However, the auto-aggregation ability was recovered in their complemented strains. These results suggest a correlation between cellular chain length and bacterial cell aggregation.
Table 1. Twenty longest cellular chain length mutants.
See Table S1 for complete mutant list.
| Mutant | L (µm)* | P-value† | Product | COG | KEGG |
| Ssx_0655 | 37.02 | 2.23e−16 | Cell division protein FtsA | Cell division and chromosome partitioning | |
| Ssx_0499 | 32.65 | 1.44e−15 | ABC-type dipeptide transport system, periplasmic component | Amino acid transport and metabolism | ABC transporter |
| Ssx_1285 | 27.42 | 1.39e−08 | Hypothetical protein | ||
| Ssx_1270 | 27.39 | 7.11e−08 | Flavodoxin | Energy production and conversion | |
| Ssx_1306 | 27.09 | 3.99e−06 | Trk transporter NAD+ binding protein – K+ transport | Inorganic ion transport and metabolism | |
| Ssx_1958 | 26.82 | 8.84e−07 | Adaptor protein | ||
| Ssx_1266 | 26.66 | 5.64e−07 | CrcB-like protein 1 | Cell division and chromosome partitioning | |
| Ssx_0933 | 26.44 | 4.60e−07 | Acetyltransferase | General function prediction only | |
| Ssx_0860 | 25.80 | 8.71e−06 | N-Acetylmuramidase/lysin | Cell envelope biogenesis, outer membrane | |
| Ssx_0908 | 25.69 | 3.83e−06 | ABC-type uncharacterized transport system, periplasmic component | General function prediction only | |
| Ssx_0504 | 25.68 | 1.33e−06 | Peptide ABC transporter, ATP-binding protein | Amino acid transport and metabolism/inorganic ion transport and metabolism | ABC transporter |
| Ssx_0881 | 25.63 | 2.72e−05 | Putative lipoprotein | ||
| Ssx_0963 | 25.53 | 1.60e−09 | Peptidoglycan N-acetylglucosamine deacetylase A | ||
| Ssx_2224 | 25.43 | 1.61e−11 | Phosphotyrosine-protein phosphatase | Carbohydrate transport and metabolism/cell envelope biogenesis, outer membrane | |
| Ssx_1277 | 25.32 | 9.49e−07 | d-Alanyl-d-alanine carboxypeptidase | ||
| Ssx_0816 | 25.20 | 6.44e−07 | Copper transport operon or penicillinase transcription repressor | Transcription | Transcriptional regulator |
| Ssx_2146 | 25.07 | 1.92e−08 | Metallo-β-lactamase | General function prediction only | |
| Ssx_0144 | 25.01 | 5.14e−05 | TetR family transcriptional regulator | Transcription | Transcriptional regulator |
| Ssx_0207 | 24.97 | 6.31e−07 | Hypothetical protein | ||
| Ssx_1268 | 24.96 | 2.66e−06 | Hypothetical protein | Amino acid transport and metabolism | Phenylalanine, tyrosine and tryptophan biosynthesis |
L, cellular chain length.
P-value for statistically significant difference compared with SK36.
Table 2. Twenty shortest cellular chain length mutants.
See Table S1 for complete mutant list.
| Mutant | L (µm)* | P-value† | Product | COG | KEGG |
| Ssx_1116 | 5.01 | 3.52e−24 | Hypothetical protein | ||
| Ssx_1796 | 5.32 | 1.69e−24 | Transcription elongation factor GreA | Transcription | Transcriptional regulator |
| Ssx_1103 | 5.86 | 5.08e−20 | Hypothetical protein | ||
| Ssx_1110 | 6.10 | 5.97e−18 | Hypothetical protein | ||
| Ssx_2312 | 6.12 | 3.02e−22 | Hypothetical protein | ||
| Ssx_2147 | 6.20 | 1.32e−18 | Hypothetical protein | ||
| Ssx_0105 | 6.25 | 6.54e−14 | Uridine kinase | Nucleotide transport and metabolism | Pyrimidine metabolism |
| Ssx_2296 | 6.38 | 1.88e−21 | XRE family transcriptional regulator | Transcription | Transcriptional regulator |
| Ssx_2077 | 6.40 | 2.13e−15 | Hypothetical protein | General function prediction only | |
| Ssx_2337 | 6.41 | 7.03e−19 | Hypothetical protein | Function unknown | |
| Ssx_2152 | 6.43 | 1.10e−15 | ABC-type transporter (uncharacterized), ATPase component | General function prediction only | ABC transporter |
| Ssx_2333 | 6.51 | 9.01e−17 | Integral membrane protein | Cell envelope biogenesis, outer membrane | |
| Ssx_2250 | 6.52 | 8.40e−18 | Peptide ABC transporter permease | Function unknown | |
| Ssx_0773 | 6.64 | 9.18e−15 | PTS enzyme I | Carbohydrate transport and metabolism | Phosphotransferase system (PTS) |
| Ssx_2332 | 6.65 | 1.54e−18 | d-Alanine-poly(phosphoribitol) ligase subunit 2 | Lipid metabolism/secondary metabolites biosynthesis, transport and catabolism | d-Alanine metabolism |
| Ssx_1860 | 6.69 | 3.60e−16 | Penicillin-binding protein 1A | Cell envelope biogenesis, outer membrane | Peptidoglycan biosynthesis |
| Ssx_2285 | 6.77 | 1.40e−15 | Hypothetical protein | ||
| Ssx_2162 | 6.79 | 1.17e−12 | Hypothetical protein | ||
| Ssx_0148 | 6.83 | 7.10e−14 | Sugar ABC transporter, ATP-binding protein | Carbohydrate transport and metabolism | ABC transporter |
| Ssx_2141 | 6.83 | 3.19e−14 | Argininosuccinate lyase | Amino acid transport and metabolism | Alanine, aspartate and glutamate metabolism |
L, Cellular chain length.
P-value for statistically significant difference compared with SK36.
Fig. 2.
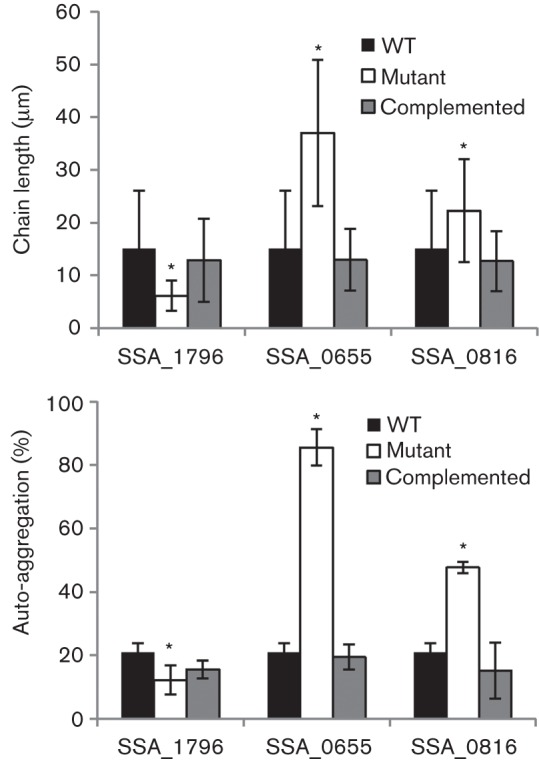
Cellular chain length and auto-aggregation of selected mutants and their complementation. Upper panel, the cellular chain lengths of mutants and their complemented strains were examined and compared with the wild-type (WT) as described in Methods. Lower panel, their auto-aggregations were determined by OD600 and the aggregation percentage was calculated as described in Methods. * P<0.05. Error bars indicate ±sd.
Longer chains related with cell division and chromosome partition
To analyse the longer and shorter chained mutants, we collected annotated gene functions for each mutant. Of the 307 cellular chain length related genes, 108 genes were annotated as hypothetical proteins. This suggested that many of these gene functions were new. To study functional categories, we examined gene assignments in COGs. COGs are delineated by comparing protein sequences encoded in complete genomes, representing major phylogenetic lineages in at least three different genomes (Tatusov et al., 2001). COG defines 18 different categories, including ‘information storage and processing’, ‘cellular processes’ and ‘metabolism’ functional annotations. Of 307 cellular chain length related mutants, 199 genes have annotated functions, including 127 with COG assignments. To profile the 127 cellular chain length related mutants by COG assignments, we compared the proportions of their assigned gene functions in COG. As indicated in Fig. 3, multiple COG functions were shown to relate with cellular chain length. This suggested that cellular chain length might present a complex microbial phenotype, relying on a number of genes and their interactions to yield the observed phenotypes. We then compared the proportions of COG functions for longer and shorter chains. This showed that analysis of both longer and shorter chains together resulted in the highest ratio of COG functions as ‘secondary metabolites biosynthesis, transport and catabolism’, followed by ‘inorganic ion transport and metabolism’. However, analysis of longer and shorter chains separately resulted in the highest ratio for longer chain mutants as ‘cell division and chromosome partitioning’, while the highest ratio for shorter chain mutants was ‘secondary metabolites biosynthesis, transport and catabolism’. Mutants with functions of ‘cell division and chromosome partitioning’ were all longer-chained.
Fig. 3.
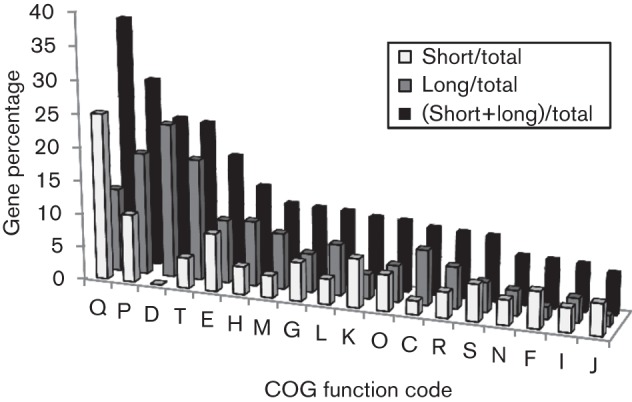
Cellular chain length related gene distribution by COG functions. The ratio between the number of longer chain or shorter chain mutants and the total number of annotated genes in the genome (gene percentage) was calculated for every COG function. COG function abbreviations: Q, secondary metabolites biosynthesis, transport and catabolism; P, inorganic ion transport and metabolism; D, cell division and chromosome partitioning; T, signal transduction mechanisms; E, amino acid transport and metabolism; H, coenzyme metabolism; M, cell envelope biogenesis, outer membrane; G, carbohydrate transport and metabolism; L, DNA replication, recombination and repair; K, transcription; O, post-translational modification, protein turnover, chaperones; C, energy production and conversion; R, general function prediction only; S, function unknown; N, cell motility and secretion; F, nucleotide transport and metabolism; I, lipid metabolism; J, translation, ribosomal structure and biogenesis.
TCSs related to cellular chain length
Interestingly, 12 genes related to cellular chain length were involved in ‘signal transduction mechanisms’ of COG annotation. Therefore, we examined mutants deficient in TCSs for their cellular morphology. TCSs are commonly found in bacteria and are composed of a membrane bound protein called a histidine kinase (HK) that senses environmental changes and autophosphorylates its own histidine residue. The HK signals to its corresponding cytosolic response regulator (RR) protein by transferring the phosphate to an aspartate residue. The RR undergoes a conformational change and induces a response by regulating gene transcription. Of all 29 genes for 15 TCSs in the S. sanguinis genome, we found that seven of the gene mutants showed statistical differences in cellular chain length morphology, including three HK – SSA_0205, SSA_0517 and SSA_1120 – and four RR – SSA_0217, SSA_1113, SSA_1119 and SSSA_1972. All seven TCS gene mutants formed longer chains (Table S1).
To determine if cellular chain length could be attributed to transcriptional regulation controlled by TCS response regulators and to find the cellular chain length related regulons, we performed microarray analysis to examine their gene expression profile. We selected mutant Ssx_1972 for further microarray analysis, which exhibited the longest cellular chain length phenotype in the four TCS RR mutants (Table 3). For 2270 total gene expressions in Ssx_1972, there were 119 genes downregulated and 111 genes upregulated by a twofold cut-off compared with SK36 (Table 3). We analysed the possible association of up- and downregulated genes for their contributions to the longer chain phenotype of Ssx_1972. Because the deletion of gene SSA_1972 in mutant Ssx_1972 showed a longer chain phenotype, we defined a gene whose mutant showed a longer chain and a decreased gene expression in Ssx_1972 as a positively related gene with SSA_1972. There were seven positively related genes, exhibiting longer chains in their mutants with downregulated gene expressions in Ssx_1972. These genes were SSA_0209, SSA_0531, SSA_0588, SSA_0724, SSA_0737, SSA_1275 and SSA_1284 (Table 3). In contrast, there were eight negatively related genes displaying shorter chains in their mutants with upregulated gene expressions in Ssx_1972. These genes were SSA_0759, SSA_0760, SSA_1715, SSA_1897, SSA_2117, SSA_2141, SSA_2159 and SSA_2337. All positively and negatively related genes should contribute to the cellular chain length of Ssx_1972. However, there were also downregulated genes showing shorter chain mutants (SSA_0142, SSA_0222, SSA_0393, SSA_1907, SSA_2077, SSA_2250) and upregulated genes showing longer chain mutants (SSA_0191, SSA_0215, SSA_0217, SSA_0678, SSA_0758, SSA_1218, SSA_1266, SSA_1900, SSA_2224, SSA_2233). This complicated result suggests that the longer chain of Ssx_1972 might be a comprehensive result of multiple gene regulations. This information again suggests multiple genes may be involved in cellular chain length formation.
Table 3. Gene expressions of shorter or longer chain genes in Ssx_1972, a longer chain mutant, compared with SK36.
| Locus | Gene | Product | Expression* | sd | Short† | Long† |
| SSA_0222 | – | PTS system, mannose-specific IID component | 0.1210 | 0.0583 | Y | |
| SSA_0393 | – | Bacteriocin ABC transporter permease/ATP-binding protein | 0.3499 | Y | ||
| SSA_1907 | – | Hypothetical protein SSA_1907 | 0.3932 | 0.0167 | Y | |
| SSA_2250 | – | Peptide ABC transporter permease | 0.4245 | 0.0125 | Y | |
| SSA_0142 | – | Hypothetical protein SSA_0142 | 0.4440 | 0.1035 | Y | |
| SSA_2077 | – | Hypothetical protein SSA_2077 | 0.4932 | 0.0512 | Y | |
| SSA_0759 | argB | Acetylglutamate kinase | 3.1950 | 0.6376 | Y | |
| SSA_0760 | – | Acetylornithine aminotransferase | 9.4869 | 4.9372 | Y | |
| SSA_1715 | serC | Phosphoserine aminotransferase | 2.0630 | 1.0319 | Y | |
| SSA_1897 | – | Hypothetical protein SSA_1897 | 2.2604 | 0.6261 | Y | |
| SSA_2117 | rmuC | DNA recombination protein RmuC | 2.5179 | 0.7197 | Y | |
| SSA_2141 | argH | Argininosuccinate lyase | 4.6751 | 3.6790 | Y | |
| SSA_2159 | – | Hypothetical protein SSA_2159 | 4.6105 | 1.8498 | Y | |
| SSA_2337 | – | Hypothetical protein SSA_2337 | 2.0824 | 0.5594 | Y | |
| SSA_0724 | – | Multidrug ABC transporter ATPase/permease | 0.3345 | Y | ||
| SSA_0209 | pepA | Glutamyl aminopeptidase | 0.4287 | 0.0893 | Y | |
| SSA_0737 | sagP | Arginine deiminase | 0.4317 | 0.1570 | Y | |
| SSA_0588 | – | l-Cystine ABC transporter, substrate-binding component | 0.4475 | 0.1851 | Y | |
| SSA_1284 | – | Hypothetical protein SSA_1284 | 0.4670 | Y | ||
| SSA_1275 | – | Hypothetical protein SSA_1275 | 0.4830 | 0.2878 | Y | |
| SSA_0531 | eutQ | Ethanolamine utilization protein EutQ | 0.4985 | 0.4339 | Y |
Relative expression in Ssx_1972 compared with SK36 using microarray analysis.
Y, Yes.
Ultrastructure of cellular chain length related mutants by SEM
To further examine longer chain mutants, we used SEM to observe the fine cellular surface morphology and ultrastructure. We selected two mutants, Ssx_0655 and Ssx_2223, for further examination. Ssx_0655 formed the longest chain compared with the other cellular chain length mutants (Tables 1 and S1) and SSA_2223 is a homologue of a reported chain length regulator, Wzd. Interestingly, SSA_0655 encoded the FtsA protein, which is an early component of the Z-ring, the structure that divides most bacteria, formed by tubulin-like FtsZ (Szwedziak et al. 2012), and plays an important role in cell division. SSA_2223 is annotated to be involved in capsular polysaccharide biosynthesis. The ultrastructure of Ssx_0665 and Ssx_2223 displayed larger cells and a thicker capsule to keep more cells in the chain. Ssx_0655 appeared to have wider and longer cells than SK36 (Fig. 4). Although Ssx_0655 cells still formed ring structures (Z-rings) for division, the cell shape was longer and fatter than SK36. For the Ssx_2223 mutant, there was a clear sheath surrounding the cells, which indicated more capsule present (Fig. 4). The thick sheath maintained cells in longer chains.
Fig. 4.
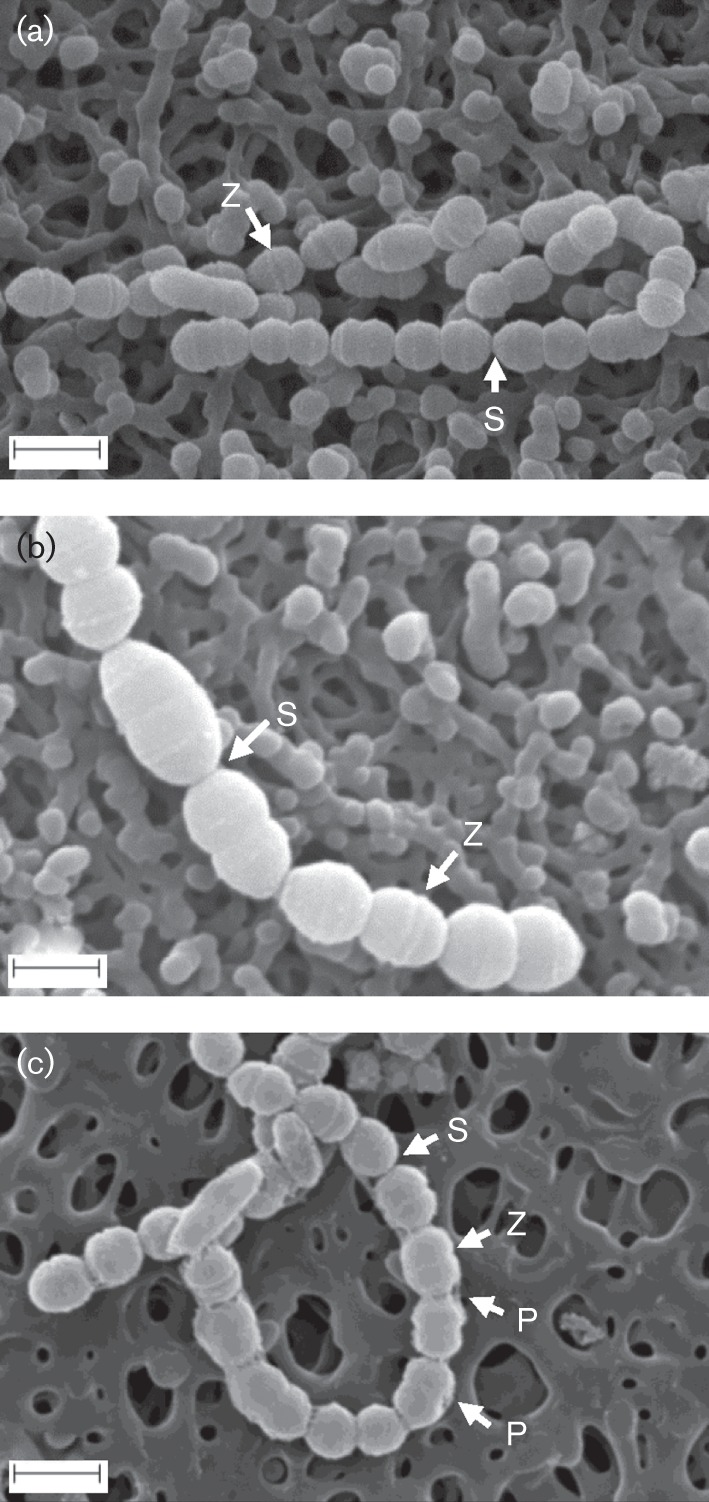
Cell morphological comparisons by SEM. (a) The wild-type strain SK36. (b) Ssx_0655, a cell division protein FtsA mutant, shows wider and longer cells. (c) Ssx_2223, a capsular polysaccharide biosynthesis protein Wzd (chain length regulator) mutant, shows clear capsule surrounding the cells. Septum (S), Z-ring (Z) and polysaccharide (P) are indicated. Bars, 1 μm.
Discussion
A systems biology approach was made possible by the availability of the genome-wide mutants of the S. sanguinis SK36 strain. In this study, we examined nearly all non-essential gene mutants previously created (Xu et al., 2011) for their possible involvement in cellular chain length. We identified over 300 mutants which showed statistically significant differences in length from SK36. It should be noted that our cellular chain length list was not complete. Some mutants may have been missed in this large-scale analysis for different reasons. For example, some mutants failed to grow after two inoculations from stocks and some were not recognized as having an altered cellular chain length through eyeball visualization and were missed in the final analysis. However, the analysis of identified mutants still presents meaningful insight into the association of gene functions and cellular chain length due to the large number of mutants analysed. Based on COG analysis, the highest gene ratio for longer chain mutants was ‘cell division and chromosome partitioning’ (Fig. 3). Three of the longer-chained mutants had deleted genes (SSA_0655, SSA_1266, SSA_2222) related to this function (Tables 1 and S1, COG code D).This finding was not surprising as the ability of cells to divide and separate would be an inherent factor contributing to cellular chain length. Chain formation in streptococci is the result of proper cell division that occurs on one plane in a designated area of the cell (Lara et al., 2005; Zapun et al., 2008). One of those longer chain mutants was Ssx_0655, whose deleted gene was annotated as cell division protein FtsA. The ftsA gene belongs to a cluster of cell division and cell wall synthesis genes in many bacteria and is important for septation although its exact role is unclear. In Escherichia coli, overexpression or deletion of the ftsA gene inhibits normal cell septation, which is attributed to the formation of longer septate filaments (Wang & Gayda, 1990). In Bacillus subtilis, ftsA mutations cause an abnormal Z-ring formation due to the loss of the recruitment of cell division proteins necessary for correct Z-ring assembly (Jensen et al., 2005). The FtsA protein localizes to the equatorial zones of dividing cells where it interacts with FtsZ, a tubulin-like protein, forming the septal ring (Lara et al., 2005). In S. sanguinis, the ftsZ gene was found to be essential so we were not able to examine its mutant morphology (Xu et al., 2011). Although the ftsA gene is not essential; its absence has been observed to have a significant effect on cell division and chain morphology. We hypothesized that longer chains are formed by enlarged cells that do not properly divide. SEM analysis (Fig. 4a) showed that individual cells of the Ssx_0655 mutant were larger than wild-type SK36 due to a defect in cell septation. The two other longer chain mutants whose genes were related with ‘cell division and chromosome partitioning’ in COG were SSA_1266 and SSA_2222. SSA_1266 encodes a camphor resistance protein, CrcB. CrcB, an integral membrane protein, may be involved in chromosome condensation (Sand et al., 2003). Several genes in the same operon, including SSA_1267, SSA_1268, SSA_1269 and SSA_1270, all showed the same longer chain morphology, suggesting they share a similar function with SSA_1266. SSA_2222 has been annotated as Wze, a cytoplasmic tyrosine kinase. SSA_2222 may be responsible for the phosphorylation of its neighbouring gene product, SSA_2223. SSA_2223, annotated as Wzd, is a chain length regulator involved in capsular polysaccharide biosynthesis. SSA_2222 may control polysaccharide biosynthesis through phosphorylation of tyrosine residues on its neighbouring gene product SSA_2223. In turn, phosphorylation of tyrosine residues in SSA_2223 changes the enzyme activity in capsular polysaccharide biosynthesis. The mutant of SSA_2223 also showed longer chain morphology (Table S1, Fig. 4). It has been reported that Wze interacts with Wzd to regulate the rate of capsule polysaccharide biosynthesis in Streptococcus thermophilus (Cefalo et al., 2011). It has also been reported that Wzd- and Wze-encoding genes are co-expressed and their interactions are required for synthesis of capsular polysaccharide at the division septa in S. pneumoniae (Henriques et al., 2011). The mutant of SSA_2224 which showed a longer chain phenotype may also control SSA_2223, similar to SSA_2222. SSA_2224 encodes a phosphotyrosine-protein phosphatase. Although the three genes (SSA_0655, SSA_1266 and SSA_2222) are involved in different mechanisms they are all in COG classification ‘cell division and chromosome partitioning’. SSA_0655 is involved in cell division and cell wall synthesis, SSA_1266 is involved in chromosome condensation and SSA_2222 is involved in the synthesis of capsular polysaccharide. Again these results indicate the complex mechanisms involved in cellular chain length. Multiple gene functions may be responsible for the altered length phenotype in S. sanguinis.
Acknowledgements
This work was supported by National Institutes of Health grants R01DE018138 and R01DE023078 (to P. X.) and, in part, by Virginia Commonwealth University Presidential Research Incentive Program (PRIP) 144602-3 (to P. X.). We appreciate Dr Al Best for consulting with us on the statistical analysis. We thank Tara J. Nulton for technical assistance with the complementation and auto-aggregation assays. SEM was performed at the Virginia Commonwealth University Department of Anatomy and Neurobiology Microscopy Facility. We also thank the Pathogen Functional Genomics Resource Center at JCVI for providing S. sanguinis-spotted microarray slides.
Abbreviations:
- COG
cluster of orthologous groups
- KEGG
Kyoto Encyclopedia of Genes and Genomes
- SEM
scanning electron microscopy
- TCS
two-component system
Footnotes
A supplementary table is available with the online version of this paper.
References
- Ahmed R., Hassall T., Morland B., Gray J. (2003). Viridans streptococcus bacteremia in children on chemotherapy for cancer: an underestimated problem. Pediatr Hematol Oncol 20, 439–444. [PubMed] [Google Scholar]
- Cefalo A. D., Broadbent J. R., Welker D. L. (2011). Protein-protein interactions among the components of the biosynthetic machinery responsible for exopolysaccharide production in Streptococcus thermophilus MR-1C. J Appl Microbiol 110, 801–812. 10.1111/j.1365-2672.2010.04935.x [DOI] [PubMed] [Google Scholar]
- Chen L., Ge X., Dou Y., Wang X., Patel J. R., Xu P. (2011). Identification of hydrogen peroxide production-related genes in Streptococcus sanguinis and their functional relationship with pyruvate oxidase. Microbiology 157, 13–20. 10.1099/mic.0.039669-0 [DOI] [PMC free article] [PubMed] [Google Scholar]
- Dalia A. B., Weiser J. N. (2011). Minimization of bacterial size allows for complement evasion and is overcome by the agglutinating effect of antibody. Cell Host Microbe 10, 486–496. 10.1016/j.chom.2011.09.009 [DOI] [PMC free article] [PubMed] [Google Scholar]
- Henriques M. X., Rodrigues T., Carido M., Ferreira L., Filipe S. R. (2011). Synthesis of capsular polysaccharide at the division septum of Streptococcus pneumoniae is dependent on a bacterial tyrosine kinase. Mol Microbiol 82, 515–534. 10.1111/j.1365-2958.2011.07828.x [DOI] [PubMed] [Google Scholar]
- Higgins M. L., Pooley H. M., Shockman G. D. (1970). Site of initiation of cellular autolysis in Streptococcus faecalis as seen by electron microscopy. J Bacteriol 103, 504–512. [DOI] [PMC free article] [PubMed] [Google Scholar]
- Jensen S. O., Thompson L. S., Harry E. J. (2005). Cell division in Bacillus subtilis: FtsZ and FtsA association is Z-ring independent, and FtsA is required for efficient midcell Z-ring assembly. J Bacteriol 187, 6536–6544. 10.1128/JB.187.18.6536-6544.2005 [DOI] [PMC free article] [PubMed] [Google Scholar]
- Kilian M., Holmgren K. (1981). Ecology and nature of immunoglobulin A1 protease-producing streptococci in the human oral cavity and pharynx. Infect Immun 31, 868–873. [DOI] [PMC free article] [PubMed] [Google Scholar]
- Kilian M., Mikkelsen L., Henrichsen J. (1989). Taxonomic study of viridans streptococci: description of Streptococcus gordonii sp. nov. and emended descriptions of Streptococcus sanguis (White and Niven 1946), Streptococcus oralis (Bridge and Sneath 1982), and Streptococcus mitis (Andrewes and Horder 1906). Int J Syst Bacteriol 39, 471–484. 10.1099/00207713-39-4-471 [DOI] [Google Scholar]
- Kolenbrander P. E. (2000). Oral microbial communities: biofilms, interactions, and genetic systems. Annu Rev Microbiol 54, 413–437. 10.1146/annurev.micro.54.1.413 [DOI] [PubMed] [Google Scholar]
- Kolenbrander P. E., London J. (1993). Adhere today, here tomorrow: oral bacterial adherence. J Bacteriol 175, 3247–3252. [DOI] [PMC free article] [PubMed] [Google Scholar]
- Lara B., Rico A. I., Petruzzelli S., Santona A., Dumas J., Biton J., Vicente M., Mingorance J., Massidda O. (2005). Cell division in cocci: localization and properties of the Streptococcus pneumoniae FtsA protein. Mol Microbiol 55, 699–711. 10.1111/j.1365-2958.2004.04432.x [DOI] [PubMed] [Google Scholar]
- Luo F., Lizano S., Banik S., Zhang H., Bessen D. E. (2008). Role of Mga in group A streptococcal infection at the skin epithelium. Microb Pathog 45, 217–224. 10.1016/j.micpath.2008.05.009 [DOI] [PMC free article] [PubMed] [Google Scholar]
- Murchison H., Larrimore S., Hull S., Curtiss R., III (1982). Isolation and characterization of Streptococcus mutans mutants with altered cellular morphology or chain length. Infect Immun 38, 282–291. [DOI] [PMC free article] [PubMed] [Google Scholar]
- Nakano K., Fujita K., Nishimura K., Nomura R., Ooshima T. (2005). Contribution of biofilm regulatory protein A of Streptococcus mutans to systemic virulence. Microbes Infect 7, 1246–1255. 10.1016/j.micinf.2005.04.012 [DOI] [PubMed] [Google Scholar]
- Sand O., Gingras M., Beck N., Hall C., Trun N. (2003). Phenotypic characterization of overexpression or deletion of the Escherichia coli crcA, cspE and crcB genes. Microbiology 149, 2107–2117. 10.1099/mic.0.26363-0 [DOI] [PubMed] [Google Scholar]
- Socransky S. S., Manganiello A. D., Propas D., Oram V., Van Houte J. (1977). Bacteriological studies of developing supragingival dental plaque. J Periodontal Res 12, 90–106. 10.1111/j.1600-0765.1977.tb00112.x [DOI] [PubMed] [Google Scholar]
- Szwedziak P., Wang Q., Freund S. M., Löwe J. (2012). FtsA forms actin-like protofilaments. EMBO J 31, 2249–2260. 10.1038/emboj.2012.76 [DOI] [PMC free article] [PubMed] [Google Scholar]
- Tatusov R. L., Natale D. A., Garkavtsev I. V., Tatusova T. A., Shankavaram U. T., Rao B. S., Kiryutin B., Galperin M. Y., Fedorova N. D., Koonin E. V. (2001). The COG database: new developments in phylogenetic classification of proteins from complete genomes. Nucleic Acids Res 29, 22–28. 10.1093/nar/29.1.22 [DOI] [PMC free article] [PubMed] [Google Scholar]
- Thibodeau E. A., Ford C. M. (1991). Chain formation and de-chaining in Streptococcus sobrinus SL-1. Oral Microbiol Immunol 6, 313–315. 10.1111/j.1399-302X.1991.tb00500.x [DOI] [PubMed] [Google Scholar]
- Truper H., De’clari L. (1997). Taxonomic note: necessary corrections of specific epithets formed as substantives (nouns) “in apposition”. Int J Syst Bacteriol 47, 908–909. 10.1099/00207713-47-3-908 [DOI] [Google Scholar]
- Turner L. S., Kanamoto T., Unoki T., Munro C. L., Wu H., Kitten T. (2009). Comprehensive evaluation of Streptococcus sanguinis cell wall-anchored proteins in early infective endocarditis. Infect Immun 77, 4966–4975. 10.1128/IAI.00760-09 [DOI] [PMC free article] [PubMed] [Google Scholar]
- Wang H. C., Gayda R. C. (1990). High-level expression of the FtsA protein inhibits cell septation in Escherichia coli K-12. J Bacteriol 172, 4736–4740. [DOI] [PMC free article] [PubMed] [Google Scholar]
- Wen Z. T., Burne R. A. (2002). Functional genomics approach to identifying genes required for biofilm development by Streptococcus mutans. Appl Environ Microbiol 68, 1196–1203. 10.1128/AEM.68.3.1196-1203.2002 [DOI] [PMC free article] [PubMed] [Google Scholar]
- Xu P., Alves J. M., Kitten T., Brown A., Chen Z., Ozaki L. S., Manque P., Ge X., Serrano M. G. & other authors (2007). Genome of the opportunistic pathogen Streptococcus sanguinis. J Bacteriol 189, 3166–3175. 10.1128/JB.01808-06 [DOI] [PMC free article] [PubMed] [Google Scholar]
- Xu P., Ge X., Chen L., Wang X., Dou Y., Xu J. Z., Patel J. R., Stone V., Trinh M. & other authors (2011). Genome-wide essential gene identification in Streptococcus sanguinis. Sci Rep 1, 125. 10.1038/srep00125 [DOI] [PMC free article] [PubMed] [Google Scholar]
- Zapun A., Vernet T., Pinho M. G. (2008). The different shapes of cocci. FEMS Microbiol Rev 32, 345–360. 10.1111/j.1574-6976.2007.00098.x [DOI] [PubMed] [Google Scholar]