


Abstract
Correctly estimating isoform-specific gene expression is important for understanding complicated biological mechanisms and for mapping disease susceptibility genes. However, estimating isoform-specific gene expression is challenging because various biases present in RNA-Seq (RNA sequencing) data complicate the analysis, and if not appropriately corrected, can affect isoform expression estimation and downstream analysis. In this article, we present PennSeq, a statistical method that allows each isoform to have its own non-uniform read distribution. Instead of making parametric assumptions, we give adequate weight to the underlying data by the use of a non-parametric approach. Our rationale is that regardless what factors lead to non-uniformity, whether it is due to hexamer priming bias, local sequence bias, positional bias, RNA degradation, mapping bias or other unknown reasons, the probability that a fragment is sampled from a particular region will be reflected in the aligned data. This empirical approach thus maximally reflects the true underlying non-uniform read distribution. We evaluate the performance of PennSeq using both simulated data with known ground truth, and using two real Illumina RNA-Seq data sets including one with quantitative real time polymerase chain reaction measurements. Our results indicate superior performance of PennSeq over existing methods, particularly for isoforms demonstrating severe non-uniformity. PennSeq is freely available for download at http://sourceforge.net/projects/pennseq.
INTRODUCTION
Transcriptomics studies using RNA sequencing (RNA-Seq) provide a promising avenue for characterization and understanding of the molecular basis of human diseases. In the past decade, microarrays have been the method of choice for transcriptomics studies due to their ability to measure thousands of transcripts simultaneously (1). However, microarrays are subject to biases in hybridization strength and potential for cross-hybridization to probes with similar sequences (2). Recently, RNA-Seq has emerged as a new approach for transcriptome profiling. With high coverage and single nucleotide resolution, RNA-Seq can be used to study expressions of genes or isoforms, alternative splicing, non-coding RNAs, post-transcriptional modifications and gene fusions (3). RNA-Seq is arguably the most complex next-generation sequencing data we face. Unlike DNA sequencing, RNA-Seq yields many dimensions of data. A number of analytical and computational challenges must be overcome before we can fully reap the benefit of this new technology.
In this article, we present our work on estimating isoform-specific gene expression while allowing for non-uniform read distribution along transcripts. Knowledge of isoform expressions is of fundamental biological interest to researchers due to their direct relevance to protein function and disease pathogenesis. Recent evidence suggests that almost all multiexon human genes have more than one isoform (4), and different isoforms are often differentially expressed across different tissues, developmental stages and disease conditions. Therefore, correctly estimating isoform-specific gene expression is important for understanding complicated biological mechanisms and for mapping disease susceptibility genes using expression quantitative trait locus (eQTL) or splicing QTL approaches (5,6).
However, estimating isoform-specific gene expression is challenging because the current technologies can only sequence complementary DND (cDNA) molecules that represent partial fragments of the RNA. Additionally, most reads that are mapped to a gene are shared by more than one isoform, making it difficult to discern their isoform origin. An even more serious issue that complicates gene expression estimation is various biases present in RNA-Seq data. Many methods for estimating gene expression in RNA-Seq assume the sequenced fragments (or reads) are uniformly distributed along transcripts (7–10), i.e. the starting positions of sequenced fragments are chosen approximately uniformly along a transcript. Under this assumption, it is straightforward to model read counts using a Poisson distribution (7,10). However, it is widely acknowledged that the true distribution of fragment start positions deviates substantially from uniformity and varies with the fragmentation protocol and sequencing technology. In the presence of such bias, the accuracy of isoform expression inference based on the uniformity assumption will deteriorate.
Li et al. (11) showed that correcting bias caused by local sequence difference significantly increased the accuracy of gene expression quantification; for genes demonstrating high degree of non-uniformity, their correction led to 26–63% relative improvement for accuracy. Although encouraging, this method only considers bias due to local sequence difference. As shown by Li et al. (11), only <50% of the non-uniformity can be explained by local sequence difference. Recognizing the importance of this problem, several other methods have been developed. Li and Dewey (12,13) modeled the empirical read distribution using all mapped reads in the transcriptome, whereas Wu et al. (14) considered gene-specific empirical distribution. Lin et al. (15) proposed a parametric model that specifically models the non-uniformity caused by RNA degradation. Roberts et al. (16) developed a variable length Markov model that corrects both sequence and positional bias. Nicolae et al. (17) implemented a reweighting scheme to correct for hexamer and repeat bias (18). More recently, Li et al. (19) proposed a quasi-multinomial model with a single parameter to capture positional, sequence and mapping biases. Although these methods have advanced the field, they either oversimplify the problem or provide complex solutions, neither of which is ideal.
Empirical studies indicate that the non-uniform read distributions are complex, and parametric models are unlikely to capture all factors that lead to non-uniformity. In this article, we present PennSeq, a statistical method that allows each isoform to have its own non-uniform read distribution. Instead of making parametric assumptions, we give adequate weight to the underlying data by the use of a non-parametric approach. We evaluate the performance of PennSeq using both simulated data with known ground truth, and using two real Illumina RNA-Seq data sets. Our results indicate superior performance of PennSeq over existing methods in isoform-specific gene expression quantification, particularly for isoforms demonstrating severe non-uniformity.
MATERIALS AND METHODS
Notations
In a typical RNA-Seq experiment, a population of RNA, typically poly-A-selected messenger RNAs, is converted into cDNA by reverse transcription. Those reverse-transcribed cDNAs are then fragmented and undergo a size selection procedure in which fragments with size within a certain range are kept in the library. Each fragment in the library is then sequenced in a high-throughput manner to obtain short sequences from both ends in paired-end sequencing. Following the sequencing experiment, the resulting sequenced reads are then either aligned to a reference genome or a reference transcriptome.
Because isoform expression estimation is done at a gene-by-gene basis, later in the text we describe the analysis for a particular gene only. Let R denote the set of read pairs that are mapped to a gene of interest, and I denote the set of known isoforms of the gene. For a specific isoform i ∈ I, let li denote its length and θi denote its relative abundance, with  and
and  . Because the length of each fragment is not fixed, we treat it as a random variable with distribution function F(·). Following Trapnell et al. (8), we estimate F empirically from the data. The effective length for isoform i, which reflects the number of possible start positions that a selected fragment can be sampled, is
 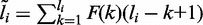 . The probability that a read pair originates from isoform i is
 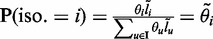 . For read pair r with alignment start position s, let Li(r, s) denote the fragment length implied by r’s alignment to isoform i. We define ZR,I as a |R| × |I| matrix with ZR,I(r, i) = 1 if r is generated from a fragment that originates from isoform i, and ZR,I(r, i) = 0 otherwise. Our goal is to estimate
  based on RNA-Seq reads mapped to the gene of interest.
Complete data likelihood
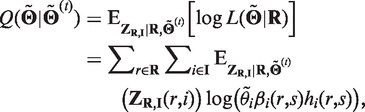
With the aforementioned notations, the complete data likelihood of the RNA-Seq data can be written as
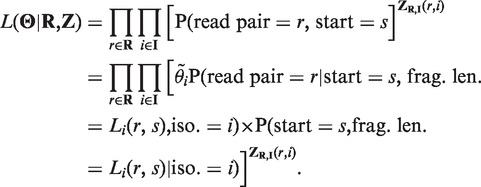 |
The above calculation uses the fact that given the isoform origin and alignment start position, the fragment length of a read pair can be inferred. The conditional probability of a read pair r derived from isoform i with start position s is
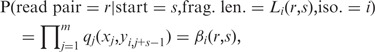 |
where x is the sequence of read pair r, yi is the sequence of isoform i and m is the length of the read pair. The value of qj(a, b) is the probability that we observe base a at position j of the read pair given that the true base is b, which can be calculated as 1–10−Qj/10, with Qj being the per-base Phred quality score at position j. Key to the aforementioned likelihood calculation is on the modeling of hi(r, s) = P(start = s, frag. len. = Li(r, s) | iso. = i). Most existing methods assume that the read start position is uniformly distributed. Under this assumption, hi(r, s) can be modeled by 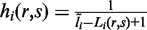 . However, this uniform assumption often does not hold in real data. Our experience with analysis of various real data sets suggests that the non-uniform read distribution has complicated forms and is unlikely to be fully captured by parametric models. Later in the text we describe a non-parametric approach to estimate hi(r, s).
Modeling of read start distribution
Suppose for each read pair r, we know its isoform origin and the total number of bases that are mapped to the isoform. Then a natural way of modeling hi(r, s) is to let it reflect the probability that a randomly selected read pair maps to the region spanned by r. Analytically, this can be written as 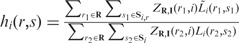 where the numerator represents the number of bases from isoform i that fall within the region spanned by r (shaded area in Figure 1), and the denominator represents the total number of bases from isoform i (overall area in Figure 1). Here Si is the set that contains all possible start positions within isoform i, and Si,r = [s, s + Li(r, s) – 1] is the interval spanned by r. For any read pair r1 chosen from the rest of the aligned RNA-Seq reads,
  is the length of r1 that overlaps with Si,r.
Figure 1.

Illustration of the empirical modeling of non-uniform read distribution. Displayed is the coverage plot for isoform i, which has six exons colored in green. The red box indicates a read pair r that is under consideration. The mapping start position of r is s and end position is s + Li(r, s) – 1, where Li(r, s) is the length of the fragment from which r originates. The shaded gray area indicates the region that is spanned by r.
Unlike the previous approaches (11,15,19,20), the aforementioned modeling of hi(r, s) does not make any parametric assumptions. Our rationale is that regardless what factors lead to non-uniformity, the probability that a fragment is sampled from a particular region of a transcript will always be reflected in the aligned data. This empirical approach thus maximally reflects the true underlying non-uniform read distribution. In practice, the isoform origin of a read pair is unobserved. We can treat hi(r, s) as an unknown quantity and estimate it non-parametrically in an EM algorithm as described later in the text. Although feasible, this approach is computationally prohibitive, as it requires the calculation of per-base coverage during every EM update. To speed up the calculation, we propose an estimate of hi(r, s) by approximating the isoform-specific read distribution. Specifically, for isoform informative reads, we assign them to the corresponding isoforms; for those non-informative reads, we assign them to all compatible isoforms. Once the isoform-specific read distribution is determined, we can easily estimate hi(r, s) based on the procedure illustrated in Figure 1. Our results indicate this approximation works well in both simulated and real data.
Parameter estimation using the expectation-maximization algorithm
We are interested in inferring  from which we can infer Θ based on the fact that
 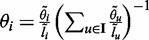 (8,12). The complete data likelihood is
and the update procedure of the EM algorithm is as follows: E-step: Calculate
 |
where 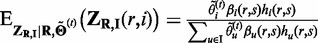 .
.
M-step: Maximize  , and this gives
 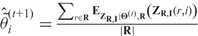 .
.
The EM algorithm consists of alternating between the E- and M-steps until convergence. We start the algorithm with  assuming all isoforms are equally expressed and stop when the log likelihood is no longer increasing significantly.
Quantification of isoform expression level
What we obtained above are the estimates of relative abundance of each isoform, which is useful in splicing QTL analysis (5,21). In addition to relative abundance, it is also important to quantify the absolute expression level of an isoform, and the obtained measurements can be used in differential expression (22–24) or eQTL analyses (21). For paired-end RNA-Seq data, the standard is to report Fragments per Kilobase of transcript per Million mapped reads (FPKM) (8,25). FPKM is defined as 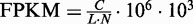 , where C is the total number of fragments (or read pairs) mapped in a region of interest, N is the total number of mapped reads in the experiment and L is the length of the region. With this FPKM concept, we can estimate the expression level of a particular isoform. The estimate is similar to what is described earlier in the text, except that we need to replace C by the estimated number of read pairs that originate from isoform i, i.e.
  .
.
RESULTS
In this section, we evaluate the performance of PennSeq on both simulated and real RNA-Seq data and compare it with five existing algorithms, including Cufflinks (8,25), CEM (19), RD (15), IsoEM (17) and iReckon (9).
Simulations
RNA-Seq data simulation
To evaluate the performance of PennSeq, we conducted simulations and compared it with other state-of-the-art algorithms for isoform expression estimation. To simulate a realistic data set with known ground truth, we used the Flux Simulator (26), which simulates paired-end RNA-Seq data by modeling RNA-Seq experiments in silico. The human genome sequence (hg19, NCBI build 37) was downloaded from University of California, Santa Cruz, together with the coordinates of the isoforms in the refGene table. The Flux Simulator program assigns an abundance value for each isoform following a mixed power/exponential law. Additionally, it simulates common sources of systematic bias in the abundance and distribution of produced reads by in silico library preparation and sequencing. Using the Flux Simulator, we generated 100 million (100 M) 76-bp paired-end reads. To evaluate the impact of sequencing depth on isoform expression estimation, we randomly selected 10, 20 and 60 million reads from the simulated data, and denoted these subsets by 10 M, 20 M and 60 M, respectively. For each dataset, the simulated RNA-Seq reads were mapped to the reference genome using Tophat (27). We then picked all expressed genes (covered by at least 10 read pairs) with two or more isoforms in our evaluation (note: relative abundance for genes with a single isoform is 1, thus there is no need to estimate its relative abundance). For each gene, we estimated the isoform relative abundance using PennSeq, Cufflinks (8,25), CEM (19), RD (15), IsoEM (17) and iReckon (9). For Cufflinks and CEM, we implemented both the bias-correction version and the non–bias-correction version. We denote the bias-correction versions as Cufflinks-bias and CEM-bias. For IsoEM, we implemented its bias-correction version only. All methods were run with the same set of aligned reads as input and were asked to estimate isoform expression for all genes annotated by refSeq. Command lines used in each program were provided in Supplementary Data.
The characteristics of the simulated data are shown in Figure 2. The median numbers of read pairs mapped in each gene in the 10 M, 20 M, 60 M and 100 M data sets are 200, 402, 1208 and 2015, respectively. Among the evaluated genes, 49% have two isoforms, 24% have three isoforms and 27% have four or more isoforms. The simulated isoforms have a wide range of relative abundance (interquartile range = 0.75, median = 0.041). Additionally, the coverage plots of the simulated data resemble those seen in real studies, demonstrating various biases. These simulated data thus provide an ideal basis to evaluate the performance of PennSeq as the ground truth is known.
Figure 2.

Characteristics of the simulated data. (A) Distribution of the number of read pairs in each gene. (B) Distribution of genes by the number of isoforms in each gene. (C) Distribution of the isoform relative abundance. (D) Coverage plots for three randomly selected genes.
Comparison of estimation accuracy
We explored several measures to quantify the estimation accuracy of each method. First, we measured the similarity between the estimated isoform relative abundance and the ground truth by calculating R2, the coefficient of determination (i.e. squared Pearson correlation coefficient). This measure has been used by various methods including Cufflinks (8,25), IsoEM (17) and CEM (19). Second, we measured the estimation accuracy by calculating the root mean squared error (RMSE), defined as  , where the summation is taken over all genes and all isoforms within each gene and n is the total number of isoforms across all genes. Third, we calculated the fraction of genes that have incorrectly inferred major isoforms. The major isoform of a gene is defined as the most abundant isoform of the gene.
Figure 3 (Supplementary Figure S1 and S2) shows the R2 values of all methods. PennSeq clearly has the highest R2 values across all data sets. Compared with the second-best performing method, CEM-bias, PennSeq has 5.3–10.1% higher R2. For CEM, the bias-correction version leads to noticeable improvement in R2 compared with its non–bias-correction version. In contrast, the bias-correction version of Cufflinks offers only limited improvement over its non–bias-correction version. Because iReckon (9) assumes reads are uniformly distributed, it is not surprising that it generally yields the lowest R2.
Figure 3.

R2 between estimated and true isoform relative abundance for the simulated data. (A) All isoforms. (B) Isoforms are stratified by the fraction of coverage. The left panel is for those isoforms in which <50% of the transcripts are covered by reads, and the right panel is for the remaining isoforms. (C) Isoforms are stratified by the chi-squared goodness of fit statistic for uniformity. The left panel is for those isoforms in which the chi-squared statistic is greater than the median, and the right panel is for the remaining isoforms. (D) Percent R2 improvement of PennSeq over CEM-bias.
Next, we evaluated the impact of the degree of non-uniformity in read coverage on isoform expression estimation. We considered two measures to quantify the degree of non-uniformity. The first measure is the fraction of coverage, defined as the fraction of the transcript that is covered by reads. The second measure is the chi-squared statistic that measures the goodness-of-fit of coverage uniformity. These two measures were calculated internally by the Flux Simulator. For each measure, we divided the isoforms into two categories based on the median of the corresponding measure. Not surprisingly, for isoforms that have fraction of coverage <50% or chi-squared statistic greater than the median, the R2 values are generally lower than the other isoforms. Despite the reduced R2 values, PennSeq appears to be much more accurate than the other methods, especially when the sequencing depth is low. For example, in the 10 M data set, for isoforms that have fraction of coverage <50%, the R2 value of CEM-bias is only 0.38, whereas the corresponding value of PennSeq is 0.49, which is 31% higher; similarly, for isoforms that have chi-squared statistic greater than the median, the R2 value of PennSeq is 15% higher than CEM-bias. We observed similar patterns for data sets with higher sequencing depth (Supplementary Figures S3 and S4). These results clearly demonstrate the advantage of PennSeq when the read distribution is not uniform.
The superior performance of PennSeq is also revealed by the RMSE (Figure 4; Supplementary Figures S5 and S6). Among all tested methods, PennSeq has the smallest RMSE. Compared with the second-best performing method, CEM-bias, the RMSE values of PennSeq are 13–16% smaller. Stratified analysis by the degree of non-uniformity yields a similar pattern. The percentage of RMSE reduction is most notable for isoforms that have the fraction of coverage <50%.
Figure 4.

RMSE between estimated and true isoform relative abundance for the simulated data. (A) All isoforms. (B) Isoforms are stratified by the fraction of coverage. The left panel is for those isoforms in which <50% of the transcript is covered by reads, and the right panel is for the remaining isoforms. (C) Isoforms are stratified by the chi-squared goodness of fit statistic for uniformity. The left panel is for those isoforms in which the chi-squared statistic is greater than the median, and the right panel is for the remaining isoforms. (D) Percent RMSE reduction of PennSeq over CEM-bias.
Next, we examined whether the major isoform of each gene can be correctly inferred. Correct identification of the major isoform is important, as the major isoform might lead to more biological consequence due to the more abundant protein product. As expected, PennSeq outperforms other methods (Figure 5; Supplementary Figures S7 and S8). Its error rate is 5–16% lower than CEM-bias. Further examination of those genes with incorrectly inferred major isoforms reveals that the relative abundance difference between the most abundant and second-most abundant isoforms is often small, thus making the inference of the major isoforms difficult. To better discern the major isoforms, we next restricted our analysis to those genes with well-defined major isoforms by requiring the relative abundance difference between the most abundant and second-most abundant isoforms to be >0.2. Not surprisingly, the error rates of all methods are reduced with PennSeq, RD, IsoEM and iReckon having error rates ∼5%. Stratified analysis by the degree of non-uniformity suggests that when the fraction of coverage for the true major isoforms is <50% or when the chi-squared statistic is greater than the median, CEM-bias, CEM and Cufflinks have much higher error rates than PennSeq, RD, IsoEM and iReckon.
Figure 5.

Percentage of genes with incorrectly inferred major isoforms for the simulated data. (A) All genes. (B) Genes with well-defined major isoforms, i.e. the relative abundance difference between the most abundant and second-most abundant isoforms is >0.2. (C) Genes with well-defined major isoforms stratified by the fraction of coverage of the true major isoform. The left panel is for those genes in which <50% of the true major isoform is covered by reads, and the right panel is for the remaining genes. (D) Genes with well-defined major isoforms stratified by the chi-squared goodness of fit statistic for uniformity of the true major isoform. The left panel is for those genes in which the chi-squared statistic of the true isoform is greater than the median, and the right panel is for the remaining genes.
We note that IsoEM only returned isoform expression estimates for 20–50% of all tested genes, and the returned genes are different from run to run even on the same data set using the same command. Owing to this reason, results on IsoEM should be interpreted with caution. iReckon also failed to return expression estimates for a notable number of genes (∼7%) due to unknown reasons.
Application to the MicroArray Quality Control data
We recognize that data sets generated by simulations depend on the parameterization and the assumptions of the selected model. Moreover, such data sets may constitute only a partial representation of reality as the complexity of RNA-Seq data is hard to mimic. To evaluate the performance of PennSeq in real studies, we analyzed the Human Brain Reference (HBR) and the Universal Human Reference (UHR) RNA-Seq data sets from the MicroArray Quality Control (MAQC) project (28). Both samples were sequenced using Illumina GenomeAnalyzer using seven lanes, yielding 35-bp single-end data (29). The RNA-Seq data were downloaded from NCBI Read Archive under accession number SRA010153. As part of the MAQC project, the expression levels of 894 transcripts were also measured by TaqMan Gene Expression Assay based on quantitative real time polymerase chain reaction (qRT-PCR) technology. The qRT-PCR measurements were downloaded from Gene Expression Omnibus under accession number GSE5350.
For each sample, we analyzed one lane of the sequenced reads and mapped them to the reference genome using Tophat (27). We then estimated isoform-specific expression for all refSeq-annotated genes. The qRT-PCR measures were treated as the gold standard when comparing different methods. We note that 563 of the 894 transcripts with qRT-PCR measurements are from genes with a single isoform. Because estimating isoform-specific expression for these single-transcript genes is trivial, to better assess the performance of different methods, we only considered those transcripts that are derived from genes with two or more isoforms. We did not analyze the data using IsoEM because of its unreliable performance. iReckon was also excluded from comparison because it cannot handle single-end reads. For the other programs, we used the same command line options as we did in the simulations (Supplementary Data).
As shown in Figure 6, the estimation accuracy of all methods is significantly lower than simulated data. This could be due to several reasons. First, the MAQC data are 35-bp single-end. Compared with the simulated data with 76-bp paired-end reads, this data set contains much less isoform-informative reads, leading to more uncertainty in the estimation. Second, the qRT-PCR measures may not be accurate, especially for those transcripts with qRT-PCR measures close to 0. Nevertheless, the relative performance of the different methods is consistent with the simulation results, with PennSeq clearly outperforming the other methods. For HBR, the R2 value of PennSeq is 0.42, whereas the corresponding value from the second-best performing method, CEM, is only 0.23. For UHR, Cufflinks-bias seems to correlate with the qRT-PCR measurements better than CEM and CEM-bias, but its R2 value is still substantially lower than PennSeq. Comparison of different methods using Spearman correlation reveals a similar pattern. The better performance of PennSeq is likely due to its more accurate estimation for those lowly expressed transcripts. As shown in Figure 6, the estimated FPKMs from PennSeq demonstrate an almost linear relationship with the qRT-PCR measurements in log-scale. However, many of the lowly to moderately expressed transcripts were underestimated using the other methods with their FPKM values being compacted toward 0. Our further examination reveals that these isoforms are typically from genes with severe non-uniformity and low-to-moderate coverage. This is consistent with what is observed in the simulations (Supplementary Figure S2).
Figure 6.

Comparison of different methods using the MAQC data. (A) Scatter plot of estimated isoform-specific FPKMs versus qRT-PCR measurements in the log scale for the HBR sample. (B) Scatter plot of estimated isoform-specific FPKMs versus qRT-PCR measurements in the log scale for the UHR sample. (C) Red bar is R2 between estimated isoform-specific FPKMs and qRT-PCR measurements in the log scale, and blue bar is Spearman correlation between estimated isoform-specific FPKMs and qRT-PCR measurements.
Because the MAQC data include seven lanes of reads for both HBR and UHR, this allows us to evaluate the reproducibility of PennSeq and other competing methods. We analyzed the remaining six lanes of HBR and calculated the pairwise Spearman correlation of estimated isoform expression levels between different lanes for each method. As shown in Supplementary Table S1, PennSeq consistently has higher Spearman correlations than the other competing methods, suggesting that PennSeq can achieve higher reproducibility between replicates than other methods.
Because EM algorithm is deterministic, as a quality check, we further evaluated whether the PennSeq estimation is robust to parameter initialization, especially for genes with a large number of isoforms. Based on the MAQC HBR data set, we re-estimated isoform expression levels using different starting values in the EM algorithm. The initial values were randomly chosen from Uniform (0, 1) distribution and rescaled so that the sum of the initial values was equal to 1. We generated two sets of initial values and plotted the estimated isoform expression levels. As shown in Supplementary Figure S9, the impact of parameter initialization is negligible. This is true even for genes with a large number of isoforms. This result suggests that PennSeq estimation is robust to parameter initialization.
Application to the human adipose RNA-Seq data
We next applied PennSeq to a RNA-Seq data set generated from our ongoing study on transcriptomic variations in the genetics of evoked responses to niacin and endotoxemia (GENE) study (30,31). The RNA-Seq data was generated from adipose of a healthy female in the GENE study using Illumina HiSeq 2000. Poly-A library preparation and sequencing was performed at the Penn Genome Frontiers Institute’s High-Throughput Sequencing Facility using four lanes yielding ∼1040 million 2 × 101-bp paired-end reads. In our analysis, we randomly selected 50 million (50 M) reads from this deeply sequenced sample, and mapped the reads to the reference genome using Tophat (27). There are two reasons that motivated us to choose 50 M reads. First, most RNA-Seq studies sequence samples around this depth, thus results from our analysis will be most relevant to the current practice. Second, as shown by the simulations, when sequencing depth is high, all methods yield relatively high R2 and the difference between methods is small. In our analysis, we considered all genes with at least two isoforms and estimated their isoform relative abundance and FPKMs using various methods (Supplementary Table S2). We excluded IsoEM and iReckon from analysis owing to their inferior performance. Consistent with results from the simulations and the MAQC data sets, the estimated isoform relative abundance and FPKMs from PennSeq are the most concordant with CEM-bias but least concordant with RD.
To compare the relative performance of different methods, we next examined the major isoforms inferred by each method. Because we do not know the ground truth, we focused on genes in which the major isoforms inferred by PennSeq and RD are the same but different from the other methods. We chose to be concordant with RD because the simulations results suggest that RD has low error rate for genes with well-defined major isoforms. To better discern what the true isoform is, we visually examined the coverage plots of each gene. We restricted our visual examination to genes that meet the following criteria: (i) the gene does not overlap with other genes, (ii) covered by at least 500 read pairs and (iii) for the major isoform inferred from PennSeq, the relative abundance difference between PennSeq and CEM-bias, CEM, Cufflinks-bias and Cufflinks is >0.2. The third criterion selects genes that have different relative abundance estimates between PennSeq and the other methods. These filtering criteria left 10 genes for further examination, most of which demonstrate severe 3' bias. Figure 7 shows the coverage plots for three genes, all suggesting that the major isoforms inferred from PennSeq and RD are more plausible. A similar pattern is observed for the remaining genes (Supplementary Figure S10). Results from this data set clearly demonstrate the advantage of PennSeq when there is severe non-uniformity in read distribution.
Figure 7.

Examples in which PennSeq inferred a more plausible major isoform for the human adipose data. The inferred major isoform is in bold.
DISCUSSION
Accurate estimation of isoform-specific gene expression is critical for eQTL and splicing QTL studies using RNA-Seq. Even if the goal is to study expression at the gene level, it is still important to estimate isoform-specific expression levels first because in a recent study, it was shown that method that uses ‘isoform deconvolution’ approach yields more accurate gene expression estimates than ‘raw count’ methods that simply count the sequence reads mapped to the exons of each gene (25). A major challenge in the analysis of RNA-Seq data is the presence of various biases, which if not appropriately corrected, can affect isoform-specific expression estimation. The current methods for analysis of RNA-Seq data either ignore the biases by assuming read start positions are uniformly distributed along transcripts or model the biases using simple non-parametric approaches or complicated parametric models. In this article, we present PennSeq, a statistical method that allows each isoform to have its own non-uniform read distribution. All the discussions of this article are for paired-end reads, but simplification to the situation of single-end reads is straightforward and has been implemented in our program. The central idea of our method is to model non-uniformity by using the empirical read distribution in RNA-Seq data. It is the first time that the non-uniformity is modeled at the isoform level. Compared with existing approaches, our method allows bias correction at a much finer scale.
Because of the non-parametric nature of our method, it can model any biases that lead to non-uniformity. This flexibility is important as there are still unknown factors that contribute to non-uniformity and they are unlikely to be fully captured by parametric models. Through simulations and the analysis of two real RNA-Seq datasets, we show that PennSeq consistently outperforms existing methods for isoform expression estimation with respect to a variety of quality metrics. The advantage of PennSeq is the most pronounced when sequencing depth is low and the isoforms demonstrate severe non-uniformity. The accurate estimation of isoform expression levels from PennSeq will be valuable for eQTL, splicing QTL and differential expression analysis that take isoform-specific gene expression as input (21–24).
As a non–parametric-based approach that relies on empirical read distributions, PennSeq is inevitably computationally intensive. However, our approximation of hi(r, s) significantly improved the computation speed. Based on the MAQC dataset, we found that the running time of PennSeq is only 20% slower than Cufflinks with bias correction. Because the computations can be parallelized across chromosomes, we believe that the computation is tractable even for large datasets if a computing cluster is available.
We note that although PennSeq significantly outperforms the other tools, there is still room for improvement. Even with 100 M reads, the R2 value of PennSeq is 0.86. Several steps can be taken to further improve the performance. A drawback of the EM algorithm is overfitting because all isoforms are assigned a positive abundance estimate even if they are not expressed. To prevent overfitting, a simple solution is to refit the data while eliminating those isoforms with estimated relative abundance below a threshold. A more systematic approach would be to use regularized EM algorithm, which automatically penalizes isoforms with low expression (9). We are currently exploring these alternatives.
We have assumed that the gene annotation models are known beforehand. Although the current gene annotation models are still incomplete, we anticipate that many RNA-Seq datasets will be available in the near future for various tissues and cell types, making it feasible to discover most of the expressed isoforms. Therefore, one can use the latest gene annotation models as input for PennSeq. Nevertheless we recognize that it is desirable to identify novel isoforms using RNA-Seq data, particularly for tissues and cell types that are not well studied. We are currently extending our method to do simultaneous transcriptome assembly and isoform expression estimation by using the component elimination EM algorithm (19). Other extensions that we are pursuing include detection of differential expression and differential alternative splicing. Results for these extensions will be presented elsewhere.
In summary, we have developed a non–parametric-based statistical method that allows each isoform to have its own non-uniform read distribution. Through simulations and analysis of real datasets, we showed superior performance of PennSeq over competing methods, particularly for isoforms demonstrating severe non-uniformity. Our results indicate that it is important to correct non-uniformity effectively to accurately quantify isoform-specific gene expression.
ACCESSION NUMBER
The human adipose RNA-Seq data have been deposited in the Gene Expression Omnibus (GEO) database (accession number GSE50792).
SUPPLEMENTARY DATA
Supplementary Data are available at NAR Online.
FUNDING
National Institutes of Health [R01HG004517, R01HG005854, R01GM097505 and R01HL111694 to M.L.; R01GM097505 to H.L.; R01HL111694, R01DK090505, U01HL108636 and K24HL107643 to M.P.R.]. The content is solely the responsibility of the authors and does not necessarily represent the official views of the National Institutes of Health. The Penn Genome Frontiers Institute under a grant with the Pennsylvania Department of Health (in part), which disclaims responsibility for any analyses, interpretations or conclusions. Funding for open access charge: National Institutes of Health [R01HG004517].
Conflict of interest statement. None declared.
Supplementary Material
ACKNOWLEDGEMENTS
The authors thank Dr John Hogenesch for helpful discussions.
REFERENCES
- 1.Schena M, Shalon D, Davis RW, Brown PO. Quantitative monitoring of gene expression patterns with a complementary DNA microarray. Science. 1995;270:467–470. doi: 10.1126/science.270.5235.467. [DOI] [PubMed] [Google Scholar]
- 2.Marioni JC, Mason CE, Mane SM, Stephens M, Gilad Y. RNA-seq: an assessment of technical reproducibility and comparison with gene expression arrays. Genome Res. 2008;18:1509–1517. doi: 10.1101/gr.079558.108. [DOI] [PMC free article] [PubMed] [Google Scholar]
- 3.Wang Z, Gerstein M, Snyder M. RNA-Seq: a revolutionary tool for transcriptomics. Nat. Rev. Genet. 2009;10:57–63. doi: 10.1038/nrg2484. [DOI] [PMC free article] [PubMed] [Google Scholar]
- 4.Wang ET, Sandberg R, Luo S, Khrebtukova I, Zhang L, Mayr C, Kingsmore SF, Schroth GP, Burge CB. Alternative isoform regulation in human tissue transcriptomes. Nature. 2008;456:470–476. doi: 10.1038/nature07509. [DOI] [PMC free article] [PubMed] [Google Scholar]
- 5.Zhao K, Lu ZX, Park JW, Zhou Q, Xing Y. GLiMMPS: Robust statistical model for regulatory variation of alternative splicing using RNA-Seq data. Genome Biol. 2013;14:R74. doi: 10.1186/gb-2013-14-7-r74. [DOI] [PMC free article] [PubMed] [Google Scholar]
- 6.Sun W. A statistical framework for eQTL mapping using RNA-seq data. Biometrics. 2012;68:1–11. doi: 10.1111/j.1541-0420.2011.01654.x. [DOI] [PMC free article] [PubMed] [Google Scholar]
- 7.Jiang H, Wong WH. Statistical inferences for isoform expression in RNA-Seq. Bioinformatics. 2009;25:1026–1032. doi: 10.1093/bioinformatics/btp113. [DOI] [PMC free article] [PubMed] [Google Scholar]
- 8.Trapnell C, Williams BA, Pertea G, Mortazavi A, Kwan G, van Baren MJ, Salzberg SL, Wold BJ, Pachter L. Transcript assembly and quantification by RNA-Seq reveals unannotated transcripts and isoform switching during cell differentiation. Nat. Biotechnol. 2010;28:511–515. doi: 10.1038/nbt.1621. [DOI] [PMC free article] [PubMed] [Google Scholar]
- 9.Mezlini AM, Smith EJ, Fiume M, Buske O, Savich GL, Shah S, Aparicio S, Chiang DY, Goldenberg A, Brudno M. iReckon: simultaneous isoform discovery and abundance estimation from RNA-seq data. Genome Res. 2013;23:519–529. doi: 10.1101/gr.142232.112. [DOI] [PMC free article] [PubMed] [Google Scholar]
- 10.Hu M, Zhu Y, Taylor JM, Liu JS, Qin ZS. Using Poisson mixed-effects model to quantify transcript-level gene expression in RNA-Seq. Bioinformatics. 2012;28:63–68. doi: 10.1093/bioinformatics/btr616. [DOI] [PMC free article] [PubMed] [Google Scholar]
- 11.Li J, Jiang H, Wong WH. Modeling non-uniformity in short-read rates in RNA-Seq data. Genome Biol. 2010;11:R50. doi: 10.1186/gb-2010-11-5-r50. [DOI] [PMC free article] [PubMed] [Google Scholar]
- 12.Li B, Ruotti V, Stewart RM, Thomson JA, Dewey CN. RNA-Seq gene expression estimation with read mapping uncertainty. Bioinformatics. 2010;26:493–500. doi: 10.1093/bioinformatics/btp692. [DOI] [PMC free article] [PubMed] [Google Scholar]
- 13.Li B, Dewey CN. RSEM: accurate transcript quantification from RNA-Seq data with or without a reference genome. BMC Bioinformatics. 2011;12:323. doi: 10.1186/1471-2105-12-323. [DOI] [PMC free article] [PubMed] [Google Scholar]
- 14.Wu Z, Wang X, Zhang X. Using non-uniform read distribution models to improve isoform expression inference in RNA-Seq. Bioinformatics. 2011;27:502–508. doi: 10.1093/bioinformatics/btq696. [DOI] [PubMed] [Google Scholar]
- 15.Wan L, Yan X, Chen T, Sun F. Modeling RNA degradation for RNA-Seq with applications. Biostatistics. 2012;13:734–747. doi: 10.1093/biostatistics/kxs001. [DOI] [PMC free article] [PubMed] [Google Scholar]
- 16.Roberts A, Trapnell C, Donaghey J, Rinn JL, Pachter L. Improving RNA-Seq expression estimates by correcting for fragment bias. Genome Biol. 2011;12:R22. doi: 10.1186/gb-2011-12-3-r22. [DOI] [PMC free article] [PubMed] [Google Scholar]
- 17.Nicolae M, Mangul S, Mandoiu II, Zelikovsky A. Estimation of alternative splicing isoform frequencies from RNA-Seq data. Algorithms Mol. Biol. 2011;6:9. doi: 10.1186/1748-7188-6-9. [DOI] [PMC free article] [PubMed] [Google Scholar]
- 18.Hansen KD, Brenner SE, Dudoit S. Biases in Illumina transcriptome sequencing caused by random hexamer priming. Nucleic Acids Res. 2010;38:e131. doi: 10.1093/nar/gkq224. [DOI] [PMC free article] [PubMed] [Google Scholar]
- 19.Li W, Jiang T. Transcriptome assembly and isoform expression level estimation from biased RNA-Seq reads. Bioinformatics. 2012;28:2914–2921. doi: 10.1093/bioinformatics/bts559. [DOI] [PMC free article] [PubMed] [Google Scholar]
- 20.Roberts A, Pimentel H, Trapnell C, Pachter L. Identification of novel transcripts in annotated genomes using RNA-Seq. Bioinformatics. 2011;27:2325–2329. doi: 10.1093/bioinformatics/btr355. [DOI] [PubMed] [Google Scholar]
- 21.Lappalainen T, Sammeth M, Friedlander MR, t Hoen PA, Monlong J, Rivas MA, Gonzalez-Porta M, Kurbatova N, Griebel T, Ferreira PG, et al. Transcriptome and genome sequencing uncovers functional variation in humans. Nature. 2013;501:506–511. doi: 10.1038/nature12531. [DOI] [PMC free article] [PubMed] [Google Scholar]
- 22.Anders S, Huber W. Differential expression analysis for sequence count data. Genome Biol. 2010;11:R106. doi: 10.1186/gb-2010-11-10-r106. [DOI] [PMC free article] [PubMed] [Google Scholar]
- 23.Robinson MD, McCarthy DJ, Smyth GK. edgeR: a Bioconductor package for differential expression analysis of digital gene expression data. Bioinformatics. 2010;26:139–140. doi: 10.1093/bioinformatics/btp616. [DOI] [PMC free article] [PubMed] [Google Scholar]
- 24.Leng N, Dawson JA, Thomson JA, Ruotti V, Rissman AI, Smits BM, Haag JD, Gould MN, Stewart RM, Kendziorski C. EBSeq: an empirical Bayes hierarchical model for inference in RNA-seq experiments. Bioinformatics. 2013;29:1035–1043. doi: 10.1093/bioinformatics/btt087. [DOI] [PMC free article] [PubMed] [Google Scholar]
- 25.Trapnell C, Hendrickson DG, Sauvageau M, Goff L, Rinn JL, Pachter L. Differential analysis of gene regulation at transcript resolution with RNA-seq. Nat. Biotechnol. 2012;31:46–53. doi: 10.1038/nbt.2450. [DOI] [PMC free article] [PubMed] [Google Scholar]
- 26.Griebel T, Zacher B, Ribeca P, Raineri E, Lacroix V, Guigo R, Sammeth M. Modelling and simulating generic RNA-Seq experiments with the flux simulator. Nucleic Acids Res. 2012;40:10073–10083. doi: 10.1093/nar/gks666. [DOI] [PMC free article] [PubMed] [Google Scholar]
- 27.Trapnell C, Pachter L, Salzberg SL. TopHat: discovering splice junctions with RNA-Seq. Bioinformatics. 2009;25:1105–1111. doi: 10.1093/bioinformatics/btp120. [DOI] [PMC free article] [PubMed] [Google Scholar]
- 28.Shi L, Reid LH, Jones WD, Shippy R, Warrington JA, Baker SC, Collins PJ, de Longueville F, Kawasaki ES, Lee KY, et al. The MicroArray quality control (MAQC) project shows inter- and intraplatform reproducibility of gene expression measurements. Nat. Biotechnol. 2006;24:1151–1161. doi: 10.1038/nbt1239. [DOI] [PMC free article] [PubMed] [Google Scholar]
- 29.Bullard JH, Purdom E, Hansen KD, Dudoit S. Evaluation of statistical methods for normalization and differential expression in mRNA-Seq experiments. BMC Bioinformatics. 2010;11:94. doi: 10.1186/1471-2105-11-94. [DOI] [PMC free article] [PubMed] [Google Scholar]
- 30.Ferguson JF, Patel PN, Shah RY, Mulvey CK, Gadi R, Nijjar PS, Usman HM, Mehta NN, Shah R, Master SR, et al. Race and gender variation in response to evoked inflammation. J. Transl. Med. 2013;11:63. doi: 10.1186/1479-5876-11-63. [DOI] [PMC free article] [PubMed] [Google Scholar]
- 31.Liu Y, Ferguson JF, Xue C, Silverman IM, Gregory BS, Reilly MP, Li M. Evaluating the impact of sequencing depth on transcriptome profilingin human adipose. PLoS One. 2013;8:e66883. doi: 10.1371/journal.pone.0066883. [DOI] [PMC free article] [PubMed] [Google Scholar]
Associated Data
This section collects any data citations, data availability statements, or supplementary materials included in this article.