Abstract
Several neuroimaging studies are presented, which derived from prior work on gastric distension. Using a nonsurgical approach, we inserted gastric balloons into rats, which led to a marked decrease in food intake that normalized at 8 weeks. Body weight, however, remained below controls, which encouraged pursuit of studies in humans. A gastric balloon was inserted in obese and lean subjects, and filled through a tube that led behind the subject with water to 0, 200, 400, 600, 800 mL, on different days prior to ingestion of a liquid meal. As gastric volume increased, intake decreased by about 40%. Stomach capacity was then investigated using a gastric balloon, by assessing subjective (maximal tolerance) and objective measures (gastric compliance). Obese individuals had a much larger stomach capacity than lean by both measures. Next, in a 2-month study, an indwelling gastric balloon was inflated to 400 mL for 1 month and deflated for 1 month in counterbalanced order. Body weight was reduced during the month when the balloon was inflated within the 2nd and 3rd week. The subsequent study involved fMRI in response to gastric distension of 0, 250, and 500 mL while the subject was in a scanner. Ratings of fullness, but not discomfort, increased at 500 mL. Amygdala and insula activation were associated with gastric distension. The amygdala, as part of the limbic system, is involved in emotion and reward, and the insula in interoception. The right amygdala activation was inversely related to BMI, consistent with greater gastric capacity ata higher BMI. The next fMRI study in obese and lean subjects used visual and auditory stimuli of high energy dense (ED) and low ED foods. Increased activation was observed in the midbrain, putamen, posterior cingulate gyrus, hippocampus, and superior temporal gyrus in the obese vs. lean group in response to high vs. low ED food cues. Several of these areas lie within the mesolimbic reward pathway, and greater activation to high ED foods in the obese, suggests they have increased reward-driven eating behavior. Lastly, an fMRI study using the same stimuli was conducted pre and post gastric bypass surgery. There were postsurgical reductions in neural activity in mesolimbic areas including the prefrontal cortex, to a greater degree for high ED than low ED cues, reflecting more normalized responses. Through the use of various methodologies, the stomach’s influence on food intake, sensations of fullness, and brain activation is described with suggestions for future research.
Keywords: gastric volume, gastric balloon, fMRI, functional imaging, satiety, brain, voxels
The use of functional neuroimaging to study the human brain in vivo has been growing rapidly. It was first applied clinically to investigate major psychiatric disorders, such as schizophrenia, and more recently to investigate obesity. This will be a brief overview of several neuroimaging studies of obesity derived from earlier studies of gastric distension.
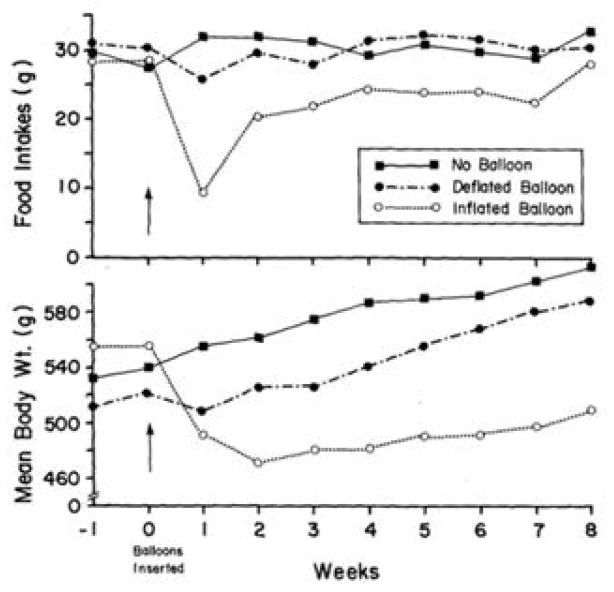
To test whether a gastric balloon could reduce food intake and body weight in a less invasive manner than bariatric surgery, we first performed studies in animals (Geliebter, Westreich, Gage, & Hashim, 1986). Gastric balloons were orally inserted into the stomach of rats and filled with 7 mL saline, about 33% of their gastric capacity. Another group had balloons inserted that were filled and then emptied, but left in the stomach to control for the presence of a foreign body, and a third group had gastric balloons inserted and immediately removed. Figure 1 shows that food intakes decreased sharply during the 1st week in rats with filled gastric balloons relative to the other groups. Intakes gradually increased over weeks such that by the 8th week, they no longer differed among groups. The stomachs in these rats became greatly enlarged, possibly to compensate for the reduced gastric volume, which may explain the increased food intake over time. Nevertheless, body weight remained reduced in these rats, which encouraged us to start similar studies in human subjects.
Figure 1. Food intake and body weight by balloon group.
Mean daily food intakes (g) and body weights (g) of rats with filled balloons (7 mL), empty balloons, and no balloons over 8 weeks. In the rats with filled balloons, intakes decreased sharply in the 1st week and rose gradually, but remained lower through the 7th week (P < 0.01). Body weight remained reduced throughout compared to rats with empty balloons or rats with no balloons. (mean ± SE) Reproduced from: “Intragastric balloon reduces food intake and body weight in rats,” by Geliebter, A., Westreich, S., Gage, D., & Hashim, S. A., (1986). Am J Physiol, 251 (4 Pt 2), p.R795. Copyright 1986 by the American Physiological Society. Rights automatically granted.
The work in humans began with an acute study (Geliebter, Westreich, & Gage, 1988; Geliebter, Westreich, & Hashim, 1985) in which a gastric balloon was inserted and remained connected to a tube, through which water was delivered via a pump from behind the participant, who remained unaware that the study concerned appetite and food intake. The participant was told only that we were measuring intragastric pressure. The gastric balloon was filled with water at a rate of 100 mL/min, with 30 sec pauses to record intragastric pressure. The balloon was filled to various volumes on different days in a randomized sequence, with several days between test procedures. After the balloon was filled to a designated volume, the participant was asked to ingest a complete liquid meal (1 kcal/mL) until full through a straw from a covered opaque container, to prevent visual feedback.
Figure 2 shows the effects of various gastric volumes (0, 200, 400, 600, 800 mL) on test meal intake in obese and lean participants. As balloon volume increased, ad libitum liquid meal intake decreased. A minimal volume of 400 mL was needed to significantly reduce test meal intake. Based on the all the subjects combined, the line of regression, y = −.37x + 823, where y = intake (g) and x = balloon volume (mL), showed that for every 1 mL of gastric distension, 0.37 g (or mL) less liquid meal was ingested, representing suppression of intake by almost 40%. In another condition, the balloon was filled to 800 mL and then immediately emptied. Test meal intake was similar to intake when the balloon was at 0 mL volume, indicating that gastric distension had a short-acting effect, consistent with a neural signal.
Figure 2. Test meal intake following various intragastric balloon volumes in lean and obese participants.

Test meal intakes (g) of a liquid lunch meal after various levels of intragastric balloon distension (mL) in obese and lean participants. Intakes following balloon volumes ≥ 400 mL were significantly reduced (P < 0.01). Distending the balloon to 800 mL and emptying it had no effect on food intake. (mean ± SE) Reproduced from: “Gastric distention by balloon and test-meal intake in obese and lean subjects,” by Geliebter, A., Westreich, S., & Gage, D. (1988). Am J Clin Nutr, 48(3), p.593. Copyright 1988 by the American Society for Nutrition. Rights automatically granted.
On concluding the study, we decided to investigate the gastric capacity of the participants to determine whether it differed between the weight groups. All participants returned, and additional ones were recruited (Geliebter, 1988; Geliebter et al., 1985). As shown in Figure 3, the obese individuals had a much larger gastric capacity (P < 0.02) than the lean ones. This measure of capacity was based on the maximum volume tolerated, indicated by an abdominal discomfort rating of 10 (from 1–10) obtained after every 100 mL. Ratings of fullness [1–10] as the balloon was being filled reached a rating of 10 sooner than the volume required to produce a discomfort rating of 10, suggesting that fullness is reached in relation to capacity. Gastric capacity was also assessed by a more objective measure, gastric compliance, based on the relationship between balloon volume and intragastric pressure. We used the volume that produced a linear increase of 5 cm H2O pressure as an index of capacity. Figure 4 shows that obese participants, as compared to lean, required a larger volume to produce the same rise in intragastric pressure. Granström and Backman in Sweden, independently performed a comparable study (Granstrom & Backman, 1985) and found that the volume at which obese participants reached tolerated capacity was 1763 ± 70 mL (mean ± SEM) compared to 1000 ± 67 mL for the lean group, similar to our results.
Figure 3. Gastric capacity in lean and obese participants.
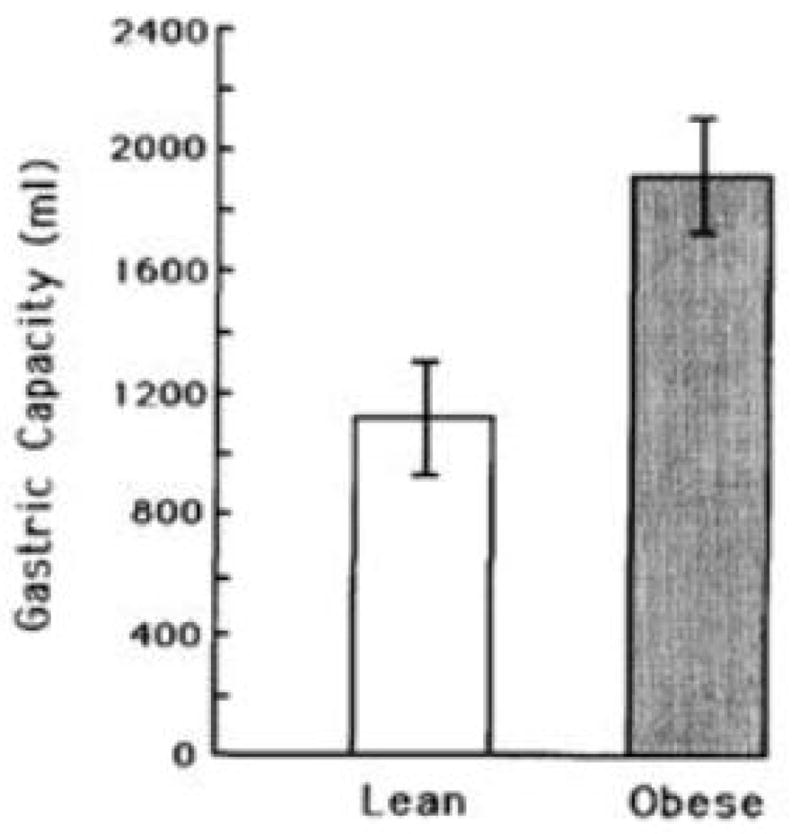
Gastric capacity (mL) in obese participants was larger than in lean ones (P < 0.02), based on the maximum volume tolerated, using a criterion of an abdominal discomfort rating of 10 (1–10). (mean ± SE) Reproduced from: “Gastric distension and gastric capacity in relation to food intake in humans,” by Geliebter, A. (1988). Physiol Behav, 44(4–5), p.666. Copyright 1988 by ELSEVIER INC. Reprinted with permission.
Figure 4. Gastric volume in lean and obese participants.
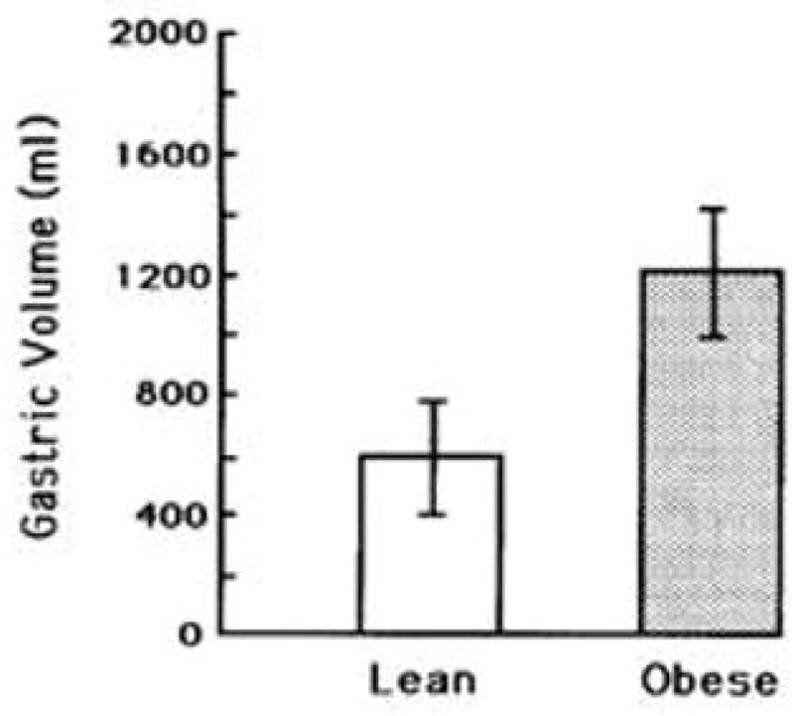
Obese participants required a significantly larger gastric volume (mL) than lean participants (P < 0.05), to produce the same rise in intragastric pressure (5 cm of H2O). (mean ± SE) Reproduced from: “Gastric distension and gastric capacity in relation to food intake in humans,” by Geliebter, A. (1988). Physiol Behav, 44(4–5), p.667. Copyright 1988 by ELSEVIER INC. Reprinted with permission.
With H Kissileff we performed another study to examine the combined effects of gastric distension and CCK infusion (Kissileff, Carretta, Geliebter, & Pi-Sunyer, 2003). A gastric balloon was filled to 300 mL, a subthreshold volume (Figure 1) for reducing food intake. The CCK infusion was also provided a subthreshold dose. The top line of the graph in Figure 5 shows the effect of the 300 mL gastric distension alone on food intake, and the bottom line shows the effect of distension combined with the CCK infusion on intake. Neither the subthreshold dose of distension nor CCK alone suppressed food intake significantly. Only the combination of gastric distension and CCK decreased intake, indicating that that the two mechanisms complement each other, as shown in animals (Schwartz, Tougas, & Moran, 1995).
Figure 5. Meal intakes following gastric distension and saline or CCK infusion.
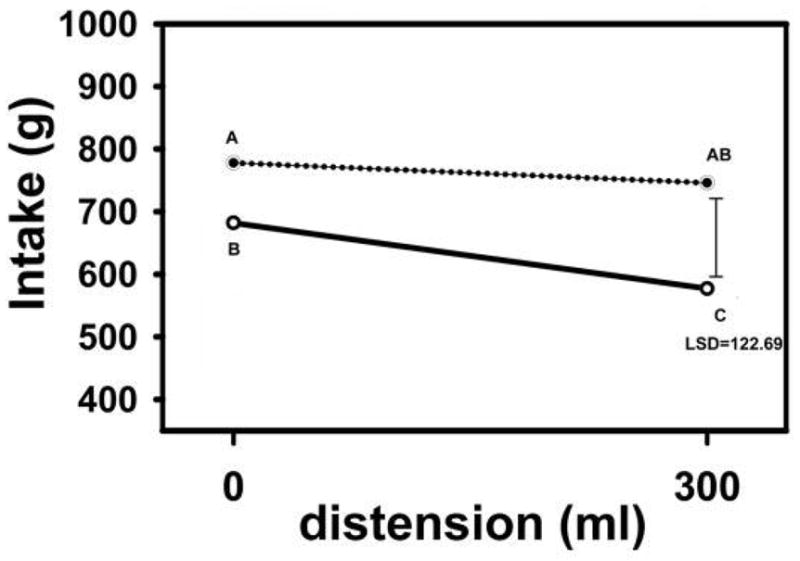
Intakes (g) following 0 or 300 mL gastric balloon distension with saline infusion (top line) or CCK infusion (bottom line) in 16 subjects (8m; 8f). The combination of gastric distension and CCK infusion produced decreases in food intake. The error bar to the right shows the least significant difference (LSD) for comparisons between any two conditions, and a difference > LSD was significant. Data points with non-overlapping letters differ from each other. Reproduced from: “Cholecystokinin and stomach distension combine to reduce food intake in humans,” by Kissileff, H., Carretta, J., Geliebter, A., & Pi-Sunyer, F. (2003). Am J Physiol Regul Intergr Comp Physio, 285(5), 7, p.R996. Copyright 2003 by the American Society for Nutrition. Rights automatically granted.
We then initiated an 8-week double-blind study (Geliebter, Melton, Gage, McCray, & Hashim, 1990). Participants had a gastric balloon orally inserted, and an attached thin silicone tube was rerouted to exit a nostril, with the end taped behind the ear. Participants were requested to report weekly to have the balloon volume checked. Unbeknown to them, the volume of the intragastric balloon was changed after 4 weeks from 0 mL to 400 mL (200 mL air; 200 mL water) or vice versa, in a counterbalanced sequence. During the 2nd and 3rd week when the balloon was distended, as compared to deflated, body weight decreased significantly (P < 0.05), but this difference was not significant by the 4th week (Figure 6). Although there were several statistically significant results, they were not clinically significant.
Figure 6. Weight change during 4-week crossover periods by balloon condition.
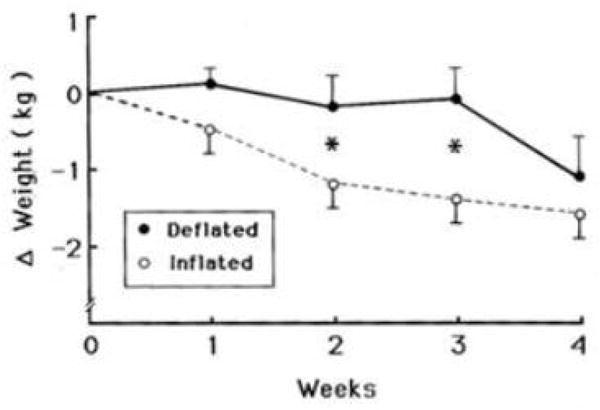
Cumulative changes in weight (kg) over 4 weeks from the beginning of each crossover balloon condition (inflated or deflated). The inflated balloon produced significantly more weight loss (F[1,9] = 5.0, P < 0.05) during the 2nd and 3rd week. (mean ± SE) Reproduced from: “Gastric balloon to treat obesity: a double-blind study in nondieting subjects,” by Geliebter, A., Melton, P. M., Gage, D., McCray, R. S., & Hashim, S. A. (1990). Am J Clin Nutr, 51 (4), p.585. Copyright 1990 by the American Society for Nutrition. Rights automatically granted.
The next study was designed to examine longer-term effects of a silicone intragastric balloon filled to 300 mL with saline (Geliebter et al., 1991). Larger volumes were tried but produced discomfort in most individuals after about 24 hours. The intervention period was 3 months. There were four conditions: a) no intervention (control), b) dietary intervention only, c) gastric balloon only, and d) gastric balloon plus dietary intervention. The dietary intervention involved biweekly group sessions employing behavioral and nutritional counseling. The gastric balloon-only group lost almost 3 kg at month 1, which then began leveling off. At 3 months, the balloon-only group lost less weight than the diet-only group, and the balloon-plus- diet group did not differ from the diet-only group. The balloon-only group and the balloon-plus-diet groups attended significantly fewer dietary sessions than the diet only group, suggesting the balloon groups were relying more on the gastric balloon than on the diet to induce weight loss, and this may help explain why the balloon-plus-diet group did no better than the diet only group. All three treatment groups produced significantly greater weight loss than the control group.
These earlier studies provided the impetus for several neuroimaging studies. There are two primary imaging methodologies: positron emission tomography (PET) and functional magnetic resonance imaging (fMRI). In PET, a person is injected with a radioactive tracer, of which there are two common types: one type is used to measure regional metabolic activity, e.g., fluorodeoxyglucose (FDG). FDG, a close analog of glucose, is taken up by cells that utilize glucose, and reveals regions of relatively high metabolic activity. The use of FDG PET for identifying activated brain regions has now been largely replaced by fMRI. The other type of radioactive tracer for PET imaging is used to detect availability of specific neurotransmitter receptors for binding, and remains the key way to identify receptor binding sites. An historical example was the use of PET to show that raclopride, an early antipsychotic drug, is an antagonist to D2 receptors (Farde et al., 1985).
The two prominent dopamine pathways in the brain originate within two areas of the midbrain, the substantianigra and the ventral tegmental area (VTA). The pathway from the substantianigra to the dorsal striatum is primarily involved in movement, where deficient dopamine transmission has been noted in Parkinson’s disease. The other pathway from the VTA connects posteriorly to the hippocampus and anteriorly to the nucleus accumbens and to the prefrontal cortex (PFC). This pathway is primarily associated with reward. The PFC is also involved in decision-making to initiate or inhibit a reward response, e.g., to decide whether to eat or resist a high calorie food.
The most familiar kind of MRI is structural, which is widely used in medical centers. The MRI most relevant to our research employs the same instrument, but is used for functional imaging to measure the blood-oxygen-level-dependent (BOLD) response. When a region of the brain becomes more active, the flow of oxygenated blood to that region increases, which can be detected even though the change is on the order of 1%. fMRI has several advantages over PET: It does not involve radiation, has better temporal and spatial resolution, and is much less expensive; a one-hour scan costs about $600 for an fMRI and about $4,000 for a PET. For these reasons, fMRI has become the dominant neuroimaging approach.
An fMRI study was conducted in collaboration with Brookhaven National Laboratory (Wang et al., 2008). There were 15 normal-weight participants with BMI < 30 kg/m2. Using the methodology previously described (Geliebter et al., 1988), a deflated balloon was introduced into the stomach, and the participant was placed in the scanner. The balloon was filled by tube to 250 mL, followed by a pause, and then filled to 500 mL. As shown earlier, 500 mL corresponds to about half the gastric capacity of a lean person. The balloon was then emptied, refilled, and emptied again to improve the detection of blood oxygenation changes by repeated contrasts. During the procedure, the subject rated fullness, abdominal discomfort, hunger, and desire for food (Figure 7). As the balloon was filled, only fullness increased significantly (P = 0.005). Discomfort was somewhat higher at 500 mL, but not significantly so, comparable to earlier studies of gastric capacity, where 500 mL of distension corresponded to little or no acute discomfort.
Figure 7. Ratings at different gastric volumes.
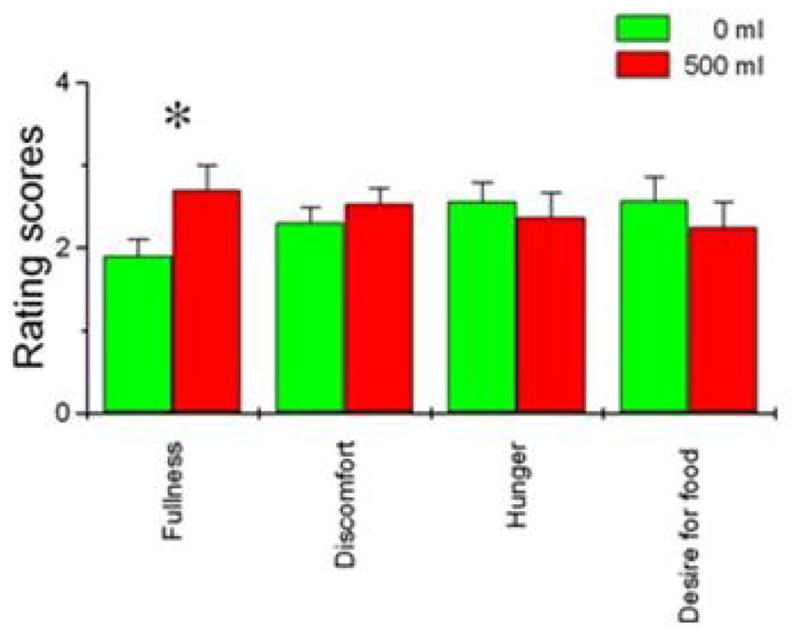
Ratings of fullness, discomfort, hunger, and desire for food (0–4) were obtained during the fMRI scan when the gastric balloon was empty (0 mL) or full (500 mL). Only the fullness ratings increased significantly (P = 0.005) when the balloon was full. (mean ± SE) Reproduced from: “Gastric distention activates satiety circuitry in the human brain,” by Wang, G. J., Tomasi, D., Backus, W., Wang, R., Telang, F., Geliebter, A., Korner, J., Bauman, A., Fowler, J. S., Thanos, P. K., Volkow, N. D. (2008). Neuroimage, 39(4), p.1827. Copyright 2008 by ELSEVIER INC. Reprinted with permission.
The results showed activation of the right insula when the balloon was filled to the lower volumes, 0 – 250 ml. As balloon volume increased to 250 – 500 ml, there was also left posterior amygdala and left posterior insula activation (Figure 8). The insula is known to be responsive to enteroceptive signals, and its activation was expected, but the amygdala activation was not anticipated, since the amygdala is involved primarily in emotion. It is possible that amygdala activation was triggered by slight levels of discomfort or alternatively by reward as distension led to increased fullness. Of note, right amygdala activation correlated inversely with BMI. The 500 mL fixed volume might be expected to produce less enteroception of distension in those with greater BMI, if they have a greater gastric capacity.
Figure 8. Brain activation by gastric distension volumes.
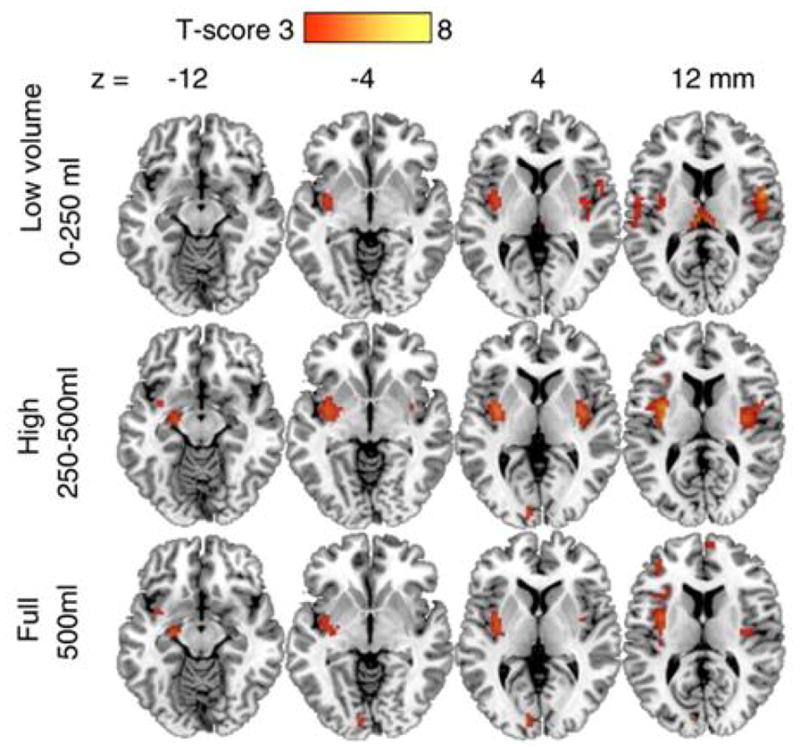
Axial slices showing brain activation at various gastric distension volumes. There was activation of the right insula when the balloon was distended to the lower volume, 0–250 ml. As balloon volume increased, 250–500 ml, there was also left posterior amygdala and left posterior insula activation. The 500 ml volume additionally activated the precuneus. (Color bar reflects t values for contrasts with baseline, 0 ml volume). Reproduced from: “Gastric distention activates satiety circuitry in the human brain,” by Wang, G. J., Tomasi, D., Backus, W., Wang, R., Telang, F., Geliebter, A., Korner, J., Bauman, A., Fowler, J. S., Thanos, P. K., Volkow, N. D. (2008). Neuroimage, 39(4), p.1828. Copyright 2008 by ELSEVIER INC. Reprinted with permission.
In a related PET study using radioactive raclopride as a tracer, Wang et al. (Wang et al., 2001), found that obese individuals had reduced dopamine receptor availability in the striatum as compared to those of normal weight, although there were no differences in brain metabolic rate, based on FDG, between the weight groups. Given their PET finding, we decided to employ fMRI to study obese and lean individuals (Geliebter et al., 2006). Participants were shown images of highly palatable energy-dense (ED) foods, and less palatable low-ED foods, as palatability is often related to energy density. Each highly palatable food was > 3.5 kcal/g in energy density, and each low-palatability food was < 1 kcal/g. In addition to these visual runs, we also had auditory runs, with voice recordings of the names of similar foods. Whereas fMRI studies generally involve either visual or auditory stimuli, we used both types of stimuli within the same protocol to help eliminate purely sensory activation.
The latest analysis of the results is based on Statistical Parametric Mapping (SPM), which combines brains from subjects after mapping to a reference brain (Montreal Neurological Institute). SPM is a powerful statistical tool and allows for comparisons between groups, but this approach also has a drawback. Given that every brain has a slightly different architecture, mapping to a standard brain may distort certain brain areas of an individual. Thus, it is also useful to do analysis of brains individually (Geliebter et al., 2006). One of the considerations in SPM group analysis is the very large number of brain voxels being compared. To adjust for multiple testing, we required a low p value (P < 0.0001) for significance as well as a minimum cluster size of adjacent activated voxels, k = 10. The key comparison was for obese versus lean between high-ED foods and low-ED foods. Between-group differences were found in several brain regions: midbrain, posterior cingulate gyrus, hippocampus, and superior temporal gyrus (Carnell, Benson, Pantazatos, Hirsch, & Gelibeter, 2013) (Figure 9). Some of these areas (midbrain, hippocampus) fall in the mesolimbic reward pathway, and greater activation there to high ED foods in the obese group suggests increased reward-driven eating behavior.
Figure 9. Brain activation in response to low and high ED food cues in lean and obese participants.
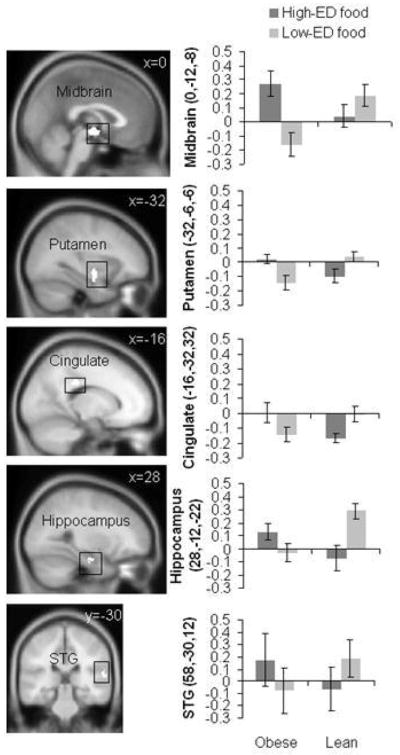
Sagittal and coronal brain slices depict areas showing greater visual and auditory activation (conjunction) in response to high-ED (vs. low-ED) food cues in obese vs. lean individuals in the midbrain (x = 0), putamen (x = −32), posterior cingulate gyrus (x = −16), hippocampus (x = 28), and superior temporal gyrus (STG, y = −30). Bar graphs show parameter estimates for voxels of each region in obese and lean individuals for high-ED and low-ED cues (mean ± SD). Reproduced from: “Greater activation and functional connectivity with midbrain in response to auditory and visual high energy density food cues in obesity,” by Carnell, S., Benson, L., Pantazatos, S. P., Hirsch, J., & Gelibeter, A. (2013). Unpublished manuscript, no permission required.
We also used a relatively new approach to examine associations between regions of activity, instead of focusing only on individual areas. These associations are found by searching for synchronized activation among multiple regions. We chose the VTA within the midbrain as a seed region, and then identified regions that were activated concurrently. We found that obese, compared to lean, showed greater functional connectivity in response to high-ED vs. low-ED food cues in the post central gyrus, cerebellum, and precuneus. Although this approach is promising, it cannot yet be used to identify a neuronal pathway or its directionality.
Lastly, we will describe how neuroimaging has been applied to detect neural changes following bariatric surgery. Almost all current bariatric surgeries have a gastric restriction component to reduce capacity. We conducted an fMRI study in 10 Roux-en-Y gastric bypass (RYGB) patients, presurgery and 1 month postsurgery (Ochner, Gibson, Carnell, Dambkowski, & Geliebter, 2010; Ochner, Kwok, et al., 2010). RYGB bypasses most of the stomach, and the small remaining gastric pouch delivers nutrients directly to the intestine (mid-jejunum). First, we looked at specific areas, in an a-priori region-of-interest approach, and then employed a whole brain approach, which is also important as it can reveal unanticipated regions of activity. We examined differences pre- and post- surgery in activation for high-ED food stimuli as well as for low-ED food stimuli.
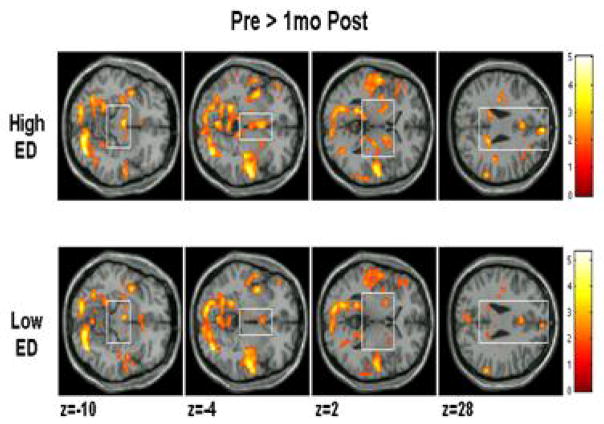
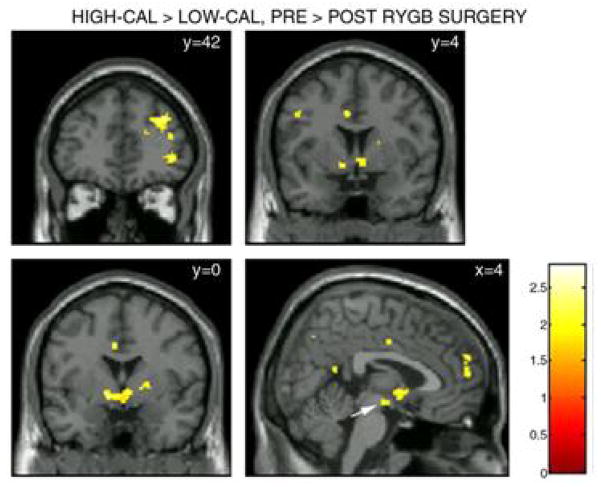
Figure 10 shows that the activation changes from pre- to post- surgery were much smaller for low-ED foods compared to high-ED foods. We then subtracted the changes in activation for lowED food stimuli from that for high-ED food stimuli (Figure 11). As anticipated, there were greater postsurgical decreases for high-ED than for low-ED food stimuli, within dopaminergic regions: prefrontal cortex, ventral, and dorsal striatum. The prefrontal cortex is involved in integrating reward pathway signals and in decision making. Thus, following surgery, there could be reduced salience of signals from high ED food cues leading to a reduced probability of ingesting those foods, which would require less decision making and thus could result in less activity in the PFC. Reduced activity in this region has also been observed in obese individuals after ad libitum eating until satiated, which could be interpreted as requiring less decision making or an inability in decision making to stop eating (Martens et al., 2013). The postsurgical pattern of brain activation responses appeared to move in the direction from that of an obese person towards that of a lean person, with less reward pathway activation to highly palatable food stimuli. The postsurgical changes also mimic some of the changes seen in fMRI activation between pre-meal fasting to post-meal fullness within both lean and obese individuals (Born et al., 2011). This is also consistent with reports of reduced hunger and greater fullness postsurgery even when fasting (Ochner, Gibson, Shanik, Goel, & Geliebter, 2011). This brain activation shift could be another independent mechanism contributing to post-surgical reduced food intake and weight loss or it could be related to the gut peptide changes observed post RYGB (Ochner et al., 2011).
Figure 10. Brain activation pre- and post- bariatric surgery in response to low and high ED food cues.
Axial slices depicting areas in which brain activation presurgery was greater than postsurgery in response to low-ED and high-ED food stimuli. Relative to low-ED (bottom row), larger postsurgical reductions in conjoint (visual and auditory) activation (pre > postsurgery) in response to high-ED foods (top row) are seen in VTA (z = −10), ventral striatum (z = −4), putamen and lentiform nucleus (z = 2), posterior cingulate (z = 28, left clusters), and dmPFC (z = 28, right cluster). Montreal Neurological Institute (MNI) coordinates for the axial slices are given below the statistical maps. The color bar represents t values. For display purposes, activation maps are shown without a cluster extent threshold. Reproduced from: “Selective Reduction in Neural Responses to High Calorie Foods Following Gastric Bypass Surgery,” by Ochner, C. N., Kwok, Y., Conceicao, E., Pantazatos, S. P., Puma, L. M., Carnell, S., Teixeira, J., Hirsch, J., Geliebter, A. (2010). Ann Surg, 253(3), p.504. Copyright 2011 by LIPPINCOTT WILLIAMS & WILKINS, INC. Reprinted with permission.
Figure 11. Areas with greater activation to high-ED food cues pre-surgery.
Coronal and sagittal slices of areas where differences between activation in response to high- and low- ED foods (contrast) was greater pre- than post- surgery. Activation was considered significant for P < 0.05 uncorrected, with an applied cluster extent threshold (k = 22). The largest clusters (k = 80) were seen in the dlPFC (y = 42; top cluster), ventrolateral PFC (vlPFC; y = 42; bottom cluster), ventral striatum (y = 4; bottom two clusters), putamen and lentiform nucleus (y = 0; bottom cluster), and dmPFC (x = 4; rightmost cluster). A non-significant cluster (k = 20) was also observed in the VTA (x = 4; white arrow). MNI coordinates are given in upper left corner of each panel. The color bar represents t values. Reproduced from: “Selective Reduction in Neural Responses to High Calorie Foods Following Gastric Bypass Surgery,” by Ochner, C. N., Kwok, Y., Conceicao, E., Pantazatos, S. P., Puma, L. M., Carnell, S., Teixeira, J., Hirsch, J., Geliebter, A. (2010). Ann Surg, 253(3), p.505. Copyright 2011 by LIPPINCOTT WILLIAMS & WILKINS, INC. Reprinted with permission.
Two studies have used PET to address changes post bariatric surgery. One study used a region-of-interest approach to detect raclopride D2 binding in the striatum in five women pre- and post- gastric bypass surgery (Steele et al., 2010). Four of the five showed a postsurgical increase in receptor availability for binding and one showed a decrease. A second similar PET study examined four subjects pre and post RYGB as well as one subject pre and post vertical sleeve (Dunn et al., 2010), which involves longitudinal resectioning the stomach to form a sleeve-like tube. In this study, dopamine receptor availability decreased post-surgery, the opposite of Steele et al.’s findings.
These divergent findings may be interpreted alongside two current theories of brain activation in obesity. One is the hypo-responsive theory, which posits that obese people have a reduced dopamine response to food, which could motivate them to seek more food, especially high-ED food. According to this theory, weight loss should increase dopamine release, which would be consistent with Wang et al., who found decreased dopamine receptor availability in obese people (Wang et al., 2001). The other, hyper-responsive theory, posits that obese people experience greater dopamine release in response to food, and are therefore more motivated to seek food. According to this theory, weight loss should decrease dopamine receptor availability. The hyper-responsive theory appears more consistent with our fMRI findings, although fMRI cannot directly assess dopamine activity.
Additional PET studies with larger samples are needed to help clarify dopamine receptor binding changes pre- and post- gastric bypass to resolve the discrepant findings in the early small studies. Similarly, fMRI studies pre- and post- gastric bypass could be done in association with gut peptide levels to find possible associations between changes in hormones and brain activation, since the changes in brain activation postsurgery that we have reported may be due in part to the influence of gut peptide changes. Comparisons between different modes of surgery, such as gastric bypass which results in gut peptide changes and more purely restrictive procedures, such as gastric banding which generally do not lead to marked peptide changes could also be informative (Ochner et al., 2011). Such research on bariatric surgery may provide a basis for the development of drug interventions to mimic some of the neurological and gut peptide consequences of bariatric surgery.
In summary, the stomach’s involvement in ingestive behavior has been investigated using various methodologies, including neuroimaging. The findings confirm the stomach’s profound influence on food intake, perceptions of fullness, and regions of brain activation, and also suggest directions for future research.
HIGHLIGHTS.
Acute gastric distension decreases test meal intake in obese and lean subjects.
Gastric capacity is much larger in obese than lean subjects.
Amygdala and insula activation are associated with gastric distension and fullness.
Greater activation in mesolimbic areas in obese vs. lean to palatable food cues.
Activation response is reduced to these food cues following gastric bypass surgery.
Acknowledgments
My thanks to the collaborators (alphabetical order) at the following institutions:
New York Obesity Nutrition Research Center, St. Luke’s-Roosevelt Hospital/Columbia University, NY, NY: L Benson, S Carnell, D Gage, C. Gibson, SA Hashim, H Kissileff, T Ladell, CN Ochner, M Sharafi, S Westreich, EK Yahav.
Columbia University Medical Center, NY, NY: J Hirsch, SP Pantazatos.
Brookhaven NationalLab, Upton, NY: D Tomasi, GJ Wang, ND Volkow.
My gratitude to C Grillot and L Kolbe for reviewing and helping revise the manuscript.
Support was provided in part by NIH grants: R01DK34702, R01DK054318, R01DK080153.
Footnotes
Publisher's Disclaimer: This is a PDF file of an unedited manuscript that has been accepted for publication. As a service to our customers we are providing this early version of the manuscript. The manuscript will undergo copyediting, typesetting, and review of the resulting proof before it is published in its final citable form. Please note that during the production process errors may be discovered which could affect the content, and all legal disclaimers that apply to the journal pertain.
References
- Born JM, Lemmens SG, Martens MJ, Formisano E, Goebel R, Westerterp-Plantenga MS. Differences between liking and wanting signals in the human brain and relations with cognitive dietary restraint and body mass index. [Research Support, Non-U.S. Gov’t] Am J Clin Nutr. 2011;94(2):392–403. doi: 10.3945/ajcn.111.012161. [DOI] [PubMed] [Google Scholar]
- Carnell S, Benson L, Pantazatos SP, Hirsch J, Gelibeter A. Greater activation and functional connectivity with midbrain in response to auditory and visual high energy density food cues in obesity. 2013 doi: 10.1002/oby.20859. [DOI] [PMC free article] [PubMed] [Google Scholar]
- Dunn JP, Cowan RL, Volkow ND, Feurer ID, Li R, Williams DB, Abumrad NN. Decreased dopamine type 2 receptor availability after bariatric surgery: preliminary findings. Brain Res. 2010;1350:123–130. doi: 10.1016/j.brainres.2010.03.064. S0006-8993(10)00638-4 [pii] [DOI] [PMC free article] [PubMed] [Google Scholar]
- Farde L, Ehrin E, Eriksson L, Greitz T, Hall H, Hedstrom CG, Sedvall G. Substituted benzamides as ligands for visualization of dopamine receptor binding in the human brain by positron emission tomography. Proc Natl Acad Sci U S A. 1985;82(11):3863–3867. doi: 10.1073/pnas.82.11.3863. [DOI] [PMC free article] [PubMed] [Google Scholar]
- Geliebter A. Gastric distension and gastric capacity in relation to food intake in humans. Physiol Behav. 1988;44(4–5):665–668. doi: 10.1016/0031-9384(88)90333-2. [DOI] [PubMed] [Google Scholar]
- Geliebter A, Ladell T, Logan M, Schneider T, Sharafi M, Hirsch J. Responsivity to food stimuli in obese and lean binge eaters using functional MRI. Appetite. 2006;46(1):31–35. doi: 10.1016/j.appet.2005.09.002. S0195-6663(05)00120-0 [pii] [DOI] [PubMed] [Google Scholar]
- Geliebter A, Melton PM, Gage D, McCray RS, Hashim SA. Gastric balloon to treat obesity: a double-blind study in nondieting subjects. [Clinical Trial Controlled Clinical Trial Research Support, U.S. Gov’t, P.H.S.] Am J Clin Nutr. 1990;51(4):584–588. doi: 10.1093/ajcn/51.4.584. [DOI] [PubMed] [Google Scholar]
- Geliebter A, Melton PM, McCray RS, Gage D, Heymsfield SB, Abiri M, Hashim SA. Clinical trial of silicone-rubber gastric balloon to treat obesity. [Clinical Trial Randomized Controlled Trial Research Support, U.S. Gov’t, P.H.S.] Int J Obes. 1991;15(4):259–266. [PubMed] [Google Scholar]
- Geliebter A, Westreich S, Gage D. Gastric distention by balloon and test-meal intake in obese and lean subjects. Am J Clin Nutr. 1988;48(3):592–594. doi: 10.1093/ajcn/48.3.592. [DOI] [PubMed] [Google Scholar]
- Geliebter A, Westreich S, Gage D, Hashim SA. Intragastric balloon reduces food intake and body weight in rats. Am J Physiol. 1986;251(4 Pt 2):R794–797. doi: 10.1152/ajpregu.1986.251.4.R794. [DOI] [PubMed] [Google Scholar]
- Geliebter A, Westreich S, Hashim SA. Intragastric balloon induced reduction of test meal intake. [Published data only] Federation proceedings. 1985;44(5) [Google Scholar]
- Granstrom L, Backman L. Stomach distension in extremely obese and in normal subjects. Acta Chir Scand. 1985;151(4):367–370. [PubMed] [Google Scholar]
- Kissileff H, Carretta J, Geliebter A, Pi-Sunyer F. Cholecystokinin and stomach distension combine to reduce food intake in humans. Am J Physiol Regul Intergr Comp Physiol. 2003;285(5):7. doi: 10.1152/ajpregu.00272.2003. [DOI] [PubMed] [Google Scholar]
- Martens MJ, Born JM, Lemmens SG, Karhunen L, Heinecke A, Goebel R, Westerterp-Plantenga MS. Increased sensitivity to food cues in the fasted state and decreased inhibitory control in the satiated state in the overweight. [Research Support, Non-U.S. Gov’t] Am J Clin Nutr. 2013;97(3):471–479. doi: 10.3945/ajcn.112.044024. [DOI] [PubMed] [Google Scholar]
- Ochner CN, Gibson C, Carnell S, Dambkowski C, Geliebter A. The neurohormonal regulation of energy intake in relation to bariatric surgery for obesity. Physiol Behav. 2010;100(5):549–559. doi: 10.1016/j.physbeh.2010.04.032. S0031-9384(10)00190-3 [pii] [DOI] [PMC free article] [PubMed] [Google Scholar]
- Ochner CN, Gibson C, Shanik M, Goel V, Geliebter A. Changes in neurohormonal gut peptides following bariatric surgery. [Review] Int J Obes (Lond) 2011;35(2):153–166. doi: 10.1038/ijo.2010.132. [DOI] [PMC free article] [PubMed] [Google Scholar]
- Ochner CN, Kwok Y, Conceicao E, Pantazatos SP, Puma LM, Carnell S, Geliebter A. Selective Reduction in Neural Responses to High Calorie Foods Following Gastric Bypass Surgery. Ann Surg. 2010;253(3):502–507. doi: 10.1097/SLA.0b013e318203a289. [DOI] [PMC free article] [PubMed] [Google Scholar]
- Schwartz GJ, Tougas G, Moran TH. Integration of vagal afferent responses to duodenal loads and exogenous CCK in rats. Peptides. 1995;16(4):707–711. doi: 10.1016/0196-9781(95)00033-g. http://dx.doi.org/10.1016/0196-9781(95)00033-G. [DOI] [PubMed] [Google Scholar]
- Steele KE, Prokopowicz GP, Schweitzer MA, Magunsuon TH, Lidor AO, Kuwabawa H, Wong DF. Alterations of central dopamine receptors before and after gastric bypass surgery. Obes Surg. 2010;20(3):369–374. doi: 10.1007/s11695-009-0015-4. [DOI] [PubMed] [Google Scholar]
- Wang GJ, Tomasi D, Backus W, Wang R, Telang F, Geliebter A, Volkow ND. Gastric distention activates satiety circuitry in the human brain. Neuroimage. 2008;39(4):1824–1831. doi: 10.1016/j.neuroimage.2007.11.008. S1053-8119(07)01044-0 [pii] [DOI] [PubMed] [Google Scholar]
- Wang GJ, Volkow ND, Logan J, Pappas NR, Wong CT, Zhu W, Fowler JS. Brain dopamine and obesity. Lancet. 2001;357(9253):354–357. doi: 10.1016/s0140-6736(00)03643-6. [DOI] [PubMed] [Google Scholar]


