Abstract
Antagonism of the effects of glucagon as an adjunct therapy with other glucose-lowering drugs in the chronic treatment of diabetes has been suggested to aggressively control blood glucose levels. Antagonism of glucagon effects, by targeting glucagon secretion or disabling the glucagon receptor, is associated with α-cell hyperplasia. We evaluated the influence of total glucagon withdrawal on islets of Langerhans using prohormone convertase-2 knockout mice (PC2-ko), in which α-cell hyperplasia is present from a young age and persists throughout life, in order to understand whether or not sustained glucagon deficit would lead to islet tumorigenesis. PC2-ko and wild-type (WT) mice were maintained drug-free, and cohorts of these groups sampled at 3, 12 and 18 months for plasma biochemical and morphological (histological, immunohistochemical, electron microscopical and image analytical) assessments. WT mice showed no islet tumours up to termination of the study, but PC2-ko animals displayed marked changes in islet morphology from α-cell hypertrophy/hyperplasia/atypical hyperplasia, to adenomas and carcinomas, these latter being first encountered at 6–8 months. Islet hyperplasias and tumours primarily consisted of α-cells associated to varying degrees with other islet endocrine cell types. In addition to substantial increases in islet neoplasia, increased α-cell neogenesis associated primarily with pancreatic duct(ule)s was present. We conclude that absolute blockade of the glucagon signal results in tumorigenesis and that the PC2-ko mouse represents a valuable model for investigation of islet tumours and pancreatic ductal neogenesis.
Keywords: islet tumours, prohormone convertase-2 knockout mouse, α-cell hyperplasia, α-cell neogenesis, α-cell tumorigenesis
Diabetes has for many years been recognized as a bihormonal disease with increased glucagon levels as well as decreased insulin action contributing to the characteristic hyperglycaemia observed (Dunning et al. 2005). In normal physiology, in response to fasting, glucagon effects an increase in plasma glucose, by acting at its plasmalemmal receptor on hepatocytes to increase hepatic glucose production through increased gluconeogenesis and glycolysis with reduced glycogenesis (Jiang & Zhang 2003). Whilst discussions continue in relation to the relative importance of insulin resistance to β-cell dysfunction in diabetes and insulin therapy in clinical treatment, perceived additional benefits in clinical disease management arise from coreduction of glucagon action/secretion, effectively contributing to glycaemic normalization by reduction in insulin demand. Therapeutic efforts in this indication have focussed on reducing glucagon action with, for example, glucagon receptor antagonists (Ali & Drucker 2009).
Good evidence exists in support of the beneficial effects of inhibiting glucagon action in diabetes. Firstly, studies using passive immunization with antiglucagon monoclonal antibodies have resulted in improved glycaemia in streptozotocin-or alloxan-induced diabetes (Brand et al. 1994, 1996). Secondly, glucagon receptor knockout mice showed increased glucose tolerance compared with WT mice and reduced fed and fasted plasma glucose (Parker et al. 2002) associated with substantially elevated plasma glucagon levels. These findings have been replicated by other groups who have also shown that high plasma glucagon is associated with extensive α-cell hyperplasia (Gelling et al. 2003) and that glucagon receptor knockout mice are protected from the metabolic effects of a high-fat diet and streptozotocin treatment (Connarello et al. 2007). Thirdly, treatment with antisense oligonucleotides directed against the glucagon receptor decreases plasma glucose without causing hypoglycaemia and increases plasma glucagon in db/db mice (Liang et al. 2004) and ZDF rats (Sloop et al. 2004). Although these studies appear to mirror the findings seen in glucagon receptor knockout mice, interestingly, only Sloop et al. (2004) observed α-cell hyperplasia whilst Liang et al. (2004) showed completely normal islet morphology in the db/db mouse, albeit with increased α-cell glucagon staining. Fourthly, in prohormone convertase 2 (PC2) knockout mice (PC2-ko) which have a complete inability to covert proglucagon into glucagon, reduced plasma glucose and substantial α-cell hyperplasia were observed whilst plasma glucagon was absent, although plasma proglucagon was markedly increased (Furuta et al. 1997; Furuta 2001). Vincent et al. (2003) demonstrated substantial (threefold) α-cell proliferation during perinatal development which was sustained throughout their investigation of PC2-ko mice such that α-cell hyperplasia was present at 3 months of age with a concurrent doubling of β-cell volume. Indeed, small-molecule inhibitors of PC2 are being developed for diabetes and small-cell carcinoma indications (Kowalska et al. 2009). Taken together, these observations suggest that potentially, glucagon is a good target for type 2 diabetes therapy. However, reduced plasma glucagon or glucagon action is likely to result in α-cell hyperplasia, which is probably due to a feedback mechanism mediated by the trophic effects of glucagon on the α-cell.
The evidence detailed earlier has initiated development of small-molecule glucagon receptor antagonists by numerous pharmaceutical companies, although discovery of potential drug-like molecules has proven difficult (Djuric et al. 2002). Such drugs have been shown to be effective against a ‘glucagon challenge’ in mice expressing the human glucagon receptor (Qureshi et al. 2004) and in dogs given the drug NNC 25-0926 (Rivera et al. 2007). NNC 25-0926 was also reported to be effective in reducing fasting plasma glucose and first phase insulin secretion in the high-fat diet-fed C57Bl/6JBomTac mouse model (Sörhede-Winzell et al. 2007). In their investigations, islet morphology was evaluated and revealed α-cell hyperplasia without effects on β-cell mass by comparison with controls. We know that sustained cell replication in many biological systems will ultimately lead to neoplasia (Shaw & Jones 1994). Therefore, in relation to a daily administration regime of a novel pharmaceutical drug targeted at a diabetes indication, we regarded such sustained α-cell proliferation with potential neoplastic consequences as the key concern for development of glucagon ablative drugs, that is, is compensatory increase in α-cell mass associated with any adverse consequences? Germane to this issue is the potential for islet neoplasia, given the likely chronic (or even lifetime) nature of glucagon antagonist treatment in type 2 diabetes. Studies of glucagon receptor knockout mice (Parker et al. 2002; Gelling et al. 2003) for up to 24 weeks, and of a glucagon receptor antisense oligonucleotide inhibitor in several diabetic rodent models (Sloop et al. 2004) report α-cell hyperplasia without α-cell neoplastic transformations. However, Yu et al. (2011) demonstrated pancreatic neuroendocrine tumours (PNETS) at 12 months in glucagon receptor ko mice illustrative of the critical and variable time dependency of tumorigenesis in different models. Many of the small molecules, antibodies and antisense oligonucleotides studies referred to above are of fairly short duration, and we wished to evaluate a genetic model beyond the duration of reported studies of glucagon receptor knockout mice. The PC2-ko model has no complications relating to increased plasma glucagon and has intact glucagon receptors. We chose to employ this animal model and study the pathology of a large group of tissues, focussing primarily on the pancreas, for up to 18 months, by extensive evaluation of islet histology, plasma hormone and glucose measurements. During the course of the study, observations of substantially increased frequencies of rare benign and malignant islet tumours allowed further evaluation of the variety of morphological features of islet adenomas and carcinomas and particularly, the morphological characteristics of the transitional stages between these tumours. Furthermore, our immunohistochemical evaluations revealed substantial increases in incidence of duct-associated (neogenic) endocrine cells in PC2-ko animals by comparison with WTs, and these observations formed the basis for further investigations of cohort evaluation of this neogenic population.
Materials and methods
Animals and maintenance
Animals were bred to specific pathogen-free standard in the facility at Alderley Park, Cheshire, UK. Male and female PC2-ko (knockouts constructed on a C57Bl6 background, obtained from Jax Laboratories, Bar Harbor, ME, USA), and WT mice were group housed, five animals per open-topped cage on paperflakes with environmental enrichment (1 Paper Smart Home and 1 Aspen small brick provided weekly, sourced from Datesand Ltd., Manchester, UK). They were given ad libitum access to sterile-filtered tap water and irradiated maintenance diet (R&M No3, Special Diet Services, Witham Essex) and housed at 19–21 °C in a controlled light/dark environment (14 h light/10 h dark) of 40–60% humidity. WT and PC2-ko animals were maintained for either 3 months (n approx 10/sex) or 12, or 18 months (n approx 15/sex/timepoint), and were weighed and examined weekly.
Ethical approval
The study was conducted in strict adherence to the UK Home Office regulations for animal welfare (1986 Animal Scientific Procedures Act).
Necropsy
Animals were terminally anaethetized by CO2 overdose. Blood was collected from the vena cava by venepuncture into tubes containing lithium heparin and 250 KIU Trasylol (Aprotinin; Sigma-Aldrich, Gillingham, UK) per ml of whole blood at 12 and 18 months for glucagon and insulin analyses. The plasma fraction was separated by centrifugation at 1940 g for 10 min at 4 °C and stored at −80 °C.
Following blood sampling, a full necropsy was performed, and all major systems sampled to assess any histopathological implications of chronic PC2-ko. All tissue samples were immersed in 10% neutral buffered formalin for several days prior to further tissue processing into paraffin wax, with the exception of the pancreas which was fixed for 24–48 h only, to permit optimal immunohistochemical staining. Embedment in wax preceded sectioning of all tissues at 3–4 μm thickness, staining with haematoxylin and eosin and examination and diagnosis by light microscopy.
Islet isolation
Animals were terminally anaesthetized using rising CO2. The pancreas was rapidly removed and rinsed twice in cold Krebs-Ringer phosphate buffer (KRH) and perfused with a digestion solution containing 1.3 mg/ml Liberase (Roche Products, Welwyn Garden City, UK) with gentle agitation for 3 min in a waterbath at 37 °C. The digestion mix was then shaken manually for 1 min and returned to the waterbath where these steps were repeated. The digest was regarded as complete when the number of free islets was greater than the number still attached to ducts and acinar tissue. Islets were then twice washed with KRH and hand-picked under a dissection microscope.
Electron microscopy and image analysis
At all timepoints (and in those animals that were prematurely terminated due to compromised clinical condition) during necropsy, samples of the pancreas and pancreatic masses only were taken from some PC2-ko and WT animals and thin slivers of tissue (<1 mm thick) fixed by immersion in 2.5% glutaraldehyde in 0.1 M cacodylate buffer (pH7.2) prior to standard preparation into epoxy resin for examination of toluidine blue-stained sections by light microscopy and ultrathin sections by transmission electron microscopy. Ultrathin sections (70–90 nm thick) were cut and stained using uranyl acetate and lead citrate and examined using a JEOL 1400 transmission electron microscope at 80KV (JEOL UK Ltd., Welwyn Garden City, UK). For α-cell secretory granule measurements, six electron micrographs of several α-cells in several islets from each animal were taken at 8000× magnification. Micrographs were analysed using an in-house generated and validated macro on a Zeiss KS400 image analysis system (Carl Zeiss UK, Cambridge, UK), which permitted the analysis of individual α-cell cytoplasmic secretory granule area (μm2: mean/minimum/maximum) and diameter (μm: mean/minimum/maximum).
Immunohistochemistry
Note: In PC2-ko animals, glucagon immunohistochemical staining was absent. To identify α-cells, and as suitable proglucagon antibodies were unavailable, glucagon-like peptide-1 (GLP-1) was employed as a surrogate of the proglucagon molecule (structure shown in Figure 1, Dey et al. 2005).
Figure 1.
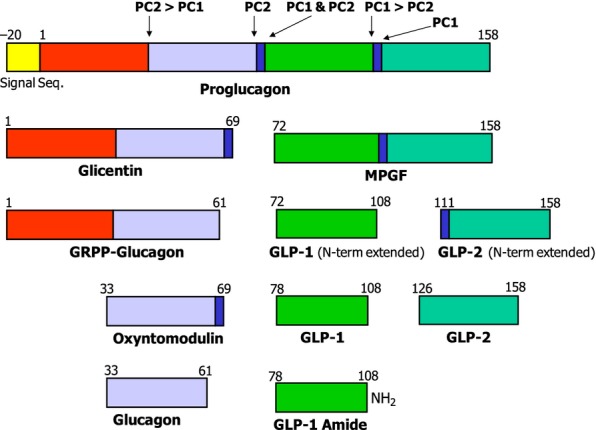
Diagrammatic representation of proglucagon processing. (Adapted from Dey et al. 2005). Proglucagon is differentially processed in the pancreatic alpha cell and L cells of the intestine by the prohormone convertases (PCs) to yield either glucagon or glucagon-like peptide-1 (GLP-1) respectively. In the α-cell, it is first cleaved at the cleavage site Lys70-Arg71, generating GRPP-glucagon and the major proglucagon fragment (MPGF). Subsequently, GRPP-glucagon is then processed by PC2 to glucagon, GRRP and intervening peptide 2 (IP2). By contrast, in the L cells of the gut, the proglucagon N terminal is partially cleaved to glicentin and oxyntomodulin. Further processing of the MPGF fragment by PC1 yields both GLP-1 and GLP-2. Note: Arrows indicate cleavage sites and preferences of the prohomone convertases.
For all immunohistochemical techniques, unless otherwise stated, 4-μm-thick sections were dewaxed in xylene and rehydrated through graded alcohols to water. Sections were placed onto a Labvision Immunostainer (Fisher Scientific UK Ltd, Loughborough, UK) where the remainder of the immunohistochemical staining was performed. Sections were first washed in Tris-buffered saline with 0.1% Tween (TBST) followed by blockade of endogenous peroxidase with 3% hydrogen peroxide in TBST for 10 min. After a buffer wash, non-specific Ig-binding sites were blocked for 20 min using different blocking agents: for insulin, somatostatin and dual staining for GLP-1 with pan-cytokeratin, a background blocker with casein (MP-966-P500; A. Menarini diagnostics, Wokingham, UK) were applied; for GLP-1, a serum-free protein block (X0909; Dako UK Ltd, Ely, UK) was employed; for glucagon, a normal goat serum (1:20, Dako: X0907) was utilized. This was followed by application of primary antibody, performed with a technique appropriate for each antibody, followed by another TBST wash and visualized with 3,3′-diaminobenzidine (DAB) (A. Menarini Diagnostics) applied for 10 min. Following a water wash, sections were counterstained in Carazzi's haematoxylin for 1 min and mounted non-aqueously. Appropriate negative and positive controls were utilized. All dilutions were in TBST and procedures performed at room temperature.
Insulin immunohistochemistry was performed using a guinea pig anti-insulin primary antibody (1:50, Dako: A0564) for 90 min incubation, followed by a biotinylated swine anti-goat/mouse/rabbit secondary antibody (1:200, Dako: E0453) and a streptavidin–biotin–complex.
GLP-1 immunohistochemistry was performed using a polyclonal rabbit anti-GLP-1 [1:500, Enzo Life Sciences (UK) Ltd, Exeter, UK: BML-GA1176] for 60 min incubation and detected with rabbit EnVision-HRP system (Dako: K4003).
Somatostatin immunohistochemistry was performed using polyclonal rabbit antisomatostatin (1:2000, Dako: A0566) for 30 min incubation and detected with a ready-to-use peroxidase-labelled secondary reagent, X-Cell Plus Universal Polymer HRP Detection kit (MP-XCP-U100A: Menarini Diagnostics).
Glucagon immunohistochemistry was performed using a polyclonal rabbit antiglucagon (1:2000, Dako: A0565) for 30 min incubation and detected with rabbit EnVision-HRP system (Dako: K4003).
For dual immunolabelling of GLP-1 and pan-cytokeratin, heat-induced epitope retrieval with 10 mM EDTA (pH8) at 110 °C for 2 min was performed. Following protein blocking (MP-966-P500; A.Menarini Diagnostics), sections were incubated using a polyclonal rabbit anti-GLP-1 antibody (1:4000, Abcam, Cambridge, UK: ab22625) for 60 min. After a buffer wash, a goat anti-rabbit IgG, alkaline phosphatase conjugate (1:100, Invitrogen, Life Technologies Ltd, Paisley, UK: G21079) was applied for 30 min, followed by incubation with liquid permanent red chromogen (Dako: K0640) for 10 min. Thereafter, sections were washed with water followed by buffer. Endogenous peroxidase blocking was achieved by incubation of sections in 3% H2O2 for 10 min. Non-specific Ig-binding sites were blocked again using the same background blocker for 20 min followed by incubation of sections with monoclonal mouse pan-cytokeratin (1:75,000, Abcam: ab49779) for 60 min, and subsequent detection with mouse EnVision-HRP system (Dako, K4007) for 30 min and visualized with DAB.
For assessment of ductal endocrine cell neogenesis, dual immunohistochemical labelling of insulin and GLP-1, and insulin and somatostatin were performed on tissue sections following heat-induced epitope retrieval as described above. Non-specific Ig-binding sites were blocked using background blocker with casein (A.Menarini Diagnostics) for 20 min. Sections were incubated in polyclonal guinea pig anti-insulin (1:4000, Dako: A0564) for 60 min. After a buffer wash, a goat anti-guinea pig IgG, alkaline phosphatase conjugate (1:100, Abcam: ab97152) was applied for 30 min, followed by incubation with liquid permanent red chromogen (Dako: K0640) for 10 min. Thereafter, sections were washed with deionized water followed by TBST buffer. Endogenous peroxidase blocking was achieved by incubation of sections in 3% H2O2 for 10 min. Following the same protein-blocking procedure as above, sections were incubated with either a rabbit anti-GLP-1 antibody (1:4000: Abcam; ab22625) or a rabbit antisomatostatin antibody (1:4000, Dako: A0566) for 60 min, and subsequent detection with X-Cell Plus Universal Polymer HRP Detection kit (MP-XCP-U100, A.Menarini Diagnostics) applied for 20 min and visualized with DAB.
For assessment of α-cell proliferation and ductal neogenic cell replication, dual Ki-67 and GLP-1 immunohistochemical staining of tissue sections were performed on all 3-month-old animals using the Ventana Discovery Ultra Staining Module (Ventana Medical Systems Inc, Tucson, AZ, USA). Following a standard CC1 heat-induced epitope retrieval protocol, sections were incubated with a rabbit polyclonal anti-Ki-67 (1:200, NB110-89717; Novus Biologicals, Cambridge, UK) for 32 min followed by goat anti-rabbit IgG:AP (1:50, Invitrogen, G21079) for the same time. Visualization of Ki-67 was achieved with Ventana Fast Red (cat. no. 760-4305). A denaturation step to prevent non-specific binding of the subsequent antibody followed, before incubation with polyclonal rabbit anti-GLP-1 antibody (1:2000, Abcam; ab22625) for 32 min followed by the Ventana OmniMap anti-rabbit HRP detection system (cat. no. 760-4311) for 20 min and subsequent visualization with Ventana DAB (cat. no. 760-4304).
For determination of pancreatic ductal epithelial–mesenchymal transition, vimentin immunohistochemical staining was performed on all 3-month-old male and female WT and PC2-ko animals and 15 adenomas and 11 carcinomas. Tissue sections were incubated with rabbit polyclonal antivimentin (1:250, Abcam: ab92547) for 32 min followed by the Ventana OmniMap anti-rabbit HRP detection system (cat. no. 760-4311) for 20 min. Visualization of vimentin was achieved with Ventana DAB (cat. no. 760-4304).
Clinical biochemistry measurements
Plasma glucagon and proglucagon were measured using a glucagon radioimmunoassay kit (Millipore, Billerica, MA, USA) comprising 125I-labelled glucagon and a glucagon antiserum to determine glucagon by the double antibody/PEG technique. Glucagon assessment used an antibody that detected both glucagon and proglucagon, this latter being the major immunoreactivity in PC2-ko mice (See Figure 1). To confirm the absence of glucagon production in PC2-ko mouse islets, we used a glucagon ELISA (CosmoBio, Tokyo, Japan). Islets were lysed and as shown in Figure S3, glucagon immunoreactivity was very low using the more specific glucagon ELISA. Plasma insulin was assessed using an ultrasensitive mouse insulin ELISA kit (Mercodia, Uppsala, Sweden), which has potential cross-reactivity with proinsulin and intermediates of approximately 50% although in an assessment of plasma proinsulin levels in wild-type mice of numerous strains, values of 0.2–15% were reported (Mercodia data sheets). At the 18-month timepoint, glucose was measured in all animals using the Accuchek method (Roche Diagnostics Ltd., Burgess Hill, UK) on tail-prick blood samples in an interval of some 45 min immediately prior to termination of animals.
Assessment of islet α-cell replication in WT and PC2-ko mice
To determine whether or not α-cell hyperplasia was present in PC2-ko animals, dual Ki-67/GLP-1-immunostained sections (1/animal) were examined, and all islets evaluated in single-tissue sections from all 3-month-old animals. Counts of GLP-1-positive (brown cytoplasm) cells with Ki-67-positive nuclei (red) as well as GLP-1-positive cells (with blue nuclei) were made. The labelling index (LI%) of the α-cell cohort was calculated as (A/(A + B)) × 100 (%), where A = the number of dual-labelled (red and brown) α-cells and B = the number of GLP-1, brown-stained (with blue nuclei) monolabelled α-cells (Jones et al. 1994). For the purposes of derivation of LIs, only brown-stained cells that displayed a blue nuclear profile were counted: no cytoplasmic fragments in which nuclei were absent were included in this assessment. Statistical comparisons using Student's t-test (two tailed) were employed to ascertain diffences between male and female, WT and PC2-ko animals.
Pancreatic ductal endocrine cell neogenesis
Observations in PC2-ko animals of numerous GLP-1-positive cells or cell clusters either within or adjacent to intrapancreatic ducts and which often were more intensely GLP-1 immunostained by comparison with non-ductally associated α-cells, prompted consideration of non-islet α-cell neogenic proliferation as a homeostatic adaptation to glucagon deficiency. In order to obtain a comprehensive view of pancreatic endocrine cell neogenesis in response to normal (WT) and altered (PC2-ko) physiological state, quantitative assessment was undertaken to determine whether or not α-cell and/or other pancreatic endocrine cell proliferation was a feature of pancreatic hormone homeostasis. All animals in this study were employed in this assessment. The relatively few ductal profiles within pancreatic tissue sections necessitated use of multiple (×3), step-serial sections, separated by 50 μm, to obtain a valid sample. To definitively identify neogenic endocrine cells, in association with small and large pancreatic duct(ule)s, dual GLP-1 (α-cells), or insulin (β-cells) or somatostatin (δ-cells) with pancytokeratin staining was employed. Dual-immunostained pancreatic sections were examined by light microscopy at an objective lens magnification of ×10. The incidence per tissue section of single or clustered α-, β-or δ-cells lying either within the ductal epithelium or subjacent to it with no separation between the basal epithelial aspect and the endocrine cell(s) was assessed. Such clustered endocrine cells were counted as likely to be neogenic if no other endocrine cells were present to indicate a ductally associated islet.
The data (i.e. numbers of ductally associated endocrine hormone-positive single cells or clusters per pancreatic section area) were transformed to bring results closer to a normal distribution and to stabilize the variance across groups. The transformation used was the average square root transformation method (Lovell et al. 1989). Each count per cm2 tissue section was transformed to the value [√(x) + √(x + 1)]/2. Two-way anova was applied to these transformed data to evaluate the effect of strain and timepoint. Differences between strains at individual timepoints were further explored using Bonferroni post-tests. All tests were two-sided, and P-values below 0.05 were considered significant. anova and subsequent tests were performed using graphpad prism (version 4.03 for Windows, GraphPad Software, San Diego, CA, USA).
Criteria employed for tumour classification
Definition of adenomas and carcinomas as detailed in Capen et al. (2001) was employed for islet tumour diagnosis. According to their criteria, islet adenomas are defined by the following: well-circumscribed nodules, compression of adjacent acinar tissue, encapsulation varying from incomplete to complete, normal islet architecture absent with ribbon or cord-like growth pattern along thin walled vessels, possible increased vascularity, cellular pleiomorphism in size and shape (e.g. spindle-shaped, fusiform), pale, eosinophilic or basophilic cytoplasm, karyomegaly with rare mitotic figures, absence of growth into or beyond capsule or distant metastases. Islet carcinomas show the following features: large, often grossly visible tumours, a fibrous capsule may be present, growth pattern may be as sheets, nests or ribbons, cells vary from well differentiated to pleiomorphic and anaplastic, pale or eosinophilic cyoplasm, nuclei may be vesicular with prominent nucleoli, mitotic figures may be numerous, growth into or beyond tumour capsule may be present with local invasion (affecting vessels, especially at tumour periphery) or rarely, distant metastases.
Results
PC2-ko animal genotyping and islet characteristics
To determine the genotype of animals and to compare with published data, we examined PC2-ko and WT animals at 12 weeks of age. Gene expression in islets showed no PC2 expression and increased proglucagon expression in PC2-ko animals as anticipated (Figure S1). Interestingly, PC1 and proinsulin gene expression were reduced in the PC2-ko mice. The absence of circulating glucagon in these animals may mean that they require less insulin to maintain normoglycaemia. Therefore, this reduction in expression of both genes may be a reflection of the reduction in requirement for insulin in the PC2-ko at this age. However, this is in contrast to the findings of Furuta et al. (1997) where plasma proinsulin levels were increased. Furuta et al. (1998) demonstrated that the kinetics of proinsulin processing are much reduced in PC2-ko mice. Therefore, the discrepancy between mRNA levels and protein may be due to a decreased turnover rate of the protein in these animals. Oral glucose tolerance tests confirmed that PC2-ko mice had improved glucose tolerance as previously described (Figure S2, Furuta et al. 1997). Comparison of wild-type (PC2+/+), heterozygous (PC2−/+) and PC2-ko (PC2−/−) mouse islet glucagon content showed a highly statistically significant decrease in cellular glucagon content in the latter (Figure S3).
Comparison of survival of WT and PC2-ko animals
No WT animals died prematurely (Figure 2). The majority of PC2-ko animals survived to 18 months of age and appeared healthy throughout the experiment. Thirteen PC2-ko animals (with no strong gender bias, eight females and five males) died prematurely or were terminated due to deterioration of clinical condition between 6.5 and 14 months before the completion of the study, with eight animals having no apparent cause of death (three of which showed either islet adenoma and/or carcinoma) with the remainder being due to chronic progressive nephropathy (four mice) or peritonitis (one mouse: associated with multiple islet adenomas and an islet carcinoma).
Figure 2.
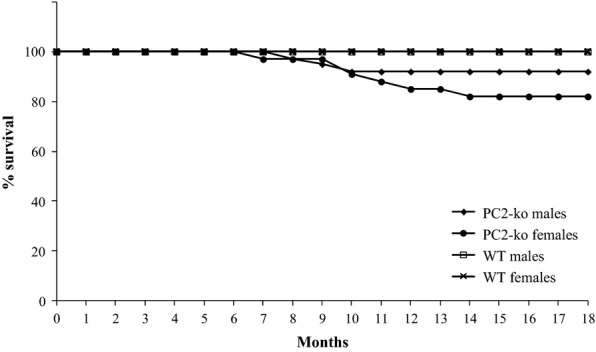
Survival plot of all male and female WT and PC2-ko mice during 18-month study duration. Note that no WT animals died during the study whilst 13 male and female PC2-ko mice died prematurely between 6.5 and 14 months; the remainder survived to scheduled termination. n/sex/time for WT and PC2-ko male and female animals: 10 (3 months), 15 (12 and 18 months).
Pathology
Wild-type animals
A range of spontaneous, age-related and neoplastic pathology was observed in these animals. There were no neoplastic alterations in islets of Langerhans.
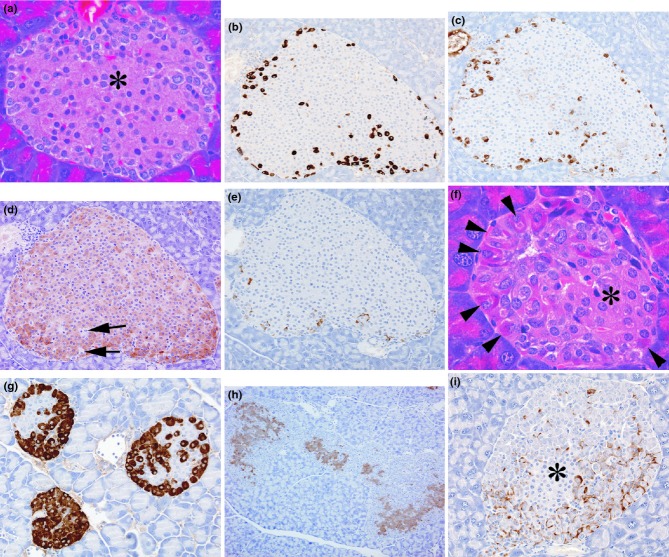
WT mouse islets showed the characteristic pattern of islet staining with insulin-positive β-cells normally located centrally and glucagon and somatostatin positivity of the α-cell and δ-cell being primarily peripherally or more ubiquitously distibuted (Figure 3). α-cells, identified by glucagon and GLP-1 immunohistochemistry were generally small, ovate or rounded with smooth-contoured nucleus with cytoplasmic granules distributed throughout the cytoplasm. Generally, several somatostatin-positive cells were located in peripheral islet locations.
Figure 3.
Photomicrographs from normal wild-type control islets illustrating (a) central area composed predominantly of β-cells (*) with an outer marginal zone of other endocrine cell types (haematoxylin and eosin), b–e. Serial sections of one islet showing (b) GLP-1 immunostaining of α-cells, (c) glucagon immunostaining of α-cells, (d) insulin immunostaining of β-cells with arrows indicating unstained, non-insulin-positive endocrine cells, (e) somatostatin immunostaining of δ-cells. Photomicrographs from PC2-ko mice showing (f) a small islet with centrally located β-cells of normal appearances (*) surrounded by a mantle of hypertrophic, hyperchromatic α-cells, with nuclear pleiomorphism and karyomegaly (arrowheads) (haematoxylin and eosin), (g) three GLP-1-immunostained islets with unstained central β-cells and intensely stained hypertrophic and hyperplastic α-cells, (h) insulin immunostaining of multiple hyperplastic islet coalescence, (i) somatostatin immunostaining showing increased numbers of islet δ-cells situated amongst proliferating α-cells, which make up the majority of islet cells, situated about a small central core of β-cells that appear normal (*). (Original objective lens magnifications: a, f × 40; b, c, d, e, g, i × 20; h × 10).
In two animals killed at 18 months, islet hypertrophy/hyperplasia was present, but no correlation with elevated plasma insulin levels was apparent.
Ultrastructural pathology of WT mouse islets at all time points showed the characteristic appearances of α-, β-and δ-cells based primarily on cytoplasmic granule appearances (Figure 4a) with β-cells being in the majority and extending throughout the islets. α-cells, the second largest cohort of the islet endocrine cell population, were primarily peripherally situated, whilst other minority endocrine cells were rarely encountered and showed similar distributions to that of α-cells. Characteristically, α-cell granules were abundant, rounded and homogeneously electron dense and showed no electron lucent halo which readily distinguished them from β-cells whose granules were of similar but more variable size and were easily identified by their halo.
Figure 4.
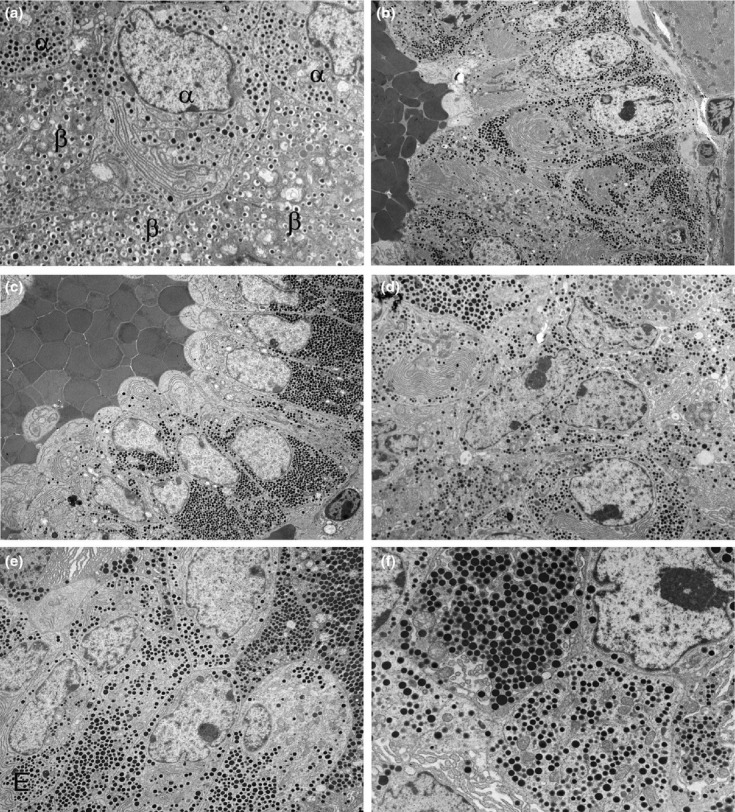
Electron micrographs illustrating features of (a) control, wild-type islet structure and (b) atypical α-cell hyperplasia, (c, d) α-cell adenoma and (e, f) α-cell carcinoma in PC2-ko animals. (a) Peripheral islet tissue showing α-and β-cellular and secretory granule appearances. Granules in both cell types are within a uniform size range and β-cell granules show a lucent halo which in α-cell granules is absent. (b) Low-magnification micrograph of part of peripheral tissue of islet showing atypical hyperplasia with α-cells situated about an unlined, blood-filled space and retaining the narrow size distribution of abundant α-cell granules. (c) Part of an α-cell adenoma showing mainly single/double-cell layer thickness of tumour cells orientated in a strong centrifugally polarized manner about an endothelial cell-unlined central, blood-filled space. Note that the secretory granules in this micrograph are of uniform appearance in size and electron density. (d) Increased magnification micrograph of adenoma showing irregularly shaped nuclei with large nucleoli and a wide range of granule size. (e) Part of an α-cell carcinoma showing solid sheet/nest growth pattern with multilayered tissue structure, loss of cellular polarity and substantial variation in α-cell granule size. (f) Increased magnification micrograph illustrating intra-and inter-cellular diversity of α-cell granule sizes (Original magnifications, a ×6000; b ×2500; c ×3000; d ×4000; e ×4000; f ×8000).
PC2-ko animals
The spontaneous age-related and neoplastic, non-pancreatic morphological alterations that were observed in WTs were also present in PC2-kos. The only additional change was observed in the kidney and manifested itself as variable but moderately severe atypical cortical tubular dilatation.
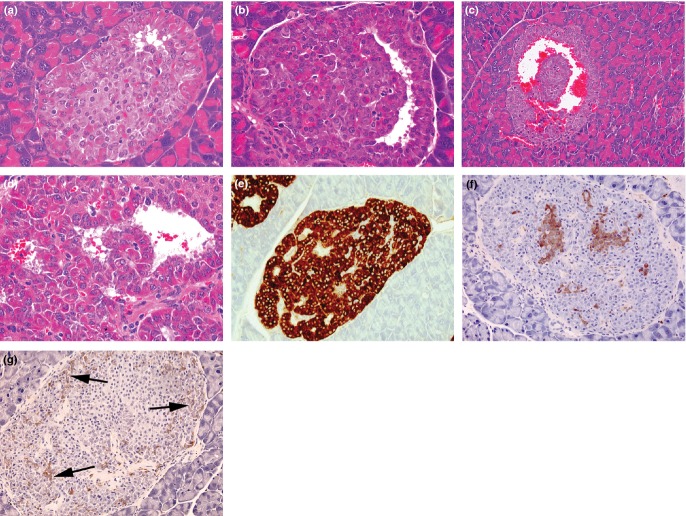
At 3 months, islets were significantly enlarged by comparison with WTs and displayed peripherally situated sheets of hypertrophic/hyperplastic α-cells with prominent karyomegaly, nuclear pleiomorphism and occasionally, mitotic figures within hyperchromatic cytoplasm: these cells were often as large or larger than centrally placed β-cells which appeared to be morphologically unaffected and displayed strong insulin immunopositivity (Figure 3). Whilst these were the predominant features at this early time, many animals also displayed islets within which atypical hypertrophy and proliferation were notable as abundant, often columnar α-cells growing in folded, ribbon-or cord-like patterns about a tenuous fibrovascular core or blood-filled or open space (Figures 5 and 6). These cells showed substantial polarity in cytoplasmic granule distribution with the greatest concentrations being present in apical cytoplasm lying adjacent to patent vessels and basal, often hormone granule-free, but rough endoplasmic reticulum-abundant cytoplasm adjacent to large, empty or blood-filled, usually endothelial cell-unlined or partially lined spaces (Figure 5a–d). Both the typical and the atypical islet hypertrophy/hyperplasias exhibited a generally, centrally situated or somewhat fragmented distribution of β-cells and enveloping solid sheets of α-cells which showed no glucagon immunostaining but characteristically strong GLP-1 immunostaining and was a feature of all PC2-ko islet tissue (Figure 5e). The cohort of islet cells immunostained positive for somatostatin was elevated by comparison with controls, these δ-cells being distributed sporadically within the islet tissue (Figure 5g). No gender differences in appearances of islets of Langerhans were noted. No tumours were observed at this time.
Figure 5.
Photomicrographs from 3-month-old PC2-ko mice showing plausible evolution of atypical hyperplastic islets (a–c) showing separation of ribbons of proliferating α-cells to form an interstitial cavernous space, its enlargement and filling with blood, (d) sheets of well-differentiated, karyomegalic, hyperchromatic α-cells formed from contortional piling of ribbons about the central cavernous space (haematoxylin and eosin), (e) strong GLP-1 immunostaining of an atypical hyperplastic islet showing lacunate pattern, (f) insulin immunostaining illustrating fragmentation of normally central, cohesive cluster of β-cells which are now distributed throughout the islet and separated by the proliferating α-cell tissue, (g) somatostatin immunostaining illustrating abundant δ-cells (arrows) in association with that of α-cells. (Objective lens magnifications: a, b, e, f, g ×20; c ×10; d ×40).
Figure 6.
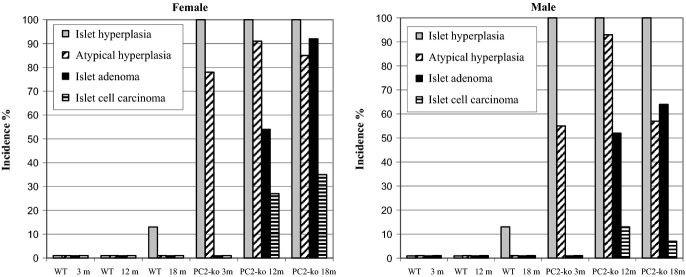
Islet of Langerhans histopathology – incidences of hyperplasia, atypical hyperplasia, adenoma and carcinoma in wild-type and PC2-ko male and female animals at 3, 12 and 18 months. Group incidence reflects presence of lesions in individual animals where multiple islet pathologies per tissue section were often observed.
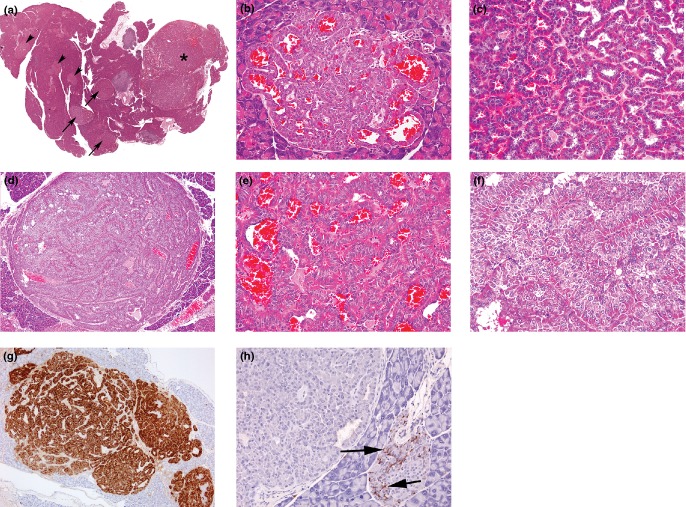
At 12 and 18 months and in all prematurely terminated animals, atypical hyperplastic islets were commonly present in the islet population, the majority of which were typically hyperplastic (Figure 7a). Islet tumour incidence was greater in females by comparison with males although the difference was not statistically significant. The incidence of islet adenomas was markedly greater than that of carcinomas (Figure 6). The features of islet adenomas in this study (Figure 7) were as described above with the following differences: multiple tumours were commonly present (with both adenomas and carcinomas occasionally present together in the same histological section, Figures 6 and 7a), the commonest histological appearance was of pallisading, single-cell-layered, tubular, ribbon and nest structures. Islet cell carcinomas comprised solid sheets of tumour cells that showed either no or little encapsulation and extended between exocrine acinar and other tissue (Figure 8). The incidence of mitotic figures was slightly elevated by comparison with adenomas, although this was not a prominent feature of any tumour. Clear evidence of tumour growth through capsular tissue was present in some instances and was distinguished from compression of local hyperplastic islets on the basis of cytological characteristics. Vascular invasion by tumour cells, external to the tumour margin, was observed, and lymphatic vessels containing tumour cells were also seen occasionally.
Figure 7.
Photomicrographs of features of α-cell adenomas: (a) Low-magnification photomicrograph of pancreatic section showing islet hyperplasia (arrowheads), several adenomas (arrows) and a single carcinoma (*), (b) small adenoma causing adjacent tissue compression and shows well-differentiated, hyperchromatic α-cells arranged in single-cell-thick layers about blood-filled spaces and without a significant fibrous capsule, (c) single-cell-thick, well-differentiated hyperchromatic tissue forming ribbons/nests of cells around an empty or blood-filled space from medium-sized adenoma, (d) medium-sized adenoma with thin fibrous capsule and showing thickened sheets and ribbons of tissue with few cavernous, blood-filled spaces, (e) few cell-thick, well-differentiated hyperchromatic tissue forming ribbons/nests of cells around a blood-filled space and with no mitotic figures from medium-sized adenoma (f) increased magnification of tissue structure from (d) showing thickened, ribbons/sheets of multiple cell layers arranged in an ordered manner with no mitoses present (a–f, haematoxylin and eosin), (g) GLP-1 immunostaining of medium-sized adenoma situated adjacent to an atypically hyperplastic islet (arrow) and illustrating connected sheets and ribbons of tumour separated by unstained tissue, (h) somatostatin immunostaining showing absence of δ-cells within adenoma but which is present in the adjacent hyperplastic islet (arrows) and illustrating the often substantial, tumour-specific variation in other, non-α-cell endocrine cells. (Objective lens magnifications: a ×0.7; c, g ×5; b, d, e, f, h ×20).
Figure 8.
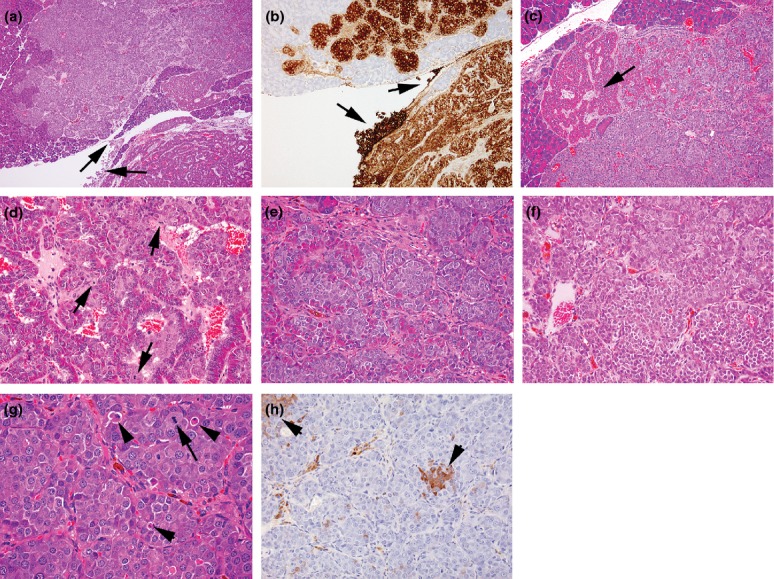
Photomicrographs of features of islet α-cell carcinoma, (a) in the bottom right, part of an adjacent well-circumscribed adenoma showing characteristic ribbon-like growth of well-differentiated, hyperchromatic cells around blood-filled spaces contrast with the appearance of the carcinoma which presents solid sheets and nests of more basophilic, anaplastic cells. The locally invasive growth of the carcinoma between exocrine tissue elements and serosal spread (arrows) illustrates the characteristic features of such tumours, (haematoxylin and eosin) (b) GLP-1 immunostaining of a semiserial section of the tumours shown in (a) illustrating the distinction between characteristics of different tumours and the local serosal carcinoma spread (arrows), (c) part of same carcinoma shown in (a) illustrating the breakdown of ordered hyperchromatic adenomatous tumour structure (arrow) to well-defined, monomorphic anaplastic cell appearances within solid nests/sheets, (d) increased magnification of part of a carcinoma developed from within an adenoma indicating the differences in appearance between the well-ordered, hyperchromatic adenoma cells intermixed with basophilic, more haphazard arrangement of anaplastic carcinoma cells showing several mitotic figures (arrows) and growing in small nests, apparently derived from the bases of the ribbons of hyperchromatic cells, (e) increased magnification of solid nests and sheets of anaplastic, basophilic cells derived from bases of hyperchromatic cell ribbons resulting in fragmentation of these latter, (f) part of carcinoma shown in (a) showing tumour pleiomorphism illustrated by separation into two polymorphic cohorts defined by characteristic cellular and nuclear size, (g) part of locally invasive carcinoma shown in (a) illustrating low incidences of mitotic figures (arrows) and apoptotic bodies (arrowheads), (h) insulin-immunostained carcinoma shown in (a) illustrating single cells and clusters of β-cells of normal appearance. (a, c–g, haematoxylin and eosin). (Objective lens magnifications: a ×5; b, d ×10; c, e, f, h ×20; g ×40).
It is important to note that in adenoma–carcinoma transitions, in several instances, individual islet adenomas displayed a variety of appearances from the single-layered ribbon/tubular patterns most commonly seen, to double-or multiple-layered appearances (Figures 7d,f). In some of these adenomas, multifocal sheets or solid nests of pleiomorphic, apolarized, pale-staining, anaplastic tumour cells appeared to have derived from the bases of the predominant ribbon/tubular epithelial arrangement and showed small but distinct elevatations in incidence of mitotic figures by comparison with adjacent tissue. Areas of anaplastic cells closely resembled the characteristics of infiltrating carcinomas: in some instances, evidence of local invasion was present. These mixed tissue appearances provided tangible indications of a transition from benign to malignant tumour states, although this observation was based on incomplete evidence in some tumours with a mixture of histological features, that is, local invasion as clear evidence of malignancy was present in some but not all pancreata, and no distant metastases were observed in any animal. No indications of pancreatic intraepithelial (ductal) neoplasia (Sipos et al. 2009), neither epithelial hyperplasia nor dysplasia, were seen in any WT or PC2-ko animal at any time in this study.
Following immunohistochemical staining, the great majority of cells in most adenomas (especially in large masses) were GLP-1 positive to the extent of partial or total exclusion of other islet cell types (Figure 7g,h). The insulin-immunostained cohort was always a small minority of these tumours, and in some instances, β-cells were absent, whilst in others, one or a few focal clusters and in yet others, a few widely scattered cells were evident. Somatostatin-positive cells varied considerably in incidence were sometimes absent but frequently were in excess of numbers in WTs and were generally widely scattered. Insulin-and somatostatin-positive cells within adenomas were regarded as those originally present within hyperplastic islet tissue, although in some tumours, somatostatin-positive cells were so abundant as to suggest proliferation, although no quantitation of this possibility was undertaken. No evidence of distant metastases of islet carcinomas was noted in any animal in which pancreatic masses were present and their diagnosis as malignant was based on local tissue invasion. Immunohistochemical staining of numerous carcinomas (Figure 8) revealed similar patterns of hormone staining, although β-cells were either absent or widely scattered and somatostatin immunostaining, although variable in incidence was often striking and indicative of significant δ-cell abundance.
Ultrastructural examination (Figures 4 and 9) of hypertrophic/hyperplastic islets showed α-cells with enlarged nuclei of irregular, often tortuous shape, prominent, commonly multiple nucleoli, abundant rough endoplasmic reticulum and secretory granule-packed cytoplasm with both granule size and distribution range little changed by comparison with WT islets (Figure 9). In histologically well-ordered adenomas, the basal region of tumour cells was, with the exception of abundant RER, largely devoid of other organelles, its appearance contrasting markedly to that of their apical, organelle-packed cytoplasm. Generally, secretory granules in individual adenoma cells were uniform in size distribution, although variation greater than that in WT was evident. Carcinomas displayed a general loss of polarity of cellular organization, and secretory granules displayed greater variation in size and distribution range (Figures 4 and 9) by comparison with adenomas.
Figure 9.
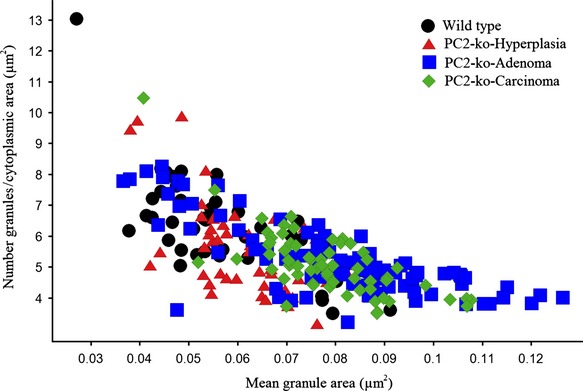
Quantitation of α-cell granule size (μm2) in electron micrographs of wild-type islets with normal morphology and atypical hyperplastic islets, adenomas and carcinomas in PC2-ko animals. Note the coincidence of smaller granules in all endocrine cell structures but increased size range in adenomas and carcinomas only.
Ductal endocrine cell neogenesis and epithelial–mesenchymal transformation
Both WT and PC2-ko animals showed insulin-, GLP-1-and somatostatin-positive, ductally associated cells at different incidences at the three times evaluated, indicative of endocrine cell neogenesis (Figures 10 and 11). Insulin-, GLP-1-and somatostatin-positive cells were present either singly or as small clusters or linear arrays in the ductal epithelium of branches of the pancreatic duct. Multiple, isolated endocrine cell types were frequently encountered within or subjacent to the epithelium in the same ductal profile (Figure 10), and a clear outcome in this evaluation was the presence of multiple single, ductally associated cells or clusters of different endocrine designation such that, for example, neogenic α-and β-cells were evident in GLP-1/insulin dual-immunolabelled sections (Figure 10e). In PC2-ko animals, at all times and in both sexes, single or clustered GLP-1-positive ductal cells predominated (Figure 11). In some instances, adjacent aggregates of GLP-1 immunostained α-cells connected with those cells present in the epithelium resembled small islets, although no other endocrine cells were observed to be colocated in these structures. Another commonly encountered feature in these animals, particularly at later times, was the presence within the exocrine tissue of single or several individual α-cells, which did not appear to be representative of tangential sections of larger islets but seemed to have arisen in isolation within exocrine acini.
Figure 10.
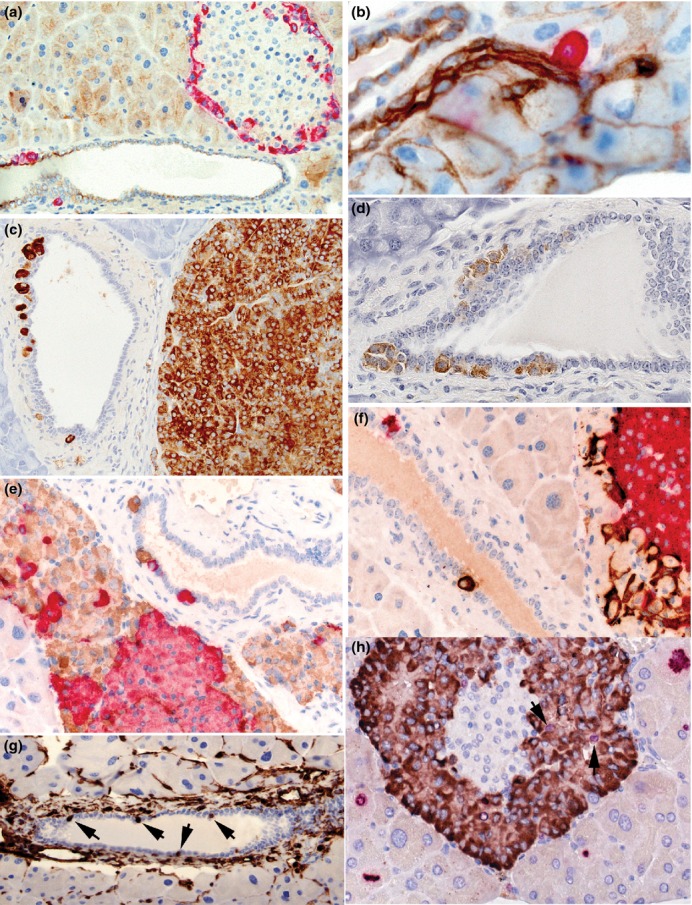
Photomicrographs illustrating features of neogenic α-, β-and δ-cells in wild-type (a, b) and PC2-ko animals (c–f). (a) GLP-1 immunostaining showing peripheral distribution of red-stained, α-cells in this islet and also the location of a small cluster and a single cell within and subjacent to the pancytokeratin-immunostained pancreatic ductal epithelium (brown), (b) increased magnification showing close association between a single GLP-1-positive cell with the pancytokeratin-stained pancreatic ductule indicating the potential for endocrine cell neogenesis in ducts of all dimensions, (c) a duct situated adjacent to an α-cell adenoma stained with GLP-1 shows single α-cell or α-cell clusters lying within or subjacent to the ductal epithelium, (d) clusters of somatostatin-immunostained cells associated with ductal epithelium, (e) dual-insulin-(red) and GLP-1 (brown)-immunostained pancreas showing red-stained β-cells in islet associated with hypertrophic/hyperplastic α-cells with individual cells within and subjacent to the ductal epithelium, (f) dual GLP-1 (red) and somatostatin (brown)-immunostained pancreas showing hypertrophic/hyperplastic α-cells in islet associated with δ-cells and with similarly-stained individual cells in adjacent duct within and subjacent to the ductal epithelium, (g) vimentin immunostaining showing multiple ductal cells showing strong positivity (arrows). No or very few such stained cells were present in most WT and PC2-ko animals, (h) dual Ki-67 (red nuclei) and GLP-1 immunostaining (brown cytoplasm) showing multiple Ki-67-positive exocrine cells at different stages of mitotic cycle around an islet with several Ki-67/GLP-1-positive α-cells (arrows). (Objective lens magnifications: a, c, g ×20; b ×63, d–f, h ×40).
Figure 11.
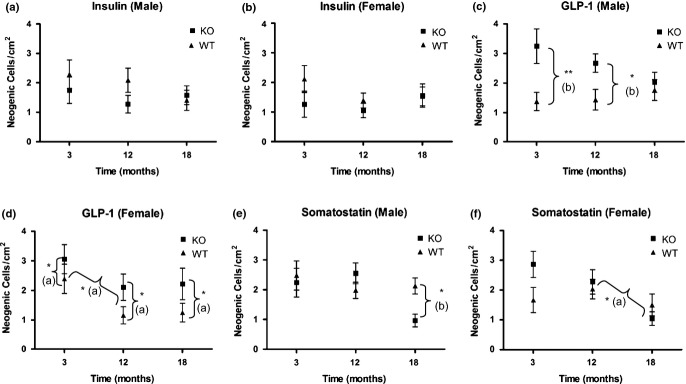
Ductal endocrine cell neogenesis. Incidences of ductally associated α-, β-and δ-cells (mean ± 1 SEM) in wild-type and PC2-ko male and female animals at 3, 12 and 18 months. No statistically significant differences in incidences of insulin-positive neogenic cells were evident although in most instances, PC2-ko values were less than or equivalent to WT. Statistically significant increased GLP-1 neogenesis was evident at 3 and 12 months in PC2-ko males, and in females was present at all timepoints by comparison with WTs. In females, a reduction in GLP-1 neogenic cell incidence in both WT and PC2-ko mice occured between 3 and 12 months, which was not apparent in males. Statistically significant reduction in somatostatin-positive neogenesis occured in 18-month-old male PC2-kos by comparison with WTs with no differences seen in females at any time despite a fall in PC2-ko somatostatin neogenic cell labelling between 3 and 18 months. *P < 0.05; **P < 0.01 (a) anova (b) Bonferroni post-test.
In PC2-ko animals, no statistically significant differences in insulin-positive ductal cells were present by comparison with WTs although in most instances, PC2-ko values were less than or equivalent to WT. For GLP-1, neogenic cells/cm2 were statistically significantly increased in PC2-ko males at 3 and 12 months with no difference between strains apparent at 18 months. In females, a smaller but statistically significant increase in GLP-1-positive neogenic cells was evident for PC2-kos by comparison with WTs at all timepoints. Values at 3 months were significantly higher than at 12 and 18 months in both strains. For somatostatin, PC2-ko males showed a significant reduction in values at 18 months by comparison with the corresponding WT value and previous timepoints. PC2-ko females also showed a significant reduction at 18 months in ductal somatostatin neogenesis, but no significant differences between strains were identified at any timepoint.
Evaluation of potential epithelial–mesenchymal transition (using vimentin immunohistochemistry as a reliable marker of such transition; Kokkinos et al. 2007) confirmed that no ductal epithelial cell staining was present in the majority of 3-month-old male and female WT and PC2-ko pancreata examined, although this was observed in a minority of animals (Figure 10g). There was no substantial difference in incidence of these cells above that seen in PC2-kos due to the presence of islet tumours.
Evaluation of α-cell replication rate
Assessment of (a) putative islet α-cell hyperplasia and (b) possible ductal neogenic cell proliferation employed dual Ki-67/GLP-1-immunostained pancreatic tissue sections. In a comparison of male and female WT and PC2-ko mice, hyperplasia of islet α-cells was confirmed with strong statistical significance in the latter for both sexes (Figure 10h and Table 1) with greater numbers of islets showing dual-stained cells present in a greater number of these animals. Ductal epithelial Ki-67 positivity was present in some animals, was not increased in either WT or PC2-ko animals and was not seen in any GLP-1-positive duct-associated neogenic cells, which is regarded as most likely due to the very small numbers of these cells present in some tissue sections.
Table 1.
Comparison of α-cell replication between 3-month-old wild-type (WT) and PC2-ko mouse islets. Dual Ki-67/GLP-1-immunostained pancreas identified the greater size of the α-cell cohort in male and female PC2-ko mice, indicated that increased numbers of α-cells in these latter animals were Ki-67 positive confirming hyperplasia and that a large majority of WT islets showed no α-cell replication
| WT Male | WT Female | KO Male | KO Female | |
|---|---|---|---|---|
| Animals per group (n) | 10 | 10 | 8 | 8 |
| Zero Ki67 labelled islet cells per section – n animals | 8 | 7 | 2 | 0 |
| Ki-67-positive cells/section, Mean n (range) | 0.4 (0–3) | 0.5 (0–2) | 12.5 (0–29) | 19.4 (8–31) |
| GLP-1-positive cells/section, Mean n (range) | 217.3 (103–438) | 154.5 (53–255) | 963.8 (279–1978) | 1351.8 (734–2553) |
| Labelling index – mean (%) | 0.158 ± 0.337 | 0.377 ± 0.726 | 0.965 ± 0.83* | 1.61 ± 0.66** |
Statistical analyses – comparison of WT and PC2-ko mice by Student's t-test (two tailed): males – *P < 0.03; females – **P < 0.0016.
Clinical biochemistry
In WTs, plasma insulin levels in both sexes at 12 and 18 months were under 2 ng/ml (Figure 12). Plasma insulin levels in PC2-kos were variable, but significantly increased at both 12 and 18 months by comparison with WTs. WTs had very low levels of plasma glucagon at all timepoints in both males and females (Figure 12). A statistically significant increase in plasma proglucagon was detected at 3 months for both male and female PC2-kos when compared with concurrent WTs. Proglucagon levels were also significantly elevated at 12 and 18 months, to a greater extent than noted at 3 months, with the most marked elevation noted at 18 months by comparison with age-matched WT controls. At 18 months, the mean glucose values were 6.6 and 6.2 mM in WT animals (male and female, respectively) and 6.9 and 6.1 mM in PC2-ko mice (male and female respectively).
Figure 12.
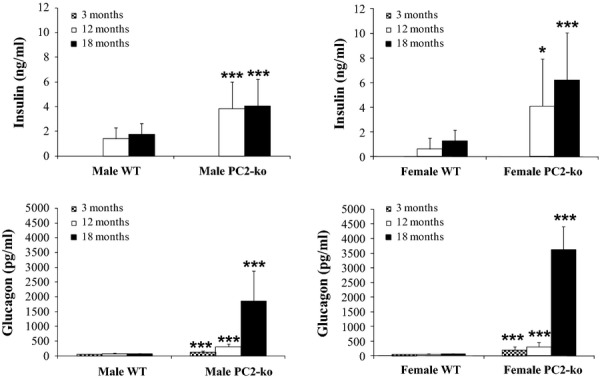
Plasma biochemistry. Insulin and proglucagon in male and female WT and PC2-ko mice at 12 and 18 months. In both male and female PC2-kos, plasma insulin was statistically significantly elevated by comparison with WTs at both 12 and 18 months. Plasma glucagon values in male and female WTs remained steady at all timepoints, whereas all corresponding timepoints in PC2-ko animals showed highly statistically significantly increased values of proglucagon (assessed in same assay).
Discussion
Substantial data obtained from studies of glucagon receptor knockout mice (Parker et al. 2002; Gelling et al. 2003; Connarello et al. 2007; Lee et al. 2011), glucagon gene knockout mice (Hayashi et al. 2009), glucagon antisense oligonucleotide treatment (Liang et al. 2004; Sloop et al. 2004), glucagon receptor antagonists (Qureshi et al. 2004; Rivera et al. 2007; Sörhede-Winzell et al. 2007), passive immunization with antiglucagon monoclonal antibodies (Brand et al. 1994, 1996) and PC2-ko mice (Furuta et al. 1997; Furuta 2001) clearly demonstrate a beneficial role of inhibition of glucagon secretion or action in diabetes. Furthermore, several studies have also shown that in most cases, inhibition of glucagon action leads to α-cell hyperplasia. This hyperplasia may be due to the extreme nature of the inhibition, especially in the glucagon receptor ko, glucagon gene ko and PC2-ko mice where, in physiological terms, no glucagon action exists. Hyperplasia, albeit of a milder form, has been seen with glucagon receptor antagonist drug treatment which, as a consequence of the poor pharmacokinetic properties of the drug used (Sörhede-Winzell et al. 2007), did not deliver complete glucagon receptor inhibition. This incomplete inhibition of glucagon signalling via antagonism of the glucagon receptor which led to improved islet function, with modest elevation of α-cell mass without β-cell mass changes is in stark contrast to the findings of Vincent et al. (2003) who reported in 3-month-old PC2-ko mice with marked α-cell hyperplasia, a doubling in pancreatic β-cell volume, and indicates that islet tissue responses relate directly to the intensity or otherwise of hormone disruption. In our study, on visual examination, β-cells appeared normal whether present in hyperplastic islets or tumours. However, we observed significantly elevated plasma insulin levels in PC2-ko males and females by comparison with WT controls at 12 and 18 months with no difference in plasma glucose values at 18 months. In the absence of β-cell mass measurements in our studies, we cannot compare directly with the data of Vincent et al. (2003), but on the basis of the available evidence, believe that glucose homeostasis was maintained in these animals during the 18-month evaluation period. In mice lacking the endogenous glucagon receptor but substituted with the human form, Mu et al. (2011) report the positive effects of chronic (82 days) administration of a glucagon receptor antagonist (Cpd. A), namely plasma glucose lowering and moderate elevations of both glucagon and GLP-1 without α-cell hypertrophy/hyperplasia, which contrasted to the drug's effects in glucagon receptor ko mice.
Islet hypertrophy/hyperplasia consisting of proglucagon-positive α-cells was substantial at 3 months and sustained throughout the study period. The mechanism pertaining to this islet morphological change is unclear but likely relates to the absence of systemic glucagon and its interaction with α-cell plasmalemmal receptors resulting in a positive proliferative drive directed at functional homeostasis and α-cell mass stability. Replacement of glucagon by micro-osmotic pump infusion corrected both hypoglycaemia and α-cell hyperplasia in PC2-ko mice (Webb et al. 2002) indicating that, at least in this model, glucagon receptors remain both intact and functional and that interference with a direct feedback mechanism, involving glucagon itself was responsible. In this context, it is of interest that reversal of α-cell hyperplasia was seen after only 11 days of glucagon infusion and normal morphology achieved by 25 days infusion in these 4-to 6-month-old mice. A plausible mechanism proposed that α-cell apoptosis driven through the glucagon receptor effectively reversed the hyperplasia, but controversy remains regarding α-cell glucagon receptor expression with some positive (Ma et al. 2005; Moens & Schuit 1996) and some negative (Gromada et al. 2007; Kedees et al. 2009) findings reported.
Plasma insulin and glucose are also potential effectors of α-cell hyperplasia as they are commonly decreased in glucagon-deficient models. In the present study, in PC2-ko males and females at 12 and 18 months, statistically significant increases in plasma insulin were evident by comparison with WTs, indicating that primary glycaemic control remained intact, albeit as a result of an altered regulatory mechanism. PC2-ko mice also showed the expected improvement in glucose tolerance (Figure S2), although glucagon gene knockout mice show normal glucose at 2–3 months, when hyperplasia was still ongoing despite showing an initial decrease in plasma glucose (Hayashi et al. 2009). Plasma insulin levels are consistently reduced in these models due primarily to improved insulin sensitivity (Hayashi et al. 2009 – female glucagon gene KO only, Gelling et al. 2003 – glucagon receptor KO in both sexes). Insulin sensitivity in PC2-ko mice has not been reported, but these animals also have decreased proinsulin processing as PC2 is required for correct insulin processing, further reducing plasma insulin levels (Furuta et al.1997). Despite this deficiency, they maintain lower blood glucose by comparison with WTs (Webb et al. 2002), compatible with maintainance or improvement in insulin sensitivity. Insulin receptor knockdown on α-cells results in decreased α-cell mass and an increase in β-cell mass (Kawamori et al. 2009). Similarly, in db/db mice, α-cell numbers and plasma glucagon levels increased as diabetes progressed whilst in vitro, insulin upregulated α-cell proliferation (αTC1 cells) through an IR/IRS2/AKT/mTOR mechanism (Liu et al. 2011).
The high incidence of rare islet tumours of α-cell origin in this study allowed interrogation of the morphological elements of adenomas and carcinomas and the criteria employed for diagnosis. Whilst the multiple characteristic features of, for example, cell/nuclear appearances, adjacent tissue compression, local invasion and metastasis of these tumours were employed in this study to diagnose the masses observed, several tumours showing features of adenomas exhibited substantial cellular anaplasia. These anaplastic cells that displayed significantly reduced cytoplasmic eosinophilia emanated from the bases of the polarized cells making up the regular tubular-/ribbon-like structures that commonly comprised these tumours. However, they strongly resembled the histological appearances of those cells constituting the solid sheets and nests of monomorphic cells present in carcinomas, identified by local invasion but with no distant metastases. Riley et al. (1990) in their categorization of proliferative and metaplastic lesions of the endocrine pancreas of rats showed well-formed interfaces of ribbon and sheet tumour cell growth patterns in a carcinoma. In the present study, more or less extensive but fundamentally identical growth patterns were seen in the tumours classed as carcinomas. No diagnosis of carcinoma was made in this study when multilayered ribbons of tumour tissue were present with ordered structural integrity and where mitotic figure incidence was unremarkable by comparison with other adenomas. The presence of evidence of increased proliferation of these anaplastic cells (mitotic figures), where ribbon structures showed nonesuch, further supported their diagnosis as carcinomas. Given the paucity of models of experimentally induced islet neoplasia, the PC2-ko mouse may provide opportunity for further refinement of the features used to make histological diagnoses of tumour type and evaluate the importance and potential utility of anaplastic features and of benign to malignant tumour tissue transformation in such an assessment. Evidence of the shift in normal α-cell function is also provided in the ultrastructural morphometric assessment of cytoplasmic secretory granule dimensions in which their size range was normal in hyperplastic islets but increased in adenomas and carcinomas.
The transition from a hypertrophic/hyperplastic α-cell functional condition in which cell replication is regulated to one in which it is not, with consequent tumorigenesis, is most likely due to sustained cell replication through a process of non-genotoxic carcinogenesis (Shaw & Jones 1994; Jones et al. 1996; Silva Lima & van der Laan 2000; Mally & Chipman 2002). Substantial evidence exists in several endocrine systems for significant alterations in circulating growth factor and hormone levels being primary mediators of elevated cell replicative rates due to xenobiotic-induced direct binding/elimination or enhanced metabolism. When chronically sustained, these growth factor/hormone perturbations permit the conditions for increased incidence of genomic mutation that may lead, if unrepaired, to tumorigenesis. By the same token, the clear probability exists that in PC2-ko mice, the artificial genetic defect eliminating the cleavage of functionally-irrelevant proglucagon to glucagon resulting in absence of the latter, and in the presence of intact and functionally capable glucagon receptors, generates a physiological condition of maximum negative feedback in α-cells stimulating increased activity and leading to cell hypertrophy and hyperplasia. Further support for this mechanistic route is provided by the high incidence of islet hyperplasia and benign and malignant islet tumours in glucagon receptor knockout mice (Yu et al. 2011) in which islet hyperplasia, atypical hyperplasia, adenomas and a carcinoma were evident in animals which also showed ductal islet neogenesis, that is, coincidence of the same pathway as that which is present in PC2-ko mice, namely dysfunction of glucagon signalling. Whilst this mechanism is compelling, data from mice specifically lacking the liver-specific Gsα protein (affecting Gsα-signalling pathways, important in metabolic regulation) and therefore not capable of mediating liver glucagon effects, also demonstrated α-cell hyperplasia, implicating a liver-derived factor or a hepatic-mediated neuronal response (Chen et al. 2005). It is interesting that both a liver-derived factor (El Quaamari et al. 2013) and hepatic neuronal mechanisms (Imai et al. 2008) have been proposed to regulate beta-cell mass.
Another interesting finding supports our contention that α-cell hypertrophy/hyperplasia is the morphological manifestation of maximum functional drive directed at restoring glucagon endocrine capability, albeit a futile response, as increased incidence of pancreatic duct(ule)-associated GLP-1-positive cells were common in PC2-ko mice. In WTs and in PC2kos, insulin-, GLP-1-and somatostatin-positive endocrine cells were seen either alone or together with other isolated endocrine-positive cells in the same ductal profiles. Few were present in WTs although greater numbers of GLP-1-positive ductal cells were evident in PC2-kos with no significant alteration in numbers of either insulin-or somatostatin-positive ductal cells. This finding is indicative of an adaptive response in extreme physiological circumstances requiring recruitment of duct-associated endocrine precursor cells to increase pancreatic α-cell mass. We regard these findings as indicative of differentiation of ductal progenitor cells into endocrine cells, a process identical to that most studied in β-cells (Bonner-Weir & Weir 2005), such adaptation being activated in the adult by islet β-cell injury or loss requiring insulin physiological homeostasis, and mimicking embryonic development of islets of Langerhans (Collombat et al. 2010). The ductal ligation pancreas injury model generates endocrine precursors from ductal epithelial cells (Xu et al. 2008) that follow a path closely linked to normal development (i.e. expression of Pax4, Nkx2.2 and MafA favouring β-cells and expression of Arx, Brn4 and MafB to α-cells) and from which both α-and β-cells are generated. Recently, the intriguing observation that forced Pax4 expression directed to α-cells leads both to their loss from the endocrine population during their conversion into β-cells (Collombat et al. 2009) and to the absence of circulating, physiologically active glucagon driving a reactive α-cell ductal neogenesis. Injection of glucagon stopped and reversed the α-cell neogenesis observed, in a manner similar to the reversal of α-cell hyperplasia seen in the islets of PC2-ko mice with glucagon replacement intervention (Webb et al. 2002). Whilst it is clear that most of the increased α-cell mass in our PC2-ko mice is generated by proliferation of existing islet α-cells, an ongoing, related process in ductal epithelium also occurs.
We did not observe a similar, increased expression of insulin or somatostatin in duct-associated cells as that observed for GLP-1 in PC2-ko animals. We know that δ-cells inhabit the same differentiation pathway as β-cells with knockdown of Pax4 resulting in loss of both cell types (Jorgensen et al. 2007). Further evidence of the close functional association between α-and δ-cells lies in the presence in some tumours of increased numbers of the latter although in others, they were absent. This discrepancy is intriguing as the paracrine influence of somatostatin on glucagon secretion is inhibitory (Quesada et al. 2008) and may therefore be merely a manifestation of tumour phenotypic variation. However, the presence of scattered insulin-positive cells within tumours in our study is indicative of fragmentation of the original islet's β-cell clusters by expansion of the proliferating α-cell cohort and not evidence of mixed endocrine tumours. Indeed, in a study of predominantly β-cell adenomas, Spencer et al. (1986) record in Long–Evans rats an incidence of 3/6 animals and 5/6 animals, respectively, showing glucagon-and somatostatin-immunopositivity with the remaining tumours exhibiting neither of these hormones. Also, in Sprague Dawley rats, the same incidences for these hormones in benign insulinomas of 6/12 and 10/12, respectively, were reported, with 1/12 and 3/12 of these tumours containing >5–50% glucagon-and somatostatin-immunopositivity, respectively, and therefore indicative of the very substantial degree of variation in rodent benign islet tumours. The basis for such variations in the multiplicity of hormone expression in these tumours remains to be evaluated. Hauge-Evans et al. (2009) studied the role of somatostatin in islets using somatostatin-ko mice and reported that δ-cell somatostatin may facilitate the islet's responses to cholinergic stimulation and/or is involved in suppression of glucagon release due to nutrient exposure. It is feasible that the variation in tumour δ-cell numbers in individual animals, observed in the present study in the absence of circulating glucagon, reflects local intratumour control of α-cell functional (secretory) activity related to paracrine responses. If this is so, it is likely associated with δ-cell detection of and response to α-cell non-glucagon secretory products such as proglucagon.
A key question for adjunct diabetes therapy by long-term glucagon inhibition relates to whether or not resultant α-cell hyperplasia may be purely adaptive with no associated significant systemic effects, or develop into neoplasms of benign or malignant nature. Our study evaluated the histopathology of PC2-ko mice maintained treatment-or drug-free for up to 18 months of age and showed that no significant differences in any tissue examined from WT, and PC2-ko mice were present, except in the islets of Langerhans, where the ubiquitous hyperplasia seen in the latter mice from an early age (3 months) was sustained throughout the 18-month duration of the study. The earliest appearance of islet tumours occurred at 6.5 months, and islet adenomas and carcinomas were relatively common subsequently and often were coincident in the same tissue section. This does not auger well for chronic, absolute antagonism of the glucagon system and careful consideration of any small or large molecule therapies will be required for potential drugs that do not achieve total inhibition as they will require to be chronically administered and thresholds for hyperplastic to neoplastic transformation established.
Acknowledgments
We are obliged to staff of the Histology, Investigative and Translational Pathology groups of the Safety Assessment department and Dr Marie South (Statistics) of AstraZeneca Pharmaceuticals for their expert contributions to this investigation.
Supporting information
Additional Supporting Information may be found in the online version of this article:
Figure S1. Gene expression in PC2 knockout mice.
Figure S2. Oral glucose tolerance test in PC2 knockout mice.
Figure S3. Glucagon content of PC2 knockout mouse islets.
References
- Ali S, Drucker DJ. Benefits and limitations of reducing glucagon action for the treatment of type 2 diabetes. Am. J. Physiol. Endocrinol. Metab. 2009;296:E415–E421. doi: 10.1152/ajpendo.90887.2008. [DOI] [PubMed] [Google Scholar]
- Bonner-Weir S, Weir GC. New sources of pancreatic beta-cells. Nat. Biotechnol. 2005;7:857–861. doi: 10.1038/nbt1115. [DOI] [PubMed] [Google Scholar]
- Brand CL, Rolin BB, Jorgensen PN, Svendsen I, Kristensen JS, Holst JJ. Immunoneutralisation of endogenous glucagon with monoclonal glucagon antibody normalises hyperglycaemia in moderately streptozotocin-diabetic rats. Diabetologia. 1994;37:985–993. doi: 10.1007/BF00400461. [DOI] [PubMed] [Google Scholar]
- Brand CL, Jorgensen PN, Svendsen I, Holst JJ. Evidence for a major role for glucagon in regulation of plasma glucose in conscious, nondiabetic and alloxan-induced diabetic rabbits. Diabetes. 1996;45:1076–1083. doi: 10.2337/diab.45.8.1076. [DOI] [PubMed] [Google Scholar]
- Capen CC, Karbe E, Deschl U. Endocrine system. In: Mohr U, et al., editors. International Classification of Rodent Tumors: The Mouse. Heidelberg: Springer; 2001. [Google Scholar]
- Chen M, Gavrilova O, Zhao W-Q, et al. Increased glucose tolerance and reduced adiposity in the absence of fasting hypoglycaemia in mice with liver-specific GSα deficiency. J. Clin. Invest. 2005;115:3217–3227. doi: 10.1172/JCI24196. [DOI] [PMC free article] [PubMed] [Google Scholar]
- Collombat P, Xu X, Ravassard P, et al. The ectopic expression of Pax4 in the mouse pancreas converts progenitor cells into α and subsequently β cells. Cell. 2009;138:449–462. doi: 10.1016/j.cell.2009.05.035. [DOI] [PMC free article] [PubMed] [Google Scholar]
- Collombat P, Xu X, Heimberg H, Mansouri A. Pancreatic beta-cells: from generation to regeneration. Semin. Cell Dev. Biol. 2010;21:838–844. doi: 10.1016/j.semcdb.2010.07.007. [DOI] [PMC free article] [PubMed] [Google Scholar]
- Connarello SL, Jiang G, Mu J, et al. Glucagon receptor knockout mice are resistant to diet-induced obesity and steptozotocin-mediated beta cell loss and hyperglycaemia. Diabetologia. 2007;50:142–150. doi: 10.1007/s00125-006-0481-3. [DOI] [PubMed] [Google Scholar]
- Dey GM, Lipkind Y, Rouille C, et al. Significance of prohormone convertase 2, PC2, mediated initial cleavage at the proglucagon interdomain site, Lys70-Arg71, to generate glucagons. Endocrinology. 2005;146:713–727. doi: 10.1210/en.2004-1118. [DOI] [PubMed] [Google Scholar]
- Djuric SW, Grihalde N, Lin CW. Glucagon receptor antagonists for the treatment of type 2 diabetes: current prospects. Curr. Opin. Investig. Drugs. 2002;3:1617–1623. [PubMed] [Google Scholar]
- Dunning BE, Foley JE, Ahren B. Alpha cell function in health and disease: influence of glucagon-like peptide-1. Diabetologia. 2005;48:1700–1713. doi: 10.1007/s00125-005-1878-0. [DOI] [PubMed] [Google Scholar]
- El Quaamari A, Kawamori D, Dirice E, et al. Liver-derived systemic factors drive β cell hyperplasia in insulin-resistant states. Cell Rep. 2013;3:401–410. doi: 10.1016/j.celrep.2013.01.007. [DOI] [PMC free article] [PubMed] [Google Scholar]
- Furuta M. Severe defect in proglucagon processing in islet A-cells of prohormone convertase 2 null mice. J. Biol. Chem. 2001;276:27197–27202. doi: 10.1074/jbc.M103362200. [DOI] [PubMed] [Google Scholar]
- Furuta M, Yano H, Zhou A, et al. Defective prohormone processing and altered pancreatic islet morphology in mice lacking active SPC2. PNAS. 1997;94:6646–6651. doi: 10.1073/pnas.94.13.6646. [DOI] [PMC free article] [PubMed] [Google Scholar]
- Furuta M, Carroll R, Martin S, et al. Incomplete processing of proinsulin to insulin accompanied by elevation of des-31,32 proinsulin intermediates in islets of mice lacking active PC2. J. Biol. Chem. 1998;273:3431–3437. doi: 10.1074/jbc.273.6.3431. [DOI] [PubMed] [Google Scholar]
- Gelling RW, Du XQ, Dichmann DS, et al. Lower blood glucose, hyperglucagonemia and pancreatic α cell hyperplasia in glucagon receptor knockout mice. PNAS. 2003;100:1438–1443. doi: 10.1073/pnas.0237106100. [DOI] [PMC free article] [PubMed] [Google Scholar]
- Gromada J, Franklin I, Wollheim CB. Alpha cells of the endocrine pancreas: 35 years of research but the enigma remains. Endocr. Rev. 2007;28:84–116. doi: 10.1210/er.2006-0007. [DOI] [PubMed] [Google Scholar]
- Hauge-Evans AC, King AJ, Carmignac D, et al. Somatostatin secreted by islet δ-cells fulfills multiple roles as a paracrine regulator of islet function. Diabetes. 2009;58:403–411. doi: 10.2337/db08-0792. [DOI] [PMC free article] [PubMed] [Google Scholar]
- Hayashi Y, Yamamoto M, Mizoguchi H, et al. Mice deficient for glucagon gene-derived peptides display normoglycaemia and hyperplasia of islet α-cells but not of intestinal L-cells. Mol. Endocrinol. 2009;23:1990–1999. doi: 10.1210/me.2009-0296. [DOI] [PMC free article] [PubMed] [Google Scholar]
- Imai J, Katagiri H, Yamada T, et al. Regulation of pancreatic beta cell mass by neuronal signals from the liver. Science. 2008;322:1250–1254. doi: 10.1126/science.1163971. [DOI] [PubMed] [Google Scholar]
- Jiang G, Zhang BB. Glucagon and regulation of glucose metabolism. Am. J. Physiol. Endocrinol. Metab. 2003;284:E671–E678. doi: 10.1152/ajpendo.00492.2002. [DOI] [PubMed] [Google Scholar]
- Jones HB, Harbottle SJ, Bowdler AL. Assessment of the labelling index of cohorts of the pancreatic islet cell population in phenobarbitone-treated male rats using a double immunohistochemical technique for 5-bromo-2′-deoxyuridine and pancreatic hormones. Arch. Toxicol. 1994;69:52–58. doi: 10.1007/s002040050137. [DOI] [PubMed] [Google Scholar]
- Jones HB, Eldridge SR, Butterworth BE, Foster JR. Measures of cell replication in risk/safety assessment of xenobiotic-induced, non-genotoxic carcinogenesis. Regul. Toxicol. Pharmacol. 1996;23:117–127. doi: 10.1006/rtph.1996.0033. [DOI] [PubMed] [Google Scholar]
- Jorgensen MC, Ahnfelte-Ronne J, Hald J, Madsen OD, Serup P, Hecksher-Sorensen J. An illustrated review of early pancreas development in the mouse. Endocr. Rev. 2007;28:685–705. doi: 10.1210/er.2007-0016. [DOI] [PubMed] [Google Scholar]
- Kawamori D, Kurpad AJ, Hu H, et al. Insulin signalling in alpha cells modulates glucagon secretion in vivo. Cell Metab. 2009;9:350–361. doi: 10.1016/j.cmet.2009.02.007. [DOI] [PMC free article] [PubMed] [Google Scholar]
- Kedees MH, Grigoryan M, Guz Y, Teitelman G. Differential expression of glucagon and glucagon-like peptide 1 receptors in mouse pancreatic alpha and beta cells in two models of alpha cell hyperplasia. Mol. Cell. Endocrinol. 2009;311:69–76. doi: 10.1016/j.mce.2009.07.024. [DOI] [PMC free article] [PubMed] [Google Scholar]
- Kokkinos MI, Wafai R, Wong MK, Newgreen DF, Thompson EW, Waltham M. Vimentin and epithelial-mesenchymal transition in human breast cancer – observations in vitro and in vivo. Cells Tissues Organs. 2007;185:191–203. doi: 10.1159/000101320. [DOI] [PubMed] [Google Scholar]
- Kowalska D, Liu J, Appel JR, et al. Synthetic small-molecule prohormone convertase 2 inhibitors. Mol. Pharmacol. 2009;75:617–625. doi: 10.1124/mol.108.051334. [DOI] [PMC free article] [PubMed] [Google Scholar]
- Lee Y, Wang M-Y, Du XQ, Charron MJ, Unger RH. Glucagon receptor knockout prevents insulin-deficient type 1 diabetes in mice. Diabetes. 2011;60:391–397. doi: 10.2337/db10-0426. [DOI] [PMC free article] [PubMed] [Google Scholar]
- Liang Y, Osborne MC, Monia BP, et al. Reduction in glucagon recptor expression by an antisnese oligonucleotide ameliorates diabetic syndrome in db/db mice. Diabetes. 2004;53:410–417. doi: 10.2337/diabetes.53.2.410. [DOI] [PubMed] [Google Scholar]
- Liu Z, Kim W, Chen Z, et al. Insulin and glucagon regulate pancreatic α-cell proliferation. PLoS ONE. 2011;6:e16096. doi: 10.1371/journal.pone.0016096. [DOI] [PMC free article] [PubMed] [Google Scholar]
- Lovell DP, Anderson D, Albanese R. Statistical Analysis of in vivo cytogenetic assays. In: Kirkland DJ, et al., editors. Statistical Evaluation of Mutagenicity Data. Cambridge: Cambridge University Press; 1989. pp. 184–232. (UKEMS sub-committee on guidelines for mutagenicity testing. Report. Part III) [Google Scholar]
- Ma X, Zhang Y, Gromada J, et al. Glucagon stimulates exocytosis in mouse and rat pancreatic alpha-cells by binding to glucagon receptors. Mol. Endocrinol. 2005;19:198–212. doi: 10.1210/me.2004-0059. [DOI] [PubMed] [Google Scholar]
- Mally A, Chipman JK. Non-genotoxic carcinogens: early effects on gap junctions, cell proliferation and apoptosis in the rat. Toxicology. 2002;180:233–248. doi: 10.1016/s0300-483x(02)00393-1. [DOI] [PubMed] [Google Scholar]
- Moens K, Schuit F. Expression and functional activity of glucagon-, GLP-1 and GIP-receptors in rat pancreatic islet cells. Diabetes. 1996;45:257–261. doi: 10.2337/diab.45.2.257. [DOI] [PubMed] [Google Scholar]
- Mu J, Jiand G, Brady E, et al. Chronic treatment with a glucagon receptor antagonist lowers glucose and moderately raises circulating glucagon and glucagon-like peptide 1 without severe alpha cell hypertrophy in diet-induced obese mice. Diabetologia. 2011;54:2381–2391. doi: 10.1007/s00125-011-2217-2. [DOI] [PubMed] [Google Scholar]
- Parker JC, Andrews KM, Allen MR, et al. Glycaemic control in mice with targetted disruption of the glucagon receptor gene. Biochem. Biophys. Res. Commun. 2002;290:839–843. doi: 10.1006/bbrc.2001.6265. [DOI] [PubMed] [Google Scholar]
- Quesada I, Tuduri E, Ripoll C, Nadal A. Physiology of the pancreatic α-cell and glucagon secretion: role in glucose homeostasis and diabetes. J. Endocrinol. 2008;199:5–19. doi: 10.1677/JOE-08-0290. [DOI] [PubMed] [Google Scholar]
- Qureshi SA, Candelore MR, Xie D, et al. A novel glucagon receptor antagonist inhinits glucagon-mediated biological effects. Diabetes. 2004;53:3267–3273. doi: 10.2337/diabetes.53.12.3267. [DOI] [PubMed] [Google Scholar]
- Riley MGI, Boorman GA, McDonald MM, Longnecker D, Solleveld HA, Giles HD. Guides of Toxicologic Pathology. Washington, DC: STP/ARP/AFIP; 1990. Proliferative and metaplastic lesions of the endocrine pancreas in rats; pp. 1–7. [Google Scholar]
- Rivera N, Everett-Grueter CA, Edgerton DS, et al. A novel glucagon receptor antagonist, NNC 25-0926, blunts hepatic glucose production in the conscious dog. J. Pharmacol. Exp. Ther. 2007;321:743–752. doi: 10.1124/jpet.106.115717. [DOI] [PubMed] [Google Scholar]
- Shaw IC, Jones HB. Mechanisms of non-genotoxic carcinogenesis. TiPS. 1994;15:89–93. doi: 10.1016/0165-6147(94)90284-4. [DOI] [PubMed] [Google Scholar]
- Silva Lima B, van der Laan JW. Mechanisms of non-genotoxic carcinogenesis and assessment of the human hazard. Regul. Toxicol. Pharmacol. 2000;32:135–143. doi: 10.1006/rtph.2000.1427. [DOI] [PubMed] [Google Scholar]
- Sipos B, Frank S, Gress T, Hahn S, Kloppel G. Pancreatic intraepithelial neoplasia revisited and updated. Pancreatology. 2009;9:45–54. doi: 10.1159/000178874. [DOI] [PubMed] [Google Scholar]
- Sloop KW, Cao JX-C, Siesky AM, et al. Hepatic and glucagon-like peptide-1-mediated reversal of diabetes by glucagon receptor anrisense oligonucleotide inhibitors. J. Clin. Invest. 2004;113:1571–1581. doi: 10.1172/JCI20911. [DOI] [PMC free article] [PubMed] [Google Scholar]
- Sörhede-Winzell M, Brand CL, Wierup N, et al. Glucagon receptor antagonism improves islet function in mice with insulin resistance induced by a high-fat diet. Diabetologia. 2007;50:1453–1462. doi: 10.1007/s00125-007-0675-3. [DOI] [PubMed] [Google Scholar]
- Spencer AJ, Andreu M, Greaves P. Neoplasia and hyperplasia of pancreatic endocrine tissue in the rat: an immunocytochemical study. Vet. Pathol. 1986;23:11–15. doi: 10.1177/030098588602300102. [DOI] [PubMed] [Google Scholar]
- Vincent M, Guz Y, Rozenberg M, et al. Abrogation of protein convertase 2 activity results in delayed islet cell differentiation and maturation, increased α-cell proliferation and islet neogenesis. Endocrinology. 2003;144:4061–4069. doi: 10.1210/en.2003-0088. [DOI] [PubMed] [Google Scholar]
- Webb GC, Akbar MS, Zhao C, et al. Glucagon replacement via micro-osmotic pump corrects hypoglycaemia and alpha cell hyperplasia in prohormone convertase 2 knockout mice. Diabetes. 2002;51:398–405. doi: 10.2337/diabetes.51.2.398. [DOI] [PubMed] [Google Scholar]
- Xu X, D'Hoker J, Stange G, et al. Beta cells can be generated from endogenous progenitors in injured adult mouse pancreas. Cell. 2008;132:197–207. doi: 10.1016/j.cell.2007.12.015. [DOI] [PubMed] [Google Scholar]
- Yu R, Dhall D, Nissen NN, et al. Pancreatic neuroendocrine tumours in glucagon-deficient mice. PLoS ONE. 2011;6:e23397. doi: 10.1371/journal.pone.0023397. [DOI] [PMC free article] [PubMed] [Google Scholar]
Associated Data
This section collects any data citations, data availability statements, or supplementary materials included in this article.
Supplementary Materials
Figure S1. Gene expression in PC2 knockout mice.
Figure S2. Oral glucose tolerance test in PC2 knockout mice.
Figure S3. Glucagon content of PC2 knockout mouse islets.


