

Abstract
Alcohol-related liver disease (ALD) is associated with steatohepatitis and insulin resistance. Insulin resistance impairs growth and disrupts lipid metabolism in hepatocytes. Dysregulated lipid metabolism promotes ceramide accumulation and oxidative stress, leading to lipotoxic states that activate endoplasmic reticulum (ER) stress pathways and worsen inflammation and insulin resistance. In a rat model of chronic alcohol feeding, we characterized the effects of a ceramide inhibitor, myriocin, on the histopathological and ultrastructural features of steatohepatitis, and the biochemical and molecular indices of hepatic steatosis, insulin resistance and ER stress. Myriocin reduced the severity of alcohol-related steatohepatitis including the abundance and sizes of lipid droplets and mitochondria, inflammation and architectural disruption of the ER. In addition, myriocin-mediated reductions in hepatic lipid and ceramide levels were associated with constitutive enhancement of insulin signalling through the insulin receptor and IRS-2, reduced hepatic oxidative stress and modulation of ER stress signalling mechanisms. In conclusion, ceramide accumulation in liver mediates tissue injury, insulin resistance and lipotoxicity in ALD. Reducing hepatic ceramide levels can help restore the structural and functional integrity of the liver in chronic ALD due to amelioration of insulin resistance and ER stress. However, additional measures are needed to protect the liver from alcohol-induced necroinflammatory responses vis-à-vis continued alcohol abuse.
Keywords: alcoholic liver disease, ceramides, electron microscopy, endoplasmic reticulum stress, insulin resistance, steatohepatitis
Introduction
Alcohol abuse is a leading cause of liver-associated morbidity and mortality (Paula et al. 2010; McCullough et al. 2011; Miller et al. 2011). Excessive chronic or binge alcohol consumption causes steatohepatitis, which can progress to chronic alcohol-related liver disease (ALD) (O'Shea et al. 2010) due to combined effects of sustained insulin and insulin-like growth factor (IGF) resistance, inflammation, oxidative and endoplasmic reticulum (ER) stress, lipotoxicity with ceramide accumulation and mitochondrial dysfunction (Lieber 2004; Kaplowitz & Ji 2006; de la Monte et al. 2008; Pang et al. 2009; Longato et al. 2012). Ethanol-impaired signalling through insulin and IGF type 1 (IGF-1) pathways (Sasaki & Wands 1994; Onishi et al. 2003; He et al. 2007; Ronis et al. 2007; de la Monte et al. 2008; Pang et al. 2009; Denucci et al. 2010; Setshedi et al. 2011) inhibits activation of mitogen-activated protein kinase, which supports liver regeneration, and phosphatidyl-inositol-3-kinase (PI3K) and Akt (Sasaki et al. 1994; Mohr et al. 1998; de la Monte et al. 2008) networks, which promote hepatocellular survival, motility and metabolism (Roberts et al. 2000). Moreover, ethanol-mediated inhibition of Akt increases activation of glycogen synthase kinase 3β (GSK-3β) (He et al. 2007) and phosphatases that negatively regulate receptor tyrosine kinases and PI3K (Yeon et al. 2003; He et al. 2007). Therefore, ethanol's long-term toxic and degenerative effects on the liver are propagated by the inhibition of insulin/IGF signalling, which propagates a broad array of critical and fundamental hepatic functions (Ronis et al. 2007; de la Monte et al. 2008; Derdak et al. 2011; de la Monte 2012).
Besides insulin resistance, other pathophysiological processes including cytotoxic and lipotoxic injury (McVicker et al. 2006; de la Monte et al. 2009; Cohen & Nagy 2011; Derdak et al. 2011), inflammation (Ronis et al. 2008; Cohen & Nagy 2011), oxidative and ER stress (Kaplowitz & Ji 2006; Pandol et al. 2010; Feldstein & Bailey 2011; Malhi & Kaufman 2011), metabolic and mitochondrial dysfunction (Purohit et al. 2009; Ding et al. 2011), decreased DNA synthesis (Pang et al. 2009) and increased cell death (Derdak et al. 2011) contribute to liver injury in ALD. Importantly, these factors worsen insulin resistance and its consequences. We hypothesize that sustained hepatic insulin resistance triggers a potent multipronged self-reinforcing cascade, that is, a reverberating loop that drives ALD to progress (de la Monte 2012). Therefore, besides insulin sensitizers, which have demonstrated efficacy in ALD (Pang et al. 2009; de la Monte et al. 2011), other components of the mal-signalling cascade must also be targeted to prevent eventual progression of ALD.
Among other potential therapeutic targets, we regard the contributions of lipid dyshomeostasis and ER stress as pivotal because they activate pro-inflammatory cytokines and promote oxidative stress and insulin resistance (Kao et al. 1999). Lipid dyshomeostasis leads to lipolysis and ceramide accumulation. Attendant lipotoxicity further impairs insulin (Holland & Summers 2008; Kraegen & Cooney 2008; Langeveld & Aerts 2009) and PI3K–Akt (Hajduch et al. 2001; Bourbon et al. 2002; Powell et al. 2003; Nogueira et al. 2008) signalling, activates pro-inflammatory cytokines and increases ER and oxidative stress (Lieber 2004; de la Monte et al. 2009; Ramirez et al. 2013a,b). Roles for ceramide accumulation in the pathogenesis and progression of ALD are suggested by the findings that (i) mice deficient in acidic sphingomyelinase are resistant to ethanol-induced hepatic steatosis (Garcia-Ruiz et al. 2003); (ii) ceramides inhibit AMPK (Liangpunsakul et al. 2010) and promote local hepatocellular injury (Anderson & Borlak 2008), possibly because AMPK reduces ER stress and apoptosis (Kuznetsov et al. 2011); and (iii) in advanced human ALD, hepatic ceramide levels are increased and their profiles are substantially altered (de la Monte 2012; Longato et al. 2012).
Endoplasmic reticulum stress develops or worsens with insulin resistance because vital ER functions such as protein synthesis, modification and folding; calcium signalling; and lipid biosynthesis (Hotamisligil 2010) all utilize glucose as the main source of energy, and insulin resistance impairs glucose uptake and metabolism. Ethanol-impaired insulin signalling promotes hepatocellular injury and death via all three major ER stress sensor cascades: PERK, inositol-requiring enzyme 1a (IRE-1α) and activating transcription factor-6α (ATF-6α) (Kaplowitz et al. 2007; Sundar-Rajan et al. 2007; Malhi & Gores 2008; Sharma et al. 2008). In addition, ethanol increases ER-resident sterol regulatory binding proteins (SREBP)-1c and-2, resulting in the upregulation of fatty acid/triglyceride synthesis, beta-oxidation (SREBP-1a) and cholesterol synthesis (SREBP-2) (Kaplowitz & Ji 2006). On the one hand, ER stress can potentiate insulin resistance and lipolysis, leading to increased ceramide production (Kaplowitz et al. 2007; Sundar-Rajan et al. 2007; Anderson & Borlak 2008; Malhi & Gores 2008) and worsening of inflammation and insulin resistance (Kaplowitz & Ji 2006; Ronis et al. 2008), and disease-associated lipolysis can be initiated by ER stress and mitochondrial dysfunction (Kaplowitz et al. 2007; Sundar-Rajan et al. 2007; Anderson & Borlak 2008; Malhi & Gores 2008). Therefore, it is not surprising that ER stress in ALD is marked by lipid dyshomeostasis and activation of proceramide and pro-inflammatory pathways that increase toxic lipid generation (Ozcan et al. 2004; Kaplowitz et al. 2007; Sundar-Rajan et al. 2007; Malhi & Gores 2008; Ronis et al. 2008).
Previous studies showed that treatment with peroxisome proliferator-activated receptor (PPAR) agonists, which are insulin sensitizers that also have anti-inflammatory actions, prevents or reverses a number of chronic ALD-related histopathological, ultrastructural, biochemical and molecular abnormalities caused by chronic ethanol exposure (Pang et al. 2009; Ramirez et al. 2013a,b). Despite striking responses to the PPAR-δ and PPAR-γ agonists in relation to liver regeneration, inflammation, histopathology and ultrastructural features (Pang et al. 2009; de la Monte et al. 2011; Ramirez et al. 2013a,b), all aspects of ALD were not resolved by the treatments. In particular, ceramide load and ER stress remained elevated (Ramirez et al. 2013a,b), setting the stage for ALD to eventually progress. Therefore, additional approaches are needed to more effectively resolve ALD. In the light of the known anti-inflammatory and anti-lipotoxic effects of ceramide inhibitors (Hinkovska-Galcheva & Shayman 2010; Kornhuber et al. 2010), we used an established model of chronic ALD to examine the therapeutic responses to myriocin, a potent ceramide inhibitor. The analyses were focused on liver histology, ultrastructural pathology, steatosis, insulin signalling and ER stress pathway activation.
Materials and methods
Materials
The Taqman Gene expression master mix, Amplex Red Triglyceride Assay Kit, Nile Red fluorescence-based assay for lipids, 4-methylumbelliferyl phosphate (4-MUP) fluorophore and Amplex UltraRed soluble fluorophore were purchased from Invitrogen (Carlsbad, CA, USA). QIAzol Lysis Reagent for RNA extraction was obtained from Qiagen, Inc (Valencia, CA, USA). OptiPlates (96-well) were from Thermo Fisher Scientific (Rochester, NY, USA). Mouse monoclonal anti-ceramide, oligodeoxynucleotide primers and myriocin were purchased from Sigma-Aldrich Co (St. Louis, MO, USA). The One Touch Ultra II glucometer was purchased from Lifescan, Inc (Milpitas, CA, USA). Rabbit polyclonal antibody to large acidic ribosomal protein (RPLPO) was purchased from Proteintech Group, Inc (Chicago, IL, USA). Fine chemicals were purchased from CalBiochem (Carlsbad, CA, USA) or Sigma-Aldrich. The Cytokeratin 18-M65 enzyme-linked immunosorbent assay (ELISA) kit was purchased from MyBiosource Inc (San Diego, CA, USA). The OxiSelect Protein Carbonyl Fluorometric Assay and OxiSelect HNE-His Adduct ELISA kit were purchased from Cell Biolabs, Inc (San Diego, CA, USA).
Experimental model
Adult male Long Evans rats (Harlan Sprague Dawley, Inc., Indianapolis, IN, USA) were pair-fed with the Lieber-DeCarli isocaloric liquid diet (BioServ, Frenchtown, NJ, USA) containing 0% to 37% (caloric content; 9.2% v/v) ethanol for 8 weeks (Pang et al. 2009; Denucci et al. 2010; Ramirez et al. 2013a,b). Both diets provided 151 kcal/l of protein and 359 kcal/l of fat. The control diet provided 490 kcal/l carbohydrates, while the ethanol diet contained 120 kcal/l carbohydrate and 370 kcal/l of ethanol. Chow-fed controls were studied in parallel, but their responses were similar to the liquid diet-fed controls. The mean blood alcohol levels (Mean ± SD) measured at 7 a.m. in this model were 19.7 ± 6.9 mg/dl for controls and 113.7 ± 12.7 mg/dl in the alcohol-fed group (P = 0.0006). Two weeks prior to initiating the study, rats were adapted to the liquid diets by incrementing ethanol from 0% to 11.8%, 23.6% and then to 37% of the caloric content. Controls were adapted to ethanol-free liquid diets over the same period. After 3 weeks on the full liquid diets, rats in each group were treated on Mondays, Wednesdays and Fridays with i.p. injections of myriocin (0.3 mg/kg) or saline (vehicle) in 100 μl volumes. The myriocin and vehicle treatments were continued through the last 5 weeks of the study. Myriocin is a serine palmitoyl transferase (de novo pathway) inhibitor. Rats were monitored daily to ensure adequate nutritional intake and maintenance of body weight. Throughout the experiment, rats were housed under humane conditions and kept on a 12-h light/dark cycle with free access to food. All experiments were performed in accordance with protocols approved by Institutional Animal Care and Use Committee at the Lifespan-Rhode Island Hospital, and they conform to guidelines established by the National Institutes of Health.
Liver tissue processing
At the end of the experiment, rats were fasted overnight and then sacrificed by isofluorane inhalation. Blood glucose was measured with a One Touch II glucometer. Serum was used to measure triglycerides and ceramide immunoreactivity (ELISA). Portions of liver were snap-frozen in a dry ice/methanol bath and stored at −80 °C for protein, lipid and RNA studies. Liver tissue was immersion-fixed in 4% buffered paraformaldehyde for histological studies or in modified Karnovsky's fixative (2.5% glutaraldehyde and 2% paraformaldehyde in 0.15 M sodium cacodylate) for transmission electron microscopic (EM) examination. Paraformaldehyde-fixed tissues were embedded in paraffin, and adjacent histological sections (5 or 10 μm thick) were stained with haematoxylin and eosin (H&E) and Sirius Red (collagen stain). Cryostat sections (5 to 10 μm thick) of paraformaldehyde-fixed, non-paraffin-embedded liver samples were stained with Oil red O to assess steatosis. After Karnovsky fixation, the tissues were postfixed in osmium tetroxide and embedded in Spurrs's epoxy resin. Semi-thin (1 μm thick) sections were stained with methylene blue–azure II to select optimum regions for transmission EM studies. Ultra-thin (50–60 nm) sections, contrasted with uranyl acetate and lead citrate, were examined using a Morgagni 268 transmission electron microscope and photographed with an AMT Advantage 542 CCD camera.
Lipid assays
Liver homogenates were prepared in lysis buffer containing 50 mM Tris (pH 7.5), 150 mM NaCl, 5 mM EDTA (pH 8.0), 50 mM NaF, 0.1% Triton X-100, and protease and phosphatase inhibitors (Longato et al. 2012; Ramirez et al. 2013a,b; Setshedi et al. 2011). Total neutral lipid content was measured using the Nile Red microplate assay (McMillian et al. 2001), and triglycerides were measured using a commercial assay. Fluorescence (Ex 485/Em 572) was measured in a SpectraMax M5 microplate reader. Results were normalized to sample protein content. Ceramide immunoreactivity was quantified by ELISA (Longato et al. 2012; Ramirez et al. 2013a,b).
Oxidative Stress/Apoptosis Assays: The Cytokeratin 18-M65 (CK18) ELISA kit was used to assess apoptosis/cellular injury in liver and serum. The OxiSelect Protein Carbonyl Fluorometric Assay OxiSelect HNE-His Adduct ELISA kit was used to assess levels of oxidative macromolecular injury and stress. Apoptotic/CK18 immunoreactivity was measured in liver tissue homogenates and serum. Protein carbonyl immunoreactivity was measured in liver tissue to assess levels of protein oxidation. HNE immunoreactivity was measured in serum as an index of lipid peroxidation. These commercial assay kits were used as directed by the manufacturers.
Quantitative reverse-transcriptase polymerase chain reaction assays
Total RNA was extracted from fresh-frozen tissue using the RNeasy Mini Kit (Qiagen, Valencia, CA, USA). RNA was reverse-transcribed using random oligonucleotide primers and the AMV 1st Strand cDNA Synthesis Kit. Gene expression was measured using a hydrolysis probe-based duplex quantitative reverse-transcriptase polymerase chain reaction (qRT-PCR) assay with β-actin as a reference gene as previously described (Longato et al. 2012; Ramirez et al. 2013a,b). Gene-specific primers and matched probes were determined with the ProbeFinder software (Roche, Indianapolis, IN, USA) (Ramirez et al. 2013a,b). PCR amplifications were performed in a LightCycler 480 (Roche), and results were analysed using the LightCycler® software 4.0.
Enzyme-linked immunosorbent assay
Endoplasmic reticulum stress pathway activation was assessed with direct-binding duplex ELISAs in which immunoreactivity was normalized to large acidic ribosomal protein (RPLPO) measured in the same wells as previously described (Longato et al. 2012). Liver homogenates were prepared with the buffer described earlier. Direct-binding ELISAs were performed in 96-well MaxiSorp plates. Protein samples (100 ng/50 μl) were adsorbed to the well bottoms by overnight incubation at 4 °C and then blocked for 3 h with 1% bovine serum albumin in Tris-buffered saline. After washing, the samples were incubated with primary antibody (0.1–0.4 μg/ml) for 1 h at 37 °C. Immunoreactivity was detected with horseradish peroxidase (HRP)-conjugated secondary antibody followed by Amplex UltraRed soluble fluorophore. Fluorescence intensity was measured (Ex 565 nm/Em 595 nm) in a SpectraMax M5 microplate reader (Molecular Devices, Sunnyvale, CA, USA). The samples were then incubated with biotin-conjugated antibodies to RPLPO, and immunoreactivity was detected with streptavidin-conjugated alkaline phosphatase (1:1000) and 4-MUP. Fluorescence (Ex360/Em450) intensity was measured in a SpectraMax M5. Binding specificity was determined from parallel negative control incubations in which the primary or secondary antibody was omitted. The ratio of specific protein/RPLPO immunoreactivity was calculated and used for intergroup statistical comparisons.
Statistics
All assays were performed with eight or 10 samples per group. Data depicted in box plots reflect group medians (horizontal bar), 95% confidence interval limits (upper and lower box limits) and range (whiskers). Data were analysed using GraphPad Prism 5 software (GraphPad Software, Inc., San Diego, CA, USA), and intergroup comparisons were made using repeated-measures one-way analysis of variance (anova) with Tukey's post hoc multiple comparison test of significance.
Results
Systemic and hepatic effects of myriocin treatment
Body weight increased steadily in all four groups (Figure 1a). However, myriocin treatment of ethanol-fed rats caused obvious tapering of body weight gain, beginning 1 week after the treatments were initiated (Figure 1a). At the end of the experiment, myriocin-treated control and ethanol-fed rats were significantly leaner than vehicle-treated rats. Mean body weight was lowest in the ethanol + myriocin group (Figure 1b).
Figure 1.
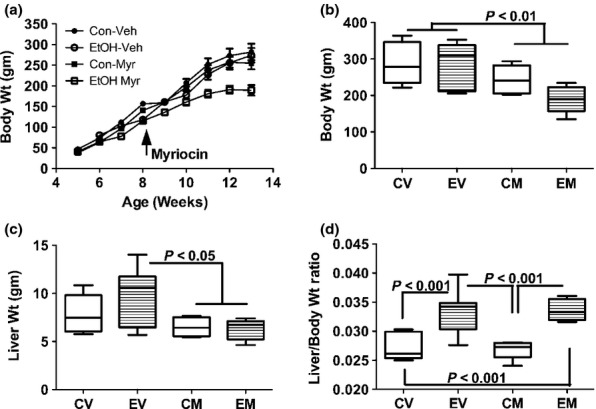
Effects of chronic ethanol feeding and myriocin treatment on body and liver weights. Adult Long Evans male rats (beginning at 5 weeks of age) were maintained for 8 weeks on isocaloric liquid diets containing 0% or 37% ethanol by caloric content. After 3 weeks on the liquid diets, rats in each group were treated with vehicle or myriocin by i.p. injection on Mondays, Wednesdays, and Fridays of the subsequent 5 weeks of the experiment. (a) Rats were weighed weekly and (b) on the last day of the experiment. (c) Fresh livers were weighed immediately upon harvest, and (d) individual ratios of liver to body weights were calculated. Data were generated from 10 to 12 rats per group. Box plots depict medians (horizontal bars), 95% confidence intervals (upper and lower limits of boxes), and ranges (stems). Inter-group comparisons were made by repeated measures one-way anova with post-hoc Tukey tests of significance. CV, control diet, vehicle (saline) injected; EV, ethanol diet, vehicle treated; CM, control diet, myriocin treated; EM, ethanol diet, myriocin treated.
Mean liver weight was highest in the ethanol + vehicle group, corresponding with their hepatic steatosis. Myriocin-treated control and ethanol-exposed rats had the lowest mean liver weights; the differences from the ethanol + vehicle group were statistically significant (P < 0.05) (Figure 1c). Liver/body weight ratios were calculated to assess relative liver size. Those analyses revealed strikingly and significantly increased liver/body weight ratios in ethanol-fed relative to control rats, irrespective of myriocin treatment (P < 0.001; Figure 1d). These findings are explained by the disproportionate increases in liver weight among ethanol + vehicle-treated rats and disproportionate reductions in body weight compared with liver weight in the ethanol + myriocin group.
Overnight fasting blood glucose levels were significantly increased in the ethanol + vehicle relative to all other groups (P < 0.05; Figure 2a). Myriocin normalized fasting blood glucose in chronic ethanol-fed rats, but did not affect blood glucose in control rats (Figure 2a). Serum triglyceride levels were slightly increased in the ethanol + vehicle and control+myriocin groups, but the intergroup differences did not reach statistical significance (Figure 2b). Serum ceramide levels were significantly increased in chronic ethanol-fed relative to control rats, irrespective of myriocin treatment (P < 0.01; Figure 2c). Although myriocin modestly reduced serum ceramide levels relative to the corresponding vehicle-treated groups, those effects did not reach statistical significance.
Figure 2.
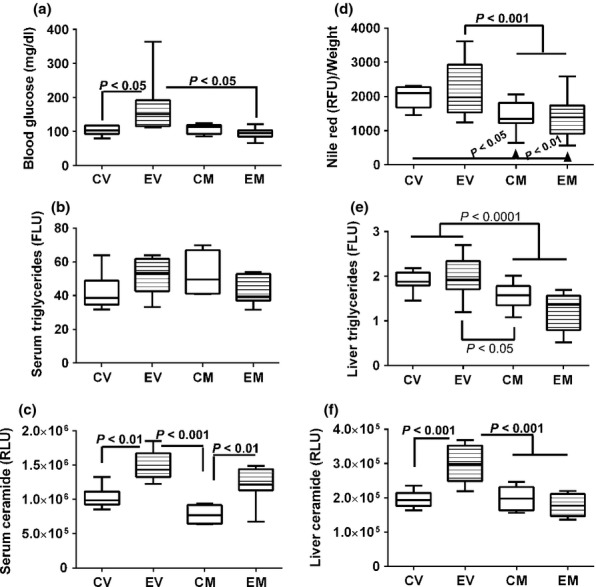
Effects of chronic ethanol feeding and myriocin treatment on fasting blood glucose, and serum and hepatic lipids. (a) Blood glucose levels were measured with a glucometer (b) Nile red fluorescence was measured in liver tissue homogenates and normalized to protein content. (b, e) Triglycerides were measured in (b) serum and (e) liver lipid extracts using a commercial assay kit (FLU, fluorescence light units). Liver tissue results were normalized to sample weight. (d) Nile red fluorescence assay was used to measure hepatic neutral lipids in protein homogenates. Results were normalized to sample weight (RFU, relative fluorescence units). (c and f) Serum and hepatic ceramide levels were measured by ELISA with luminescence detection (RLU, relative light units). Data were generated from 10 to 12 rats per group. Box plots depict medians (horizontal bars), 95% confidence intervals (upper and lower limits of boxes), and ranges (stems). Inter-group comparisons were made by repeated measures one-way anova with post-hoc Tukey tests of significance. CV, control diet, vehicle (saline) injected; EV, ethanol diet, vehicle treated; CM, control diet, myriocin treated; EM, ethanol diet, myriocin treated.
Hepatic Nile Red fluorescence levels were similar for all groups (Figure 2d). Hepatic triglyceride levels were similar for the control + vehicle, ethanol + vehicle and control + myriocin groups and slightly reduced in livers from ethanol + myriocin-treated rats. However, the intergroup differences did not reach statistical significance. In contrast, hepatic ceramide immunoreactivity was significantly increased in chronic ethanol-fed and vehicle-treated rats relative to all other groups (P < 0.001). Myriocin significantly reduced hepatic ceramide levels in ethanol-fed rats, but had no measured effect in control rats (Figure 2f).
Effects of myriocin on the histopathology of experimental alcohol-induced steatohepatitis
Control livers had the expected chord-like architecture and were free of inflammation, steatosis, fibrosis and cholestasis (Figure 3a). Myriocin treatment produced subtle changes in control livers, such that the hepatocytes were rendered more polygonal with discrete cell borders relative to control + vehicle livers (Figure 3b). Chronic ethanol feeding caused steatohepatitis characterized by diffuse hepatocellular microvesicular steatosis, loss of the chord-like architecture, multifocal microfoci of inflammation, hepatocellular apoptosis or necrosis and scattered hepatocytes with ballooning degeneration (Figure 3c). Myriocin treatment of ethanol-fed rats largely restored the hepatic architecture and reduced inflammation and steatosis, although foci of apoptosis, degeneration and cell turnover were still detected (Figure 3d).
Figure 3.
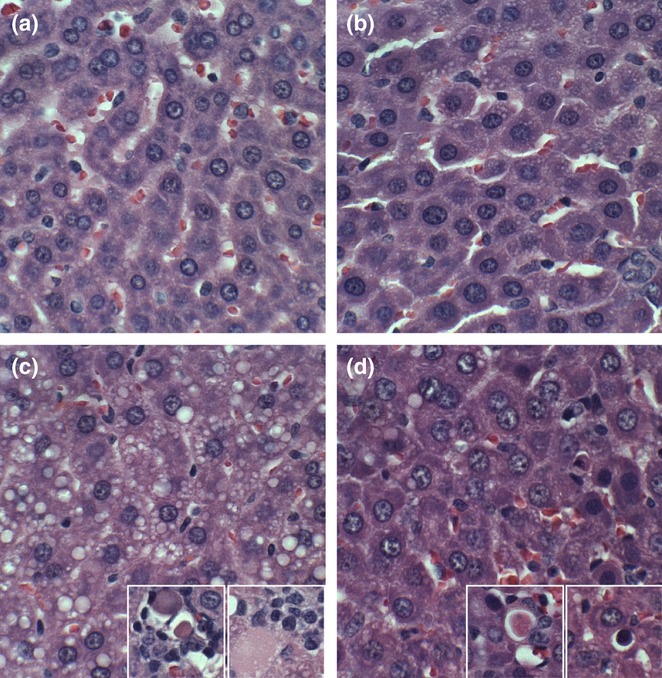
Histopathologic features of experimental alcohol-induced steatohepatitis-effects of myriocin treatment. Adult male Long Evans rats were fed with isocaloric liquid diets containing 0% (control) or 37% ethanol (caloric content) for 8 weeks, and treated with vehicle or myriocin three times per week over the last 5 weeks of the experiment. Formalin-fixed paraffin-embedded 5 μm thick sections of liver were stained with H&E. (a) Control livers had regular chord-like architectures and uniform hepatocyte structure. (b) Myriocin treatment had no discernible effect on hepatic architecture in control rats. (c) Ethanol-exposed livers exhibited loss of the chord-like architecture with marked variability in hepatocyte cytology, prominent micro-vesicular steatosis (clear cytoplasmic vacuoles), foci of lymphomononuclear cell inflammation, and apoptotic bodies (arrows). (d) Myriocin treatment nearly normalized hepatic architecture in ethanol-fed rats.
Oil red O staining demonstrated zonal and relatively low levels of lipid accumulation in control livers, irrespective of myriocin treatment (Figure 4a,b). Chronic ethanol feeding caused striking panlobular increases in hepatic steatosis, with both coarse and fine lipid droplet accumulations in hepatocytes (Figure 4c). In ethanol + myriocin-treated livers, Oil red O staining levels and distribution were strikingly reduced relative to ethanol + vehicle-treated livers. In fact, myriocin rendered the levels of hepatic steatosis similar to, or somewhat less than, control (Figure 4d).
Figure 4.
Increased hepatic steatosis in experimental chronic ALD-effects of myriocin treatment. Cryostats sections of formalin-fixed livers from (a) control + vehicle, (b) Control + myriocin, (c) ethanol + vehicle, and (d) ethanol + myriocin were stained with Oil Red O to detect cytoplasmic lipid accumulation (red punctate labeling).
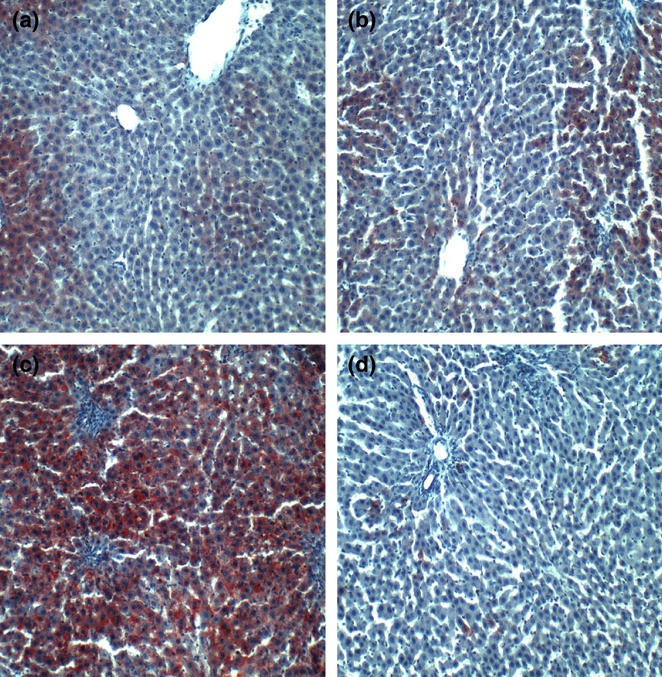
In livers from the control + vehicle group, Sirius Red staining for collagen was fine and scantily distributed within the lobules and around individual hepatocytes (Figure 5a). In control+myriocin livers, Sirius Red staining of hepatocyte nuclei and sinusoidal edges was slightly increased relative to corresponding controls (Figure 5b), but this effect could reflect enhanced definition of cell boundaries. Chronic ethanol feeding increased the coarseness and abundance of intralobular and perihepatocyte Sirius Red staining of collagen fibrils (Figure 5c). Sirius Red staining of ethanol + myriocin-treated livers was similar to that observed in the corresponding control livers (Figure 5d). Therefore, myriocin prevented or reversed fibrogenesis in chronic ethanol-exposed livers.
Figure 5.
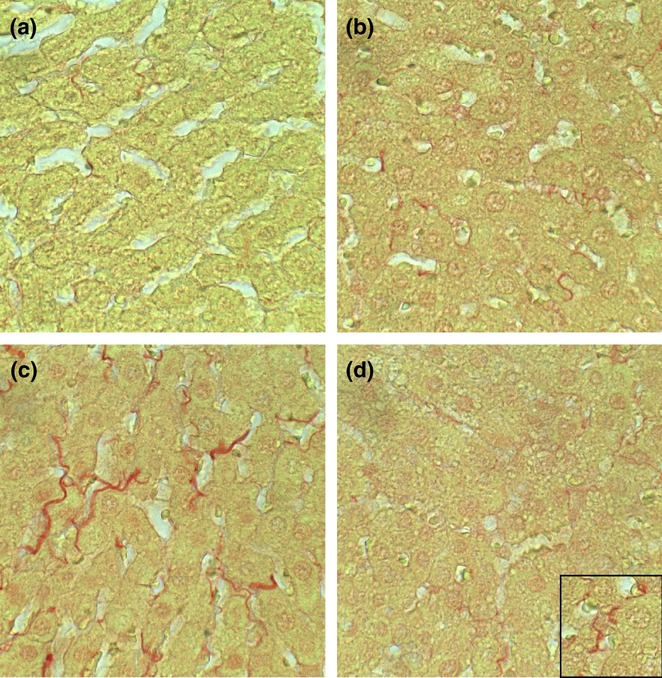
Early hepatic fibrosis in experimental chronic ALD-effects of myriocin treatment. Formalin-fixed paraffin embedded liver sections from (a) control + vehicle, (b) Control + myriocin, (c) ethanol + vehicle, and (d) ethanol + myriocin were stained with Sirius Red to detect collagen. Note minimal labeling in (a, b) control and (d) myriocin-treated, ethanol-exposed livers compared with (c) ethanol-exposed livers (collagen fibrils are stained red).
Effects of myriocin treatment on the ultrastructural pathology of experimental alcohol-induced steatohepatitis
Transmission EM demonstrated regular parallel organized ER in close association with regularly distributed mitochondria that had well-organized cristae (Figure 6a). In contrast, chronic ethanol-exposed livers had increased densities of lipid vacuoles, pronounced variability in shape and size of mitochondria, enlargement of mitochondria, irregularity of mitochondrial cristae and abnormalities in the ER ranging from dilation with irregular spacing and density of ribosomes to pronounced architectural disruption (Figure 6c). Myriocin treatment rendered the RER more uniform and increased mitochondrial abundance in control livers (Figure 6b). In ethanol-fed rats, myriocin reduced the size and abundance of lipid droplets, rendered mitochondria more uniform and enhanced the RER profiles, whereby parallel-beaded tracts were more readily detected (Figure 6d). One unusual effect of myriocin in ethanol-exposed livers was that the RER tended to encapsulate mitochondria rather than be arranged in typical parallel stacks adjacent to mitochondria (Compare Figure 6d to Figure 6a,b).
Figure 6.
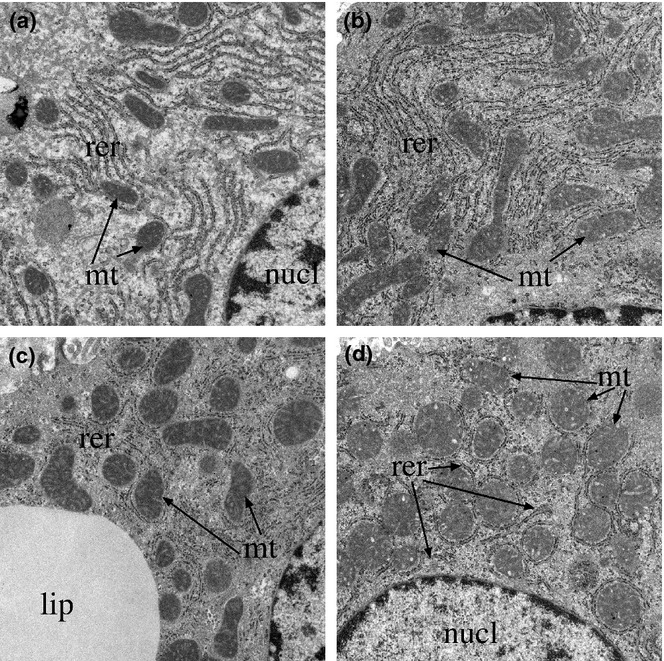
Ultrastructural features of experimental chronic alcohol-induced liver injury, with or without myriocin treatment. Liver tissue from adult male Long Evans rats that were fed for 8 weeks with isocaloric Lieber-diCarli diets containing 0% or 37% ethanol and treated with vehicle or myriocin by i.p. injection during the last 5 weeks of the experiment. Liver tissues were fixed in Karnovsky's, post-fixed in osmium tetroxide, and embedded in resin. Ultra-thin (50–60 nm) sections were contrasted with uranyl acetate and lead citrate and examined by transmission electron microscopy. (a) Control + vehicle and (b) control + myriocin treated livers exhibited regular parallel organized endoplasmic reticulum (ER) (er) in close association with mitochondria (m). (c) Ethanol + vehicle treated livers exhibited irregularly arranged and disrupted ER, striking variability in mitochondrial size and shape with enlargement and disruption of the normal cristae in ethanol-exposed livers. (d) Ethanol + myriocin treated livers showing nearly normal ER morphology, reduced lipid droplets, and normalized mitochondria size and distribution in ethanol+myriocin treated livers (L, lipid droplet). (n, nucleus), (Original magnifications: a−d = ×18 000).
Effects of myriocin on hepatic insulin and IGF signalling mediators
Duplex probe-hydrolysis-based qRT-PCR analysis demonstrated that chronic ethanol feeding significantly reduced hepatic mRNA levels of insulin, insulin receptor and IGF-2 receptor, and increased IRS-2 expression relative to control. Myriocin treatment of control rats reduced hepatic expression of insulin receptor and IRS-1 relative to vehicle. In ethanol-fed rats, myriocin increased hepatic expression of insulin, decreased expression of insulin receptor, IGF-1, IRS-1 and IRS-2, and had no significant effect on IGF-2, or IGF-1 and IGF-2 receptors relative to corresponding vehicle-treated rats (Figure 7). Furthermore, myriocin treatments resulted in similar hepatic levels of insulin, IRS-1 and IRS-2 gene expressions in control and ethanol-fed rats, whereas the relatively reduced levels of insulin receptor and IGF-2 receptor in ethanol-fed rats were not corrected by myriocin treatments. Additional studies using multiplex or single-plex ELISAs examined the effects of ethanol and myriocin on downstream signalling through Akt, GSK-3β and extracellular signal-regulated kinases (ERK 1/2). The results demonstrated that ethanol inhibition of signalling through Akt was restored by myriocin treatment and that hepatic levels of total ERK were significantly increased by myriocin in both control and ethanol-fed rats (Table S1).
Figure 7.
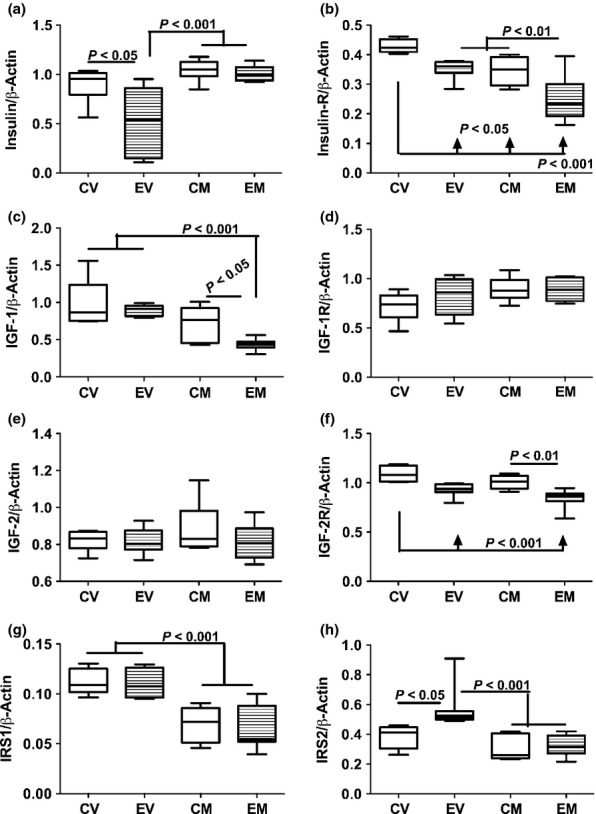
Chronic ethanol feeding and myriocin treatment effects on hepatic insulin, IGF and IRS signaling mechanisms. Total RNA was isolated from livers of control and ethanol-fed, vehicle or myriocin treated adult rats. Gene expression was measured using by duplex qRT-PCR analysis with a probe-hydrolysis detection system. The β-actin housekeeping gene was simultaneously amplified and detected in the same well as the gene of interest (see Methods). Graphs depict relative mRNA abundance of (a) insulin polypeptide, (b) insulin receptor, (c) IGF-1 polypeptide, (d) IGF-1 receptor (IGF-1R), (e) IGF-2 polypeptide, (f) IGF-2R, (g) insulin receptor substrate, type 1 (IRS1), and (h) IRS2. Box plots depict medians (horizontal bars), 95% confidence intervals (upper and lower limits of boxes), and ranges (stems). Inter-group comparisons were made by repeated measures one-way anova with post-hoc Tukey tests of significance. CV, control diet, vehicle (saline) injected; EV, ethanol diet, vehicle treated; CM, control diet, myriocin treated; EM, ethanol diet, myriocin treated.
Effects of chronic ethanol exposure and myriocin treatment on ER stress protein expression in liver
Endoplasmic reticulum stress mechanisms are activated in steatohepatitis and in association with hepatic ceramide accumulation and insulin resistance. ER stress contributes to ALD by promoting oxidative injury and inflammation. To determine the effects of myriocin on ER stress in experimental ALD, we measured immunoreactivity of proteins that mediate ER stress at various levels in the cascade (Jager et al. 2012), including glucose-regulated protein 78 (GRP-78/BiP), protein disulphur isomerase (PDI), IRE-1α, calnexin, C/EBP homologous protein transcription factor (CHOP) and ER oxidoreductase-1α (ERO-1α). See Table 1 for specific functions. Chronic ethanol feeding significantly reduced hepatic expression of PDI, calnexin, IRE-1α, CHOP and ERO-1α, but had no significant effect on GRP-78 relative to vehicle-treated controls (Figure 8). Myriocin significantly increased hepatic expression of all ER stress pathway proteins in both control and ethanol-fed rats, relative to the corresponding vehicle-treated groups. However, expression of PDI, calnexin and IRE-1α remained significantly lower in myriocin-treated ethanol-fed relative to control livers (Figure 8). In contrast, the levels of CHOP and ERO-1α were similarly higher in myriocin-treated control and ethanol-fed rats (Figure 8).
Table 1.
ER Stress pathway genes and proteins
| Gene/Protein | Full name | Function/Regulation | Cellular/Molecular effect |
|---|---|---|---|
| GRP-78/BiP | Glucose-regulated protein 78 | Molecular chaperone | Maintains transmembrane receptor proteins; initiates UPR downstream signalling; prevents mal-folded proteins from being secreted |
| PDI | Protein disulphur isomerase | Molecular chaperone complex | Escorts mal-folded protein to ubiquitin proteasome pathway and directly oxidizes disulphide bonds in folding proteins. |
| IRE-1α | Inositol-requiring enzyme 1α | Activated by BiP dissociation from receptor | Promotes splicing of XBP1 to generate an active transcription factor (sXBP1), activates JNK. |
| Calnexin | Calnexin | Lectin for glycosylated proteins | Binds newly synthesized glycosylated proteins in the ER to facilitate their folding and assembly. |
| CHOP/GADD153 | C/EBP homologous protein transcription factor | Transcription factor | Upregulates GADD34 leading to eIF-2α dephosphorylation in a negative feedback loop. Promotes apoptosis and oxidative stress via ERO-1α and caspase activation and represses expression of protective Bcl2 |
| ERO-1α | ER oxidoreductase-1α | ER oxidoreductase | Activated by CHOP and mediates the oxidation of protein disulphide isomerase (PDI) |
Figure 8.
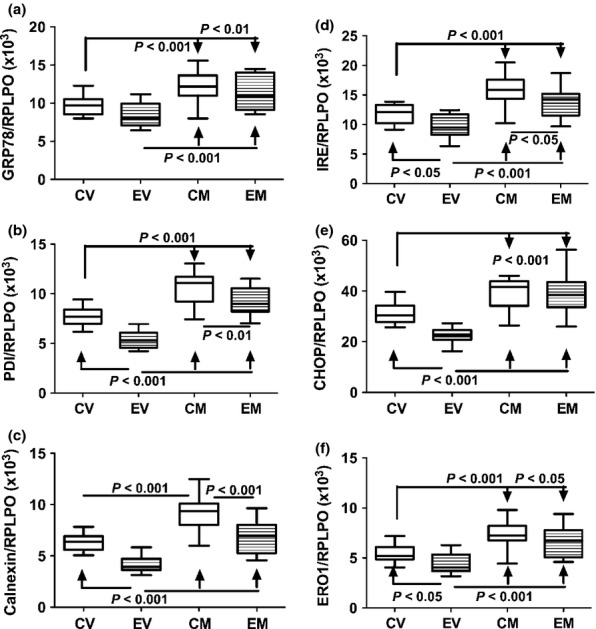
Effects of chronic ethanol exposure and myriocin treatment on hepatic endoplasmic reticulum (ER) stress mechanisms. ER stress protein expression was measured by ELISA using horseradish peroxidase (HRP)-conjugated secondary antibody and Amplex UltraRed soluble fluorophore. Graphs depict immunoreactivity corresponding to (a) Bip/ glucose-regulated protein 78 (GRP78), (b) protein disulphide isomerase (PDI), (c) calnexin, (d) inositol requiring enzyme-1 (IRE-1α), (e) CHOP, and (f) endoplasmic oxidoreductin-1 (ERO-1). Fluorescence was measured (Ex 530 nm/Em 590 nm) in a Spectramax M5 microplate reader (FLU, fluorescence light units). Immunoreactivity was normalized to large ribosomal protein (RPLPO) measured in the same wells. Box plots depict medians (horizontal bars), 95% confidence interval limits (tops and bottoms of boxes), and range (stems). Inter-group comparisons were made using one way repeated measures anova and the Tukey multiple comparisons post hoc significance test.
Effects of ethanol and myriocin on indices of apoptosis and oxidative stress
To further assess the effect of myriocin on ethanol-induced oxidative stress and hepatocellular apoptosis, we measured protein carbonyl levels in liver, HNE immunoreactivity in serum and CK18 immunoreactivity (apoptosis) in liver and serum by ELISA (Figure 9). Hepatic protein carbonyl levels were significantly higher in the ethanol + vehicle relative to all other groups (Figure 9a). Myriocin treatment significantly reduced hepatic protein carbonyl levels relative to vehicle in the ethanol groups. In contrast, serum HNE levels (marker of lipid peroxidation and oxidative stress) were significantly higher in the ethanol versus control groups, irrespective of myriocin treatment (Figure 9b). CK18 immunoreactivity was significantly reduced by myriocin treatment in both control and ethanol-exposed groups, and the responses in ethanol-exposed livers were striking (Figure 9c). Median levels of serum CK18 immunoreactivity were similar among the groups, except the variances in ethanol-fed rats were higher due to higher levels in 50% of the groups (Figure 9d). Myriocin reduced the variance in ethanol-exposed livers. Consequently, CK18 serum levels were significantly different between the control + myriocin and ethanol + vehicle groups, but not ethanol + myriocin group.
Figure 9.
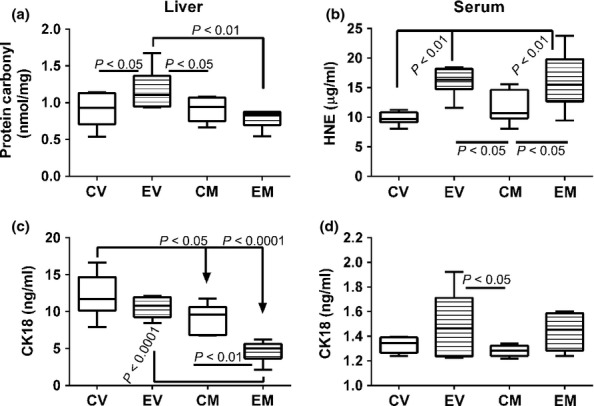
Myriocin effects on indices of liver injury and oxidative stress. ELISAs were used to assess oxidative stress, lipid peroxidation, and tissue injury/cell death with commercial assays of (a) protein carbonylation-liver, (b) 4-hydroxy-2-nonenal (HNE)-serum, and (c, d) cytokeratin 18 (CK18)-liver and serum. Assay results were calculated from standard curves, and the levels of each substance are expressed as per ml of serum or per mg of liver protein. Box plots depict medians (horizontal bars), 95% confidence interval limits (tops and bottoms of boxes), and range (stems). Inter-group comparisons were made using one way repeated measures anova and the Tukey multiple comparisons post hoc test.
Discussion
Effects of myriocin on body growth, blood glucose and lipids, and hepatic lipid content, including ceramides
This study examined the effects of myriocin, a potent ceramide inhibitor, on steatohepatitis, insulin resistance and ER stress in an experimental model of chronic ALD. Myriocin is an inhibitor of de novo ceramide synthesis and functions by inhibiting serine palmitoyl transferase (de novo pathway) (Bismuth et al. 2008; Jiang et al. 2011), which is proximal within the cascade (Reynolds et al. 2004). Myriocin was used in these experiments because preliminary studies found it to be more effective than desipramine and fumonisin B for reducing cytotoxicity in liver slice culture models of steatohepatitis (Setshedi et al. 2010). The present study examined several interrelated aspects of liver injury including (i) histological and ultrastructural pathology; (ii) expression of genes that regulate insulin/IGF signalling; and (iii) ER stress pathway activation.
One of the main systemic effects of chronic myriocin treatment was to reduce body mass in both control and ethanol-fed rats, although the responses were more striking in the ethanol group. In addition, myriocin normalized fasting blood glucose, which was increased by chronic ethanol feeding. As there were no detectable changes in behaviour or general health, the myriocin-induced leanness and normalization of blood glucose are positive off-target effects that might be exploited to treat obesity, insulin resistance and steatohepatitis. Persistently high serum ceramide levels in chronic ethanol-fed rats could reflect systemic dysregulation of lipid metabolism and ongoing metabolic injury in the setting of chronic alcohol abuse.
Increased liver weight in ethanol + vehicle-treated rats corresponds with hepatic steatosis, as reported (Lyn-Cook et al. 2009). Myriocin-induced reductions in liver weight correlate with resolution of hepatic steatosis, as demonstrated by multiple morphological approaches. Importantly, chronic ALD was associated with strikingly increased hepatic ceramide levels, which resolved with steatosis after myriocin treatment. Correspondingly, hepatic ceramide levels were also found to be strikingly higher in humans with chronic ALD (Longato et al. 2012). These findings suggest that excessive ceramide accumulation is a critical mediator of steatohepatitis in ALD. The concept that hepatic ceramide accumulation contributes to the histopathological features of ALD is novel and argues that hepatic ceramide levels and perhaps their profiles (mass spectrometry) (Longato et al. 2012; Ramirez et al. 2013a,b) could be used to monitor ALD severity.
Ceramide inhibitor effects on ALD pathology
Myriocin substantially reduced several histopathological and ultrastructural abnormalities in experimental ALD including hepatic steatosis, loss of the chord-like architecture, megamitochondria, ER disarray and intralobular inflammation, whereas focal necrosis/apoptosis persisted. In addition, myriocin reduced ALD-associated perihepatocyte and sinusoidal fibrosis, which marks the beginning stages of fibrogenesis. This suggests that increased hepatic ceramide levels mediate mitochondrial dysfunction (reflected by megamitochondria), ER stress (disruption of ER parallel tubular profiles and ribosome studding), steatosis and fibrogenesis in chronic ALD, whereas the toxic effects of alcohol and/or acetaldehyde mediate hepatocellular injury with necrosis/apoptosis. Although reducing ceramide levels in ALD can lead to restoration of liver structure and function, anti-inflammatory and/or antioxidant measures are likely needed to suppress necroinflammatory responses.
Role of impaired insulin/IGF-1/IRS signalling
Previous experimental animal and human studies showed that chronic ALD is associated with hepatic insulin and IGF resistance and significant alterations in trophic factor, receptor and/or IRS expression (Denucci et al. 2010; Longato et al. 2012; Pang et al. 2009; Ramirez et al. 2013a,b). Reduced trophic factor expression represents a state of trophic factor withdrawal, whereas increased receptor or IRS expression could reflect upregulation of genes due to receptor or IRS resistance. Disease-associated reductions in receptor expression could reflect cell loss, downregulation of the genes or perhaps adaptive responses to ligand gene upregulation. The studies herein demonstrate constitutive inhibition of insulin polypeptide, insulin receptor and IGF-2 receptor expression in ethanol + vehicle-treated livers, indicating that insulin and IGF-2 signalling were substantially impaired. The aberrantly increased levels of IRS-2 expression in ethanol+vehicle-treated livers could reflect insulin resistance with compensatory upregulation of the docking protein needed to transmit signals downstream. Myriocin reduced IGF-1 polypeptide and IRS-1 gene expression in both control and ethanol-exposed livers, but not IGF-2 receptor expression in ethanol-exposed livers. The inhibitory effects of ethanol and therapeutic responses to myriocin were reflected by downstream effects on signalling through Akt and GSK-3β. Therefore, myriocin-mediated reductions in hepatic ceramide and restoration of hepatic architecture were associated with partial normalization of insulin signalling networks. This suggests that the therapeutic effects of myriocin favour enhancement of insulin and IRS-2, rather than IGF-1 and IGF-2 networks. Insulin signalling is an important regulator of energy metabolism, cell survival and stress responses, whereas IGFs have major roles in regulating cell proliferation (de la Monte 2012).
Effects of chronic ALD and myriocin on ER stress mediators in liver
Insulin resistance, inflammation and ceramide accumulation promote ER stress, and ER stress exacerbates insulin resistance, inflammation, oxidative stress and ceramide accumulation (Urano et al. 2000; McCullough et al. 2001; Ozcan et al. 2004; Carracedo et al. 2006; Hu et al. 2006; Sauane et al. 2010; Senkal et al. 2010; Boslem et al. 2011). The ER mediates protein synthesis, folding, maturation and trafficking (Hotamisligil 2010) and is critical for Ca2+ homeostasis and triglyceride synthesis. ER stress occurs with disruption of homeostatic mechanisms and attendant accumulation of unfolded proteins and increased formation of reactive oxygen and reactive nitrogen species. Prolonged activation of the unfolded protein response (UPR) leads to inflammation, injury, steatosis and apoptosis (Kaplowitz & Ji 2006; Hotamisligil 2010; Pandol et al. 2010; Jager et al. 2012).
Normally, the ER adapts to stress by activating the UPR (Ozcan et al. 2004; Malhi & Kaufman 2011), which quickly increases levels of ER stress sensor proteins including inositol-requiring enzyme 1 (IRE-1α), PKR-like ER-localized eIF-2α kinase (PERK) and the activating transcription factor 6α (ATF-6α; ER membrane-anchored transcription factor). PERK and IRE-1α transmit stress signals in response to protein misfolding or unfolding and thereby activate ER stress networks (Hotamisligil 2010). PERK drives global arrest of protein synthesis and upregulates the transcription factor C/EBP homologous protein CHOP, which promotes apoptosis. IRE-1α increases transcription of chaperones and ER-associated protein degradation (ERAD) machinery.
Insulin resistance drives ER stress because vital ER functions such as protein synthesis, modification and folding; calcium signalling; and lipid biosynthesis utilize glucose as the main source of energy; insulin resistance impairs glucose uptake and metabolism. Moreover, pathogenic lipolysis leading to ceramide accumulation is initiated by critical levels of ER stress and mitochondrial dysfunction (Kaplowitz et al. 2007; Sundar-Rajan et al. 2007; Anderson & Borlak 2008; Malhi & Gores 2008). Ethanol activates all major ER stress sensor cascades (Kaplowitz et al. 2007; Sundar-Rajan et al. 2007; Malhi & Gores 2008; Sharma et al. 2008), and the resulting increased levels of ER stress exacerbate insulin resistance and lipolysis. End results include increased ceramide production (Szulc et al. 2006; de la Monte 2012), worsening of inflammation and insulin resistance, and lipotoxicity (Kaplowitz & Ji 2006; Banerjee et al. 2008; Ronis et al. 2008).
Herein, we observed relative inhibition of PDI, calnexin, IRE-1α, CHOP/GADD153 and ERO-1α in ethanol + vehicle relative to control + vehicle livers. ERO-1α, complexed with the PDI molecular chaperone, mediates oxidation of disulphide bonds in folding proteins. The ethanol-associated decreases in ERO-1α and PDI most likely reflect reduced disposal and increased accumulation of mal-folded proteins in liver, due to inefficient escorting to the ubiquitin proteasome pathway for destruction. At the same time, reduced expression of calnexin and IRE-1α could indicate impaired folding and assembly of newly synthesized proteins in the ER (calnexin) and reduced transcription of chaperones and ERAD machinery (IRE-1α). Potential consequences include further accumulation of mal-folded proteins and inhibition of homeostatic mechanisms designed to dispose of cells that accumulate mal-folded proteins. These effects would worsen ER stress, metabolic dysfunction and hepatocellular degeneration. Correspondingly, the myriocin-associated restoration of ER and mitochondrial structure, hepatic architecture and insulin/IGF signalling mechanisms in ethanol-exposed livers was associated with increased expression of GRP-78, PDI, IRE-1α, CHOP and calnexin. This suggests that myriocin-induced reduction in hepatic ceramide levels in chronic ethanol-exposed livers correlated with increased activation of ER stress responses, including those needed to drive apoptosis.
Previous authors investigating the role of ER stress in the pathogenesis of alcoholic and non-alcoholic liver disease have instead found activation of the pathway in the experimental animal models (Ji et al. 2005; Dara et al. 2011; Pagliassotti 2012; Tsuchiya et al. 2012). Similarly, in humans, ER stress pathways were shown to be upregulated with chronic ALD (Longato et al. 2012). However, one potentially important difference between the models in which alcohol exposure led to activation of ER stress pathways or humans with ALD and the present work is the episodic versus sustained chronic nature of the ethanol exposures used herein. Conceivably, acute, high-level alcohol infusions induced experimentally or by drinking may cause sufficient damage to bolster ER stress signalling. As it is generally agreed that the purpose of ER stress pathway activation is to restore ER homeostasis (Malhi & Kaufman 2011; Pagliassotti 2012), even if activation of apoptosis mechanisms is required (Malhi & Kaufman 2011), adaptive responses that lead to resetting of the homeostasis bar could have long-term adverse effects, yet enable the liver to maintain function at a compromised level. Therefore, while the observed adaptive responses with respect to alterations in hepatic ER stress pathway activation may seem paradoxical, the outcomes suggest they were protective and needed to restore some level of homeostasis vis-à-vis persistent hepatic injury from continuous ethanol exposure. The finding of similar responses in control livers is noteworthy because, compared with other strains, Long Evans rats have constitutively higher levels of oxidative stress (Denucci et al. 2010; Derdak et al. 2011). Thus, the myriocin treatments may have been therapeutic to the basal underlying strain-specific metabolic deficiencies.
Conclusions
We hypothesize that chronic ALD is mediated by a harmful feedback loop, whereby insulin resistance leads to lipolysis and toxic ceramide generation, which promote ER stress. Both toxic ceramides and ER stress exacerbate insulin resistance. The treatment of chronic progressive ALD may require multipronged strategies to reverse the effects of hepatic insulin resistance and dysregulated lipid metabolism. Insulin sensitizers can reverse several aspects of ALD, but not the increased levels of hepatic ceramides (Ramirez et al. 2013a,b). Anti-inflammatory/antioxidant agents reduce inflammation, but not hepatic insulin resistance or lipid dyshomeostasis (Setshedi et al. 2011). Although monotherapy with myriocin was sufficient to restore liver structure and function in chronic ALD, despite persistent high-level alcohol exposures, the measure fell short with respect to resolving the necroinflammatory response and all aspects of hepatic insulin/IGF resistance. We propose and agree with the views of other authors (Dara et al. 2011) that chronic ALD requires multipronged treatment approaches to disrupt the mal-signalling cascade leading to progressive liver degeneration.
Acknowledgments
Supported by AA-11431, AA-12908, and 5T32DK060415 from the National Institutes of Health.
Supporting information
Additional Supporting Information may be found in the online version of this article:
Effects of chronic ethanol feeding and myriocin treatment on signaling downstream of the insulin and IGF-1 receptors.
References
- Anderson N, Borlak J. Molecular mechanisms and therapeutic targets in steatosis and steatohepatitis. Pharmacol. Rev. 2008;60:311–357. doi: 10.1124/pr.108.00001. [DOI] [PubMed] [Google Scholar]
- Banerjee A, Russell WK, Jayaraman A, Ramaiah SK. Identification of proteins to predict the molecular basis for the observed gender susceptibility in a rat model of alcoholic steatohepatitis by 2-D gel proteomics. Proteomics. 2008;8:4327–4337. doi: 10.1002/pmic.200700368. [DOI] [PubMed] [Google Scholar]
- Bismuth J, Lin P, Yao Q, Chen C. Ceramide: a common pathway for atherosclerosis? Atherosclerosis. 2008;196:497–504. doi: 10.1016/j.atherosclerosis.2007.09.018. [DOI] [PMC free article] [PubMed] [Google Scholar]
- Boslem E, MacIntosh G, Preston AM, et al. A lipidomic screen of palmitate-treated MIN6 beta-cells links sphingolipid metabolites with endoplasmic reticulum (ER) stress and impaired protein trafficking. Biochem. J. 2011;435:267–276. doi: 10.1042/BJ20101867. [DOI] [PubMed] [Google Scholar]
- Bourbon NA, Sandirasegarane L, Kester M. Ceramide-induced inhibition of Akt is mediated through protein kinase Czeta: implications for growth arrest. J. Biol. Chem. 2002;277:3286–3292. doi: 10.1074/jbc.M110541200. [DOI] [PubMed] [Google Scholar]
- Carracedo A, Lorente M, Egia A, et al. The stress-regulated protein p8 mediates cannabinoid-induced apoptosis of tumor cells. Cancer Cell. 2006;9:301–312. doi: 10.1016/j.ccr.2006.03.005. [DOI] [PubMed] [Google Scholar]
- Cohen JI, Nagy LE. Pathogenesis of alcoholic liver disease: interactions between parenchymal and non-parenchymal cells. J Dig Dis. 2011;12:3–9. doi: 10.1111/j.1751-2980.2010.00468.x. [DOI] [PMC free article] [PubMed] [Google Scholar]
- Dara L, Ji C, Kaplowitz N. The contribution of endoplasmic reticulum stress to liver diseases. Hepatology. 2011;53:1752–1763. doi: 10.1002/hep.24279. [DOI] [PMC free article] [PubMed] [Google Scholar]
- Denucci SM, Tong M, Longato L, et al. Rat strain differences in susceptibility to alcohol-induced chronic liver injury and hepatic insulin resistance. Gastroenterol. Res. Pract. 2010;2010 doi: 10.1155/2010/312790. pii: 312790.. [DOI] [PMC free article] [PubMed] [Google Scholar]
- Derdak Z, Lang CH, Villegas KA, et al. Activation of p53 enhances apoptosis and insulin resistance in a rat model of alcoholic liver disease. J. Hepatol. 2011;54:164–172. doi: 10.1016/j.jhep.2010.08.007. [DOI] [PMC free article] [PubMed] [Google Scholar]
- Ding WX, Manley S, Ni HM. The emerging role of autophagy in alcoholic liver disease. Exp. Biol. Med. (Maywood) 2011;236:546–556. doi: 10.1258/ebm.2011.010360. [DOI] [PMC free article] [PubMed] [Google Scholar]
- Feldstein AE, Bailey SM. Emerging role of redox dysregulation in alcoholic and nonalcoholic fatty liver disease. Antioxid. Redox Signal. 2011;15:421–424. doi: 10.1089/ars.2011.3897. [DOI] [PMC free article] [PubMed] [Google Scholar]
- Garcia-Ruiz C, Colell A, Mari M, et al. Defective TNF-alpha-mediated hepatocellular apoptosis and liver damage in acidic sphingomyelinase knockout mice. J. Clin. Invest. 2003;111:197–208. doi: 10.1172/JCI16010. [DOI] [PMC free article] [PubMed] [Google Scholar]
- Hajduch E, Balendran A, Batty IH, et al. Ceramide impairs the insulin-dependent membrane recruitment of protein kinase B leading to a loss in downstream signalling in L6 skeletal muscle cells. Diabetologia. 2001;44:173–183. doi: 10.1007/s001250051596. [DOI] [PubMed] [Google Scholar]
- He J, de la Monte S, Wands JR. Acute ethanol exposure inhibits insulin signaling in the liver. Hepatology. 2007;46:1791–1800. doi: 10.1002/hep.21904. [DOI] [PubMed] [Google Scholar]
- Hinkovska-Galcheva V, Shayman JA. Ceramide-1-phosphate in phagocytosis and calcium homeostasis. Adv. Exp. Med. Biol. 2010;688:131–140. doi: 10.1007/978-1-4419-6741-1_9. [DOI] [PMC free article] [PubMed] [Google Scholar]
- Holland WL, Summers SA. Sphingolipids, insulin resistance, and metabolic disease: new insights from in vivo manipulation of sphingolipid metabolism. Endocr. Rev. 2008;29:381–402. doi: 10.1210/er.2007-0025. [DOI] [PMC free article] [PubMed] [Google Scholar]
- Hotamisligil GS. Endoplasmic reticulum stress and the inflammatory basis of metabolic disease. Cell. 2010;140:900–917. doi: 10.1016/j.cell.2010.02.034. [DOI] [PMC free article] [PubMed] [Google Scholar]
- Hu P, Han Z, Couvillon AD, Kaufman RJ, Exton JH. Autocrine tumor necrosis factor alpha links endoplasmic reticulum stress to the membrane death receptor pathway through IRE1alpha-mediated NF-kappaB activation and down-regulation of TRAF2 expression. Mol. Cell. Biol. 2006;26:3071–3084. doi: 10.1128/MCB.26.8.3071-3084.2006. [DOI] [PMC free article] [PubMed] [Google Scholar]
- Jager R, Bertrand MJ, Gorman AM, Vandenabeele P, Samali A. The unfolded protein response at the crossroads of cellular life and death during ER stress. Biol. Cell. 2012;104:259–270. doi: 10.1111/boc.201100055. [DOI] [PubMed] [Google Scholar]
- Ji C, Mehrian-Shai R, Chan C, Hsu YH, Kaplowitz N. Role of CHOP in hepatic apoptosis in the murine model of intragastric ethanol feeding. Alcohol. Clin. Exp. Res. 2005;29:1496–1503. doi: 10.1097/01.alc.0000174691.03751.11. [DOI] [PMC free article] [PubMed] [Google Scholar]
- Jiang XC, Goldberg IJ, Park TS. Sphingolipids and cardiovascular diseases: lipoprotein metabolism, atherosclerosis and cardiomyopathy. Adv. Exp. Med. Biol. 2011;721:19–39. doi: 10.1007/978-1-4614-0650-1_2. [DOI] [PubMed] [Google Scholar]
- Kao Y, Youson JH, Holmes JA, Al-Mahrouki A, Sheridan MA. Effects of insulin on lipid metabolism of larvae and metamorphosing landlocked sea lamprey, Petromyzon marinus. Gen. Comp. Endocrinol. 1999;114:405–414. doi: 10.1006/gcen.1999.7265. [DOI] [PubMed] [Google Scholar]
- Kaplowitz N, Ji C. Unfolding new mechanisms of alcoholic liver disease in the endoplasmic reticulum. J. Gastroenterol. Hepatol. 2006;21(Suppl 3):S7–S9. doi: 10.1111/j.1440-1746.2006.04581.x. [DOI] [PubMed] [Google Scholar]
- Kaplowitz N, Than TA, Shinohara M, Ji C. Endoplasmic reticulum stress and liver injury. Semin. Liver Dis. 2007;27:367–377. doi: 10.1055/s-2007-991513. [DOI] [PubMed] [Google Scholar]
- Kornhuber J, Tripal P, Reichel M, et al. Functional Inhibitors of Acid Sphingomyelinase (FIASMAs): a novel pharmacological group of drugs with broad clinical applications. Cell. Physiol. Biochem. 2010;26:9–20. doi: 10.1159/000315101. [DOI] [PubMed] [Google Scholar]
- Kraegen EW, Cooney GJ. Free fatty acids and skeletal muscle insulin resistance. Curr. Opin. Lipidol. 2008;19:235–241. doi: 10.1097/01.mol.0000319118.44995.9a. [DOI] [PubMed] [Google Scholar]
- Kuznetsov JN, Leclerc GJ, Leclerc GM, Barredo JC. AMPK and Akt determine apoptotic cell death following perturbations of one-carbon metabolism by regulating ER stress in acute lymphoblastic leukemia. Mol. Cancer Ther. 2011;10:437–447. doi: 10.1158/1535-7163.MCT-10-0777. [DOI] [PMC free article] [PubMed] [Google Scholar]
- Langeveld M, Aerts JM. Glycosphingolipids and insulin resistance. Prog. Lipid Res. 2009;48:196–205. doi: 10.1016/j.plipres.2009.03.002. [DOI] [PubMed] [Google Scholar]
- Liangpunsakul S, Sozio MS, Shin E, et al. Inhibitory effect of ethanol on AMPK phosphorylation is mediated in part through elevated ceramide levels. Am. J. Physiol. Gastrointest. Liver Physiol. 2010;298:G1004–G1012. doi: 10.1152/ajpgi.00482.2009. [DOI] [PMC free article] [PubMed] [Google Scholar]
- Lieber CS. Alcoholic fatty liver: its pathogenesis and mechanism of progression to inflammation and fibrosis. Alcohol. 2004;34:9–19. doi: 10.1016/j.alcohol.2004.07.008. [DOI] [PubMed] [Google Scholar]
- Longato L, Ripp K, Setshedi M, et al. Insulin resistance, ceramide accumulation, and endoplasmic reticulum stress in human chronic alcohol-related liver disease. Oxid. Med. Cell. Longev. 2012;2012:479348. doi: 10.1155/2012/479348. [DOI] [PMC free article] [PubMed] [Google Scholar]
- Lyn-Cook LE, Jr, Lawton M, Tong M, et al. Hepatic ceramide may mediate brain insulin resistance and neurodegeneration in type 2 diabetes and non-alcoholic steatohepatitis. J. Alzheimers. Dis. 2009;16:715–729. doi: 10.3233/JAD-2009-0984. [DOI] [PMC free article] [PubMed] [Google Scholar]
- Malhi H, Gores GJ. Molecular mechanisms of lipotoxicity in nonalcoholic fatty liver disease. Semin. Liver Dis. 2008;28:360–369. doi: 10.1055/s-0028-1091980. [DOI] [PMC free article] [PubMed] [Google Scholar]
- Malhi H, Kaufman RJ. Endoplasmic reticulum stress in liver disease. J. Hepatol. 2011;54:795–809. doi: 10.1016/j.jhep.2010.11.005. [DOI] [PMC free article] [PubMed] [Google Scholar]
- McCullough KD, Martindale JL, Klotz LO, Aw TY, Holbrook NJ. Gadd153 sensitizes cells to endoplasmic reticulum stress by down-regulating Bcl2 and perturbing the cellular redox state. Mol. Cell. Biol. 2001;21:1249–1259. doi: 10.1128/MCB.21.4.1249-1259.2001. [DOI] [PMC free article] [PubMed] [Google Scholar]
- McCullough AJ, O'Shea RS, Dasarathy S. Diagnosis and management of alcoholic liver disease. J. Dig. Dis. 2011;12:257–262. doi: 10.1111/j.1751-2980.2010.00470.x. [DOI] [PubMed] [Google Scholar]
- McMillian MK, Grant ER, Zhong Z, et al. Nile Red binding to HepG2 cells: an improved assay for in vitro studies of hepatosteatosis. In Vitr. Mol. Toxicol. 2001;14:177–190. doi: 10.1089/109793301753407948. [DOI] [PubMed] [Google Scholar]
- McVicker BL, Tuma DJ, Kubik JL, Tuma PL, Casey CA. Ethanol-induced apoptosis in polarized hepatic cells possibly through regulation of the Fas pathway. Alcohol. Clin. Exp. Res. 2006;30:1906–1915. doi: 10.1111/j.1530-0277.2006.00235.x. [DOI] [PubMed] [Google Scholar]
- Miller AM, Horiguchi N, Jeong WI, Radaeva S, Gao B. Molecular mechanisms of alcoholic liver disease: innate immunity and cytokines. Alcohol. Clin. Exp. Res. 2011;35:787–793. doi: 10.1111/j.1530-0277.2010.01399.x. [DOI] [PMC free article] [PubMed] [Google Scholar]
- Mohr L, Tanaka S, Wands JR. Ethanol inhibits hepatocyte proliferation in insulin receptor substrate 1 transgenic mice. Gastroenterology. 1998;115:1558–1565. doi: 10.1016/s0016-5085(98)70036-8. [DOI] [PubMed] [Google Scholar]
- de la Monte SM. Triangulated mal-signaling in Alzheimer's disease: roles of neurotoxic ceramides, ER stress, and insulin resistance reviewed. J. Alzheimers. Dis. 2012;30:S231–S249. doi: 10.3233/JAD-2012-111727. [DOI] [PMC free article] [PubMed] [Google Scholar]
- de la Monte SM, Yeon JE, Tong M, et al. Insulin resistance in experimental alcohol-induced liver disease. J. Gastroenterol. Hepatol. 2008;23:e477–e486. doi: 10.1111/j.1440-1746.2008.05339.x. [DOI] [PMC free article] [PubMed] [Google Scholar]
- de la Monte SM, Longato L, Tong M, DeNucci S, Wands JR. The liver-brain axis of alcohol-mediated neurodegeneration: role of toxic lipids. Int. J. Environ. Res. Public Health. 2009;6:2055–2075. doi: 10.3390/ijerph6072055. [DOI] [PMC free article] [PubMed] [Google Scholar]
- de la Monte SM, Pang M, Chaudhry R, et al. Peroxisome proliferator-activated receptor agonist treatment of alcohol-induced hepatic insulin resistance. Hepatol. Res. 2011;41:386–398. doi: 10.1111/j.1872-034X.2011.00775.x. [DOI] [PMC free article] [PubMed] [Google Scholar]
- Nogueira TC, Anhe GF, Carvalho CR, Curi R, Bordin S, Carpinelli AR. Involvement of phosphatidylinositol-3 kinase/AKT/PKCzeta/lambda pathway in the effect of palmitate on glucose-induced insulin secretion. Pancreas. 2008;37:309–315. doi: 10.1097/mpa.0b013e318168dac3. [DOI] [PubMed] [Google Scholar]
- Onishi Y, Honda M, Ogihara T, et al. Ethanol feeding induces insulin resistance with enhanced PI 3-kinase activation. Biochem. Biophys. Res. Commun. 2003;303:788–794. doi: 10.1016/s0006-291x(03)00407-8. [DOI] [PubMed] [Google Scholar]
- O'Shea RS, Dasarathy S, McCullough AJ. Alcoholic liver disease. Hepatology. 2010;51:307–328. doi: 10.1002/hep.23258. [DOI] [PubMed] [Google Scholar]
- Ozcan U, Cao Q, Yilmaz E, et al. Endoplasmic reticulum stress links obesity, insulin action, and type 2 diabetes. Science. 2004;306:457–461. doi: 10.1126/science.1103160. [DOI] [PubMed] [Google Scholar]
- Pagliassotti MJ. Endoplasmic reticulum stress in nonalcoholic fatty liver disease. Annu. Rev. Nutr. 2012;32:17–33. doi: 10.1146/annurev-nutr-071811-150644. [DOI] [PubMed] [Google Scholar]
- Pandol SJ, Gorelick FS, Gerloff A, Lugea A. Alcohol abuse, endoplasmic reticulum stress and pancreatitis. Dig. Dis. 2010;28:776–782. doi: 10.1159/000327212. [DOI] [PMC free article] [PubMed] [Google Scholar]
- Pang M, de la Monte SM, Longato L, et al. PPARdelta agonist attenuates alcohol-induced hepatic insulin resistance and improves liver injury and repair. J. Hepatol. 2009;50:1192–1201. doi: 10.1016/j.jhep.2009.01.021. [DOI] [PMC free article] [PubMed] [Google Scholar]
- Paula H, Asrani SK, Boetticher NC, Pedersen R, Shah VH, Kim WR. Alcoholic liver disease-related mortality in the United States: 1980-2003. Am. J. Gastroenterol. 2010;105:1782–1787. doi: 10.1038/ajg.2010.46. [DOI] [PMC free article] [PubMed] [Google Scholar]
- Powell DJ, Hajduch E, Kular G, Hundal HS. Ceramide disables 3-phosphoinositide binding to the pleckstrin homology domain of protein kinase B (PKB)/Akt by a PKCzeta-dependent mechanism. Mol. Cell. Biol. 2003;23:7794–7808. doi: 10.1128/MCB.23.21.7794-7808.2003. [DOI] [PMC free article] [PubMed] [Google Scholar]
- Purohit V, Gao B, Song BJ. Molecular mechanisms of alcoholic fatty liver. Alcohol. Clin. Exp. Res. 2009;33:191–205. doi: 10.1111/j.1530-0277.2008.00827.x. [DOI] [PMC free article] [PubMed] [Google Scholar]
- Ramirez T, Longato L, Dostalek M, Tong M, Wands JR, de la Monte SM. Insulin resistance, ceramide accumulation and endoplasmic reticulum stress in experimental chronic alcohol-induced steatohepatitis. Alcohol Alcohol. 2013a;48:39–52. doi: 10.1093/alcalc/ags106. [DOI] [PMC free article] [PubMed] [Google Scholar]
- Ramirez T, Tong M, Chen WC, Nguyen QG, Wands JR, de la Monte SM. Chronic alcohol-induced hepatic insulin resistance and endoplasmic reticulum stress ameliorated by peroxisome-proliferator activated receptor-delta agonist treatment. J. Gastroenterol. Hepatol. 2013b;28:179–187. doi: 10.1111/j.1440-1746.2012.07256.x. [DOI] [PMC free article] [PubMed] [Google Scholar]
- Reynolds CP, Maurer BJ, Kolesnick RN. Ceramide synthesis and metabolism as a target for cancer therapy. Cancer Lett. 2004;206:169–180. doi: 10.1016/j.canlet.2003.08.034. [DOI] [PubMed] [Google Scholar]
- Roberts RA, James NH, Cosulich SC. The role of protein kinase B and mitogen-activated protein kinase in epidermal growth factor and tumor necrosis factor alpha-mediated rat hepatocyte survival and apoptosis. Hepatology. 2000;31:420–427. doi: 10.1002/hep.510310223. [DOI] [PubMed] [Google Scholar]
- Ronis MJ, Wands JR, Badger TM, de la Monte SM, Lang CH, Calissendorff J. Alcohol-induced disruption of endocrine signaling. Alcohol. Clin. Exp. Res. 2007;31:1269–1285. doi: 10.1111/j.1530-0277.2007.00436.x. [DOI] [PubMed] [Google Scholar]
- Ronis MJ, Butura A, Korourian S, et al. Cytokine and chemokine expression associated with steatohepatitis and hepatocyte proliferation in rats fed ethanol via total enteral nutrition. Exp. Biol. Med. (Maywood) 2008;233:344–355. doi: 10.3181/0707-RM-203. [DOI] [PubMed] [Google Scholar]
- Sasaki Y, Wands JR. Ethanol impairs insulin receptor substrate-1 mediated signal transduction during rat liver regeneration. Biochem. Biophys. Res. Commun. 1994;199:403–409. doi: 10.1006/bbrc.1994.1243. [DOI] [PubMed] [Google Scholar]
- Sasaki Y, Hayashi N, Ito T, Fusamoto H, Kamada T, Wands JR. Influence of ethanol on insulin receptor substrate-1-mediated signal transduction during rat liver regeneration. Alcohol Alcohol. 1994;1:99–106. [PubMed] [Google Scholar]
- Sauane M, Su ZZ, Dash R, et al. Ceramide plays a prominent role in MDA-7/IL-24-induced cancer-specific apoptosis. J. Cell. Physiol. 2010;222:546–555. doi: 10.1002/jcp.21969. [DOI] [PubMed] [Google Scholar]
- Senkal CE, Ponnusamy S, Bielawski J, Hannun YA, Ogretmen B. Antiapoptotic roles of ceramide-synthase-6-generated C16-ceramide via selective regulation of the ATF6/CHOP arm of ER-stress-response pathways. FASEB J. 2010;24:296–308. doi: 10.1096/fj.09-135087. [DOI] [PMC free article] [PubMed] [Google Scholar]
- Setshedi M, Tong M, Feng D, Le T, Wands JR, de la Monte SM. Ceramide inhibitors and PPAR agonists ameliorate alcohol-induced steatohepatitis in an ex-vivo liver slice culture model. Hepatology. 2010;52:1A–1352A. [Google Scholar]
- Setshedi M, Longato L, Petersen DR, et al. Limited therapeutic effect of N-acetylcysteine on hepatic insulin resistance in an experimental model of alcohol-induced steatohepatitis. Alcohol. Clin. Exp. Res. 2011;35:2139–2151. doi: 10.1111/j.1530-0277.2011.01569.x. [DOI] [PMC free article] [PubMed] [Google Scholar]
- Sharma NK, Das SK, Mondal AK, et al. Endoplasmic reticulum stress markers are associated with obesity in nondiabetic subjects. J. Clin. Endocrinol. Metab. 2008;93:4532–4541. doi: 10.1210/jc.2008-1001. [DOI] [PMC free article] [PubMed] [Google Scholar]
- Sundar-Rajan S, Srinivasan V, Balasubramanyam M, Tatu U. Endoplasmic reticulum (ER) stress & diabetes. Indian J. Med. Res. 2007;125:411–424. [PubMed] [Google Scholar]
- Szulc ZM, Bielawski J, Gracz H, et al. Tailoring structure-function and targeting properties of ceramides by site-specific cationization. Bioorg. Med. Chem. 2006;14:7083–7104. doi: 10.1016/j.bmc.2006.07.016. [DOI] [PubMed] [Google Scholar]
- Tsuchiya M, Ji C, Kosyk O, et al. Interstrain differences in liver injury and one-carbon metabolism in alcohol-fed mice. Hepatology. 2012;56:130–139. doi: 10.1002/hep.25641. [DOI] [PMC free article] [PubMed] [Google Scholar]
- Urano F, Bertolotti A, Ron D. IRE1 and efferent signaling from the endoplasmic reticulum. J. Cell Sci. 2000;113(Pt 21):3697–3702. doi: 10.1242/jcs.113.21.3697. [DOI] [PubMed] [Google Scholar]
- Yeon JE, Califano S, Xu J, Wands JR, de la Monte SM. Potential role of PTEN phosphatase in ethanol-impaired survival signaling in the liver. Hepatology. 2003;38:703–714. doi: 10.1053/jhep.2003.50368. [DOI] [PubMed] [Google Scholar]
Associated Data
This section collects any data citations, data availability statements, or supplementary materials included in this article.
Supplementary Materials
Effects of chronic ethanol feeding and myriocin treatment on signaling downstream of the insulin and IGF-1 receptors.