

Abstract
The overall goal of this work is to demonstrate how resting state functional magnetic resonance imaging (fMRI) signals may be used to objectively parcellate functionally heterogeneous subregions of the human amygdala into structures characterized by similar patterns of functional connectivity. We hypothesize that similarity of functional connectivity of subregions with other parts of the brain can be a potential basis to segment and cluster voxels using data driven approaches. In this work, self‐organizing map (SOM) was implemented to cluster the connectivity maps associated with each voxel of the human amygdala, thereby defining distinct subregions. The functional separation was optimized by evaluating the overall differences in functional connectivity between the subregions at group level. Analysis of 25 resting state fMRI data sets suggests that SOM can successfully identify functionally independent nuclei based on differences in their inter subregional functional connectivity, evaluated statistically at various confidence levels. Although amygdala contains several nuclei whose distinct roles are implicated in various functions, our objective approach discerns at least two functionally distinct volumes comparable to previous parcellation results obtained using probabilistic tractography and cytoarchitectonic analysis. Association of these nuclei with various known functions and a quantitative evaluation of their differences in overall functional connectivity with lateral orbital frontal cortex and temporal pole confirms the functional diversity of amygdala. The data driven approach adopted here may be used as a powerful indicator of structure–function relationships in the amygdala and other functionally heterogeneous structures as well. Hum Brain Mapp 35:1247–1260, 2014. © 2013 Wiley Periodicals, Inc.
Keywords: functional connectivity, self‐organized mapping, connectivity‐based parcellation
INTRODUCTION
The human amygdala is a complex structure implicated in a wide variety of brain activities such as emotional regulation [Baxter and Murray, 2000; Kelley, 2004] and other cognitive functions [Aggleton, 2000; LeDoux, 2003]. The most established functions are probably the storage of conditioned stimulus–unconditioned stimulus associations in fear conditioning, and its role in relevance detection [Sander et al., 2003]. Based on cytoarchitectonic, chemoarchitectonic, and white‐matter fiber architectures [Amunts et al., 2005; Ball et al., 2007; Swanson and Petrovich, 1998] human amygdala is typically divided into three subregions; namely, the basolateral, centromedial, and cortical nuclei, although histological studies also suggest that it may possess at least 20 anatomically distinct nuclei [Freese and Amaral, 2009]. The centromedial and cortical nuclei are broadly classified as the superficial groups, whereas the basal and lateral nuclei are considered as the deeper group. The deeper group of nuclei apparently facilitates associative learning [Phelps and LeDoux, 2005] while the superficial group plays an important role in generating behavioral responses [LeDoux, 2003]. These different functional characteristics and their changes in various neuropsychiatric disorders [Ball et al., 2009; Boccardi et al., 2009; Floresco and Ghods‐Sharifi, 2007; Garcia‐Marti et al., 2008] including schizophrenia [Benedetti et al., 2011; Goghari et al., 2010; Salvador et al., 2010] strongly suggest that amygdala should be considered as a functionally heterogeneous structure.
Noninvasive MRI such as diffusion weighted and structural (T1 and T2 weighted) studies have attempted to identify major amygdala nuclei by clustering voxels according to their principal diffusion directions [Solano et al., 2010], and gray‐matter contrast [Solano et al., 2011] at high field (7T). Similarly, probabilistic tractography‐based anatomic connectivity measures subdivide amygdala into various subregions [Bach et al., 2011; Saygin et al., 2011] wherein gross similarity between prominent nuclei and the segmented subregions was observed. In an initial attempt to demonstrate the functional diversity of the amygdala, three manually outlined subregions/nuclei were reported to have an overall difference in functional connectivity with the rest of the brain using resting state functional magnetic resonance imaging (fMRI) data [Roy et al., 2009].
Correlations between low‐frequency fluctuations of magnetic resonance imaging (MRI) signals in the absence of any specific stimulus (resting state) are widely accepted as evidence of functional connectivity between regions. Studies suggest that strong correlations between resting state low‐frequency MRI signals may exist across a widely distributed network [Biswal et al., 1995]. Spatial mapping of these interregional correlations across distributed brain regions has been widely used to delineate and describe various neural circuits and assess the manner in which distributed brain regions work together. More importantly, altered resting state functional connectivity, particularly in the default mode networks, in several disorders [e.g., Bassett et al., 2012; Liemburg et al., 2012; Weng et al., 2010; Wiggins et al., 2011; Wu et al., 2011] suggests that these functional networks are crucial for the execution and maintenance of a variety of brain functions. Novel findings from anesthetized animals [Chen et al., 2011] further support the concept that resting state signal fluctuations reflect a fundamental level of functional organization in the brain. Therefore, as different subregions of the amygdala are known to be involved in distinct brain functions [Gamer et al., 2010; Vizueta et al., 2012], it is plausible that distinct functional networks should be associated with these subregions. In this case, efficient data‐driven approaches should be able to parcellate these functional subregions objectively based on resting state connectivity measures.
There have been many previous reports of attempts to detect and delineate functionally connected regions for the assessment of inter‐ or intraregional functional connectivity using a variety of analytical methods. The method used most commonly is based on analyzing correlations between regions of interest (ROIs), but subjective selection of the ROIs and/or stimulus‐driven activation maps are then a prerequisite for the analysis. Alternatively, data driven analyses such as independent component analysis and self‐organizing maps (SOMs) offer ways to delineate functionally homogeneous subregions objectively. We postulated that an appropriate parcellation technique may be used to identify amygdala nuclei associated with similar patterns of functional connectivity measures. Here we report the development of a robust data driven approach using SOM to segment amygdala in both hemispheres. SOM is a relatively new artificial intelligence technique [Kohonen, 1997], which has enjoyed only limited application in fMRI data analyses [Liao et al., 2008; Peltier et al., 2003; Wiggins et al., 2011; Wismuller et al., 2004]. As a model‐free clustering technique, SOM can learn to detect regularities and correlations of the input data and adapt future responses. Based on a comparison of its performance with a conventional clustering approach in fMRI [Mishra et al, 2010; Ngan and Hu, 1999] and other fields [Mangiameli et al., 1996] we selected SOM over more conventional segmentation methods. The resulting functionally distinct subregions of amygdala are compared with parcellation results using probabilistic tractography [Bach et al., 2011] and cychoarchitectonics [Amunts et al., 2005]. The overall association of these major subdivisions with known amygdala functions, and comparisons of their functional connectivity with orbital frontal cortex (OFC) and temporal pole (TP), confirm the plausibility of the resulting segmentation of the amygdala.
METHODS
Data Acquisition and Preprocessing
Publicly available resting state fMRI data acquired in two sessions on 25 healthy subjects (10M/15F, aged 22–49) were used for these analyses [http://www.nitrc.org/projects/nyu_trt, Shehzad et al., 2009]. All subjects were physically sound with no history of psychiatric disorder or head injury. The data were acquired using a Siemens Allegra 3.0 T scanner. Each scan consisted of 197 contiguous echo‐planar imaging functional volumes (time of repetition = 2,000 ms; time of echo = 25 ms; flip angle = 90°, 39 slices, matrix = 64 × 64; field of view = 192 mm; voxel size = 3 mm, isotropic). High–resolution T1 weighted anatomic images were also acquired with the same imaging geometry, with an imaging matrix of 256 × 256 × 144 (0.938 mm × 0.938 mm × 1 mm). Slice timing correction for each subject was performed following three‐dimensional (3D) motion correction. Six translation and rotation parameters along with the global signal were used to regress out temporal variations caused by motion and drift. Spatial smoothing of the data was then performed using a Gaussian kernel with full width at half maximum = 6 mm (Set 1). Although spatial smoothing helps improve the signal‐to‐noise ratio (SNR), considering the physical size of the amygdala (∼2,000 mm3 in each hemisphere), we performed a separate analysis without smoothing the data. The white matter and cerebrospinal fluid (CSF) time course were included as additional regressors to reduce the effect of physiological noise in this analysis [Weissenbacher et al., 2009]. However, the global signal was not considered as a regressor due to the risk of adding artificial negative correlation [Murphy et al., 2009], including the motion parameters as in the former set of data (Set 2). Temporal band pass filtration with cutoff frequencies at 0.008 and 0.08 Hz (using a Chebyshev Type II filter) was performed to suppress the frequency contents outside this range for both sets of data. The amygdala (ROI) in both hemispheres was outlined using the Harvard‐Oxford atlas [Desikan et al., 2006]. The data were then transformed into Montreal Neurologic Institute (MNI) template space with the help of a linear affine transformation. From here onward, the separately preprocessed data sets will be referred as Set 1 or 2 or smoothed/unsmoothed data.
Functional Connectivity Estimation
The resting state functional connectivity between a particular seed ROI and the rest of the brain was estimated by implementing a general linear model. The time course associated with individual voxels within the ROI is considered as a regressor. The functional connectivity estimator uses the scaled time course of the voxels as covariates similar to the estimation of effective connectivity under stimulus driven conditions [Rissman et al., 2004; Weeda et al., 2011]. This analysis results in similar findings to that using correlation analysis as described in [Chen et al., 2011; Mishra et al., 2010]. Use of connectivity maps rather than raw time courses can eliminate weakly connected regions by thresholding, and reduces the bias due to poorly connected areas in segmentation. Elimination of poorly connected areas may benefit the parcellation, particularly when the SNR is low. The estimated β (beta) values for each voxel in the ROI are converted into a 1D vector with coefficients as many as the number of voxels in the rest of the brain. These vectors are the inputs to the SOM algorithm, which are clustered into a user defined number of groups. Voxel‐based connectivity maps associated with subregions can be reconstructed using these coefficients, and maps indexed with the assigned clusters are stored separately for group analysis. Preprocessing the data, generation of the connectivity maps and SOM‐based segmentation was performed using a software we developed. The Matlab code was customized to be used as an independent tool box for SPM5–8.
Implementation of SOM
SOM clusters the connectivity maps and classifies the voxels within the amgydala into a user defined number of clusters similar to most segmentation methods. Unlike conventional unsupervised learning in neural networks, SOM does not have a target vector as it clusters the inputs based on similarity within the groups. A modified SOM, also called self‐organizing feature map (SOFM) however, learns both the distribution and topology of the input vectors [Heskes, 2001; Kohonen and Somervuo, 2002]. Instead of updating the winning neurons alone, a portion of the neurons within a predefined neighborhood are updated for an improved realization of high‐dimensional data in lower dimension. We implemented SOFM to explore the benefit of clustering the data into 2D topologically distributed output neurons while varying the number of clusters from two to eight. The voxels associated with the connectivity maps belonging to a particular cluster are thus defined as functionally independent compartments (nuclei) in the amygdala. However, until recently there is no consensus about the number of specific functional subdivisions in amygdala to guide the selection. In such a situation, implementing a segmentation method that needs user definition for the number of subregions depends on careful evaluation of overall distance and other statistics between the clusters in the parametric space.
To reduce the computational burden, of SOFM, the time courses associated with each ROI and the rest of the brain were stored separately at two different resolutions. The rest of the brain excluding the amygdala volumes was up‐sampled to 5 mm isotropic resolution in the MNI space. Up‐sampling the rest of the brain will substantially reduce the size of the connectivity maps (data vector input) for the SOM, making it computationally less intensive. The input to the SOFM is a set of linearized β coefficients, as many as the number of voxels in the amygdala, typically ∼72 voxels (3 mm × 3 mm × 3 mm) in the left and right hemisphere. The SOFM divides these data into predefined number of clusters as we progressively increase the number of subregions from 2 to 8. Due to limited number of clusters the topology of neurons was a rectangular/random grid in case the number of clusters was even or odd. Using the Kohonen learning rule, the neighborhood is updated in two phases. Thus, when a vector p (1D connectivity map) is presented, the weights of the winning neuron and those present in the close neighborhood move toward p by updating the values as specified in Eq. (1). The change in weight of the neurons depends on their learning rate and the differences between their values in the previous iteration.
| (1) |
where w is the weight of the winning neuron and α is the learning rate.
The ordering and tuning phases last for 200 iterations each as the neighborhood shrinks from 2 to 1 based on the topology. However, since our analysis start with two clusters, the shrinking of neighborhood from ordering to tuning phase is void initially and SOFM performs as SOM in the beginning. The learning rate α changes from 0.1 to 0.01 in the ordering and tuning phase, respectively.
Defining the Subregions in the Common Space
Amygdala subregions for each subject comprise voxels associated with connectivity maps clustered into various groups in the MNI space. The subregions can be precisely defined by determining the base frequency of occurrence for voxels in each group. A subregion has a base frequency of 10 when all voxels belong to that group in at least 10 subjects. As SOM labels the subregions arbitrarily, we implemented the following procedure to uniformly label them on the basis of maximum cumulative percentage overlap. Cumulative percentage overlap is estimated by relabeling the segmented subregions with all possible combinations. For example, if the amygdala is divided into three clusters, for a reference subject the subregions of the remaining subjects should be labeled in six possible ways to calculate the cumulative percentage overlap. The clusters with combined maximum overlap are added and referred as the overlap index for that particular subject. The procedure is then repeated for all subjects in the group and the subject with maximum overlap index is finally used to relabel the entire set. The base frequency is stored for each voxel in the amygdala to visualize the probabilistic subregions at various confidence levels in the group space.
Optimizing the Number of Clusters
The clustering efficiency for a particular method is normally measured by the sum‐squared error (SSE), which is a measure of compactness of the clusters in terms of the Euclidean distance between the centroid and the members of each cluster. SSE however, is not sensitive to the overlapping of segmented regions as it is measured within the clustered groups. The Silhouette distance (SD) on the other hand is a function of intercluster distance in addition to the compactness of the members within the group [Rousseeuw, 1987]. SD is defined as the ratio of measure of compactness of members within a group to the distance between them in parametric space. In this work we quantified the efficiency of SOFM in terms of the average SD, based on Eq. (2). The term s(i) measures the distance for each member in the cluster where αi is the mean distance between the linearized connectivity map associated with the voxel i and other voxels in the same cluster. Similarly, βi,k is the average distance between i and each member of the other cluster k. The mean value of SD can theoretically vary between −1 and 1, specifying a complete overlapping of clusters through well isolated ones with compactly supported members.
| (2) |
| (3) |
| (4) |
Conventionally, the Euclidean distance between the members within and outside the cluster is measured to evaluate the SD. However, we also calculated a correlation‐based SD in a similar manner so that the shape similarity of connectivity maps can also be taken into consideration instead of just the Euclidean distance. Simply substituting the distance function Dist(a i,b j) with (1 − Corr(a i,b j)) where Corr is the correlation coefficient, the SD can be estimated [Eqs. (3) and (4)]. Although quantitative evaluation of clustering efficiency is subjective and preferably done by measuring the average distance between clusters in the parametric space, its absolute maximum value may not always guarantee the optimal separation of clusters [Goutte et al., 1999]. Therefore, assessment of functional parcellation is a tradeoff between mean SD, consistency in group level separation of the subregions, and statistical difference in functional connectivity with other parts of the brain regions as the number of clusters vary in the analysis.
RESULTS AND DISCUSSION
Identification of Amygdala Functional Heterogeneity Using SD Statistics and Consistency of Subregions in the MNI Space
The mean SD between the clusters in the parametric space was measured as a function of number of clusters into which the amygdala was parcellated. In addition to the SD, the statistical difference between the connectivity maps associated with the voxels comprising the subregions is also important to determine the optimal number of nuclei. Figure 1a shows the 3D view of the left amygdala in the case of a two cluster analysis for a representative subject where the superior (red) and inferior (green) part of the amygdala are separated into two halves using the smoothed data (Set 1). The enlarged view of the amygdala divided along hippocamapal axis is shown below. The mean voxel‐based connectivity map of the superior compartment (red), linearized as a 1D vector, is shown in Figure 1b. Figure 2a,b demonstrates the group variation of SD as a function of the number of clusters (2–8), for data Set 1. The median values of SD for two and three cluster analyses are significantly higher compared to others in case of correlation and Euclidean distance‐based measures. The unsmoothed data incorporating the white matter and CSF signal as nuisance parameters without the global signal (Set 2) shows very similar statistical variation of SD when measured using both methods. A closer observation reveals that the median value for three cluster analysis, particularly in case of Euclidean distance‐based analysis, is higher than what we observed in the case of two clusters. However, the variance associated is also bigger making the optimal subdivision unreliable based on the mean or median value of SD alone.
Figure 1.
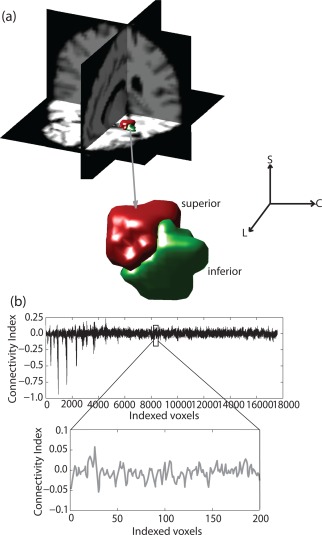
(a) 3D view of the segmented left amygdala using two cluster analysis for a representative subject, overlaid on T1 maps in MNI space. (b) Mean connectivity pattern (normalized) associated with superficial amygdala nuclei (linearized vector). [Color figure can be viewed in the online issue, which is available at http://wileyonlinelibrary.com.]
Figure 2.
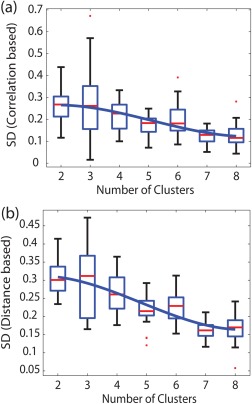
Box plots showing the median value (red) of the Silhouette distance (SD) and its second order polynomial fit (bold line) as a function of the number of clusters. The correlation and distance‐based SD for the smoothed data (Set 1) are plotted in (a) and (b). The upper and lower edges represent the 75th and 25th percentiles (scattered red dots are the outliers). [Color figure can be viewed in the online issue, which is available at http://wileyonlinelibrary.com.]
The 3D views of amygdala subregions in the common space in case of two and three cluster analyses are shown as compact volumes in Figure 3. The numbers in the middle show the base frequency, indicating that the probabilistic subvolumes are at least shared by that many subjects out of the total population of 25. While visualizing the data, isolated voxels or scattered volumes may be expected in case the subregions in the individual subject space are not in good agreement with others. Although large disagreement was not observed, particularly in two and three cluster analyses, a consistent reduction of shared volumes was seen as the population sharing the subregions (base frequency) was varied between 12 and 22 in discrete steps of 2 (Fig. 4). In the case of three cluster analysis, the medial region disappears as the population sharing the volume increases (subjects ≥ 18) for the smoothed data (Set 1). Presumably because the volume is smaller and the smoothing effect is more as the size of the smoothing kernel is bigger than the size of the medial region. However, the superior and inferior halves of the amygdala structure are prominent and quite similar in both two and three cluster analyses. Figure 4a,b shows variation of clustered subvolumes (mm3) as a function of the base frequency. Interestingly the volumes of the superior and inferior part of the amygdala are slightly bigger in unsmoothed data (dotted lines) and appear very close in orientation and shape when compared with the superficial (centromedial and cortical, red) and deep amygdala nuclei (basolateral and others, green). These subregions are very similar to previous parcellation results using probabilistic tractography [Bach et al., 2011] and cychoarchitectonics [Amunts et al., 2005].
Figure 3.
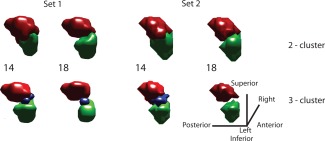
3D visualization of the segmented volumes using two and three cluster analysis. The superior (red), inferior (green), and medial (blue) regions are shown with the base frequency (number in the middle). The segmented ROIs are generated using cumulative percentage overlap for the smoothed (Set 1) and unsmoothed (Set 2) data. [Color figure can be viewed in the online issue, which is available at http://wileyonlinelibrary.com.]
Figure 4.
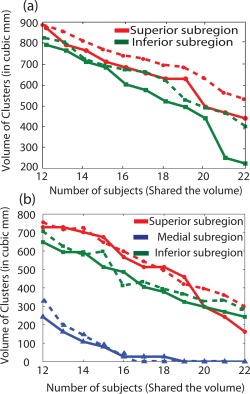
Volume of superior (red), inferior (green), and medial subregion (blue) in cubic mm as a function of base frequency (12–22) for two (a) and three (b) cluster analysis in the left amygdala. The solid lines represent the smoothed data (Set 1) and the dotted lines represent the unsmoothed data (Set 2). [Color figure can be viewed in the online issue, which is available at http://wileyonlinelibrary.com.]
Two versus Three Cluster Analysis
Figure 5a shows the 3D view of the segmented regions in the case of a two cluster analysis where both subregions were shared by 13 subjects (>50% of population) using the smoothed data set. A clear separation between the two subregions as seen on the sagittal and axial plane suggests that the medial region is not consistently present in either half. The two (1 and 3), three (2 and 5), and four (3 and 6) cluster analysis in Figure 5b shows the segmented compartments overlaid on a representative sagittal slice of an anatomic template (T1 weighted). The upper row (1, 2, and 3) contains the segmented compartments generated using the smoothed data whereas the lower row (4, 5, and 6) are the outcomes of the second set of data. An enlarged view in Figure 5c suggests that the medial region (2 and 5) is classified into the third cluster keeping the superior and inferior subregions almost intact. The four cluster analysis subdivides the medial region further into two clusters (3 and 6: yellow and blue), changing the superior and inferior half of the amygdala. Hypothetically SOM allows subregions to compete within it in case the number of clusters is over estimated. Clusters may be further classified into additional groups taking finer details of connectivity patterns into account, which is evident in Figure 5b,c (2, 5 and 3, 6, yellow cluster can be seen fully contained within blue cluster). An anatomic separation between subregions may be classified as a cluster with no meaningful functional connection with other parts of the brain. Our observation of the medial region, that is, the way it is shared by subjects in the common space, and the variability associated with the SD in a three cluster analysis, suggest that the medial subregion could either be a part of the two major clusters or a separation between them. The consistent reduction of SD with increased number of clusters also justifies the absence of distinct subregions which are shared by a majority of the population. Based on the above analogy, possibilities of considering amygdala as a combination of more (≥4) functionally distinct nuclei were ruled out.
Figure 5.
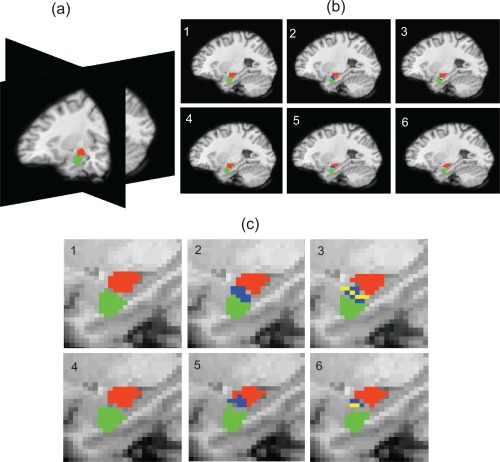
(a) 3D view of the parcellated amygdala using two cluster analysis. (b) Sagittal view of the subregions using two (1 and 4), three (2 and 5), and four (3 and 6) cluster analysis. (c) Enlarged view of the superior (red), inferior (green), and medial (blue and yellow) regions of the amygdala using data Set 1 (1, 2, and 3) and data Set 2 (4, 5, and 6). [Color figure can be viewed in the online issue, which is available at http://wileyonlinelibrary.com.]
Group Level Functional Connectivity Difference
Detailed evaluation of the difference in functional connectivity with rest of the brain at group level is critical to generalize the consistency in functional differences between the subregions and identify functionally independent nuclei. A series of paired t‐tests between the connectivity maps associated with the superior, inferior, and medial parts of the left and right amygdala were conducted. To know the way subregions are correlated, anticorrelated and have a difference in functional connectivity with the rest of the brain, we used different contrasts in the SPM analysis. The group connectivity maps associated with segmented regions are overlaid on T1 maps. Figure 6a shows the regions which are positively connected with the superior part of the amygdale, that is, the superficial (centromedial and cortical) nuclei of the left amygdala in a two cluster analysis for the smoothed data (Set 1). The precentral gyrus in the right and left cerebrum (BA‐4) and the medial frontal gyrus (BA‐6) are positively correlated with this subregion. Similarly, Figure 6b shows the regions having negative functional connection with the inferior part or the basolateral and other nuclei (deep nuclei) of the left amygdala. BA‐18 in the occipital lobe, superior temporal gyrus, right, and left middle frontal gyrus are significantly anticorrelated with the deep nuclei of the left amygdala (P < 0.001, uncorrected). The area with significant difference in connectivity between the segmented regions is also important to understand the functional heterogeneity within amygdala. The areas where the superior part or the superficial nuclei have stronger functional connections in comparison to deep amygdala nuclei are shown in Figure 6c. The precentral gyrus (BA‐4) and lentiform nucleus in the sublobar regions are strongly connected with the superior part in comparison to the inferior half (Fig. 6c, P < 0.01). The inferior parietal lobule (BA‐40) and right and left middle frontal gyrus in the frontal lobe possess stronger connectivity with the basolateral and other amygdala nuclei in comparison to the superior half (Fig. 6d, P < 0.01). Table 1 provides a comprehensive list of the regions which are functionally connected to the parcellated subregions.
Figure 6.
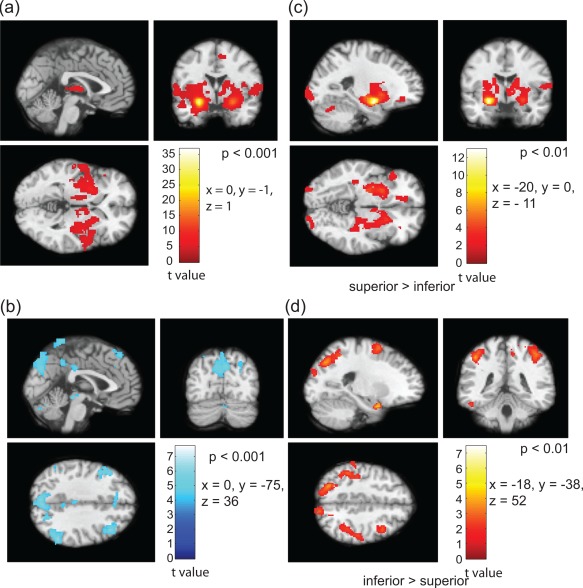
Functional connectivity patterns of the parcellated left amygdala with rest of the brain, based on two cluster analysis. (a) Positively correlated regions with superficial (superior) and (b) anticorrelated regions with deep (inferior) nuclei (P‐value < 0.001). Difference in functional connectivity [superficial > deep (c) and deep > superficial (d), P‐value < 0.01]. [Color figure can be viewed in the online issue, which is available at http://wileyonlinelibrary.com.]
Table 1.
Functional relation of superior and inferior part of amygdala with respect to known areas in the brain
| Positively correlated | Negatively correlated | |
|---|---|---|
| Superior amygdala | Precentral gyrus (BA‐4), medial frontal gyrus (BA‐6), and lentiform nucleus | Right/left middle frontal gyrus |
| Inferior amygdala | Inferior parietal lobe (BA‐40) | Occipital lobe (BA‐18), superior temporal gyrus, and right/left middle frontal gyrus |
| Superior > inferior | Precentral gyrus and lentiform nucleus | |
| Inferior > superior | Inferior parietal lobe (BA‐40) and right/left middle frontal gyrus |
We performed similar analyses of the second set of data for the same subjects and found similarities in functional connectivity of the amygdala subregions in both hemispheres. The segmented subregions in the right hemisphere are shown in Figure 7, where the group connectivity patterns are nearly identical to that observed in the left amygdala. Symmetrically anticorrelated regions with respect to the inferior part of the amygdala can be seen in Figure 7b similar to that observed in Figure 6b. To test the consistency in functional connections, we generated individual voxel‐based connectivity maps using the data in the second session based on the segmented subregions from the first session. The results obtained from the second session show similar connectivity patterns both in the cases of two and three cluster analyses. Figure 8a,b shows the group level positive and anticorrelated regions with respect to the superior and inferior parts of the amygdale, respectively. The positively correlated areas for the medial region are shown in Figure 8c–f that demonstrate the functional connectivity differences using following contrast: (i) superior > inferior (Fig. 8d), (ii) inferior > medial (Fig. 8e), and medial > superior (Fig. 8f), respectively. Very little difference between the medial and the superior part of the amygdala can be seen in Figure 8e. The positively correlated region is confined to the subregion itself, suggesting that the medial region could either be a separation or part of the superficial amygdala nuclei. Figure 3 apparently suggests that the combined medial and inferior subregions of amygdala is quite similar in shape to the inferior or deep nuclei of the amygdala in the two cluster analysis.
Figure 7.
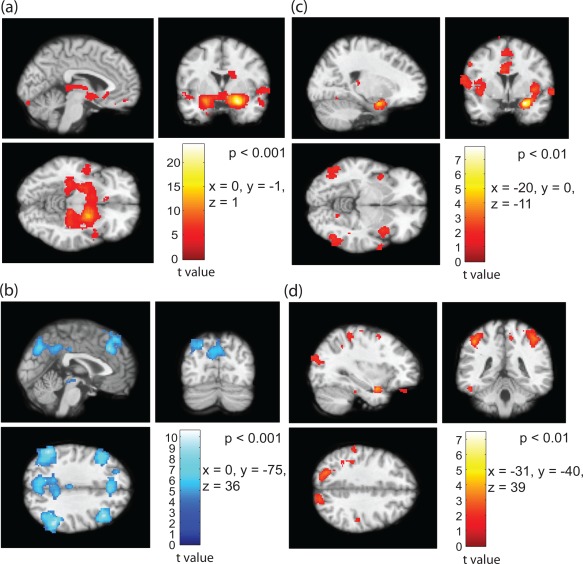
Functional connectivity of the parcellated right amygdala in the second set of data based on two cluster analysis. (a) Positively correlated regions with superficial nuclei, (b) anticorrelated regions with deep nuclei (P‐value < 0.001). Difference in connectivity between superficial > inferior (c) and inferior > superficial (d, P‐value < 0.01). [Color figure can be viewed in the online issue, which is available at http://wileyonlinelibrary.com.]
Figure 8.
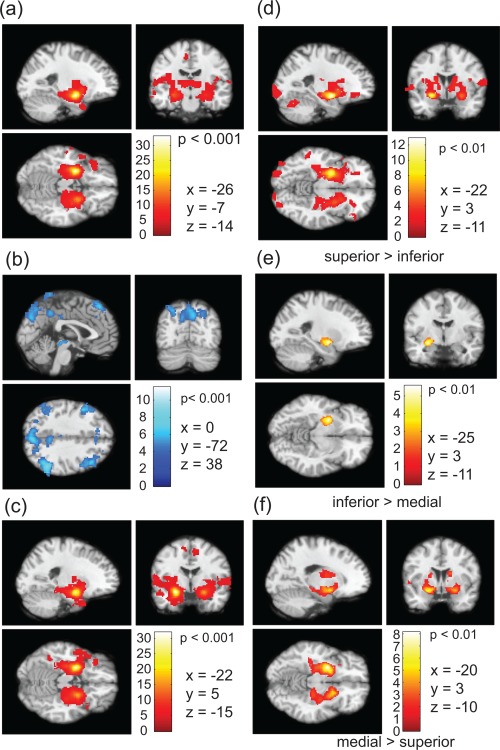
(a) Positively correlated regions with the superficial amygdala, (b) anticorrelated regions with the deep (inferior) and (c) positively correlated regions with medial part of the amygdala (P‐value < 0.001). Difference in connectivity are shown for the contrast (d) superior > inferior, (e) inferior > medial and medial > superior (P‐value < 0.01). [Color figure can be viewed in the online issue, which is available at http://wileyonlinelibrary.com.]
Quantitative Evaluation of Functional Connectivity of Parcellated Nuclei and Known Functions
Although voxel‐based connectivity measures were the basis for parcellating the amygdala, overall functional connectivities with known target regions were evaluated for quantification of differences in functional connectivity between subregions. Considering the functional diversity of OFC [Kringelbach, 2005] and the functional relationship between amygdala, OFC and TP [Bach et al., 2011] we performed a similar experiment to evaluate if there exist comparable functional relationship. We used the probabilistic subvolumes of the amygdala comprising of the segmented voxels, shared at least by 13 subjects using two cluster SOM analysis. The mean z‐scores [Eq. (5)] were evaluated as a measure of functional connectivity of the superior and inferior amygdala with respect to the subregions of the broader lateral OFC and TP outlined using Pick Atlas‐v.3.0.3, [Lancaster and Woldorff, 2000].
| (5) |
where r is the correlation coefficient. The functionally correlated/anticorrelated regions were observed at various significance levels for the segmented superior and inferior parts of the amygdala using appropriate contrasts in SPM8. The subregions of the broader OFC and TP, were considered as valid target regions, that is, voxels connected with the superior and inferior halves of the amygdala significant at P < 0.001 (uncorrected). A dissociative functional relation between OFC and TP was clearly observed in the group analysis. The z‐scores based on the Fisher transformed correlation coefficient between the segmented amygdala and target regions in both the hemispheres are shown in Figure 9. Each voxel in the amygdala is represented by the average correlation coefficient with valid target voxels (P < 0.001) and the mean of these values represent the subjectwise functional relation of the amygdala subregions with OFC and TP. The distribution of the z‐scores for the superior (columns 1 and 2) and inferior (columns 3 and 4) amygdala subregions with respect to both targets are presented in the left (Fig. 9a) and right hemisphere (Fig. 9b) using the unsmoothed data (Set 2). However, the spatially smoothed data shows a similar trend. In a separate analysis, the functional relationship of the superior and inferior compartments of the amygdala was evaluated with respect to each known subregion of both the target regions. The subregions of OFC (orbital frontal inferior, medial and superior cortex) and TP (TP medial and superior half) in both hemispheres were analyzed for all possible combination pairs. An inverse functional relation was observed between the subregions of each target and the superior/inferior amygdala in most cases. Table 2 shows the results using data Set 2.
Figure 9.
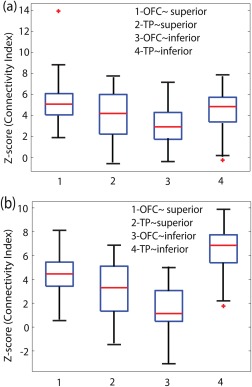
Median value (red) and statistical distribution of connectivity measure (z‐scores) for the superior and inferior amygdala nuclei in the left (a) and right (b) hemisphere. X‐Axis represents the z‐scores for the superior ∼ OFC (1) and TP (2), and the inferior ∼ OFC (3) and TP (4). The red stars (*) are the outliers. [Color figure can be viewed in the online issue, which is available at http://wileyonlinelibrary.com.]
Table 2.
Functional relation between superior/inferior amygdala versus subregions of OFC (orbital frontal inferior, medial, and superior cortex) and TP (temporal pole medial and superior half) in both hemispheres
| ROI pair | Does inverse functional relation exist? | ||
|---|---|---|---|
| Left Hem. | Right Hem. | ||
| 1. | OFC (Inf.)–TP (Med.) | 1 | 0 |
| 2. | OFC (Inf.)–TP (Sup.) | 0 | 1 |
| 3. | OFC (Med.)–TP (Med.) | 1 | 1 |
| 4. | OFC (Med.)–TP (Sup.) | 0 | 1 |
| 5. | OFC (Sup.)–TP (Med.) | 1 | 0 |
| 6. | OFC (Sup.)–TP (Sup.) | 1 | 1 |
1—inverse functional relation exist and 0—inverse functional relation does not exist.
The successful parcellation of two/three compartments (superior, medial, and inferior) of amygdala is in overall agreement with the anatomical parcellation of superficial (corticoid), centromedial, and laterobasal complex based on cytoarchitectural features [Amunts et al., 2005; Heimer et al., 1999] and superior/inferior compartments based in diffusion tensor imaging fiber tracking features [Bach et al., 2011]. Furthermore, the difference in functionally connected regions (both positive and negative) of superior versus inferior compartments not only emphasizes the multifunctional role of amygdala but also provides evidence supporting the functional separations of superior and inferior regions. For instance, the strong connections of the superior part of amygdala to precentral (BA‐4) and medial frontal gyri are consistent with the known functions in processing of emotion [Morris et al., 1998], fear [Shin et al., 2005], attachment security [Lemche et al., 2006], and learning [Phelps et al., 2004]. In contrast, the inferior part of amygdala has strong or differential connections to the inferior parietal lobe (BA‐40) which support its roles in the perception of biological motion [Bonda et al., 1996] and sensorimotor integration. Inverse correlations with superior temporal gyrus may imply the role of inferior part in the perception of form, meaning and experience [Martin et al., 1997]. Taken together, the differential connectivity patterns of superior and inferior amygdala to the rest of the brain support the functional heterogeneity of these subvolumes within the amygdala and their different associations with the rest of the brain.
CONCLUSIONS
Previous functional parcellations of the amygdala have been performed by outlining specific nuclei based on certain assumptions, followed by an evaluation of their difference in connectivity to the rest of the brain. Our data driven segregation approach achieves this objectively by segmenting voxel‐based connectivity measures and then identifying the corresponding subregions in the native space. Interpretation of functional diversity requires critical assessment of connectivity measures from various aspects to accurately demarcate the separation between functionally independent nuclei. Moreover, in the absence of a consensus about the actual number of functional subdivisions, we relied on estimates of the functional heterogeneity on three accounts: (i) assessment of distances between clusters, (ii) evaluating how each segmented region was shared by a significant portion of the population in a group analysis, and (iii) by looking at the group level similarities and differences in functional connections between subregions and the rest of the brain. Finally, the parcellation was validated comparing the functional connectivity measures we obtained with previous structural relationships between the amygdala subregions and target areas using probabilistic tractography. The overall similarity in connectivity patterns analyzed using the physical co‐ordinates of the delineated subregions in one set of data for the other set strongly supports the fact that parcellation using resting state fMRI data is stable, reproducible and reliable for better understanding the functional architecture of the amygdala.
ACKNOWLEDGMENTS
The authors are thankful to Dr. Allen Newton and Kevin Wilson for their support in designing the software (SPM tool box) to perform the analysis.
REFERENCES
- Aggleton J, editor (2000):The Amygdala: A Functional Analysis. Oxford:Oxford Univ. Press. [Google Scholar]
- Amunts K, Kedo O, Kindler M, Pieperhoff P, Mohlberg H, Shah NJ, Habel U, Schneider F, Zilles K (2005): Cytoarchitectonic mapping of the human amygdala, hippocampal region and entorhinal cortex: Intersubject variability and probability maps. Anat Embryol 210:343–352. [DOI] [PubMed] [Google Scholar]
- Bach DR, Behrens TE, Garrido L, Weiskopf N, Dolan RJ (2011): Deep and superficial amygdale nuclei projections revealed in vivo by probabilistic tractography. J Neurosci 31(2):618–623. [DOI] [PMC free article] [PubMed] [Google Scholar]
- Ball T, Rahm B, Eickhoff SB, Schulze‐Bonhage A, Speck O, Mutschler I (2007): Response properties of human amygdala subregions: Evidence based on functional MRI combined with probabilistic anatomical maps. PLoS One 2:e307. [DOI] [PMC free article] [PubMed] [Google Scholar]
- Ball T, Derix J, Wentlandt J, Wieckhorst B, Speck O, Schulze‐Bonhage A, Mutschler I (2009): Anatomical specificity of functional amygdala imaging of responses to stimuli with positive and negative emotional valence. J Neurosci Methods 180:57–70. [DOI] [PubMed] [Google Scholar]
- Bassett DS, Nelson BG, Mueller BA, Camchong J, Lim KO (2012): Altered resting state complexity in schizophrenia. Neuroimage 59(3):2196–2207. [DOI] [PMC free article] [PubMed] [Google Scholar]
- Baxter MG, Murray EA (2002): The amygdala and reward. Nat Rev Neurosci 3:563–573. [DOI] [PubMed] [Google Scholar]
- Benedetti F, Radaelli D, Poletti S, Falini A, Cavallaro R, Dallaspezia S, Riccaboni R, Scotti G, Smeraldi E (2011): Emotional reactivity in chronic schizophrenia: Structural and functional brain correlates and the influence of adverse childhood experiences. Psychol Med 41(3):509–519. [DOI] [PubMed] [Google Scholar]
- Biswal BB, Yetkin FZ, Haughton VM, Hyde JS (1995): Functional connectivity in the motor cortex of resting human brain using echoplanar MRI. Magn Reson Med 34:537–541. [DOI] [PubMed] [Google Scholar]
- Boccardi M, Almici M, Bresciani L, Caroli A, Bonetti M, Monchieri S, Gennarelli M, Frisoni GB (2009): Clinical and medial temporal features in a family with mood disorders. Neurosci Lett 468(2):93–97. [DOI] [PubMed] [Google Scholar]
- Bonda E, Petrides M, Ostry D, Evans A (1996): Specific involvement of human parietal systems and the amygdala in the perception of biological motion. J Neurosci 16(11):3737–3744. [DOI] [PMC free article] [PubMed] [Google Scholar]
- Chen LM, Mishra Arabinda, Newton AT, Morgan VL, Stringer EA, Rogers BP, Gore JC (2011): Fine‐scale functional connectivity in somatosensory cortex revealed by high‐resolution fMRI. Magn Reson Imaging 29(10):1330–1337. [DOI] [PMC free article] [PubMed] [Google Scholar]
- Desikan RS, Segonne F, Fischl B, Quinn BT, Dickerson BC, Blacker D, Buckner RL, Dale AM, Maguire RP, Hyman BT, Albert MS, Killiany RJ (2006): An automated labeling system for subdividing the human cerebral cortex on MRI scans into gyral based regions of interest. Neuroimage 31(3):968–980. [DOI] [PubMed] [Google Scholar]
- Freese JL, Amaral DG (2009): Neuroanatomy of the primate amygdala In: Whalen PJ, Phelps EA, editors. The human amygdala. New York:Guilford; pp3–42. [Google Scholar]
- Floresco SB, Ghods‐Sharifi S (2007): Amygdala‐prefrontal cortical circuitry regulates effort‐based decision making. Cereb Cortex 17:251–260. [DOI] [PubMed] [Google Scholar]
- Gamer M, Zurowski B, Buchel C (2010): Different amygdala subregions mediate valence‐related and attentional effects of oxytocin in humans. Proc Natl Acad Sci USA 107(20):9400–9406. [DOI] [PMC free article] [PubMed] [Google Scholar]
- Garcia‐Marti G, Aguilar EJ, Lull JJ, Marti‐Bonmati L, Escarti MJ, Manjon JV, Moratal D, Robles M, Sanjuan J (2008): Schizophrenia with auditory hallucinations: A voxel‐based morphometry study. Prog Neuropsychopharmacol Biol Psychiatry 32:72–80. [DOI] [PubMed] [Google Scholar]
- Goghari VM, Sponheim SR, MacDonald AW (2010): The functional neuroanatomy of symptom dimensions in schizophrenia: A qualitative and quantitative review of a persistent question. Neurosci Biobehav Rev 34(3):468–486. [DOI] [PMC free article] [PubMed] [Google Scholar]
- Goutte C, Toft P, Rostrup E, Nielsen FA, Hansen LK (1999): On clustering fMRI time series. Neuroimage 9(3):298–310. [DOI] [PubMed] [Google Scholar]
- Heimer L, de Olmos JS, Alheid GF, Pearson J, Sakamoto N, Shinoda K, Marksteiner J, Switzer RC (1999):The human basal forebrain Part II The primate nervous system, Part III. Elsevier; (ISBN: 978‐0‐444‐50043‐4), pp57–226. [Google Scholar]
- Heskes T (2001): Self‐organizing maps, vector quantization, and mixture modeling. IEEE Trans Neural Netw 12:1299–1305. [DOI] [PubMed] [Google Scholar]
- Kelley AE (2004): Ventral striatal control of appetitive motivation: Role in ingestive behavior and reward‐related learning. Neurosci Biobehav Rev 27:765–776. [DOI] [PubMed] [Google Scholar]
- Kohonen T, Somervuo P (2002): How to make large self‐organizing maps for nonvectorial data. Neural Netw 15(8–9):945–952. [DOI] [PubMed] [Google Scholar]
- Kohonen T (1997):Self‐Organizing Maps, 2nd ed. Berlin:Springer‐Verlag. [Google Scholar]
- Kringelbach ML (2005): The orbitofrontal cortex: Linking reward to hedonic experience. Nat Rev Neurosci 6:691–702. [DOI] [PubMed] [Google Scholar]
- Lancaster JL, Woldorff MG (2000):Parsons LM, et al. Automated Talairach atlas labels for functional brain mapping. Hum Brain Mapp 10:120–131. [DOI] [PMC free article] [PubMed] [Google Scholar]
- LeDoux J (2003): The emotional brain, fear, and the amygdala. Cell Mol Neurobiol 23:727–738. [DOI] [PMC free article] [PubMed] [Google Scholar]
- Lemche E, Giampietro VP, Surguladze SA, Amaro EJ, Andrew CM, William SCR, Brammer MJ, Lawrence N, Maier MA, Russel TA, Simmons A, Ecker C, Joraschky P, Phillips ML (2006): Human attachment security is mediated by the amygdala: Evidence from combined fMRI and psychophysiological measures. Hum Brain Mapp 27:623–635. [DOI] [PMC free article] [PubMed] [Google Scholar]
- Liao W, Chen H, Yang Q, Lei X (2008): Analysis of fMRI data using improved self‐organized mapping and spatio‐temporal metric hierarchical clustering. IEEE Trans Med Imaging 27(10):1472–1483. [DOI] [PubMed] [Google Scholar]
- Liemburg EJ, Van der ML, Swart M, Curcic‐Blake B, Bruggeman R, Knegtering H, Aleman A (2012): Reduced connectivity in the self‐processing network of schizophrenia patients with poor insight. PLoS One 7(8):e42707. [DOI] [PMC free article] [PubMed] [Google Scholar]
- Mangiameli P, Chen SK, West D (1996): A comparison of SOM Neural network and hierarchical clustering methods. Eur J Oper Res 93:402–417. [Google Scholar]
- Martin A, Wiggs CL, Weisberg J (1997): Modulation of human medial temporal lobe activity by form, meaning, and experience. Hippocampus 7:587–593. [DOI] [PubMed] [Google Scholar]
- Mishra Arabinda, Gatenby JC, Newton AT, Gore JC, Rogers BP (2010): Optimal clustering for connectivity‐based parcellation of hippocampus In:ISMRM, Stockholm, Sweden, May 1–7. [Google Scholar]
- Morris JS, Friston KJ, Buchel C, Frith CD, Young AW, Calder AJ, Dolan RJ (1998): A neuromodulatory role for the human amygdala in processing emotional facial expression. Brain 121:47–57. [DOI] [PubMed] [Google Scholar]
- Murphy K, Birn RM, Handwerker DA, Jones TB, Bandettini PA (2009): The impact of global signal regression on resting state correlations: Are anti‐correlated networks introduced? Neuroimage 44(3):893–905. [DOI] [PMC free article] [PubMed] [Google Scholar]
- Ngan SC, Hu X (1999): Analysis of functional magnetic resonance imaging data using self‐organizing mapping with spatial connectivity. Magn Reson Med 41:939–946. [DOI] [PubMed] [Google Scholar]
- Peltier SJ, Polk TA, Noll DC (2003): Detecting low‐frequency functional connectivity in fMRI using self organizing map (SOM) algorithm. Hum Brain Mapp 20(4):220–226. [DOI] [PMC free article] [PubMed] [Google Scholar]
- Phelps EA, Delgado MR, Nearing KI, LeDoux JE (2004): Extinction learning in humans: Role of amygdala and vmPFC. Neuron 43:897–905. [DOI] [PubMed] [Google Scholar]
- Phelps EA, LeDoux JE (2005): Contributions of the amygdala to emotion processing: From animal models to human behavior. Neuron 48(2):175–187. [DOI] [PubMed] [Google Scholar]
- Rissman J, Gazzaley A, D'Esposito M (2004): Measuring functional connectivity during distinct stages of cognitive task. Neuroimage 23(2):752–763. [DOI] [PubMed] [Google Scholar]
- Roy A K, Shehzad Z, Margulies DS, Kelly AMC, Uddin LQ, Gotimer K, Biswal BB, Castellanos FX, Milham MP (2009): Functional connectivity of the human amygdala using resting state fMRI. Neuroimage 45(2):614–626. [DOI] [PMC free article] [PubMed] [Google Scholar]
- Rousseeuw PJ (1987): Silhouettes: A graphical aid to the interpretation and validation of cluster analysis. J Comput Appl Math 20:53–65. [Google Scholar]
- Salvador R, Sarro S, Gomar JJ, Ortiz‐Gil J, Vila F, Capdevila A, Bullmore E, McKenna PJ, Pomarol‐Clotet E (2010): Overall brain connectivity maps show cortico‐subcortical abnormalities in schizophrenia. Hum Brain Mapp 31(12):2003–2014. [DOI] [PMC free article] [PubMed] [Google Scholar]
- Sander D, Grafman J, Zalla T (2003): The human amygdala: An evolved system for relevance detection. Rev Neurosci 14(4):303–316. [DOI] [PubMed] [Google Scholar]
- Saygin ZM, Osher DE, Augustinack J, Fischl B, Gabrieli JDE (2011): Connectivity‐based segmentation of human amygdale nuclei using probabilistic tractography. Neuroimage 56:1353–1361. [DOI] [PMC free article] [PubMed] [Google Scholar]
- Shehzad Z, Kelly AM, Reiss PT, Gee DG, Gotimer K, Uddin LQ, Lee SH, Margulies DS, Roy AK, Biswal BB, Petkova E, Castellanos FX, Milham MP (2009): The resting brain: Unconstrained yet reliable. Cereb Cortex 19:2209–29. [DOI] [PMC free article] [PubMed] [Google Scholar]
- Shin LM, Wright CI, Cannistraro PA, Wedig MM, McMullin K, Martis B, Macklin ML, Lasko NB, Cavanagh SR, Krangel TS, Orr SP, Pitman RK, Whalen PJ, Rauch SL (2005): A functional magnetic resonance imaging study of amygdala and medial prefrontal cortex responses to overtly presented fearful faces in posttraumatic stress disorder. Arch Gen Psychiatry 62:273–281. [DOI] [PubMed] [Google Scholar]
- Solano‐Castiella E, Anwander A, Lohmann G, Weiss M, Docherty C, Geyer S, Reimer E, Friederici AD, Turner R (2010): Diffusion tensor imaging segments the human amygdala in vivo. Neuroimage 49:2958–2965. [DOI] [PubMed] [Google Scholar]
- Solano‐Castiella E, Schafer A, Reimer E, Turke E, Proger T, Lohmann G, Trampel R, Turner R (2011): Parcellation of human amygdale in vivo using ultra high field structural MRI. Neuroimage 58:741–748. [DOI] [PubMed] [Google Scholar]
- Swanson LW, Petrovich GD (1998): What is the amygdala? Trends Neurosci 21:323–331. [DOI] [PubMed] [Google Scholar]
- Vizueta N, Patric CJ, Jiang Y, Thomas Y, He S (2012): Dispositional fear, negative affectivity, and neuroimaging response to visually suppressed emotional faces. Neuroimage 59(1):761–771. [DOI] [PMC free article] [PubMed] [Google Scholar]
- Weeda WD, Waldrop LJ, Grasman RP, Gaal S van, Huizenga HM (2011): Functional connectivity analysis of fMRI data using parameterized regions‐of‐interest. Neuroimage 54(1):410–416. [DOI] [PubMed] [Google Scholar]
- Weissenbacher A, Kasess C, Gerstl F, Lanzenberger R, Moser E, Windischberger C (2009): Correlations and anticorrelations in resting‐state functional connectivity MRI: A quantitative comparison of preprocessing strategies. Neuroimage 47(4):1408–1416. [DOI] [PubMed] [Google Scholar]
- Weng SJ, Wiggins JL, Peltier SJ, Carrasco M, Risi S, Lord C, Monk CS (2010): Alterations of resting state functional connectivity in the default network in adolescents with autism spectrum disorders. Brain Res 1313:202–14. [DOI] [PMC free article] [PubMed] [Google Scholar]
- Wiggins JL, Peltier SJ, Ashinoff S, Weng S, Carrasco M, Welsh RC, Lord C, Monk CS (2011): Using a self‐organising map algorithm to detect age‐related changes in functional connectivity during rest in autism spectrum disorders. Brain Res 1380:187–197. [DOI] [PMC free article] [PubMed] [Google Scholar]
- Wismuller A, Meyer‐Base A, Lange O, Auer D, Maximilian FR, Sumners D (2004): Model‐free functional MRI analysis based on unsupervised clustering. J Biomed Inform 37:10–18. [DOI] [PubMed] [Google Scholar]
- Wu X, Li R, Fleisher AS, Reiman EM, Guan X, Zhang Y, Chen K, Yao L (2011): Altered default mode network connectivity in Alzheimer's disease—A resting functional MRI and Bayesian network study. Hum Brain Mapp 32(11):1868–1881. [DOI] [PMC free article] [PubMed] [Google Scholar]