Abstract
Elevated hyaluronidase levels are found in the urine of bladder and prostate cancer patients. Therefore, HA-ase is regarded as an important biomarker for the detection of these cancers. In this report, we use a FRET based ratiometric sensing approach to detect the level of HA-ase in synthetic urine. For this, we have used a HA-FRET probe (hyaluronan) labeled with fluorescein as a donor and rhodamine as an acceptor. We monitor the digestion of our HA-FRET probe with different concentrations of HA-ase in synthetic urine via fluorescence emission. The extent to which FRET is released depends on the concentration of HA-ase. Our fluorescence intensity results are also supported with time resolved fluorescence decay data. This assay can be used to develop a non-invasive technique for the detection of bladder and/or prostate cancer progression.
Keywords: Ratiometric sensing, Hyaluronidase, HA-FRET, Bladder cancer
1. INTRODUCTION
Bladder and prostate cancer are among the most frequently diagnosed types of cancers worldwide. In the US, a total of 75,510 new cases of bladder cancer and 241,740 new cases of prostate cancer are estimated in 2012 alone [1]. Therefore it is necessary to have simple, ergonomic and non-invasive diagnostic techniques with which the cancer can be detected and monitored at a very early stage, so that proper therapeutic measures can be taken. Increased hyaluronidase (HA-ase) levels in urine has been identified as a promising biomarker of bladder and prostate cancer [2, 3]. Studies by the Lokeshwar group have shown that there is usually a 2.5–6.5 fold increase in hyaluronidase levels in patients with bladder cancer in comparison to healthy individuals [4]. Hyaluronidase level greater than 10mU/mg indicate higher grade of cancer. [4]. Therefore estimating the level of hyaluronidase in urine can help in accurately predicting the progression of bladder and prostate cancer.
Hyaluronidase is an endoglycosidase that catalyzes Hyaluronan (HA) depolymerization via cleavage of the β-N-acetyl-D-glucosaminidic bonds [5] and it belongs to class hydrolase (EC3.2.1.35) [6]. Hyaluronic acid is associated with many biological processes such as cell adhesion, migration and proliferation [7]. HA-ase degrades HA into proangiogenic fragments which help in cancer progression and metastasis. The human genome contains 6 HA-ase like genes. Hyaluronidases (Hyal1, Hyal2, Hyal3) are present on chromosome 3p21.3, and another two genes (Hyal4 and PH-20/SPAM1) and one pseudogene (HyalP1) are present on chromosome 7q31.3 5. Hyal1 is a tumor derived HA-ase [8]. Hyal1 promotes growth, invasion and angiogenesis in prostate cancer [9].
In our previous studies, we have shown that the level of Hyaluronidase can be estimated using HA-FRET probe in PBS (pH 6). We wanted to test if same probe can be used reproducibly for the detection of HA-ase in synthetic urine containing different salts and hydrogen ion concentration (pH) reason being fluorescence is sensitive to the salt concentrations and pH values. In this experiment we have used synthetic urine (pH 7.83) containing different salts of monovalant and divalent ions which mimic the salts present in human urine. Fluorescence emission intensity measurements are based on probe concentration and could lead to experimental variation due to differences in probe preparations. This problem can be resolved using ratio-metric sensing in which spectrum for each sample was recorded and release of FRET was compared in terms of ratio of fluorescein to rhodamine emission intensity. This is more sensitive than measuring only either donor or acceptor emission. Ratiometric sensing reduces undesirable experimental errors [10,11]. Hence in this assay we have used donor to acceptor emission ratio to assay HA-ase in urine samples.
In our experiment we added HA-FRET probe into synthetic urine (pH 7.83) to prepare 2μM solution. Then we added different concentrations of HA-ase to the HA-FRET and synthetic urine mixture at room temperature. The spectrum for each sample was recorded and release of FRET was compared which is used to determine the concentration of hyaluronidase in urine. This technique can be utilized to develop an instrument which can easily estimate the concentration of hyaluronidase in urine and hence the progression of bladder/prostate cancer.
2. MATERIALS AND METHODS
Sodium hyaluronate from bacterial fermentation was obtained from Acros Organics (Thermo Fisher Scientific, NJ, USA). Fluorescein amine, dimethyl sulfoxide (DMSO), guanidine hydrochloride, acetaldehyde, cyclohexyl isocyanide, Sephadex G-75, and bovine testes hyaluronidase (EC 3.2.1.35, type 1-S, 451 U/mg) all were obtained from Sigma–Aldrich). Dulbecco’s phosphate-buffered saline (PBS) was purchased from Invitrogen Life Technologies (Invitrogen Corporation, CA, and USA). Synthetic urine (pH 7.83) is obtained from Ricca chemical company (catalog number 8361-1), Slide-A-Lyser dialysis cassettes (10,000 molecular weight cutoff) were purchased from Pierce Chemical (Thermo Fisher Scientific).
2.1. Preparation of HA-FRET
Using the same method as mentioned in our previous paper [11]. HA was covalently conjugated to fluorescein amine and rhodamine B using a condensation reaction. HA was dissolved to 1.25 mg/ml in dH2O. The HA solution was diluted 1:2 in DMSO, and fluorescein amine (predissolved as a DMSO stock solution) was added to a final concentration of 5 mg/ml. Acetaldehyde and cyclohexyl isocyanide were added to 0.04% (v/v), and the reaction was allowed to proceed for 16 hr at 25°C. Afterward, the solution was diluted 1:14 in ethanol/guanidine HCl (50 μl of 3 M guanidine HCl per 900 μl of 100% ethanol) and HA was allowed to precipitate overnight at −20°C. The precipitate was then dissolved in 1ml of dH2O, followed by extensive dialysis against dH2O.
2.2. Fluorescence Measurement of Hyaluronan Hydrolysis
The HA–FRET probe was added to synthetic urine to make a solution (2μM) was incubated with different concentrations of hyaluronidase in synthetic urine at room temperature. Fluorescence emission spectra were collected using Cary Eclipse spectrofluorometer (Varian Inc., Australia) every 10 min for 90 minutes. Measurements were performed in 0.4×0.4 cm quartz cell with excitation at 470 nm and emission at 520 nm and 590 nm using 495 nm long pass filter before on emission side.
2.3. Deconvolution of HA-FRET Spectra
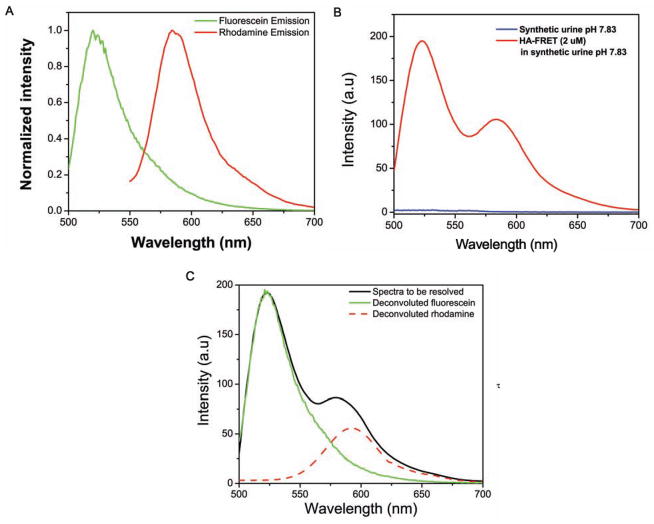
The respective emission due to the donor and acceptor was deconvoluted to obtain individual spectrum of donor and acceptor. All spectra were deconvoluted using MATHCAD software. This program is designed to resolve a spectrum consisting of up to three constituent fluorophores which are assumed to combine linearly based on experimental fluorophores reference spectra and the utilization of an algorithm for least squares minimization to produce corresponding unmixed spectra in graph form with error provided in minimal least squares values for flexibility in analysis. This will provide us the corrected intensity of fluorescein and rhodamine in our sample. For this, reference spectra of fluorescein, rhodamine and synthetic urine were collected. The reference spectrum of fluorescein was obtained from hyaluronan labeled with fluorescein only (HA-FL) excited at 470 nm and of rhodamine by exciting our HA-FRET probe at 520 nm. (Fig. 3) shows the example of how the resolved spectra were obtained.
Fig. 3.
(A) normalized emission spectrum of fluorescein (from HA-FRET labeled with fluorescein only. Exc 470 nm) and rhodamine (from HA-FRET by exciting at longer wavelength. Exc 520 nm) in synthetic urine pH 7.83 at RT (B) Emission spectra from 2 μM HA-FRET and background signal from synthetic urine. (C) Shows example of how the HA-FRET spectrum was resolved into its components using MATH-CAD based program written in our laboratory.
2.4. Lifetime Measurement of HA-FRET Probe
Fluorescence lifetime measurements were done using FluoTime 200 fluorometer (PicoQuant, GmbH, Berlin, Germany). This time–resolved instrument is equipped with an ultrafast detector, a Hamamatsu R3809U-50 microchannel plate photomultiplier (MCP). For the excitation we used a 470 nm picosecond pulsed laser diode. The detection was through a monochromator supported by 495 nm long wave pass filter in order to eliminate scattered excitation light. The decay data were analyzed with FluoFit, version 5.0 software (PicoQuant, GmbH). Fluorescence intensity decays were analyzed by deconvolution with the instrument response function which is obtained using ludox and analyzed as a sum of experimental terms:
where, I(t) is the fluorescence intensity at time t and αi is a preexponential factor representing the fractional contribution to the time-resolved decay of the component with the lifetime τi(Σαi = 1). The amplitude average lifetime was calculated as .
3. RESULTS AND DISCUSSION
3.1. Fluorescence Emission
We measured fluorescence spectra of HA-FRET probe in the absence and presence of HA-ase. The sample was incubated in synthetic urine for 90 minutes with different concentrations of enzyme at room temperature (25°C). Without the enzyme, release of FRET was not observed. In the presence of enzyme (Fig. 1), at 90 minutes, we observed release of FRET and donor emission intensity increases with significant change in the donor to acceptor emission intensity ratio. The increased donor to acceptor ratio is dependent on enzyme concentration. Higher the concentration of HA-ase, greater is release of FRET.
Fig. 1.
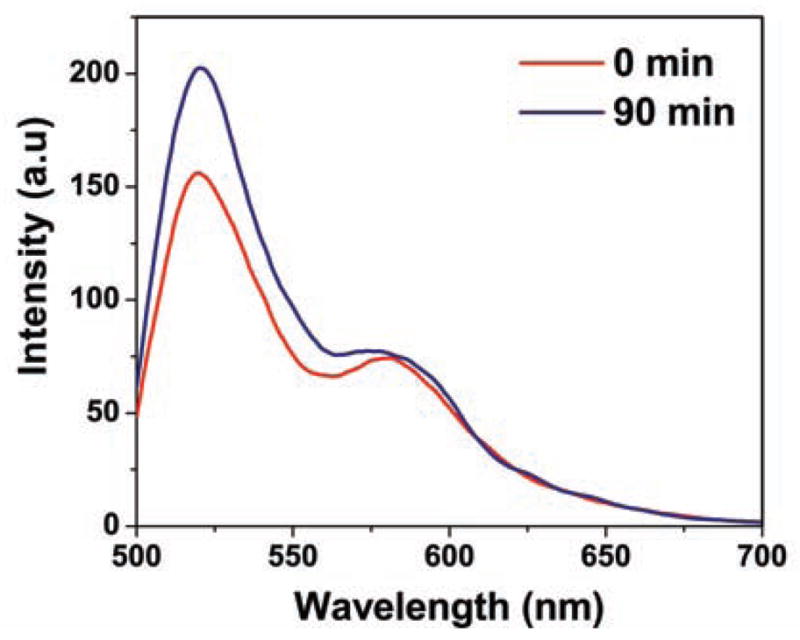
Difference between emission intensity of HA-FRET when incubated with 35 U/mL HA-ase for 90 min. Excitation used was 470 nm. Experiment was carried out at RT in synthetic urine pH 7.83.
3.2. Fluorescence Lifetime
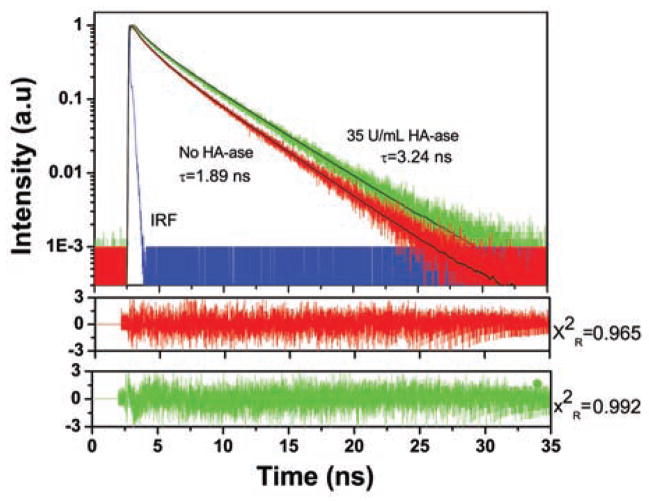
The fluorescence intensity decay measurement is shown in (Fig. 2). Each measurement was taken in the presence and absence of HA-ase at 90 minute. The fluorescein is highly quenched in the absence of HA-ase, showing a heterogeneous decay and three components are needed to fit the data with lifetime of 3.65, 1.35 and 0.21 ns and amplitudes: 0.74, 0.22, and 0.35 with amplitude average lifetime of 1.89 ns. With an increase in concentration of HA-ase, amplitude average lifetime increased proportionately (Table 1). For 10 U/ml, 35 U/mL and 100 U/mL of enzyme amplitude average lifetime was 3.01ns, 3.24 ns and 3.48 ns respectively. After addition of HA-ase, components needed to fit the data also decreased from three to two. The time resolved measurements showed increase in donor lifetime with gradual addition of enzyme, strongly indicate release of FRET in the enzyme presence and corroborate our intensity based ratiometric measurements
Fig. 2.
Fluorescence intensity decays of 2 uM HA-FRET (donor) in synthetic urine when incubated with 35U/mL of HA-ase enzyme for 90 minutes. Excitation used was 470 nm laser. Donor emission was observed at 520 nm using 495 long pass filter before detector. Decays were fitted using multi-exponential function and chi square values were used to access the goodness of fit.
Table 1.
Time Resolved Fluorescence Intensity Decay Parameters for the Donor in HA-FRET with Different Concentration of HA-ase at RT.
| No Enzyme | 10 U/ml | 35U/ml | 100U/ml | |
|---|---|---|---|---|
| τ1 (ns) | 3.65 | 4.04 | 4.14 | 4.19 |
| τ2(ns) | 1.35 | 0.79 | 0.62 | 0.49 |
| τ3(ns) | 0.21 | - | - | - |
| α1 | 0.74 | 0.92 | 0.95 | 0.96 |
| α2 | 0.22 | 0.08 | 0.05 | 0.03 |
| α3 | 0.035 | - | - | - |
| <τ>i) | 1.89 | 3.01 | 3.24 | 3.48 |
| −τii) | 3.02 | 3.77 | 3.97 | 4.1 |
| X2Riii) | 0.965 | 0.966 | 0.992 | 0.938 |
τ1, τ2 and τ3 are different lifetime and α1, α2 and α3 are components of fluorescence lifetime in nanoseconds.
, Where
(X2R = goodness of fit).
3.3. Resolution of Spectra
The obtained fluorescence spectrum is a convolution of donor and acceptor emission spectrum therefore doesn’t give the exact intensity of donor and acceptor emission. It has been our observation that usually acceptor shows higher emission intensity compared to its corrected emission intensity calculated by resolution of the spectrum. To estimate the corrected emission intensities we deconvoluted each spectrum into its donor and acceptor components. As shown in (Fig. 3), we used normalized fluorescein and rhodamine spectra as reference spectra for deconvolution. As (Fig. 3) (B) shows, our synthetic urine had negligible contribution to the observed fluorescence from HA-FRET sample (2uM). (Fig. 3) (C) shows spectrum to be resolved (black line) and the corrected individual donor (green line) and acceptor (red line) emission spectra after deconvolution of the spectrum to be resolved. As mentioned earlier, we can observe that the corrected intensity of acceptor (rhodamine) is less compared to its observed intensity from the HA-FRET molecule.
3.4. FRET Based Ratio Metric Sensing
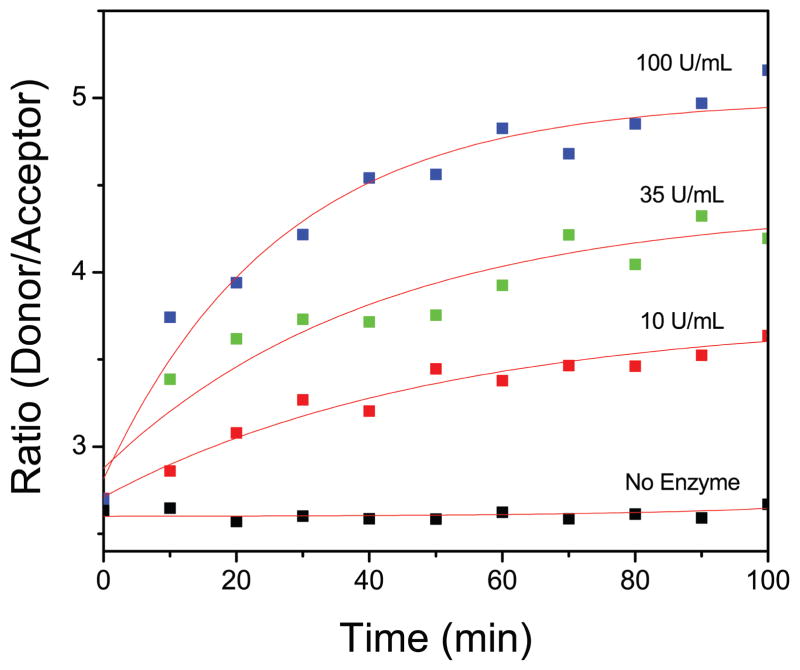
We resolved each spectrum as mentioned earlier to calculate intensity ratio every 10 minute for all concentrations of HA-ase. (Fig. 4) shows donor to acceptor intensity ratio against time for all concentrations (10, 35 and 100 U/mL) of enzyme. HA-FRET solution without enzyme did not show any change in intensity ratio whereas, in the presence of HA-ase release of FRET and increase in intensity ratio was observed. There is an exponential increase in intensity with increase in time. Intensity ratio (green/red emission) of HA-FRET as function of HA-ase concentration at 60 min is shown in (Fig. 5). After 60 minutes this enzymatic reaction almost reaches a plateau and no significant changes are observed thereafter. These results indicate a strong dependence of digestion kinetics on the enzyme concentration. (Fig. 5) shows the standard curve for calculating the unknown concentration of HA-ase. The intensity ratio and concentration of HA-ase shows exponential relationship and can easily be applied to real time urine samples to calculate enzyme concentration in it. Such dependence facilitates the detection of the presence and activity of the HA-ase enzyme
Fig. 4.
Time dependant fluorescence intensity ratio (green/red emission) of HA-FRET probe in the presence and absence of HA-ase and exponential fits (red lines) to data. Concentration of HA-FRET sample was 2 uM in each case. The excitation was 470 nm and experiment was done at RT in synthetic urine pH 7.83.
Fig. 5.
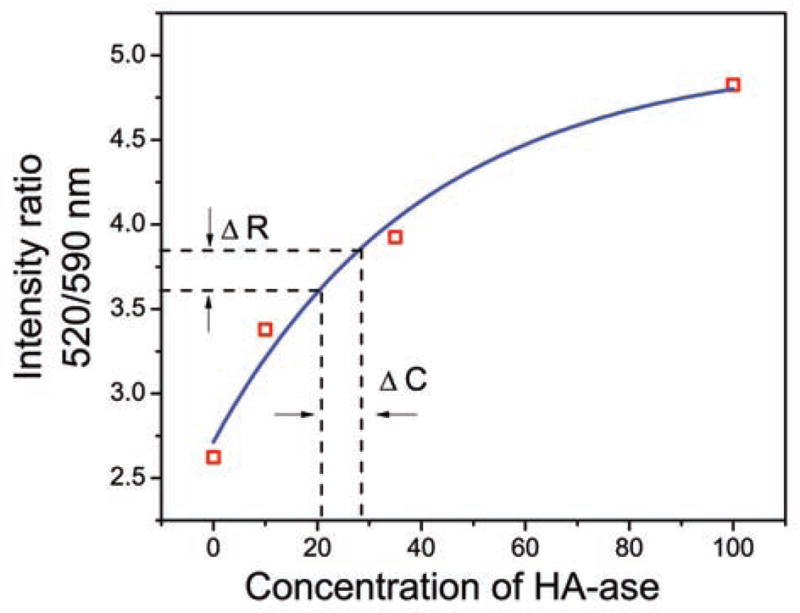
Intensity ratio (green/red emission) of HA-FRET as function of HA-ase concentration at 60 min and exponential fit (blue line. If ΔR= 3.72 ±0.12 then ΔC= 24.5 ±3.5.
CONCLUSION
With this technique, it is possible to mark the HA-ase activity by fluorescence intensity changes in our HA-FRET probe. Release of FRET is observed with increase in concentration of Hyaluronidase. Lifetime based sensing of HA-ase supports our fluorescence intensity based measurements. Increase in lifetime of donor is noticed in the presence of HA-ase. Release of FRET and hence increase in fluorescein (donor) lifetime was observed. This ratiometric sensing is a very precise method of measuring changes in the fluorescence intensity. As we know, with progressive stage of urinary bladder or prostate cancer, the amount of HA-ase released in urine is increased. With this, we propose that this technique can be potentially used to determine the amount of hyaluronidase in patient’s urine and hence the progressive stage of urinary bladder or prostate cancer can be determined.
Scheme 1.

HA-FRET molecule labeled with fluorescein as donor and rhodamine as acceptor.
Acknowledgments
This work was supported by the NIH GRANT R01EB12003.
Footnotes
CONFLICT OF INTEREST
The authors confirm that this article content has no conflicts of interest.
Send Orders of Reprints at reprints@benthamscience.net
References
- 1.Siege R, Naishadham D, Jemal A. Cancer statistics, 2012. Can J Clinician. 2012;62:10. doi: 10.3322/caac.20138. [DOI] [PubMed] [Google Scholar]
- 2.Lokeshwar VB, Lokeshwar BL, Pham HT, Block NL. Association of elevated levels of hyaluronidase, a matrix-degrading enzyme, with prostate cancer progression. Cancer Res. 1996;56(3):651–657. [PubMed] [Google Scholar]
- 3.BR, Getzenberg RH. Urine based markers of urological malignancy. J Urol. 2001;165(2):600–611. doi: 10.1097/00005392-200102000-00081. [DOI] [PubMed] [Google Scholar]
- 4.Lokeshwar VB, Block NL. HA-HAase urine test. A sensitive and specific method for detecting bladder cancer and evaluating its grade. Urol Clin North Am. 2000;27(1):53–61. doi: 10.1016/s0094-0143(05)70234-2. [DOI] [PubMed] [Google Scholar]
- 5.Csoka AB, Frost GI, Stern R. The six hyaluronidase-like genes in the human and mouse genomes. Matrix Biol. 2001;20(8):499–508. doi: 10.1016/s0945-053x(01)00172-x. [DOI] [PubMed] [Google Scholar]
- 6.Stern R, Jedrzejas MJ. Hyaluronidases: Their genomics, structures, and mechanisms of action. Chem Rev. 2006;106(3):818–839. doi: 10.1021/cr050247k. [DOI] [PMC free article] [PubMed] [Google Scholar]
- 7.Lee JY, Spicer AP. Hyaluronan: A multifunctional, megaDalton, stealth molecule. Curr Opin Cell Biol. 2000;12(5):581–586. doi: 10.1016/s0955-0674(00)00135-6. [DOI] [PubMed] [Google Scholar]
- 8.Lin G, Stern R. Plasma hyaluronidase (hyal-1) promotes tumor cell cycling. Cancer Lett. 2001;163(1):95–101. doi: 10.1016/s0304-3835(00)00669-8. [DOI] [PubMed] [Google Scholar]
- 9.Benitez A, Yates TJ, Lopez LE, Cerwinka WH, Bakkar A, Lokeshwar VB. Targeting hyaluronidase for cancer therapy: Anti-tumor activity of sulfated hyaluronic acid in prostate cancer cells. Cancer Res. 2011;71(12):4085–4095. doi: 10.1158/0008-5472.CAN-10-4610. [DOI] [PMC free article] [PubMed] [Google Scholar]
- 10.Maa C, Zeng F, Wu G, Wu S. A nanoparticle-supported fluorescence resonance energy transfer system formed via layer-by-layer approach as a ratiometric sensor for mercury ions in water. Analytica Chimica Acta. 2012;734:69–78. doi: 10.1016/j.aca.2012.05.020. [DOI] [PubMed] [Google Scholar]
- 11.Fudala R, Mummert ME, Gryczynski Z, Gryczynski I. Fluorescence detection of hyaluronidase. J Photochem Photobiol B. 2011;104(3):473–477. doi: 10.1016/j.jphotobiol.2011.06.003. [DOI] [PMC free article] [PubMed] [Google Scholar]


