

Abstract
The brain-derived neurotrophic factor (BDNF) has been shown to have broad neuroprotective effects in addition to its therapeutic role in neurodegenerative disease. In this study, the efficacy of delivering exogenous BDNF to the left hippocampus is demonstrated in wild-type mice (n=7) through the noninvasively disrupted blood-brain barrier (BBB) using focused ultrasound. The BDNF bioactivity was found to be preserved following delivery as assessed quantitatively by immunohistochemical detection of the pTrkB receptor and activated pAkt, pMAPK, and pCREB in the hippocampal neurons. It was therefore shown for the first time that systemically administered neurotrophic factors can cross the noninvasively disrupted BBB and trigger neuronal downstream signaling effects in a highly localized region in the brain. This is the first time that the administered molecule is tracked through the blood-brain barrier (BBB) and localized in the neuron triggering molecular effects. Additional preliminary findings are shown in wild-type mice with two additional neurotrophic factors such as the glia-derived neurotrophic factor (GDNF) (n=12) and neurturin (NTN) (n=2). This further demonstrates the impact of FUS for the early treatment of CNS diseases at the cellular and molecular level and strengthens its premise for FUS-assisted drug delivery and efficacy.
Keywords: Blood-brain barrier, BDNF, downstream effects, brain drug delivery, focused ultrasound, GDNF, microbubbles, neurturin
1. Introduction
The presence of a highly selective BBB has hindered the delivery of many therapeutic agents to the brain, prompting researchers to investigate various methods to circumvent this protective homeostatic mechanism, such as focused ultrasound (FUS), intra-arterial injection of hyperosmotic solutions (Kroll and Neuwelt, 1998), convection-enhanced diffusion (Bobo et al., 1994), intracranial injection (Weaver and Laske, 2003), or chemical modification of drugs by lipidization or conjugation to genetically-engineered molecular Trojan horses (Pardridge, 2005). Recently, the technique of FUS in conjunction with systemically administered microbubbles has been shown to induce BBB opening noninvasively, transiently, and with high spatial selectivity (Choi et al., 2010a; Choi et al., 2007b; Choi et al., 2010b; Hynynen et al., 2001; Liu et al., 2008; McDannold et al., 2005). The delivery of many large agents using focused ultrasound and microbubbles have been demonstrated in previous studies by our group and others: MRI contrast agents such as Omniscan (573 Da) (Choi et al., 2007b) and Magnevist® (938 Da) (Choi et al., 2007a), Evans Blue (Kinoshita et al., 2006b), Trypan Blue (Raymond et al., 2008), Herceptin (148 kDa) (Kinoshita et al., 2006a), horseradish peroxidase (40 kDa) (Sheikov et al., 2008), doxorubicin (544 Da) (Treat et al., 2007), and rabbit anti-Aβ antibodies (Raymond et al., 2008). However, despite the promise shown by the delivery of such a variety of compounds, to the authors’ knowledge, there is only one FUS study that has addressed the bioactivity of the molecules after they have crossed the BBB (Jordao et al., 2010).
Until now focused ultrasound (FUS) together with the use of microbubbles has been shown to open the blood-brain barrier (BBB) in vivo and allow certain molecules to permeate it. Prior reports on BBB disruption indicate opening but do not show whether the molecule stays in the extracellular space or enters the cell, an important and immense difference in brain drug delivery. Unless the neurotrophic factor enters the neuronal cell, its therapeutic effect cannot be triggered. This paper reports two novel findings that are critical towards both the basic understanding of the physical mechanism and its biological/clinical translation. For the first time we show that 1) therapeutic molecules that can reverse the process of neurodegenerative disease, i.e., neurotrophic or growth factors can cross through the BBB and 2) cellular and molecular cascades are triggered which demonstrate both the uptake of the molecules through the cell membranes and to the nucleus of the neurons in the hippocampus, the memory center of the brain and the target of early Alzheimer’s. Until now it was not known where the molecules diffuse, i.e., if they stay in the extracellular matrix or enter the cells how and where. These are some of the questions that are addressed in this paper. For the first time we demonstrate that this technique can deliver the drugs to the intended target into the cell nucleus triggering the required molecular cascades. In addition to what was stated above, Alzheimer’s can now be detected at increasingly earlier stages using PET imaging i.e. before any onset of symptoms. Therefore, targeted and noninvasive techniques such as FUS are warranted for treatment starting with the hippocampus and the brain-derived neurotrophic factor (BDNF), one of the most promising compounds shown to reverse the disease in cell cultures and direct injection.
In this study, our first goal was to show preserved bioactivity of a delivered compound following FUS-mediated BBB opening. Our second goal was to demonstrate such feasibility using a compound that has substantial research utility and potential therapeutic value, but possesses size and stability attributes that make it difficult to cross the BBB when systemically administered. A compound that fits this description is brain-derived neurotrophic factor (BDNF), a member of the neurotrophin family that exerts crucial influence on proliferation and differentiation of neurons, and promotes neuronal growth and survival in the nervous system (Waterhouse and Xu, 2009), including hippocampal neurons (Yan et al., 1997).
BDNF, along with its TrkB receptor, is widely expressed and densely distributed throughout the CNS (Altar et al., 1994) in both the developing and the mature brain (Hofer et al., 1990). It has been proposed that an insufficient supply of endogenous neurotrophic factors for selective neuronal populations may lead to the development of neurodegenerative diseases (Connor et al., 1997). Decreased levels of BDNF protein have been demonstrated in the substantia nigra in Parkinson’s disease (Howells et al., 2000), and in the hippocampus and the entorhinal cortex of Alzheimer’s brain (Lee et al., 2005). BDNF signaling and downregulation also appear to play a crucial role in Huntington’s disease (Ciammola et al., 2007) and neuropsychiatric diseases and depression (Martinowich et al., 2007).
Despite its importance in health and disease, the role of BDNF as a therapeutic agent has been diminished due to its BBB impermeability and short half-life in the systemic circulation. BDNF’s molecular weight (27 kDa) exceeds the ~180 Da limit (Kroll and Neuwelt, 1998) of BBB permeability. Moreover, BDNF has a half-life of less than 10 minutes in the blood and is rapidly cleared from the circulation mostly by the liver (Sakane and Pardridge, 1997). Considering the neuroprotective properties of BDNF and the growing interest in this compound as well as the aforementioned problems associated with its transport across the BBB, intravenously administered BDNF is an ideal candidate to study for the FUS-mediated delivery to the brain.
The aim of our study was to demonstrate the efficacy of the FUS method by accomplishing two objectives after BBB opening: 1) diffusion of BDNF across the BBB and containment within the targeted region, i.e., the hippocampus and 2) associated activation of the BDNF receptor and its downstream signaling molecules in neurons, showing bioactivity of the functional BDNF upon delivery.
In order to discuss BDNF bioactivity, a brief review of the BDNF signaling pathway is deemed essential. On the surface of cell soma, dendrites, and axons of hippocampal neurons, BDNF binds to tyrosine kinase (Trk) receptor with high affinity, initiating TrkB dimerization and autophosphorylation at the intracellular catalytic domain (Y705/6) (Huang and Reichardt, 2001). This event in turn induces the autophosphorylation of tyrosines 515 and 816 on the TrkB receptor. Phosphotyrosine 515 activates the Ras/MAPK and phosphoinositide 3 kinase pathways and ultimately enhances neuronal survival and differentiation. Phosphotyrosine 816, on the other hand, activates phospholipase Cγ, leading to upregulation of intracellular Ca2+ levels and activation of calcium/calmodulin kinase pathway. Both Ras/MAPK and calcium/calmodulin pathways are considered responsible for the activation of the transcription factor cAMP-response-element binding protein (CREB), which induces gene expression and is involved in the development and synaptic plasticity (Lonze and Ginty, 2002).
2. Methods
To visualize the passage of BDNF across the BBB, the fluorescent dye Alexa Fluor 594 was conjugated to BDNF prior to the experiments. The fluorescent tag was not expected to modify the transport properties of BDNF given its small molecular weight (~0.3 kDa) compared to the BDNF’s (27 kDa). Following successive application of FUS sonication (Figs. 1a and 1b), microbubble injection, and intravenous injection of BDNF, the mice (n=3) were sacrificed 20–30 min post-sonication for histological analysis 1) to allow sufficient time for the BDNF to accumulate in the BBB-opened region and facilitate detection of the compound (higher fluorescent intensity) at the sonicated areas; 2) to allow most of the compound to circulate through the microvasculature before being cleared by the venous system, since circulating BDNF has been shown to have a half-life of less than 10 min (Sakane and Pardridge, 1997) and 3) to allow sufficient time for the downstream signaling cascade to be activated. The activation of the BDNF receptor, TrkB, occurs within seconds of BDNF delivery (Boulanger and Poo, 1999).
Figure 1.

(a) Experimental setup, (b) targeting method for opening the BBB in the left hippocampal region using lambdoid and sagittal sutures of the mouse skull as anatomical landmarks.
Animals
A total of seven C57Bl6 male mice were used for this study (17.6–23.0 g, Harlan Laboratories). The animals were anesthetized with a mixture of oxygen (0.8 L/min at 1.0 Bar, 21°C) and 1.5–2.0% vaporized isoflurane (Aerrane, Baxter Healthcare) using an anesthesia vaporizer (SurgiVet, Smiths Group). The mouse’s vital signs were monitored continuously and isoflurane was adjusted throughout the experiment as needed. The Columbia University Institutional Animal Care and Use Committee (IACUC) gave approval for the mouse studies.
The total number of mice used in the BDNF study was seven (n=7) as follows: three mice were injected with BDNF, sonicated and sacrificed after 20–30 min for both IHC & fluorescence analysis, one mouse was with BDNF, sonicated and sacrificed but died after 3 min (IHC and fluorescence analysis were also performed but discounted in the statistical analysis) and three controls were sonicated and sacrificed after 20–30 min (No BDNF) for IHC analysis. We used three types of “controls” to show the effect of sonication on the BDNF permeation through the blood-brain barrier and subsequent activation of the downstream signaling cascade as follows:
To demonstrate the difference between the left (sonicated) hippocampus and the right (non-sonicated) hippocampus in four mice (three mice sacrificed after 20–30 min, one died after 3 min) following BDNF injection and sonication.
To demonstrate no difference between the left (sonicated) hippocampus and the right (non-sonicated) hippocampus in three control mice following only sonication (no BDNF) so as to rule out the effect of sonication alone on signaling cascade activation
To obtain negative controls for the IHC analysis in all studied mice, where no primary antibody was added to the sections.
The statistical analysis was based on the three BDNF-injected mice that were sacrificed after 20–30 min, so it did not include the 3-min mouse case. The results for the case of 3-min BDNF-injected mouse are also presented merely for comparison in terms of the downstream signaling activation and its time dependence in order to support previous reports on the temporal sequence of signaling cascades downstream of BDNF. It is important to note that the BDNF was injected into the femoral vein 10-min after sonication while the mice were still anesthetized. There was at least 3 min (1 mouse) and 20–30 min (3 mice) of circulation before PBS transcardial perfusion was started.
Neurotrophic Factors
Brain-Derived Neurotrophic Factor (BDNF)
The Brain-Derived Neurotrophic Factor (BDNF) conjugated to Alexa Fluor® 594 dye was used in our experiments (Invitrogen Corp, Carlsbad, CA, USA). BDNF Human Recombinant was produced in Escherichia Coli and is a homodimer, non-glycosylated, polypeptide chain containing 2 × 119 amino acids with a total molecular mass of 27 kDa. According to the supplier, it was purified by proprietary chromatographic techniques and the sequence of the first five N-terminal amino acids was determined and found to be Met-His-Ser-Asp-Pro. Biological activity was determined by evaluating ED50 (50 ng/ml), calculated by the dose-dependent induction of ACHE (acetylcholine esterase) in rat basal forebrain primary septal culture. The compound (6.0 mg) was custom conjugated to Alexa Fluor® 594 dye (~1:1 molar ratio) and provided in a fine lyophilized powder. The vials were stored under −18°C until use.
Glial-Derived Neurotrophic Factor (GDNF) and Neurturin (NTN)
A total of 12 mice received FUS followed by GDNF (40–90mg/kg in 0.15 ml PBS, n=10), as well as NTN (20mg/kg in 0.2 ml PBS, n=2) injections. Only two mice were used for the NTN study due to the limited amount provided for the purspose of this study. Both GDNF and NTN were conjugated with Alexa Fluor® 488 fluorescent dye. Four sites within a 1 mm square in the caudate were sonicated at a frequency of 1.5 MHz, with a pulse length of 15,000 cycles (n=3) and 30,000 cycles (n=8), at varying pressures. Detailed acoustic parameters were shown in Table 1.
Table 1.
FUS parameters used in the case of GDNF and NTN
| Compound | GDNF | NTN | |||||||||
|---|---|---|---|---|---|---|---|---|---|---|---|
| PL (cycles) | 15,000 | 30,000 | 30,000 | ||||||||
| P-N pressure | 0.30 | 0.45 | 0.60 | 0.30 | 0.45 | 0.60 | 0.60 | ||||
| Circulation time | 45 | 180 | 180 | 60 | 60 | 6.5 | 45 | 30 | 60 | 60 | 30 |
In the case of 6.5 minutes circulation time, blood was drawn after 45 seconds to confirm the circulation and fluorescence of the protein. Brain, liver, kidney, and testes were extracted and fixed for frozen section. Organs were then frozen into blocks and sectioned at 100 μm to potentially locate GDNF.
Ultrasound
A single-element spherical segment FUS transducer (center frequency: 1.525 MHz; focal depth: 90 mm) was driven by a function generator (Agilent Technologies) through a 50-dB power amplifier (ENI) to generate therapeutic ultrasound waves (Choi et al., 2007b). A pulse-echo transducer (center frequency: 7.5 MHz; focal length 60 mm) was positioned through a center hole of the FUS transducer so that the foci of the two transducers were aligned. It was driven by a pulser-receiver system (Panametrics) connected to a digitizer (Gage Applied Technologies) and was used for imaging. A cone filled with degassed and distilled water and capped with an acoustically transparent polyurethane membrane (Trojan; Church & Dwight) was mounted on the transducer system (Figure 1a). The transducers were attached to a computer-controlled 3D positioning system (Velmex). The FUS transducer’s pressure amplitude reported in this study was previously measured with a needle hydrophone (needle diameter: 0.2 mm; Precision Acoustics) in degassed water while accounting for 18.1% attenuation by the mouse skull. The dimensions of the beam were measured to have a lateral and axial full-width at half-maximum (FWHM) intensity of approximately 1.32 and 13.0 mm, respectively.
Targeting Procedure
The head of each anesthetized mouse was immobilized using a stereotaxic apparatus. The fur on top of the head was removed with an electric razor and a depilatory cream. After applying ultrasound gel, a water bath with its bottom made of an acoustically and optically transparent membrane was placed on top of the head and gel. A grid positioning method to target the mouse hippocampus was then used as previously described (Choi et al., 2007b). In brief, a metallic grid was placed in alignment with the mouse skull’s sutures, which were visible through the intact scalp of the mouse after hair removal. The left hippocampus was localized by identifying the sagittal suture and then moving 2.5 mm to the left of that suture and subsequently 3 mm in depth from the top of the skull. The grid was removed immediately after targeting was completed and prior to FUS application as it would otherwise interfere with the sonication. Four target sonication locations were identified relative to the sutures. The first target overlapped the medial portion of the hippocampus, the lateral portion of the thalamus, and the posterior cerebral artery (PCA). The transducer was then moved 1 mm anterior and 1 mm lateral for the second target and then 1 mm posterior for the third. The fourth and final target was 1 mm medial and 1 mm anterior. In the end, four different locations were targeted at the corner of a 1 mm × 1 mm square.
Sonication Protocol
BDNF
Definity® microbubbles (diameter: 1.1–3.3 μm, vial concentration: 1.2×10¹⁰ bubbles/mL; Lantheus Medical Imaging) composed of octafluoropropane gas encapsulated in a lipid shell were diluted (1:20) in phosphate-buffered saline (PBS) and then administered into the tail vein (final administered concentration: 50 μl/kg of body mass). This dosage was selected to be consistent with previous studies by our group. However, it is important to note that different bubble concentrations have not shown any significant differences (Choi et al. 2010a). Therefore, in future studies when we plan on using the clinical dose, which is five times lower, we do not expect significant differences. One minute after injection, pulsed-wave FUS (peak-rarefactional pressure: 0.46 MPa; pulse repetition frequency: 10 Hz; pulse length: 20 ms) was applied. Each of the four target locations was sonicated twice, resulting in a total of 8 sets of 30s sonication with a 30s delay between each set.
GDNF and NTN
The sonication parameters are provided in Table 1. All other parameters used were the same as in the case of BDNF.
Administration, Perfusion, and Sectioning
A bolus injection of BDNF compound via the femoral vein was followed 10 minutes after sonication (40–90 mg/kg of mouse body mass in 0.2 ml PBS). Except for one animal that died 3 minutes after injection and was perfused immediately, the rest of the animals were sacrificed 20–30 minutes after the injection to allow for adequate circulation. The animals were transcardially perfused with phosphate buffered saline (4–5 min.) and 4% paraformaldehyde (7–8 min) at a flow rate of 6.8 ml/min. Next, the skulls were removed and immersion-fixed for 24 hours before extracting the brains. Extracted brains were fixed again in 4% paraformaldehyde for 24 hours, and transferred to 10% (30 min), 20% (60 min), and 30% (24 hr) sucrose solution for cryoprotection. Brain samples were then embedded in an Optimal Cutting Temperature (OCT) medium and were frozen using dry ice and isopentane. Frozen blocks were sectioned horizontally at 10–150 μm thickness for fluorescent imaging and at 5–10μm thickness for immunohistochemistry. Slices covering the entire hippocampus were selected, placed on a slide, and stored in −18°C freezer for later analysis. In every case, the right hippocampus is not sonicated and therefore serves as the control to the left hippocampus, which is always the sonicated one.
Immunohistochemistry
Immunohistochemistry was performed only in the case of BDNF according to standard procedures. We used five primary antibodies: two against phosphorylated TrkB receptor (p-Y816 rabbit polyclonal [ab75173] and p-Y515, rabbit polyclonal [ab51187]) purchased from Abcam Inc. (Cambridge, MA), and three against phosphorylated Akt (p-S473 rabbit monoclonal [#4060]), phosphorylated MAPK (p-T202/T204 rabbit monoclonal [#4370]), and phosphorylated CREB (p-S133 rabbit monoclonal [#9198]), all purchased from Cell Signaling Technology (Danvers, MA). Slides containing thin frozen sections (5–10 μm) were dried and placed in a citrate buffer (pH 6.0) for antigen retrieval using a microwave. Slides were allowed to cool for 20 minutes prior to a PBS rinse (3 × 5 min) and then incubated in 0.3% hydrogen peroxide in PBS (five min) to block endogenous peroxidase activity. Slides were washed again in PBS (3 × 5 min) and blocked in 10% normal goat serum with 0.1% BSA for 20 minutes. After blocking solution was removed, the primary antibodies were diluted in DAKO antibody diluent solution (1:50–1:300) and incubated for 60 minutes at room temperature. Slides were washed in PBS for five min and incubated with biotinylated secondary antibody (goat anti-rabbit 1:200; Vector Laboratories, Burlingame, CA) for 30 minutes at room temperature. Slides were washed again in PBS (3 × 5 min) and VECTASTAIN® ABC reagent was added to the sections for 30 minutes (A: 1:60, B: 1:60 in PBS mixed 30 min prior to use). Slides were washed in PBS (3 × 5 min) and peroxidase substrate solution DAB (DAKO, Carpinteria, CA) was added to sections (1 drop of DAB in 1 ml buffer). Slides were immersed in dH2O as soon as color developed. Sections were counterstained with hematoxylin, cleared and dehydrated with alcohols and xylene, and covered with Permount™ mounting medium (Thermo Fisher Scientific, Inc Waltham, MA, U.S.A.), and a glass coverslip.
Bright-Field and Fluorescent Microscopy
Bright-field and fluorescent images were acquired using a light and fluorescence microscope (BX61; Olympus, Melville, NY, USA) with a filter set at excitation and emission wavelengths of 595 nm and 615 nm, respectively.
Quantification
Bright field images were white corrected with same correction for both right (control) and left (sonicated) images. Diaminobenzidine (DAB) stain density was then extracted from the bright field images using a color deconvolution method and implemented in Matlab (Mathworks, Natick,MA) by the Open Microscopy Environment project (OME, www.openmicroscopy.org). H&E DAB built-in vectors were used for the deconvolution step. Where DAB is uptaken, the cellular region in question turns brown. For each image, the mean stain intensity was computed using the logarithm of the stain intensity. Obvious image artifacts (folded tissue, holes or stain droplets) were manually segmented in each image and removed from the analysis. For each mouse and each antibody, the percentage change (PC) of the stain intensity between the left and the right sides was then computed as follows: PCI = 100 [(ILeft – IRight)/IRight]
Statistical Analysis
Statistical analysis was performed using a two-tailed Student’s t-test to determine whether the BDNF concentration is significantly increased in the sonicated (left hippocampus) region compared to the BDNF concentration in the unsonicated (right hippocampus) region. A p<0.05 was considered significant in all comparisons.
3. Results
Figure 2a shows the diffusion of BDNF at the sonicated region in the left hippocampus as detected by fluorescent intensity of Alexa Fluor 594 (mouse sacrificed 20 min after BDNF injection). A considerable difference was evident in fluorescent intensities between the sonicated hippocampus (left) and the control un-sonicated hippocampus (right). Regions of greater intensity included parts of the thalamus, the transverse hippocampal artery and its branches inside the hippocampus, the neurons in the pyramidal (CA1–CA3) layers of the hippocampus proper, and the neurons in the hilus and granular layers of the dentate gyrus. Figures 2b–c depict the extent of immunoreactivity to phosphorylated MAPK (activated molecule downstream of BDNF signaling; discussed below) in a DAB-stained section that was sectioned ~300 μm dorsally from the frozen section imaged in Figure 2a. The DAB-stained regions closely matched the areas of BDNF diffusion, providing a multi-modality confirmation of BDNF delivery across the BBB. No difference in DAB intensity was observed in the case of the mouse sacrificed 3 min after sonication (Fig. 2(d)) or the negative control for the case in Fig. 2(a), i.e., no primary antibody added (Fig. 2(e)).
Figure 2.

(a) Fluorescent image of a 100-micron frozen brain section from a mouse that was sacrificed 20 min after sonication. The sonicated hippocampus (left) shows much higher fluorescent intensity than the un-sonicated hippocampus (right), depicting blood-brain barrier opening and the extravasation of fluorescent-tagged (Alexa Fluor 594) BDNF in the sonicated region; (b) a 5-micron frozen section from the same mouse was immunohistochemically stained using a primary antibody against phosphorylated MAPK (pMAPK). Consistent with the fluorescent image in (a), the intensity of DAB staining is much greater in the left sonicated hippocampus compared to the right control; the black box shows the enlarged area in (c), where immunoreactivity to pMAPK is shown in mossy fiber terminals (arrowhead), suprapyramidal CA3 dendrites (black star), and the axons of the Schaffer collateral system (hollow star); (d) immunohistochemical staining of a 5-micron frozen section from a mouse that was sacrificed 3 min after sonication; the same primary antibody against pMAPK was used. No difference in DAB intensity is observed between the sonicated and the control hippocampus, i.e., the 3-min case did not show significantly greater immunoreactivity to MAPK in the sonicated region in contrast to all three 20–30 min mice that did (b–c);(e) Negative control performed at the same time and for the same mouse as in (a); no primary antibody (against pMAPK) was added to this 5-micron frozen section during the staining procedure. All magnifications are 40× and scale bars are 500 μm except for (c), which is 100× and 200 μm, respectively.
To demonstrate post-delivery bioactivity of the BDNF compound, we utilized immunohistochemical techniques to detect activated downstream signaling molecules using two primary antibodies against the activated TrkB receptor (pTrkB Y816 and pTrkB Y515), and three primary antibodies against the phosphorylated MAPK (T202–T204), phosphorylated CREB (S133), and phosphorylated Akt (S473). We quantified the relative activation of these signaling molecules in sonicated vs. non-sonicated hippocampi of both BDNF-administered (N=3) and control mice (N=3) by measuring the DAB stain intensity as described in the methods.
Across all BDNF-administered mice (sacrificed 20–30 min post-sonication), immunoreactivity to each activated signaling molecule displayed a distinct characteristic stain that was unique and easily identifiable among various brain slices. Figure 3 demonstrates the greater presence of immunoreactivity to pTrkB Y816 (a-c) and pTrkB Y515 (d) in the sonicated brain regions (left column) compared to the non-sonicated contralateral regions (right column). On the sonicated side, DAB staining is clearly visible on neuronal cell membranes in the hilus and granular layers of the dentate gyrus (Fig. 3c), CA1 (Fig. 3a) and CA3 (Fig. 3d) regions of the hippocampus, and on the ependymal cell membranes of the choroid plexus in the adjacent lateral ventricle (Fig. 3b). It should be noted that such difference in DAB intensity was not apparent in all the sections, but only in some, probably due to loss of TrkB phosphorylation state after the 20–30 min delay in sacrificing the mice post-sonication and BDNF injection. On the other hand, there was strong immunoreactivity to pMAPK and pCREB in the sonicated left hippocampus of BDNF-administered mice in most of the sections analyzed 20–30 min post-injection. The temporal sequence of phosphorylation in downstream signaling molecules can be especially appreciated when the results are compared to those of the mouse expiring 3 min post-sonication. In those 3-min cases, the difference in DAB intensity between the left sonicated hippocampus and the control was observed only in the case of the pTrkB antibody (Fig. 3c), but not in pMAPK (Fig. 2d), pAkt (Fig. 4b), and pCREB (Fig. 4e) cases, suggesting that the BDNF-mediated phosphorylation of the TrkB receptor is rapid compared to phosphorylation of downstream molecules. As mentioned previously, immunoreactivity to downstream molecules was not only more pronounced, but also unique and distinct in the sonicated left hippocampus of >20 min samples. Phosphorylated MAPK was clearly detected in axons and dendrites of the pyramidal and granular neurons, but not in the neuronal cell bodies. pMAPK immunoreactivity was especially present in the mossy fibers of the CA3 hippocampal neurons (Fig. 2b–c). As expected, the phosphorylated CREB immunoreactivity was only observed in the nuclei and cytoplasm of the neuronal soma in all CA regions and layers of the sonicated hippocampus. With respect to the right (unsonicated) hippocampus (in both the control and BDNF-administered cases), much lower levels of pMAPK and pCREB immunoreactivity were detectable, suggesting basal levels consistent with other literature (Fig. 2b–c and Fig. 4c–d, right columns). In the case of pCREB, however, the CA1 region and parts of the granular layers of the dentate gyrus in the right unsonicated hippocampus showed complete absence of immunoreactivity (Fig. 4c–d, right columns).
Figure 3.

Immunohistochemical staining of 5-micron frozen sections using a primary antibody against phosphorylated TrkB 816 (a–c) and a primary antibody against phosphorylated TrkB 515 (d). Mice were sacrificed 20–30 min (a–b, d) or 3 min (c) after sonication. The difference in DAB intensity between the sonicated hippocampus (left column) and the contralateral control hippocampus (right column) is detectable in all the sections (a–d). In (a) and (b), the 20–30 min mice show increased DAB intensity in the presence of TrkB 816, although, in contrast to MAPK and CREB, a lower proportion of the sections showed notable differences between the left and right hippocampus. (b) clearly shows a difference in the DAB intensity in the choroid plexus of left vs. right. hippocampus given that the former is stained in brown (examples of DAB staining are indicated by the arrows) while the latter is only stained in blue. In (c), the 3-min-circulation case shows increased DAB intensity in the presence of TrkB 816. The immunoreactivity to pTrkB is shown at the plasma membrane of neuronal cells in CA1 region (arrows in a), ependymal cells of choroid plexus (arrowheads in b), neuronal cells in hilus and granular layers of dentate gyrus (arrowheads in c), and at the plasma membrane of pyramidal neurons (arrow in d) and axons (stars in d). Magnifications 21/24 and scale bars are 400× and 50 μm (b), 200× and 100 μm (a, c), and 100× and 200 μm (d), respectively.
Figure 4.
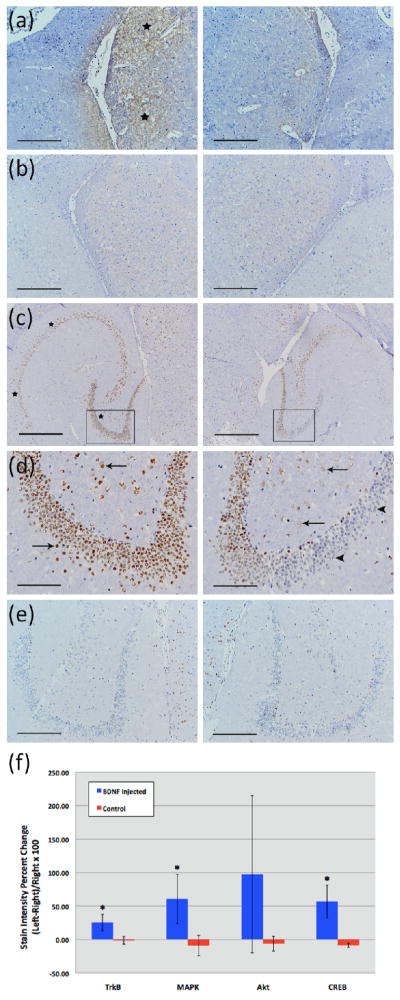
Immunohistochemical staining of 5-micron frozen sections using primary antibodies against phosphorylated Akt (a–b) and phosphorylated CREB (c–e). Mice were sacrificed 20 min (a, c–d) or 3 min (b, e) after sonication. Box in (c) shows the enlarged area in (d). Difference in DAB intensity between sonicated regions (left images) and the contralateral control (right images) is only observable in the 20 min samples (a, c–d; black stars). The greater intensity of the DAB stain in the sonicated region is especially noticeable in the thalamus in the case of pAkt (stars in a), and in the CA1 region of hippocampus (the left two stars in c), and in neuronal cells of the hilus and granular layers of dentate gyrus in the case of pCREB (arrows in d, left image). Contrast these findings with the minimal or lack of DAB staining in neuronal cells of the hilus and granular layers of dentate gyrus in the control un-sonicated hippocampus (arrows and arrowheads in d, right image, respectively). Magnifications and scale bars are 40× and 500 μm (c), 100× and 200 μm (a–b, e), and 200× and 100 μm (d), respectively. In (f), immunohistology stain intensity analysis shows percentage change between the left (FUS) and the right (no FUS) sides of the mice brains. A significant difference (p<0.05, N=3; depicted by asterisks) was found between the BDNF administered animal group and the control (no BDNF) animal group for the TrkB, MAPK, and CREB antibodies. Bars represent mean ± standard deviation.
In the case of antibodies against pTrkB (Y515 and Y816 results combined), pMAPK, and pCREB, mean percent changes in DAB stain intensity between the left and right hippocampal regions were significantly greater in the BDNF-administered mice (25.22, 60.58, and 56.91%) compared to those in the control mice (−1.36, −9.20, and −8.67%), respectively (p<0.05; Fig. 4f). In the case of the pAkt antibody, no significant difference between the mean percent changes in the DAB stain intensity of the BDNF-administered mice and the control mice was observed, although parts of the sonicated thalamus in the BDNF-administered mice showed greater DAB stain intensity than the un-sonicated side in a few sections (Fig. 4a).
4. Discussion
Despite BDNF’s indisputable potential, researchers have been reluctant to use intravenous injection of exogenous BDNF due to its BBB impermeability, short half-life in the systemic circulation and the risks involved with repeated injections. Therefore, no recommended clinical dosage levels for systemic administration are available. Several groups have attempted to use alternative methods to deliver BDNF, including carboxy-directed pegylation and chimeric peptide technology (Sakane and Pardridge, 1997) of the compound for greater transport across the BBB. Despite the success of such methods, the mode of delivery is non-specific and unsuitable for target-specific interventions within the brain. The combination of focused ultrasound and microbubbles allows for non-invasive and localized opening of the blood-brain barrier that is transient and potentially safe (based on short-term histological assessment (Baseri et al., 2010)). In addition, the FUS method provides greater control over the delivery and time of BBB recovery based on the acoustic pressure and bubble size (Sakane and Pardridge, 1997). Finally, as this study demonstrated, BDNF bioactivity in the targeted brain regions is preserved following FUS-mediated delivery, as indicated by the increased immunoreactivity to the activated BDNF TrkB receptor, and to the activated downstream signaling molecules MAPK and CREB in the hippocampal neurons in the sonicated regions.
Regarding the reversibility of the BBB opening, a recently published report by our group (Samiotaki et al. 2011) have shown the reversibility of the BBB opening using the same parameters as in this study. As far as the large animal or clinical feasibility of transcranial FUS is concerned, we have recently demonstrated BBB opening through the human and monkey skulls, the former in vitro (Deffieux and Konofagou 2010) and the latter both in vitro and in vivo (Tung et al. 2011; Marquet et al. 2011a;2011b). The dependence of the BDNF bioactivity on the acoustic pressure will constitute a topic of future studies.
One limitation of this study is that only three BDNF-injected mice with a circulation time of 20–30 min were used to demonstrate feasibility compared to the three controls in the statistical analysis. The higher costs involved in acquiring BDNF, along with other factors such as experimental uncertainty, required a limited number of mice that could be used as a trade-off for allowing sufficient amounts of the compound to reach the brain to observe significant difference in the outcome. Hence, feasibility was deemed worthwhile given the translational of therapeutic applications with this neurotrophic factor. Another limitation was the different BDNF concentrations that were administered in different mice. As this was a feasibility study, different dosage was used as the amount of BDNF available was limited and a maximum number of mice with the available concentration needed to be secured. However, the circulation time of BDNF was kept the same (20–30 min) across all three mice used compared to the controls. According to the statistical results, more significant cascade effects were shown to be triggered in the sonicated regions compared to the contralateral (control) side in all cases, indicative of the fact that a critical BDNF concentration was reached sufficient of triggering these effects. Also, two additional neurotrophic factors that have been shown premise in treating Parkinson’s disease (both involved in clinical trials), were also tested, namely the glia-derived neurotrophic factor (GDNF) (Fig. 5(i)) and neurturin (NTN) (Fig. 5(ii)) using the same sonication parameters as in the BDNF study but targeting the caudate putamen instead of the hippocampus in two mice as that region is more relevant to Parkinson’s. It is clearly shown that, although all these three proteins are of similar molecular weight and overall consistency, not all neutrotrophic factors will successfully cross the blood-brain barrier after opening with FUS. Neurturin does behave similarly to BDNF permeating through the opened barrier and into the parenchyma (Fig. 5(ii)); however, GDNF does not (Fig. 5(i)). The latter finding was verified in ten mice while the former in two. The noted discrepancy may lie in the fact that there are fewer receptors in the brain for GDNF than for BDNF, i.e., the two proteins on two different transport mechanisms. Also, we found that the GDNF gets broken down in circulation within the first 45 s and upon imaging postmortem no fluorescence was found in the brain (Fig. 5(ii)(b)), kidneys, liver, bladder or testes. Therefore, GDNF was not detectable in the brain parenchyma but was also absent from other organs, pointing to potential differences in the GDNF systemic administration compared to those of BDNF and NTN.
Figure 5.

a) T1-weighted MR image of the entire mouse head verifying BBB opening using gadolinium enhancement and b) Fluorescence image magnified in the region of interest where the highest gadolinium enhancement was detected (white rectangle) in two separate murine brains, one with fluorescently tagged (Alexa Fluor) i) GDNF (Invitrogen, Inc.) and the other with ii) Neurturin (courtesy of Judith P. Golden, Ph.D., Washington University Medical Center and Invitrogen, Inc.) were systemically administered using the same methods as for the BDNF study except for the target being the caudate putamen instead of the hippocampus. No statistical or immunohistochemistry studies were performed in these two cases to determine the downstream effects.
Using MRI-based permeability assessment techniques, it was recently shown that the permeability of the sonicated region increases by at least a 100-fold compared to the contralateral (control) side (Vlachos et al., 2010). Nevertheless, future studies are needed to determine the exact amount of BDNF that diffuses through the BBB via FUS (percentage of administered dose), and ultimately, determine the therapeutic dose of exogenous BDNF in animal models of disease. In addition, despite the fact that increased BDNF expression or supply may lead to effective neuronal regeneration, exogenous BDNF could also have adverse effects such as a pro-epileptic effect (Koyama and Ikegaya, 2005) depending on the underlying propensity. Hence, both the beneficial and harmful effects of exogenous BDNF need to be adequately addressed prior to therapeutic clinical applications.
5. Conclusion
Neurotrophic delivery to the brain has been proven essential in reversing the neuronal degeneration process but so far has been hindered by the blood-brain barrier. In this study, not only was it shown that the brain-derived neurotrophic factor (BDNF) can cross the ultrasound-induced blood-brain barrier opening but that it can also trigger signaling pathways in the pyramidal neurons of mice in vivo from the membrane to the nucleus. As shown with two additional neurotrophic factors, namely GDNF and NTN, these preliminary findings may not necessarily have a universal impact and will depend on the pharmacokinetics and other properties of the molecular uptake of the molecule in the brain. However, the fact that the molecule after permeation through the opened BBB triggered a molecular cascade and entered the neuronal nucleus, indicates for the first time that focused ultrasound in conjunction with microbubbles can generate downstream effects at the cellular and molecular level and thus increase the drug’s efficacy and potency in controlling or reversing disease.
Acknowledgments
Funding for the study was provided in part by NIH R01 EB0009041, NSF CAREER 0644713 and the Kinetics Foundation. The authors are also thankful to Michael Shelanski, PhD of the department of Pathology at Columbia for providing access to sectioning equipment, and Frank Longo, MD, of the department of neurology at Stanford for providing expertise on BDNF handling and staining. The authors also wish to thank Judith P. Golden, Ph.D. at the Washington University Pain Center for providing the neurturin compound used in this study.
References
- Altar CA, Siuciak JA, Wright P, Ip NY, Lindsay RM, Wiegand SJ. In situ hybridization of trkB and trkC receptor mRNA in rat forebrain and association with high-affinity binding of [125I]BDNF, [125I]NT-4/5 and [125I]NT-3. Eur J Neurosci. 1994;6:1389–1405. doi: 10.1111/j.1460-9568.1994.tb01001.x. [DOI] [PubMed] [Google Scholar]
- Baseri B, Choi JJ, Tung YS, Konofagou EE. Multi-Modality Safety Assessment of Blood-Brain Barrier Opening Using Focused Ultrasound and Definity Microbubbles: A Short-Term Study. Ultrasound Med Biol. 2010;36:1445–1459. doi: 10.1016/j.ultrasmedbio.2010.06.005. [DOI] [PMC free article] [PubMed] [Google Scholar]
- Benisty S, Boissiere F, Faucheux B, Agid Y, Hirsch EC. trkB messenger RNA expression in normal human brain and in the substantia nigra of parkinsonian patients: an in situ hybridization study. Neuroscience. 1998;86:813–826. doi: 10.1016/s0306-4522(98)00126-2. [DOI] [PubMed] [Google Scholar]
- Bobo RH, Laske DW, Akbasak A, Morrison PF, Dedrick RL, Oldfield EH. Convection-enhanced delivery of macromolecules in the brain. Proc Natl Acad Sci U S A. 1994;91:2076–2080. doi: 10.1073/pnas.91.6.2076. [DOI] [PMC free article] [PubMed] [Google Scholar]
- Boulanger LM, Poo MM. Presynaptic depolarization facilitates neurotrophin-induced synaptic potentiation. Nat Neurosci. 1999;2:346–351. doi: 10.1038/7258. [DOI] [PubMed] [Google Scholar]
- Choi JJ, Pernot M, Brown TR, Small SA, Konofagou EE. Spatio-temporal analysis of molecular delivery through the blood-brain barrier using focused ultrasound. Phys Med Biol. 2007a;52:5509–5530. doi: 10.1088/0031-9155/52/18/004. [DOI] [PubMed] [Google Scholar]
- Choi JJ, Pernot M, Small SA, Konofagou EE. Noninvasive, transcranial and localized opening of the blood-brain barrier using focused ultrasound in mice. Ultrasound Med Biol. 2007b;33:95–104. doi: 10.1016/j.ultrasmedbio.2006.07.018. [DOI] [PubMed] [Google Scholar]
- Choi JJ, Feshitan JA, Baseri B, Wang S, Tung YS, Borden MA, Konofagou EE. Microbubble-size dependence of focused ultrasound-induced blood-brain barrier opening in mice in vivo. IEEE Trans Biomed Eng. 2010a;57:145–154. doi: 10.1109/TBME.2009.2034533. [DOI] [PMC free article] [PubMed] [Google Scholar]
- Choi JJ, Wang S, Tung YS, Morrison B, 3rd, Konofagou EE. Molecules of various pharmacologically-relevant sizes can cross the ultrasound-induced blood-brain barrier opening in vivo. Ultrasound Med Biol. 2010b;36:58–67. doi: 10.1016/j.ultrasmedbio.2009.08.006. [DOI] [PMC free article] [PubMed] [Google Scholar]
- Ciammola A, Sassone J, Cannella M, Calza S, Poletti B, Frati L, Squitieri F, Silani V. Low brain-derived neurotrophic factor (BDNF) levels in serum of Huntington’s disease patients. Am J Med Genet B Neuropsychiatr Genet. 2007;144B:574–577. doi: 10.1002/ajmg.b.30501. [DOI] [PubMed] [Google Scholar]
- Connor B, Young D, Yan Q, Faull RL, Synek B, Dragunow M. Brain-derived neurotrophic factor is reduced in Alzheimer’s disease. Brain Res Mol Brain Res. 1997;49:71–81. doi: 10.1016/s0169-328x(97)00125-3. [DOI] [PubMed] [Google Scholar]
- Deffieux T, Konofagou EE. Numerical study and experimental validation of a simple transcranial focused ultrasound system applied to Blood-Brain Barrier Opening. IEEE-UFFC Trans. 2010;57(12):2637–53. doi: 10.1109/TUFFC.2010.1738. [DOI] [PMC free article] [PubMed] [Google Scholar]
- Eisch AJ, Bolanos CA, de Wit J, Simonak RD, Pudiak CM, Barrot M, Verhaagen J, Nestler EJ. Brain-derived neurotrophic factor in the ventral midbrain-nucleus accumbens pathway: a role in depression. Biol Psychiatry. 2003;54:994–1005. doi: 10.1016/j.biopsych.2003.08.003. [DOI] [PubMed] [Google Scholar]
- Hagg T. Neurotrophins prevent death and differentially affect tyrosine hydroxylase of adult rat nigrostriatal neurons in vivo. Exp Neurol. 1998;149:183–192. doi: 10.1006/exnr.1997.6684. [DOI] [PubMed] [Google Scholar]
- Hofer M, Pagliusi SR, Hohn A, Leibrock J, Barde YA. Regional distribution of brain-derived neurotrophic factor mRNA in the adult mouse brain. EMBO J. 1990;9:2459–2464. doi: 10.1002/j.1460-2075.1990.tb07423.x. [DOI] [PMC free article] [PubMed] [Google Scholar]
- Howells DW, Porritt MJ, Wong JY, Batchelor PE, Kalnins R, Hughes AJ, Donnan GA. Reduced BDNF mRNA expression in the Parkinson’s disease substantia nigra. Exp Neurol. 2000;166:127–135. doi: 10.1006/exnr.2000.7483. [DOI] [PubMed] [Google Scholar]
- Huang EJ, Reichardt LF. Neurotrophins: roles in neuronal development and function. Annu Rev Neurosci. 2001;24:677–736. doi: 10.1146/annurev.neuro.24.1.677. [DOI] [PMC free article] [PubMed] [Google Scholar]
- Hynynen K, McDannold N, Vykhodtseva N, Jolesz FA. Noninvasive MR imaging-guided focal opening of the blood-brain barrier in rabbits. Radiology. 2001;220:640–646. doi: 10.1148/radiol.2202001804. [DOI] [PubMed] [Google Scholar]
- Jordao JF, Ayala-Grosso CA, Markham K, Huang Y, Chopra R, McLaurin J, Hynynen K, Aubert I. Antibodies targeted to the brain with image-guided focused ultrasound reduces amyloid-beta plaque load in the TgCRND8 mouse model of Alzheimer’s disease. PLoS ONE. 2010;5:e10549. doi: 10.1371/journal.pone.0010549. [DOI] [PMC free article] [PubMed] [Google Scholar]
- Kinoshita M, McDannold N, Jolesz FA, Hynynen K. Noninvasive localized delivery of Herceptin to the mouse brain by MRI-guided focused ultrasound-induced blood-brain barrier disruption. Proc Natl Acad Sci U S A. 2006a;103:11719–11723. doi: 10.1073/pnas.0604318103. [DOI] [PMC free article] [PubMed] [Google Scholar]
- Kinoshita M, McDannold N, Jolesz FA, Hynynen K. Targeted delivery of antibodies through the blood-brain barrier by MRI-guided focused ultrasound. Biochem Biophys Res Commun. 2006b;340:1085–1090. doi: 10.1016/j.bbrc.2005.12.112. [DOI] [PubMed] [Google Scholar]
- Koyama R, Ikegaya Y. To BDNF or not to BDNF: that is the epileptic hippocampus. Neuroscientist. 2005;11:282–287. doi: 10.1177/1073858405278266. [DOI] [PubMed] [Google Scholar]
- Kroll RA, Neuwelt EA. Outwitting the blood-brain barrier for therapeutic purposes: osmotic opening and other means. Neurosurgery. 1998;42:1083–1099. doi: 10.1097/00006123-199805000-00082. discussion 1099–1100. [DOI] [PubMed] [Google Scholar]
- Lee J, Fukumoto H, Orne J, Klucken J, Raju S, Vanderburg CR, Irizarry MC, Hyman BT, Ingelsson M. Decreased levels of BDNF protein in Alzheimer temporal cortex are independent of BDNF polymorphisms. Exp Neurol. 2005;194:91–96. doi: 10.1016/j.expneurol.2005.01.026. [DOI] [PubMed] [Google Scholar]
- Liu HL, Wai YY, Chen WS, Chen JC, Hsu PH, Wu XY, Huang WC, Yen TC, Wang JJ. Hemorrhage detection during focused-ultrasound induced blood-brain-barrier opening by using susceptibility-weighted magnetic resonance imaging. Ultrasound Med Biol. 2008;34:598–606. doi: 10.1016/j.ultrasmedbio.2008.01.011. [DOI] [PubMed] [Google Scholar]
- Lonze BE, Ginty DD. Function and regulation of CREB family transcription factors in the nervous system. Neuron. 2002;35:605–623. doi: 10.1016/s0896-6273(02)00828-0. [DOI] [PubMed] [Google Scholar]
- Marquet F, Tung Y-S, Teichert T, Ferrera V, Konofagou EE. Noninvasive, transient and selective blood-brain barrier opening in non-human primates in vivo. PLoS One. 2011a;6(7):e225982011. doi: 10.1371/journal.pone.0022598. [DOI] [PMC free article] [PubMed] [Google Scholar]
- Marquet F, Tung Y-S, Konofagou EE. Feasibility Study Of A Clinical Blood-Brain Opening Ultrasound System. Nano Life journal. 2011b doi: 10.1142/S1793984410000286. in press. [DOI] [PMC free article] [PubMed] [Google Scholar]
- Martinowich K, Manji H, Lu B. New insights into BDNF function in depression and anxiety. Nat Neurosci. 2007;10:1089–1093. doi: 10.1038/nn1971. [DOI] [PubMed] [Google Scholar]
- McDannold N, Vykhodtseva N, Raymond S, Jolesz FA, Hynynen K. MRI-guided targeted blood-brain barrier disruption with focused ultrasound: histological findings in rabbits. Ultrasound Med Biol. 2005;31:1527–1537. doi: 10.1016/j.ultrasmedbio.2005.07.010. [DOI] [PubMed] [Google Scholar]
- Nagahara AH, Merrill DA, Coppola G, Tsukada S, Schroeder BE, Shaked GM, Wang L, Blesch A, Kim A, Conner JM, et al. Neuroprotective effects of brain-derived neurotrophic factor in rodent and primate models of Alzheimer’s disease. Nat Med. 2009;15:331–337. doi: 10.1038/nm.1912. [DOI] [PMC free article] [PubMed] [Google Scholar]
- Pardridge WM. The blood-brain barrier: bottleneck in brain drug development. NeuroRx. 2005;2:3–14. doi: 10.1602/neurorx.2.1.3. [DOI] [PMC free article] [PubMed] [Google Scholar]
- Raymond SB, Treat LH, Dewey JD, McDannold NJ, Hynynen K, Bacskai BJ. Ultrasound enhanced delivery of molecular imaging and therapeutic agents in Alzheimer’s disease mouse models. PLoS ONE. 2008;3:e2175. doi: 10.1371/journal.pone.0002175. [DOI] [PMC free article] [PubMed] [Google Scholar]
- Sakane T, Pardridge WM. Carboxyl-directed pegylation of brain-derived neurotrophic factor markedly reduces systemic clearance with minimal loss of biologic activity. Pharm Res. 1997;14:1085–1091. doi: 10.1023/a:1012117815460. [DOI] [PubMed] [Google Scholar]
- Samiotaki M, Vlachos F, Tung Y-S, Feshitan J, Borden M, Konofagou EE. A Quantitative Pressure and Microbubble-Size Dependence Study of Focused Ultrasound-Induced Blood-Brain Barrier Opening Reversibility In Vivo Using MRI. Magn Reson Med. 2011 Aug 19; doi: 10.1002/mrm.23063. [Epub ahead of print] [DOI] [PMC free article] [PubMed] [Google Scholar]
- Sheikov N, McDannold N, Sharma S, Hynynen K. Effect of focused ultrasound applied with an ultrasound contrast agent on the tight junctional integrity of the brain microvascular endothelium. Ultrasound Med Biol. 2008;34:1093–1104. doi: 10.1016/j.ultrasmedbio.2007.12.015. [DOI] [PMC free article] [PubMed] [Google Scholar]
- Shirayama Y, Chen AC, Nakagawa S, Russell DS, Duman RS. Brain-derived neurotrophic factor produces antidepressant effects in behavioral models of depression. J Neurosci. 2002;22:3251–3261. doi: 10.1523/JNEUROSCI.22-08-03251.2002. [DOI] [PMC free article] [PubMed] [Google Scholar]
- Simmons DA, Rex CS, Palmer L, Pandyarajan V, Fedulov V, Gall CM, Lynch G. Up-regulating BDNF with an ampakine rescues synaptic plasticity and memory in Huntington’s disease knockin mice. Proc Natl Acad Sci U S A. 2009;106:4906–4911. doi: 10.1073/pnas.0811228106. [DOI] [PMC free article] [PubMed] [Google Scholar]
- Treat LH, McDannold N, Vykhodtseva N, Zhang Y, Tam K, Hynynen K. Targeted delivery of doxorubicin to the rat brain at therapeutic levels using MRI-guided focused ultrasound. Int J Cancer. 2007;121:901–907. doi: 10.1002/ijc.22732. [DOI] [PubMed] [Google Scholar]
- Tung Y, Marquet M, Teichert T, Ferrera V, Konofagou EE. Feasibility of noninvasive cavitation-guided blood-brain barrier opening using focused ultrasound and microbubbles in nonhuman primates. Applied Physics Letters. 2011;98:163704. doi: 10.1063/1.3580763. [DOI] [PMC free article] [PubMed] [Google Scholar]
- Vlachos F, Tung YS, Konofagou EE. Permeability assessment of the focused ultrasound-induced blood-brain barrier opening using dynamic contrast-enhanced MRI. Phys Med Biol. 2010;55:5451–5466. doi: 10.1088/0031-9155/55/18/012. [DOI] [PMC free article] [PubMed] [Google Scholar]
- Waterhouse EG, Xu B. New insights into the role of brain-derived neurotrophic factor in synaptic plasticity. Mol Cell Neurosci. 2009;42:81–89. doi: 10.1016/j.mcn.2009.06.009. [DOI] [PMC free article] [PubMed] [Google Scholar]
- Weaver M, Laske DW. Transferrin receptor ligand-targeted toxin conjugate (Tf-CRM107) for therapy of malignant gliomas. J Neurooncol. 2003;65:3–13. doi: 10.1023/a:1026246500788. [DOI] [PubMed] [Google Scholar]
- Yan Q, Rosenfeld RD, Matheson CR, Hawkins N, Lopez OT, Bennett L, Welcher AA. Expression of brain-derived neurotrophic factor protein in the adult rat central nervous system. Neuroscience. 1997;78:431–448. doi: 10.1016/s0306-4522(96)00613-6. [DOI] [PubMed] [Google Scholar]