Abstract
Under conditions of high dietary salt intake, prostaglandin E2 (PGE2) production is increased in the collecting duct and promotes urinary sodium chloride (NaCl) excretion; however, the molecular mechanisms by which PGE2 increases NaCl excretion in this context have not been clearly defined. We used the mouse inner medullary collecting duct (mIMCD)-K2 cell line to characterize mechanisms underlying PGE2-regulated NaCl transport. When epithelial Na+ channels were inhibited, PGE2 exclusively stimulated basolateral EP4 receptors to increase short-circuit current (IscPGE2). We found that IscPGE2 was sensitive to inhibition by H-89 and CFTR-172, indicating that EP4 receptors signal through protein kinase A to induce Cl− secretion via cystic fibrosis transmembrane conductance regulator (CFTR). Unexpectedly, we also found that IscPGE2 was sensitive to inhibition by BAPTA-AM (Ca2+ chelator), 2-aminoethoxydiphenyl borate (2-APB) (inositol triphosphate receptor blocker), and flufenamic acid (FFA) [Ca2+-activated Cl− channel (CACC) inhibitor], suggesting that EP4 receptors also signal through Ca2+ to induce Cl− secretion via CACC. Additionally, we observed that PGE2 stimulated an increase in Isc through crosstalk between cAMP and Ca2+ signaling; BAPTA-AM or 2-APB inhibited a component of IscPGE2 that was sensitive to CFTR-172 inhibition; H-89 inhibited a component of IscPGE2 that was sensitive to FFA inhibition. Together, our findings indicate that PGE2 activates basolateral EP4 receptors and signals through both cAMP and Ca2+ to stimulate Cl− secretion in IMCD-K2 cells. We propose that these signaling pathways, and the crosstalk between them, may provide a concerted mechanism for enhancing urinary NaCl excretion under conditions of high dietary NaCl intake.
Keywords: prostaglandin E2, EP4 receptor, collecting duct, cystic fibrosis transmembrane conductance regulator, Ca2+-activated Cl− channel
the collecting duct of the kidney maintains total body sodium chloride (NaCl) balance by fine-tuning urinary NaCl excretion in response to changes in dietary salt intake. Local changes in the hormonal milieu of the collecting duct play a critical role in this response mechanism. For example, high salt feeding of mice induces renal medullary production of prostaglandin E2 (PGE2) (12, 14, 23), which could operate as a paracrine hormone to promote urinary NaCl excretion. Targeted deletion of microsomal prostaglandin E synthase (mPGES-1) in mice disrupts renal PGE2 production and induces salt-sensitive hypertension, indicating that PGE2 signaling contributes to NaCl balance and blood pressure regulation (13, 29).
The molecular mechanisms through which PGE2 increases urinary NaCl excretion, in the context of high dietary salt intake, have not been completely defined. PGE2 activates four subtypes of prostanoid receptors: EP1, EP2, EP3, and EP4 (9). EP2 and EP4 receptors are classic Gαs-coupled receptors, which increase intracellular cyclic AMP (cAMP) concentration, whereas EP1 receptors are Gq-coupled receptors, which increase intracellular calcium (Ca2+) concentration through an inositol triphosphate (IP3)-dependent pathway (9, 28). EP3 receptors have multiple splice variants, which, depending on the interacting G protein, activate either Gαs, Gi, or Gq proteins (9).
PGE2 can stimulate various prostanoid receptors to increase Cl− secretion in the collecting duct (12, 16, 57, 68). The physiological significance of Cl− secretion in the collecting duct may be most important under salt-loading conditions when extracellular fluid volume expansion leads to low levels of plasma aldosterone concentration and, as a consequence, diminished Na+ reabsorption through the epithelial sodium channel (ENaC) (32, 40, 41, 43, 56). Under these circumstances, paracrine hormones, such as ATP, adenosine, and possibly PGE2, are synthesized and released by kidney epithelial cells and stimulate respective signaling pathways that promote Cl− secretion (12, 50, 60). Notably, the initial segment of the inner medullary collecting duct (IMCD) is the only nephron segment that has been shown to secrete Cl− under salt-loading conditions (22, 62, 69).
We used the mIMCD-K2 cell line as a model system to study the direct effects of PGE2 on NaCl transport across IMCD epithelia under conditions of diminished ENaC activity. The mIMCD-K2 cell line was derived from the initial segment of the IMCD and retains characteristic signaling and ion transport pathways of the IMCD (6, 7, 33, 66). We demonstrate here that PGE2 activates basolateral EP4 receptors to increase Cl− secretion through cystic fibrosis transmembrane conductance regulator (CFTR). Although EP4 receptors are linked to Gαs and cAMP signaling, we found that EP4 receptor activation also leads to stimulation of Cl− secretion through calcium-activated Cl− channels (CACC). Moreover, we found that PGE2-stimulated Cl− secretion involves crosstalk between cAMP and Ca2+-signaling pathways, in which CFTR-mediated short-circuit current (Isc) is sensitive to inhibition by BAPTA-AM (Ca2+ chelator) and 2-aminoethoxydiphenyl borate (2-APB) (IP3 receptor blocker) and CACC-mediated Isc is sensitive to inhibition by H-89 [protein kinase A (PKA) inhibitor]. These findings indicate that PGE2 acts through a cAMP and Ca2+-signaling network to stimulate Cl− secretion in IMCD cells, which may serve as an adaptive response to enhance urinary NaCl excretion under conditions of high dietary NaCl intake.
MATERIALS AND METHODS
Cell culture.
The mIMCD-K2 cell line was kindly provided by Dr. Bruce Stanton (Dartmouth Medical School, Hanover, NH). Cells of passages 38–46 were expanded and plated on polycarbonate Snapwell inserts (surface area of 1.12 cm2, Corning Costar, Corning, NY), as described previously (55). Transepithelial voltage (Vte) and resistance (Rte) were measured with an epithelial voltohmmeter “chopstick” voltmeter (World Precision Instruments, Sarasota, FL). Cells were grown in defined medium until Rte reached values greater than 800 Ω/cm2.
Ussing chamber measurements.
Cell sheets were mounted between the Lucite half chambers of the Ussing chamber apparatus (Physiologic Instruments, San Diego, CA) for electrophysiological studies, as described previously (52, 55). Cell sheets were bathed in Krebs-Henseleit solution (in mM: 140 NaCl, 25 NaHCO3, 5 KCl, 5 glucose, 2 CaCl2, and 1 MgCl2) and gassed with a mixture of 95% O2 and 5% CO2. In ion-substitution experiments, Cl− in the Krebs-Henseleit was replaced with glutamate and sulfate, and HCO3− was replaced with HEPES to identify the ions responsible for PGE2-stimulated Isc (IscPGE2). Vte across cell sheets was clamped to 0 mV, and a set voltage pulse of 1 mV was applied across cell sheets for 200 ms every 20 s. The Isc and Rte across cell sheets were continuously recorded using Acquire and Analyze Software (Physiologic Instruments). Electrophysiological responses were characterized in cells from at least three different passages to account for interpassage variability.
Pharmacological agents.
Once Isc and Rte across cell sheets stabilized in the Ussing chamber, typically within 2–4 min of mounting, a series of pharmacological agents was added to cell sheets. In these experiments, no washout step was included in between addition of each agent. The apical side of all cell sheets was treated with the ENaC inhibitor amiloride (10−5 M; Sigma, St. Louis, MO). PGE2 (7.7 × 10⁻⁸ M) was then added sequentially to the apical and basal sides of cell sheets or vice versa. In some experiments, the EP1/EP3 receptor agonist sulprostone (10−6 M; Tocris Bioscience, Bristol, UK), the EP2 receptor agonist butaprost (10−5 M, Sigma), or the EP4 agonist TCS2510 (10−6 M, Tocris Bioscience) was added to the apical or basal side of cell sheets. In other experiments, the EP1/EP2 receptor antagonist AH-6809 (10−6 M; Cayman Chemicals, Ann Arbor, MI), the EP1/EP3 receptor antagonist ONO-8713 (10−6 M, Cayman Chemicals), or the EP4 receptor antagonist L-161,982 (10−6 M, Tocris Bioscience) was added to cell sheets before PGE2 stimulation. Bromocresol green (3 × 10⁻⁵ M, Sigma) was used as a prostaglandin transport inhibitor to confirm transport of PGE2 across cell sheets.
To identify the classes of ion channels or transporters that respond to EP4 receptor activation, several small molecule inhibitors were used. CFTR inhibitor-172 (CFTR-172, 10−5 M, Tocris Bioscience) or flufenamic acid (FFA, 2 × 10⁻⁴ M, Sigma) was added to the apical side of cell sheets to block CFTR (39) or CACC (19, 71), respectively. Bumetanide (2 × 10⁻⁴ M, Sigma), diisothiocyanostilbene-2,2'-disulfonic acid (DIDS) (10−4 M, Sigma), or acetazolamide (2 × 10⁻⁴ M, Sigma) was added to the basal side of cell sheets to inhibit Na+/K+/2 Cl− cotransporters or carbonic anhydrase, respectively.
To determine whether PGE2-stimulated Isc (IscPGE2) was dependent on PKA, phospholipase C, PI3-kinase, or protein kinase C, the following respective compounds were added to cell sheets: H-89 (10−5 M, Sigma), U73122 (10−6 M, Tocris Bioscience), LY294002 (2.5 × 10⁻⁵ M, Sigma), or Go6983 (2 × 10⁻⁵ M, Tocris Bioscience). To determine whether IscPGE2 was dependent on intracellular Ca2+ or IP3 receptor activation on IscPGE2, the cell-permeable Ca2+ chelator BAPTA-AM (5 × 10⁻⁵ M, Tocris Bioscience) or the IP3 receptor blocker 2-APB (10−4 M, Tocris Bioscience) was added to both sides of cell sheets, respectively.
To characterize involvement of cAMP in stimulating FFA-sensitive Isc, forskolin (10−5 M, Tocris Bioscience) was added to the apical side of cell sheets before the addition of either CFTR-172 or FFA. In other experiments, BAPTA-AM was added to forskolin-stimulated cell sheets to probe the role of intracellular Ca2+ in regulating CFTR-mediated Isc.
Reverse transcriptase-PCR.
mIMCD-K2 cells were grown to resistance on permeable supports, and total RNA was harvested using the RNeasy Mini Kit (Qiagen, Valencia, CA) according to manufacturer instructions. Total RNA from mouse kidney was obtained from Zyagen (San Diego, CA) to serve as positive control. Reverse transcriptase (RT) reactions were performed according to manufacturer instructions (New England BioLaboratories, Ipswich, MA). Thermal cycling parameters were the following: incubation at 98°C for 30 s followed by 35 cycles at 98°C for 10 s, 58°C for 10 s, 72°C for 50 s, and then a final extension at 72°C for 5 min. PCR primers were designed and used for detecting gene amplification of EP1, EP2, EP3, and EP4 receptors. The sequences were as follows: mouse EP1 Forward: 5′-AGCCTGCTTGCCATCGACCTA-3′, mouse EP1 Reverse: 5′-GCCAGGGTACTGTAACTCGTAGCGAC-3′; mouse EP2 Forward: 5′-AGGACTTCGATGGCAGAGGAGACGGACCACCTCATTCTCC-3′, mouse EP2 Reverse: 5′-CAGCCCCTTACACTTCTCCAATGAGGCCATTTAAAGACTT-3′; mouse EP3 Forward: 5′-CCAGCCACATGAAGACTCGCG-3′, mouse EP3 Reverse: 5′-TCATTATCAATAGCGGCGACCAA-3′; mouse EP4 Forward: 5′-CCATCGTAGTATTGTGCAAGTCGCG-3′, mouse EP4 Reverse: 5′-AAGGAGCTGAAGCCGGCGTAC-3′. Specificity of each set of primers was confirmed by BLAST search against GenBank and by direct sequencing of PCR products. PCR products were resolved using a 1% agarose gel dissolved Tris-Acetate EDTA buffer and visualized with ethidium bromide.
Statistics.
Statistical analyses for comparisons between different treatment groups of mIMCD-K2 cells were performed using paired or unpaired two-tailed Student's t-tests. Differences were considered significant at P < 0.05.
RESULTS
PGE2 activates basolateral EP4 receptors to induce Cl− secretion.
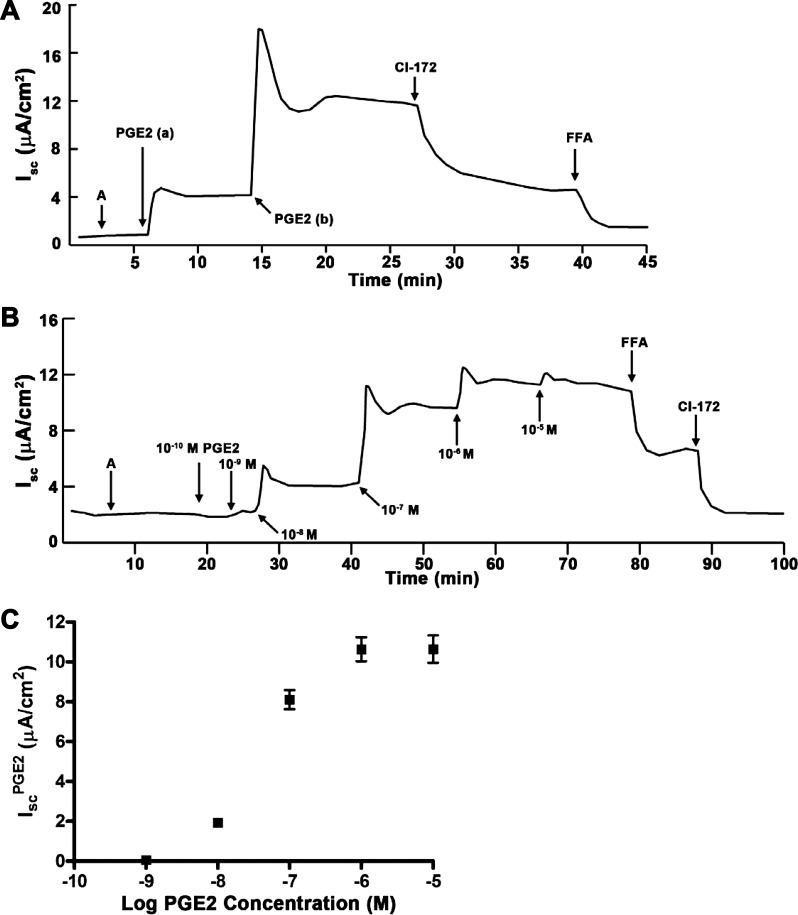
Amiloride was first added to the apical side of mIMCD-K2 cells to study the effects of PGE2 on Cl− transport in the absence of ENaC activity. The addition of amiloride induced no significant changes to Isc; we next added PGE2 (7.7 × 10⁻⁸ M PGE2) to either side of mIMCD-K2 cells and examined the Isc response. We chose a concentration of 7.7 × 10⁻⁸ M for PGE2 because this concentration has previously been used in IMCD cells to stimulate cAMP signaling (16, 38). Addition of PGE2 to either side of cell sheets induced an initial transient followed by a sustained increase in Isc (Fig. 1A).
Fig. 1.
Effects of extracellular prostaglandin E2 (PGE2) on short-circuit current (Isc) in mouse inner medullary collecting duct (mIMCD)-K2 cells. A: representative trace shows the effect of apical and basal addition of PGE2 on Isc. A indicates amiloride (10−5 M) added to the apical bath. PGE2 (7.7 × 10⁻⁸ M) was added to the apical (a) and basal (b) side. Additions of cystic fibrosis transmembrane conductance regulator (CFTR) inhibitor-172 (CI-172) (10−5 M) and of flufenamic acid (FFA) (2 × 10⁻⁴ M) to the apical side are shown. B: representative Isc trace indicates the cumulative dose response to basal addition of PGE2. Increasing concentrations of PGE2 were added to the basal side, as indicated. C: cumulative dose-response curve derived from average sustained Isc increases (IscPGE2) after basal PGE2 addition. Values are means ± SE (n = 12 filters).
We next generated a cumulative dose-response curve of the Isc response to basal addition of PGE2. We found that 10−8 M was the smallest dose of PGE2 that increased Isc. Sequential addition of 10−7 M and 10−6 M of PGE2 progressively increased Isc; addition of higher concentrations of PGE2, however, did not further increase Isc (Fig. 1B). We measured the sustained increase in IscPGE2 and plotted these values against the logarithm of PGE2 concentration (Fig. 1C). The EC50 of the PGE2 Isc response was 3.1 ± 0.2 × 10⁻⁸ M.
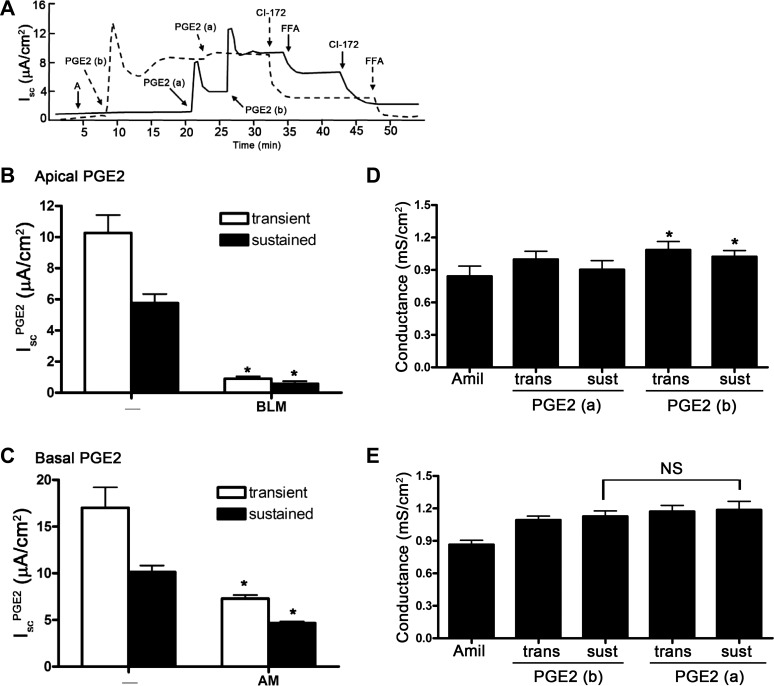
We observed that PGE2 induced a different Isc response depending on which side PGE2 is added. Addition of PGE2 to the basal side elicited a maximal IscPGE2 response, so addition of PGE2 to the apical side did not further stimulate Isc (Fig. 2A, dashed line; Fig. 2B). On the other hand, addition of PGE2 to the apical side elicited a partial IscPGE2 response, which could be further enhanced with addition of PGE2 to the basal side (Fig. 2A, solid line; Fig. 2C). We also found that addition of PGE2 to either side of cells increased transepithelial conductance, a response that closely mirrored the increases in Isc (Fig. 2, D and E). These findings suggest that a class of prostanoid receptors is preferentially localized to the basal side of mIMCD-K2 cells to initiate the IscPGE2 response.
Fig. 2.
Sidedness of PGE2-induced Isc in mIMCD-K2 cells. A: dashed trace demonstrates the Isc response to sequential addition of PGE2 to the basal (b) bath and then to the apical bath (a); solid trace demonstrates the Isc response to sequential addition of PGE2 to the apical bath and then to the basal bath. Additions of CI-172 (10−5 M) and FFA (2 × 10⁻⁴ M) to the apical side are shown. B: average transient (open bars) and sustained (solid bars) Isc responses to addition of PGE2 to the apical bath (IscPGE2). On the x-axis, “-” indicates absence of preexposure to PGE2; BLM indicates preexposure to basolateral PGE2. *Value significantly different from that induced by sequential addition of PGE2 in the reverse order. C: average transient (open bars) and sustained (solid bars) Isc responses to addition of PGE2 to the basal bath (IscPGE2). On the x-axis, AM indicates preexposure to apical PGE2. Values are represented as means ± SE (n = 16–18 filters). *Value significantly different from that induced by sequential addition of PGE2 in the reverse order. D: average conductance across mIMCD-K2 cell sheets after sequential addition of amiloride (Amil) and PGE2 to the apical and basal sides. Conductances in mS/cm2 were measured at the peak of transient (trans) and sustained (sust) Isc responses after addition of PGE2 (7.7 × 10⁻⁸ M). Values are means ± SE (n = 11). *Value significantly different from addition of PGE2 to the apical side. Conductance values were also significantly different between cells receiving amiloride vs. amiloride and apical PGE2. E: average conductance across mIMCD-K2 cell sheets after sequential addition of amiloride and PGE2 to the basal and apical sides. Conductances in mS/cm2 were measured at the peak of transient and sustained Isc responses after addition of PGE2 (7.7 × 10⁻⁸ M). Values are means ± SE (n = 11). Conductance after apical addition of PGE2 was not significantly different from that after basal addition (NS).
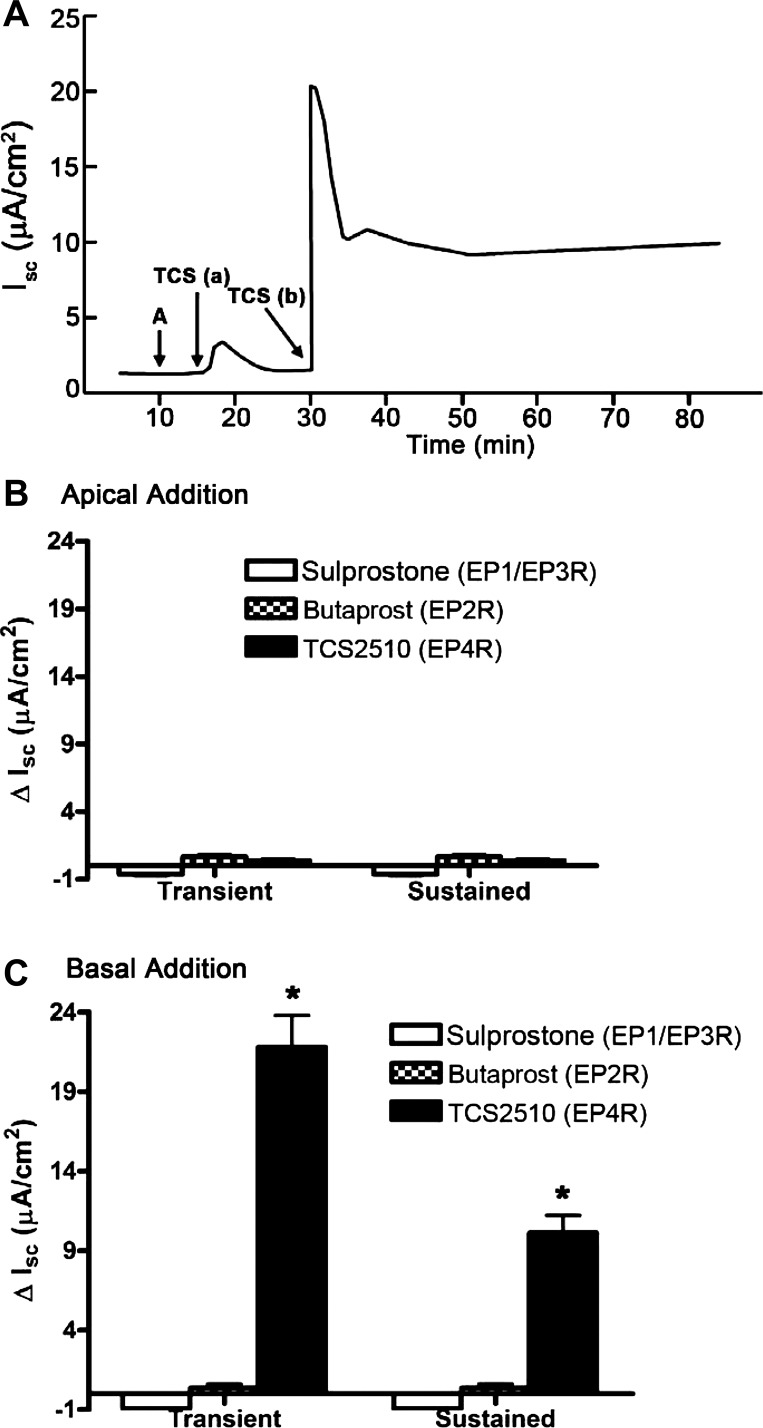
To identify which class of prostanoid receptors is responsible for IscPGE2, we stimulated mIMCD-K2 cells with a series of EP receptor agonists and examined the Isc response. Apical addition of the EP4 agonist TCS-2510 (10−6 M) induced no change in Isc (Fig. 3, A and B), whereas basal addition of TCS-2510 (10−6 M) induced an increase in Isc (Fig. 3, A and C), which closely mirrored and accounted for IscPGE2. Addition of EP1/EP3 receptor agonist sulprostone (10−6 M) and the EP2 receptor agonist butaprost (10−5 M) to either side of cell sheets induced no change in Isc (Fig. 3, B and C).
Fig. 3.
Effects of EP receptor agonists on Isc in mIMCD-K2 cells. A: representative Isc trace shows the effect of EP4 receptor agonist TCS2510 (10−6 M) (TCS) on Isc on the apical and basal sides. A indicates the addition of amiloride (10−5 M) B: average transient and sustained Isc responses to apical addition of EP receptor agonists sulprostrone (EP1R/EP3R), butaprost (EP2R), and TCS2510 (EP4R). C: average transient and sustained Isc responses to basal addition of EP receptor agonists. Values are represented as means ± SE (n = 6–12 filters). *Value significantly different from that induced by other EP receptor agonists.
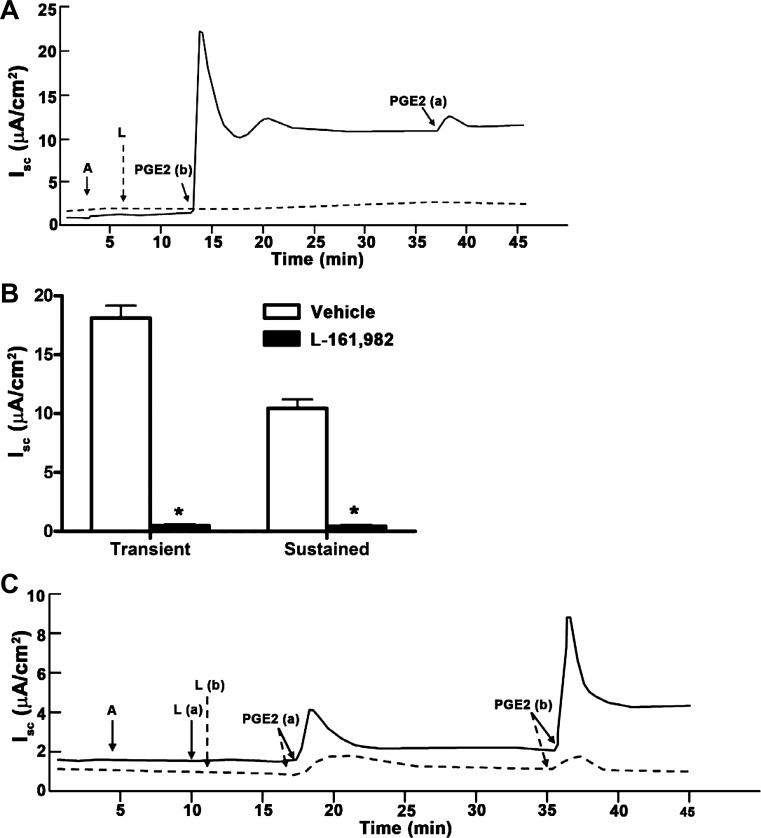
As a complementary approach for identifying the EP receptors responsible for IscPGE2, we also pretreated mIMCD-K2 cells with a panel of EP receptor antagonists and then induced with PGE2. Addition of maximal doses of the nonselective EP1/EP2 receptor antagonist AH-6809 (10−6 M) or the EP1/EP3 receptor antagonist ONO-8713 (10−6 M) to both sides of cells induced no attenuation of IscPGE2 (data not shown). On the other hand, pretreatment of cells with the specific EP4 receptor antagonist L-161,982 (10−7 M, added to both sides of cell sheets) completely blocked IscPGE2 (Fig. 4), as well as TCS-2510-stimulated Isc (data not shown), indicating that EP4 receptor activation is responsible for IscPGE2 in mIMCD-K2 cells.
Fig. 4.
Effects of pretreatment of mIMCD-K2 cells with EP receptor antagonists on PGE2-induced Isc in mIMCD-K2 cells. A: representative traces show the Isc response to addition of PGE2 following treatment with the EP4 receptor antagonist L-161,982 (L, 10−6 M) (dashed trace) or vehicle (solid trace). B: average transient and sustained Isc responses to addition of PGE2 (IscPGE2) to cells pretreated with vehicle (open bars) or L-161,982 (solid bars). Values are represented as means ± SE (n = 12 filters). *Value significantly different from that in cells pretreated with vehicle. C: representative traces show the Isc response to addition of PGE2 following treatment with L-161982 (10−7 M) for 10 min on the apical side (solid trace) or basal side (dashed trace).
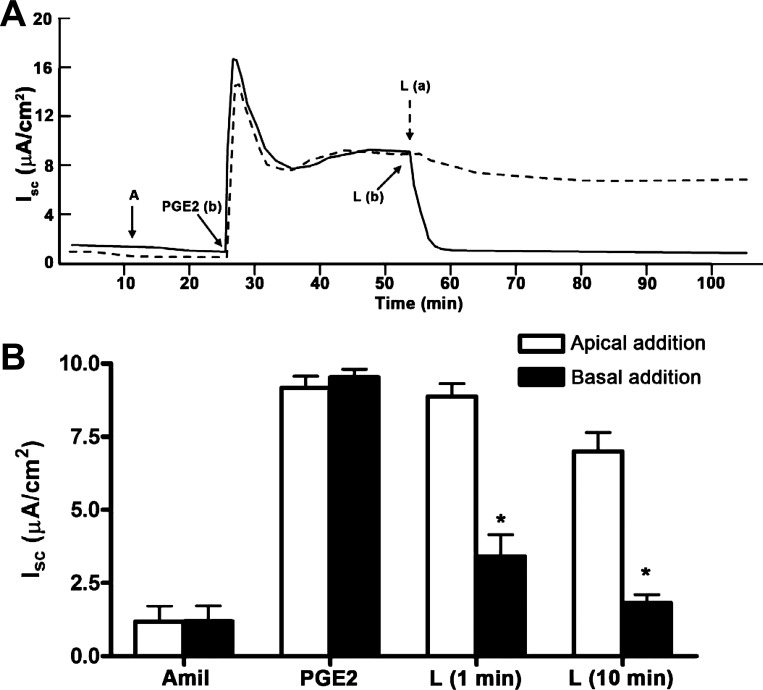
We observed that L-161,982 produced a different inhibitory response depending on which side L-161,982 was added. When L-161,982 (10−7 M) was added to the apical bath before basal addition of PGE2, the Isc response was partly inhibited (Fig. 4C, solid line); in contrast, addition of L-161,982 to the basal bath before addition of PGE2 almost completely inhibited the Isc response (Fig. 4C, dashed line). When L-161,982 was used at a lower concentration and added after PGE2 treatment, the sidedness of the inhibitory response became more apparent. Apical addition of L-161,982 (2.0 × 10⁻⁸ M) to PGE2-stimulated cells did not decrease Isc at 1 min (Fig. 5A, dashed line; Fig. 5B, open bars); basal addition of L-161,982 at the same concentration inhibited Isc (Fig. 5A, solid line; Fig. 5B, solid bars). Moreover, the latency of Isc inhibition was different depending on which side L-161,982 was added. When L-161,982 was added to the apical side of cells, the lag time for inhibition of IscPGE2 was 75 ± 5 s, whereas it was 26.0 ± 2.0 s when L-161,982 was added to the basal side. These findings again suggest that EP4 receptors are localized strictly to the basal membrane.
Fig. 5.
Sidedness of EP4 receptor antagonism on PGE2-induced Isc in mIMCD-K2 cells. A: representative traces show inhibition of IscPGE2 when L-161,982 (2 × 10⁻⁸ M) is added to the apical side (dashed trace) or basal side (solid trace). B: average sustained Isc after sequential addition of basal PGE2, 1 and 10 min after addition of L-161,982 (2 × 10⁻⁸ M). L-161,982 was added to either the apical bath (open bars) or basal bath (solid bars). Values are represented as means ± SE (n = 6 filters). *Values significantly different from that in cells treated with apical L-161,982.
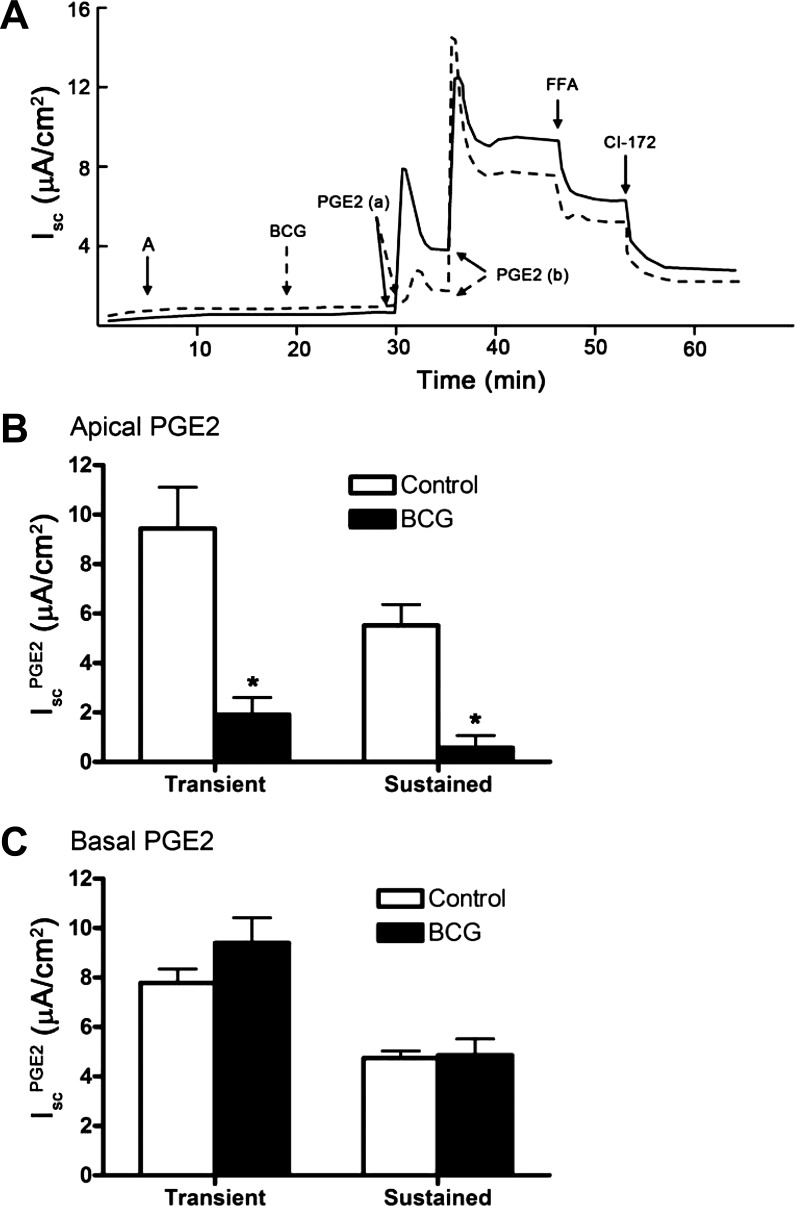
Although we observed a sidedness to the latency period for inhibition of IscPGE2 by L-161,982, we observed no significant difference in sidedness to the latency period for PGE2-stimulated Isc. The lag time for Isc stimulation was 33 ± 4 s and 28 ± 2 s when PGE2 was added to the apical and basal side of cells, respectively. We hypothesized that addition of PGE2 to the apical side increases Isc because it is rapidly transported across mIMCD-K2 cell sheets to stimulate EP4 receptors present in the basolateral membrane. To test this, we incubated mIMCD-K2 cells with bromocresol green (3.0 × 10⁻⁵ M), an inhibitor of the prostaglandin transporter (5, 25, 31, 51), and then added PGE2 to either side of cell sheets. We found that pretreatment of mIMCD-K2 cells with bromocresol green significantly inhibited IscPGE2 when PGE2 was added to the apical [Fig. 6A, dashed line, PGE2(a); Fig. 6B], but not basal, side of cell sheets [Fig. 6A, dashed line, PGE2(b); Fig. 6C]. These findings suggest the following: 1) PGE2 activates EP4 receptors localized to the basolateral membrane; 2) apical addition of PGE2 elicits an Isc response because a prostaglandin transporter transports PGE2 to the basolateral membrane; and 3) unlike PGE2, the EP4 receptor agonist TCS2510 does not appear to be a substrate for the prostaglandin transporter.
Fig. 6.
Effect of PGE2 transporter inhibitor bromocresol green (BCG) on PGE2-induced Isc in mIMCD-K2 cells. A: representative traces show the Isc response to addition of BCG (3 × 10⁻⁵ M) to both sides of mIMCD-K2 cell sheets (dashed line) or vehicle (solid line) on PGE2-induced Isc (IscPGE2). B: average transient and sustained Isc responses to addition of PGE2 to the apical bath of cells pretreated with vehicle (open bars) or BCG (solid bars). *Value significantly different from that in cells pretreated with vehicle. C: average transient and sustained Isc values in response to addition of PGE2 to the basal bath of cells pretreated with vehicle (open bars) or BCG (solid bars). Values are represented as means ± SE (n = 12 filters).
We next used RT-PCR to evaluate EP4 receptor mRNA expression in mIMCD-K2 cells. Mouse kidney cDNA were run in parallel as a positive control. We detected all four classes of EP receptors in mouse kidney homogenates. We also found that EP4 receptors, as well as EP1 and EP2 receptors, are expressed in mIMCD-K2 cells (Fig. 7).
Fig. 7.
Expression of EP1, EP2, EP3, and EP4 receptor mRNA in mouse kidney lysates and mIMCD-K2 cells. Photograph of a gel showing PCR amplification products in mouse kidney tissue and mIMCD-K2 cells after reverse transcription of mouse EP1, EP2, EP3, and EP4 receptor mRNA. Samples containing reverse transcriptase (RT; +) or negative controls lacking reverse transcriptase (−) are included for each tissue/primer combination. M indicates DNA size marker.
PGE2 stimulates Cl− secretion through CFTR and CACC.
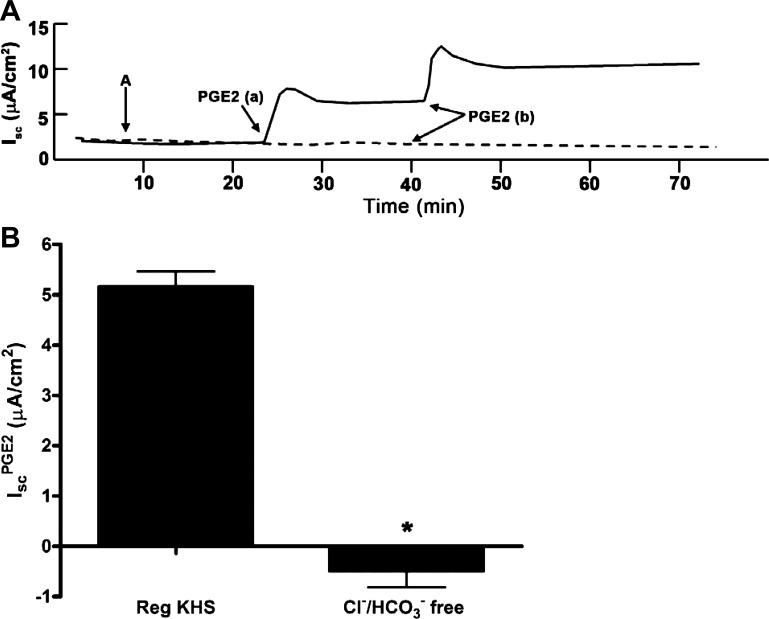
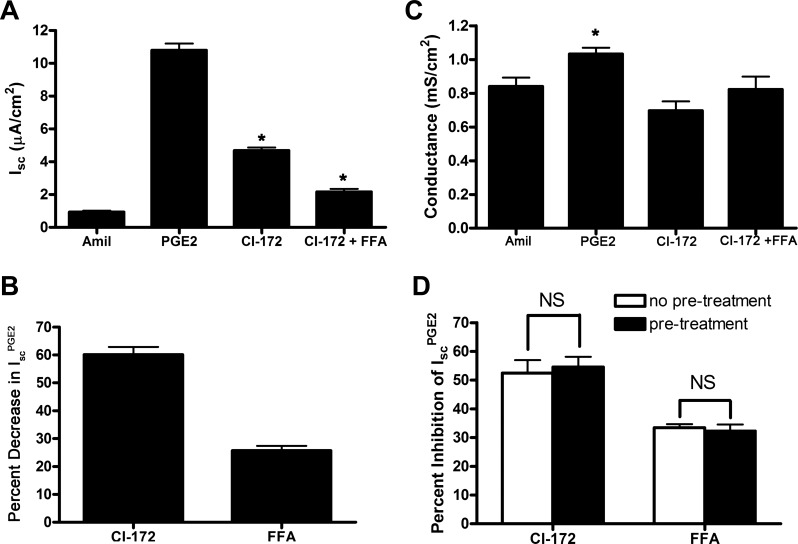
Because ENaC activity was blocked with addition of amiloride to the apical side of cell sheets in all experiments, we concluded that IscPGE2 is likely caused by stimulation of electrogenic anion secretion. To verify that PGE2 stimulates Cl− secretion in mIMCD-K2 cells, we performed similar experiments in a Cl−-free, HEPES-buffered Krebs-Henseleit solution. As expected, addition of PGE2 to mIMCD-K2 cells in this bath solution induced no increase in Isc (Fig. 8). We and others have identified CFTR and CACC as being candidate Cl− channels that mediate apical Cl− secretion in mIMCD-K2 cells (6, 53–55, 66, 67). To identify the apical ion channels mediating Cl− secretion in the IscPGE2 response, we treated PGE2-stimulated cells with CFTR inhibitor-172 (CFTR-172) and FFA. Apical addition of CFTR-172 (10−5 M) attenuated IscPGE2 by 60.1 ± 2.7% (Fig. 9, A and B); surprisingly, apical addition of FFA (2 × 10⁻⁴ M), following CFTR-172 addition, also reduced IscPGE2 by 25.7 ± 1.7% (Fig. 9, A and B). Addition of CFTR-172 and FFA also similarly inhibited transepithelial conductance (Fig. 9C). Moreover, the inhibitory effects of CFTR-172 and FFA on IscPGE2 were similar regardless of the order in which they were added to cell sheets (Fig. 9D), suggesting that the inhibitory effects of these compounds on IscPGE2 do not overlap. Because PGE2 activates EP4 receptors, which are linked to the Gαs/adenylate cyclase pathway, the possible involvement of CACC in the IscPGE2 response was unexpected.
Fig. 8.
Effect of substituting chloride and bicarbonate in the bath solution on PGE2-induced Isc in mIMCD-K2 cells. A: representative traces show the effect of PGE2 (7.7 × 10⁻⁸ M) on Isc in cells bathed in regular Krebs-Henseleit solution (KHS) (solid trace) or in KHS solution with chloride replaced with gluconate and bicarbonate replaced with HEPES (dashed trace). B: average sustained increase in Isc after basal PGE2 addition (IscPGE2) in cells bathed in regular or chloride/bicarbonate (Cl−/HCO3−)-free KHS. Values are represented as means ± SE. *Value significantly different from that in cells bathed in regular KHS.
Fig. 9.
Effects of CI-172 and FFA on PGE2-induced Isc in mIMCD-K2 cells. A: average Isc values in response to addition of PGE2 to the basal bath followed by sequential addition of CI-172 and FFA to the apical bath. Amiloride (10−5 M, Amil) was first added to the apical side followed by PGE2 (7.7 × 10⁻⁸ M) to the basal side. CI-172 (10−5 M) and FFA (2 × 10⁻⁴ M) were then added sequentially to the apical side. Values are means ± SE (n = 28 filters). *Value significantly different from IscPGE2. B: percentage of inhibition of PGE2-induced Isc (IscPGE2) after sequential addition of CI-172 and FFA to the apical side of mIMCD-K2 cells. Values are means ± SE (n = 28 filters). C: average conductance after sequential addition of amiloride, PGE2 to the basal side, and CI-172 and FFA. Values are means ± SE in mS/cm2. *Value significantly different from that found in cells treated with specified inhibitors. D: order of addition of CI-172 and FFA does not influence percent inhibition of IscPGE2. Open bars indicate percent inhibition of IscPGE2 after addition of specified inhibitor, whereas solid bars indicate percent inhibition of IscPGE2 after addition of specified inhibitor following pretreatment with the other inhibitor (FFA or CI-172) (n = 9).
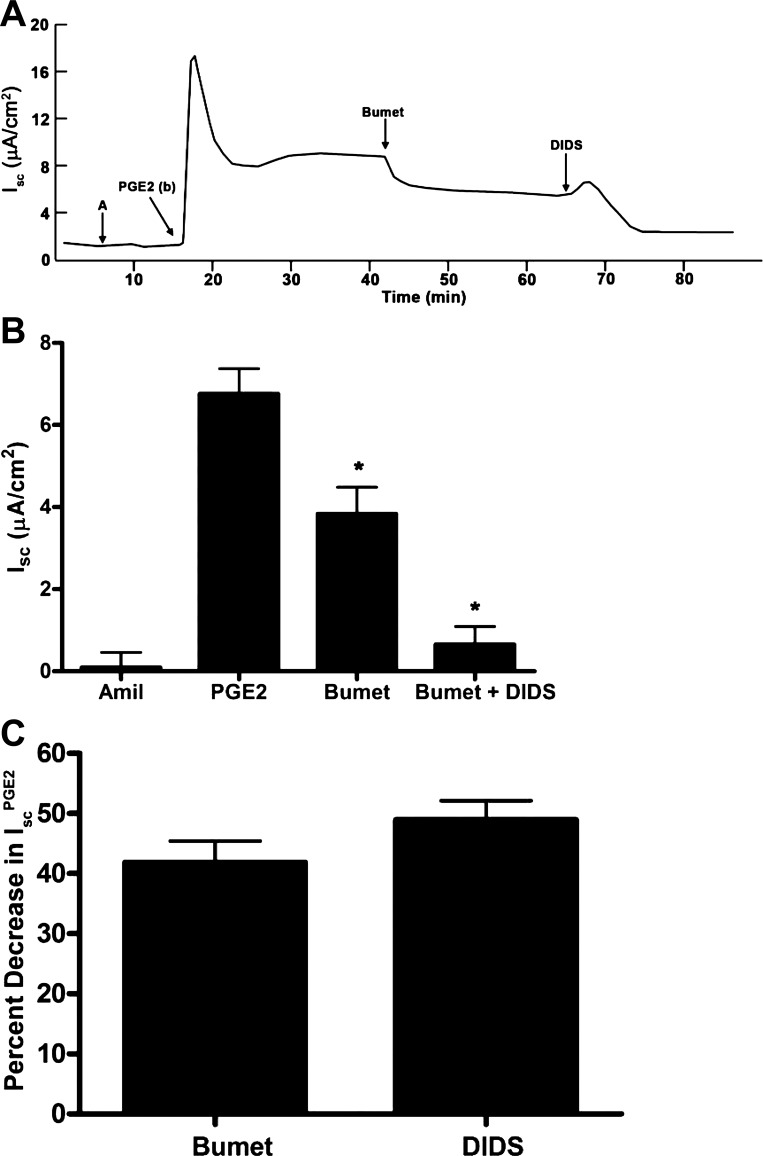
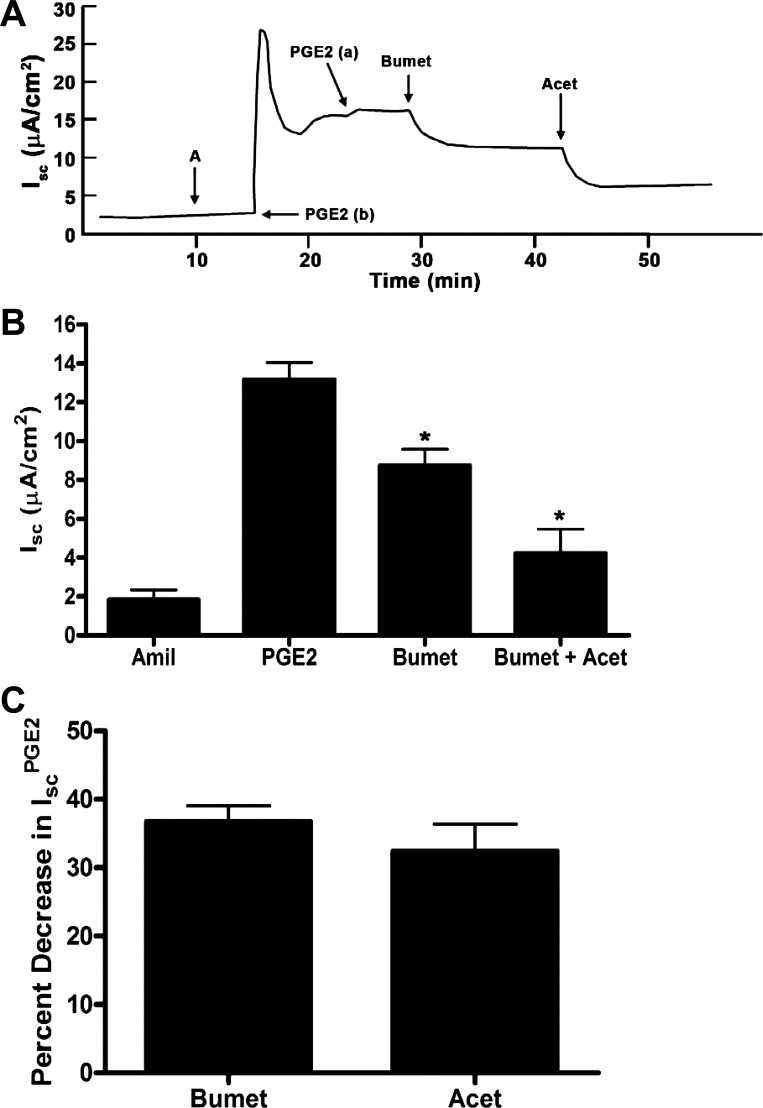
We next evaluated the transport pathways responsible for basolateral Cl− uptake in the IscPGE2 response. We first treated PGE2-stimulated cells with bumetanide (Na+/K+/2 Cl− cotransporter inhibitor) and DIDS (a nonselective anion transport inhibitor). Basal addition of bumetanide decreased IscPGE2 by 41.8 ± 3.7%; basal addition of DIDS further decreased IscPGE2 by 49.1 ± 3.2% (Fig. 10). To further characterize the transport pathway inhibited by DIDS, we next added acetazolamide (a carbonic anhydrase inhibitor) after bumetanide to PGE2-stimulated cells. In these experiments, basal addition of bumetanide decreased IscPGE2 by 39.1 ± 2.5% (Fig. 11, A and C); basal addition of acetazolamide (2.0 × 10⁻⁴ M) further decreased IscPGE2 by 32.4 ± 3.6% (Fig. 11, B and C). These findings suggest that both Na+/K+/2 Cl− cotransporters and Cl−/HCO3− exchangers mediate basolateral Cl− uptake during the IscPGE2 response, similar to mechanisms underlying basolateral Cl− uptake in primary human IMCD cells (68).
Fig. 10.
Effect of bumetanide and diisothiocyanostilbene-2,2'-disulfonic acid (DIDS) on PGE2-induced Isc in mIMCD-K2 cells. A: representative trace shows the Isc response to the addition of bumetanide (Bumet, 2 × 10⁻⁴ M) and DIDS (10−4 M) to the basal side on PGE2-induced Isc (IscPGE2). B: average Isc responses to addition of PGE2 to the basal bath followed by sequential addition of bumetanide and DIDS. Amil represents baseline Isc after the addition of amiloride. Values are means ± SE (n = 7 filters). *Value significantly different from IscPGE2. C: percentage of inhibition of IscPGE2 after basal addition of bumetanide and DIDS to mIMCD-K2 cells. Values are means ± SE (n = 7 filters).
Fig. 11.
Effects of bumetanide and acetazolamide (Acet) on PGE2-induced Isc in mIMCD-K2 cells. A: representative trace shows the Isc response to the addition of bumetanide (2 × 10⁻⁴ M) and acetazolamide (2 × 10⁻⁴ M) to the basal side on PGE2-induced Isc (IscPGE2). B: average Isc responses to addition of PGE2 to the basal bath followed by sequential addition of bumetanide and acetazolamide. Values are means ± SE (n = 13 filters). *Value significantly different from IscPGE2. C: percentage of inhibition of IscPGE2 after basal addition of bumetanide and acetazolamide to mIMCD-K2 cells. Values are means ± SE (n = 13 filters).
PGE2 stimulates PKA and Ca2+-signaling pathways.
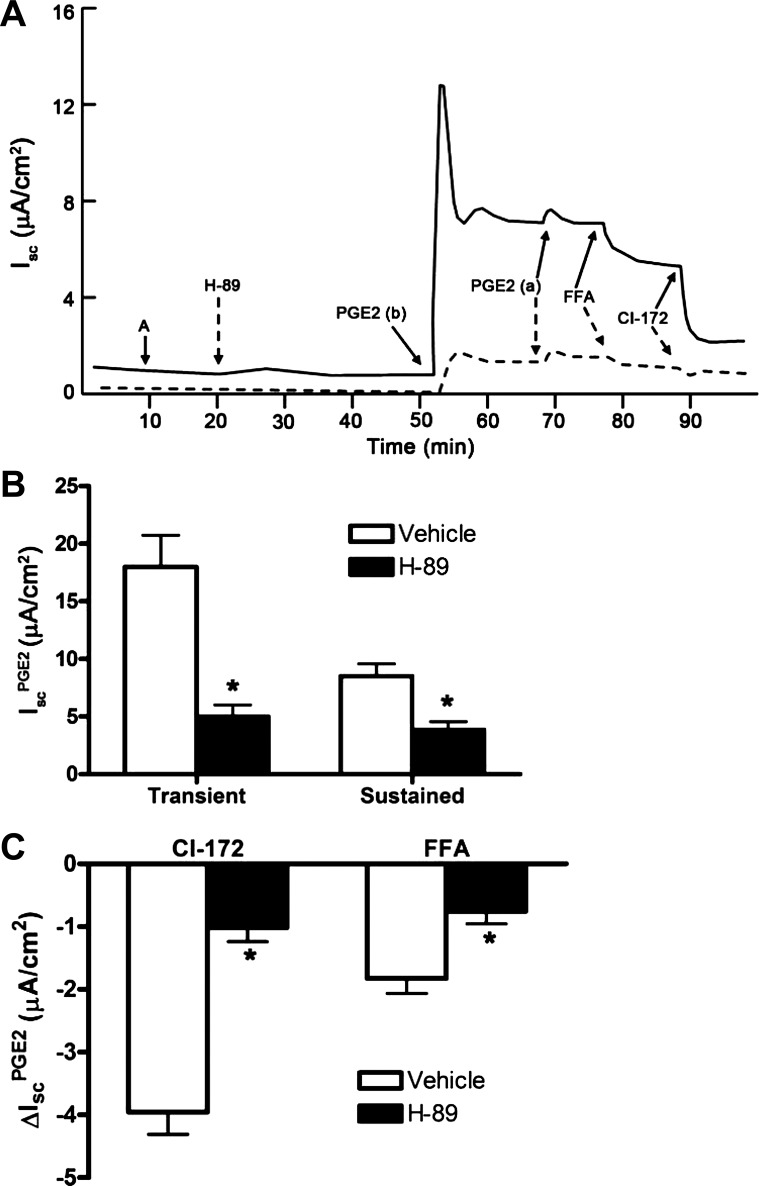
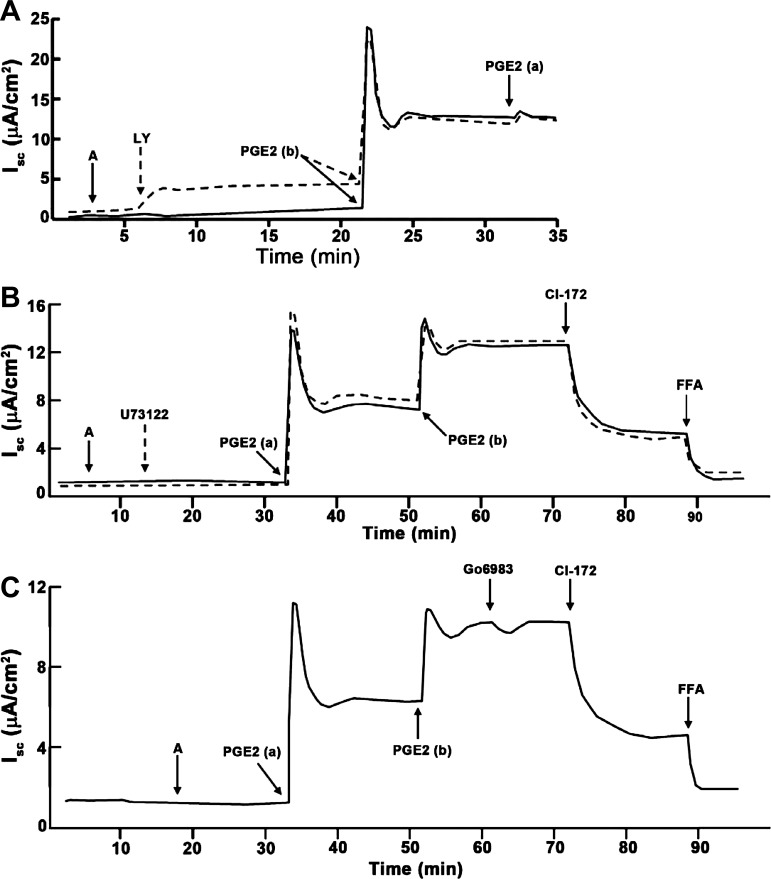
Because EP4 receptors classically couple to the Gαs subunit to stimulate adenylate cyclase and PKA activity, we next evaluated whether PKA activity is required for IscPGE2. We incubated mIMCD-K2 cells with the PKA inhibitor H-89 (10−5 M) before addition of PGE2. Pretreatment of cells with H-89 inhibited the transient phase of IscPGE2 by 69.2 ± 5.8%: vehicle-treated cells demonstrated a transient IscPGE2 response of 18.0 ± 2.4 μA/cm2, whereas H-89 treated cells demonstrate a much smaller transient IscPGE2 response of 5.0 ± 1 μA/cm2. Similarly, H-89 attenuated the sustained phase of IscPGE2 by 62.7 ± 4.4%: vehicle-treated cells showed a sustained IscPGE2 response of 8.2 ± 0.9 μA/cm2, whereas H-89-treated cells showed a sustained IscPGE2 response of only 3.4 ± 0.5 μA/cm2 (Fig. 12B). In contrast, addition of the PI3-kinase inhibitor LY-294002 (5 × 10⁻⁵ M), the phospholipase C inhibitor U73122 (10−6 M), or the protein kinase C inhibitor Go6983 (2 × 10⁻⁵ M) before PGE2 stimulation induced no change in IscPGE2 (Fig. 13).
Fig. 12.
Effect of PKA inhibitor H-89 on PGE2-induced Isc in mIMCD-K2 cells. A: representative traces show the Isc response to the addition H-89 (dashed line) (10−5 M) to both sides of the mIMCD-K2 cells or vehicle (solid line) on PGE2-induced Isc (IscPGE2). B: average transient and sustained Isc responses to basal addition of PGE2 to cells pretreated with vehicle (open bars) or H-89 (solid bars). Values are means ± SE (n = 13 filters). *Values significantly different from IscPGE2 in vehicle-treated cells. C: inhibition of PGE2-induced Isc (ΔIscPGE2) after apical addition of CI-172 or FFA to cells pretreated with vehicle (open bars) or H-89 (solid bars). Values are means ± SE (n = 9 filters). *Values significantly different from ΔIscPGE2 in vehicle-treated cells.
Fig. 13.
Effects of inhibitors of phosphatidylinositol 3-kinase, phospholipase C, and protein kinase C on PGE2-induced Isc in mIMCD-K2 cells. A: representative traces show the Isc response to addition of the phosphatidylinositol 3-kinase inhibitor LY294002 (dashed line) (LY, 2.5 × 10⁻⁵ M) to both sides or vehicle (solid line) on PGE2-induced Isc in mIMCD-K2 cells. Representative of results obtained from 6 cell sheets. B: representative traces show the Isc response to addition of the phospholipase C inhibitor U73122 (dashed line) (10−6 M) to both sides or vehicle (solid line) on PGE2-induced Isc in mIMCD-K2 cells. Representative of results obtained from 6 cell sheets. C: representative trace shows the Isc response to addition of the PKC inhibitor Go6983 (2 × 10⁻⁵ M) to both sides on PGE2-induced Isc in mIMCD-K2 cells. Representative of results obtained from 6 cell sheets.
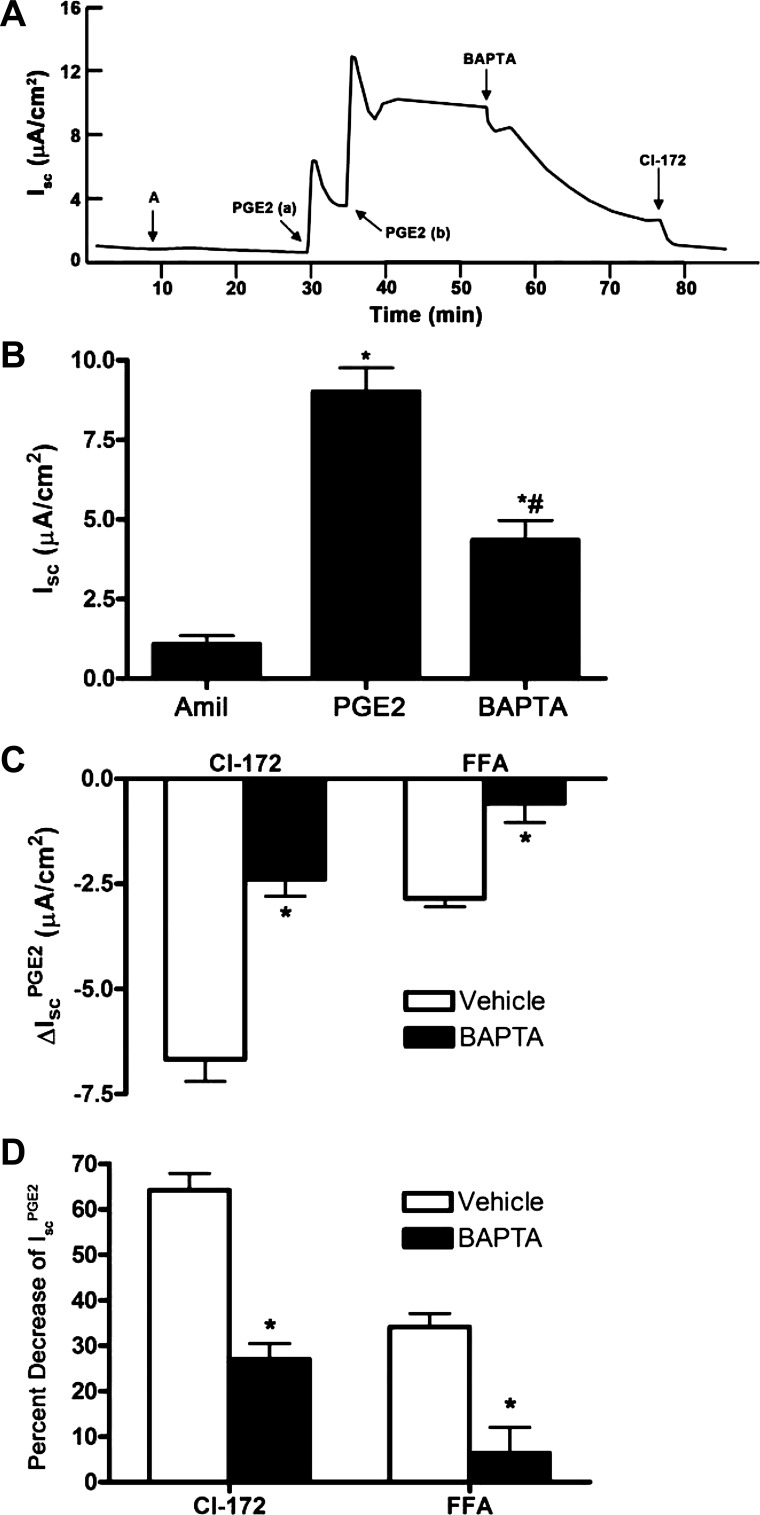
Because FFA, an inhibitor of CACC, could attenuate IscPGE2, we next tested whether a Ca2+-signaling pathway regulates a component of IscPGE2. We used the cell-permeable Ca2+ chelator BAPTA-AM to decrease intracellular Ca2+ concentration in mIMCD-K2 cells. Addition of BAPTA-AM (5 × 10⁻⁵ M) diminished IscPGE2 from 8.86 ± 0.72 μA/cm2 to 4.01 ± 0.56 μA/cm2, a decrease of 60.6 ± 5.6% (Fig. 14, A and B). Addition of FFA to cells had no effect on Isc PGE2 following BAPTA-AM treatment (Fig. 14D).
Fig. 14.
Effect of the Ca2+ chelator BAPTA-AM on PGE2-induced Isc in mIMCD-K2 cells. A: representative trace shows the Isc response to the addition of BAPTA-AM (5 × 10⁻⁵ M) to both sides on PGE2-induced Isc (IscPGE2). B: average Isc responses to sequential addition of amiloride, PGE2 (to the basal bath), and BAPTA-AM. Values are means ± SE (n = 12 filters). *Value significantly different from that in amiloride-treated cells; #value significantly different from IscPGE2 in control cells. C: inhibition of PGE2-induced Isc (ΔIscPGE2) after apical addition of CI-172 and FFA to cells pretreated with vehicle (open bars) or BAPTA-AM (solid bars). Values are means ± SE (n = 6 filters). *Values significantly different from ΔIscPGE2 in vehicle-treated cells. D: percentage of inhibition of PGE2-induced Isc (IscPGE2) after apical addition of CI-172 and FFA to cells pretreated with vehicle or BAPTA-AM. Values are means ± SE (n = 6 filters). *Values significantly different from percent decrease in IscPGE2 in vehicle-treated cells.
Crosstalk exists between cAMP and Ca2+-signaling pathways.
In the course of our experiments, we observed that a PKA-dependent pathway controls a component of IscPGE2 that is sensitive to inhibition by FFA. In paired studies, addition of FFA to PGE2-stimulated cells led to a decrease in Isc of 1.8 ± 0.2 μA/cm2 (Fig. 12C); in comparison, addition of FFA to PGE2-stimulated cells, pretreated with H-89, led to a decrease in Isc of only 0.75 ± 0.2 μA/cm2 (Fig. 12C). These findings suggest that inhibiting PKA inhibits, not only CFTR-mediated IscPGE2, but also CACC-mediated IscPGE2 and indicate that Ca2+ signaling may be downstream of PKA in mIMCD-K2 cells.
We also observed that a Ca2+-dependent pathway controls a component of IscPGE2 that is sensitive to inhibition by CFTR-172. Addition of CFTR-172 to PGE2-stimulated cells led to a decrease in Isc of 6.67 ± 0.53 μA/cm2, which represented 64.2 ± 3.7% of IscPGE2 (Fig. 14, C and D); in comparison, addition of CFTR-172 to PGE2-stimulated cells, pretreated with BAPTA-AM, led to a decrease in Isc of only 2.39 ± 0.41 μA/cm2, which represented 26.9 ± 3.5% of IscPGE2 (Fig. 14, C and D). From these experiments, we conclude that an increase in intracellular Ca2+ is required for maximal PGE2-stimulated CFTR activity.
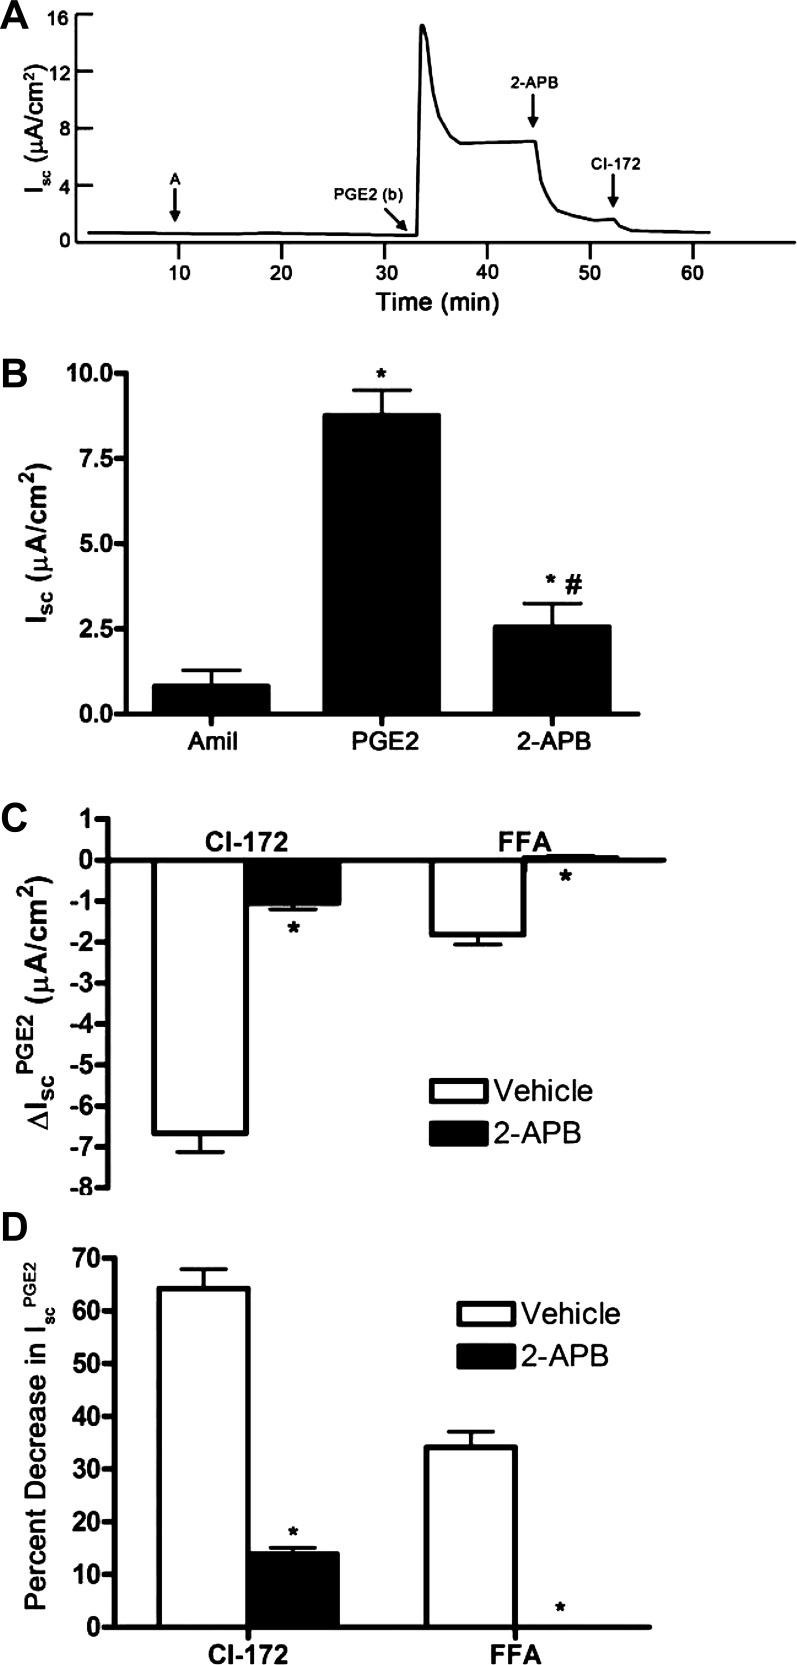
Several studies have demonstrated that PKA can induce release of Ca2+ from intracellular stores by phosphorylating IP3 receptors (18, 63). We therefore tested whether mobilization of Ca2+ from intracellular stores contributes to IscPGE2 by using 2-APB to inhibit IP3 receptor activation in mIMCD-K2 cells. Addition of 2-APB (10−4 M) significantly diminished IscPGE2 from 8.8 ± 0.7 μA/cm2 to 2.6 ± 0.7 μA/cm2, a decrease of 78.5 ± 4.4% (Fig. 15B); addition of FFA to 2-APB-treated cells induced no further inhibition of IscPGE2 (Fig. 15, C and D). Because the FFA-sensitive component of IscPGE2 is completely blocked by 2-APB, we conclude that PGE2 signals through IP3 receptors to activate CACC. Similar to the effect of BAPTA-AM on the CFTR-172-sensitive component of IscPGE2, addition of CFTR-172 to PGE2-stimulated cells, pretreated with 2-APB, led to a decrease in Isc of 1.05 ± 0.14 μA/cm2, which represented only 13.84 ± 1.2% of IscPGE2 (Fig. 15, C and D). This finding also confirms that intracellular Ca2+ is required for maximal PGE2-stimulated CFTR activity.
Fig. 15.
Effect of the inositol triphosphate (IP3) receptor inhibitor 2-aminoethoxydiphenyl borate (2-APB) on PGE2-induced Isc in mIMCD-K2 cells. A: representative trace shows the Isc response to the addition of 2-APB (2 × 10⁻⁴ M) to both sides on PGE2-induced Isc (IscPGE2). B: average Isc responses to sequential addition of amiloride, PGE2 (to the basal bath), and 2-APB. Values are means ± SE (n = 11 filters). *Value significantly different from that in amiloride-treated cells; #value significantly different from IscPGE2 in control cells. C: inhibition of PGE2-induced Isc (ΔIscPGE2) after apical addition of CI-172 and FFA to cells pretreated with vehicle (open bars) or 2-APB (solid bars). Values are means ± SE (n = 5–6 filters). *Values significantly different from ΔIscPGE2 in vehicle-treated cells. D: percentage of inhibition of PGE2-induced Isc (IscPGE2) after apical addition of CFTR inhibitor-172 or FFA to cells pretreated with vehicle or 2-APB. Values are means ± SE (n = 5–6 filters). *Values significantly different from percent decrease in IscPGE2 in vehicle-treated cells.
We also observed that the magnitude of inhibition of IscPGE2 after BAPTA-AM or 2-APB is much larger than the magnitude of inhibition of IscPGE2 by FFA treatment. Addition of BAPTA-AM or 2-APB to PGE2-stimulated mIMCD-K2 cells inhibited IscPGE2 by 60.6 ± 5.6% (Fig. 14B) or 78.5 ± 4.5% (Fig. 15B), respectively. In contrast, addition of FFA to paired PGE2-stimulated cells treated with vehicle decreased IscPGE2 by only 34.0 ± 2.9% (Figs. 14 and 15). The discrepancy between the magnitude of inhibition of IscPGE2 with BAPTA-AM or 2-APB with that after FFA treatment further suggests that BAPTA-AM or 2-APB may inhibit, not only CACC, but also CFTR activity in PGE2-stimulated mIMCD-K2 cells.
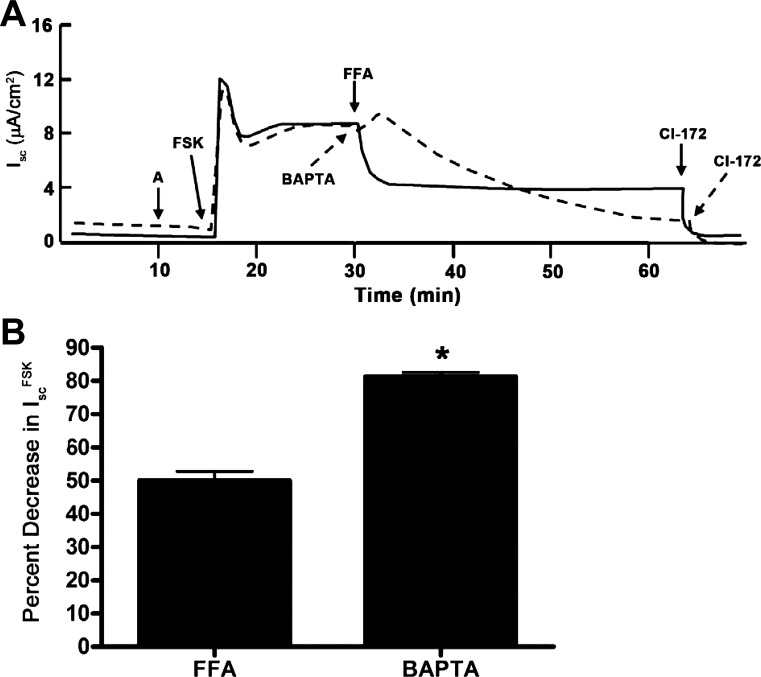
To evaluate whether direct stimulation of adenylate cyclase activity would also stimulate Ca2+ signaling in mIMCD-K2 cells, we treated mIMCD-K2 cells with forskolin and examined the Isc response. Addition of forskolin (10−5 M) to the apical side of cell sheets induced a large increase in Isc, which was inhibited by FFA (Fig. 16A, solid line; Fig. 16B) or BAPTA-AM (Fig. 16A, dashed line; Fig. 16B), indicating that an increase in cAMP signaling, independent of PGE2 action, can also stimulate CACC activity. Addition of BAPTA-AM to cells inhibited forskolin-stimulated Isc to a greater extent than the addition of FFA (Fig. 16B), suggesting again that intracellular Ca2+ stimulates, not only CACC, but also a component of CFTR activity.
Fig. 16.
Effect of FFA and BAPTA-AM on forskolin (FSK)-stimulated Isc in mIMCD-K2 cells. A: solid trace indicates the Isc response to sequential addition of forskolin (10−5 M) to the apical side, FFA, and CI-172; dashed trace indicates the Isc response to sequential addition of forskolin, BAPTA-AM, and CI-172. B: percentage of inhibition of forskolin-induced Isc (IscFSK) after apical addition of FFA or BAPTA-AM. Values are means ± SE (n = 9–11 filters). *Value significantly different from that in FFA-treated cells.
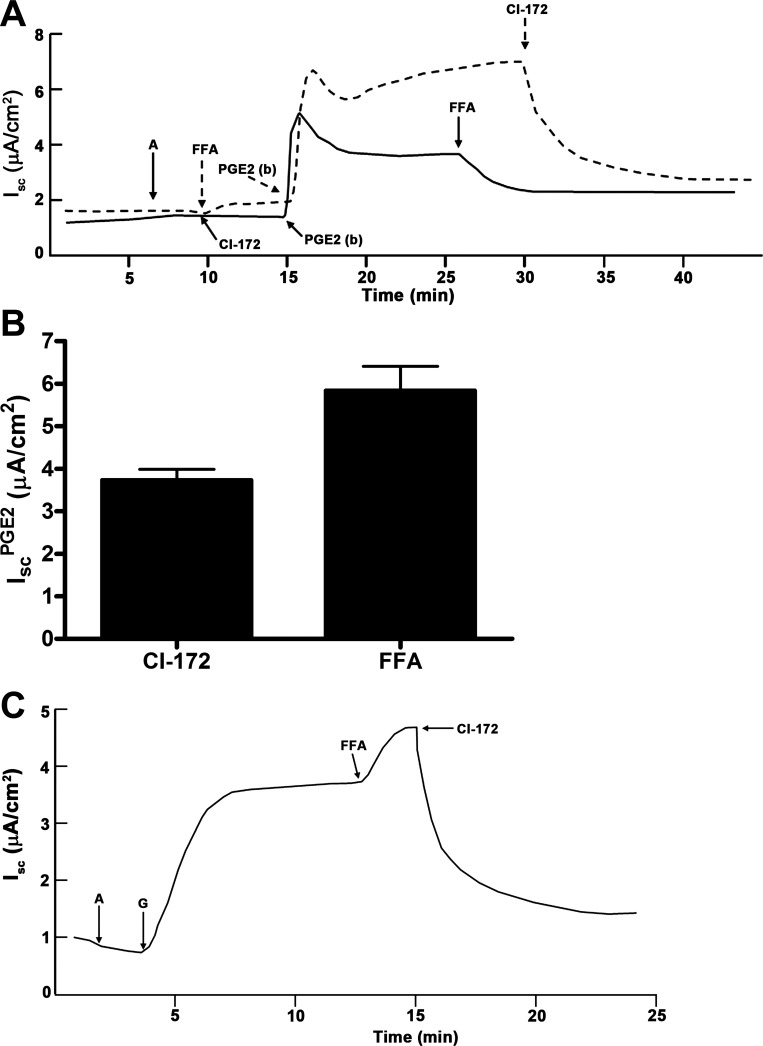
To rule out the possibility that CFTR activity itself might regulate CACC, we incubated mIMCD-K2 cells with CFTR-172 before addition of PGE2. We found that PGE2 could still induce an increase in Isc, which was sensitive only to FFA inhibition (Fig. 17A, solid line). When cells were incubated sequentially with CFTR-172, PGE2, and FFA, we observed no further inhibition of Isc with CFTR-172 treatment. Conversely, if cells were first incubated with FFA before addition of PGE2, PGE2 could still induce an increase in Isc (Fig. 17A, dashed line), which was almost completely inhibited by the subsequent addition of CFTR-172. These findings indicate that, although there is significant crosstalk between cAMP and Ca2+ signaling in stimulating IscPGE2, CFTR-172-sensitive and FFA-sensitive Cl− channel activities are distinct and can be regulated independent of one another. To further test whether FFA and CFTR-172 inhibit distinct Cl− transport pathways, we used genistein, a tyrosine kinase inhibitor, to activate CFTR in a manner that is independent of Ca2+ or cAMP-PKA signaling (1, 20, 26). Addition of FFA induced no decrease in genistein-stimulated Isc, but addition of CFTR-172 completely inhibited genistein-stimulated Isc (Fig. 18). This finding provides additional support that FFA and CFTR-172 can be used to probe distinct Cl− transport pathways in mIMCD-K2 cells.
Fig. 17.
CI-172- and FFA-sensitive Isc are distinct in mIMCD-K2 cells. A: representative traces show the Isc response to PGE2 when cells are pretreated with addition of CI-172 (solid trace) or FFA (dashed trace). B: average PGE2-induced Isc (IscPGE2) when cell sheets are pretreated with CI-172 or FFA. Values are means ± SE (n = 8 filters). C: representative trace shows the effect of FFA and CI-172 on Isc induced by addition of the tyrosine kinase inhibitor genistein (G, 3 × 10⁻⁵ M) to both sides. Representative of results obtained from 12 cell sheets.
Fig. 18.
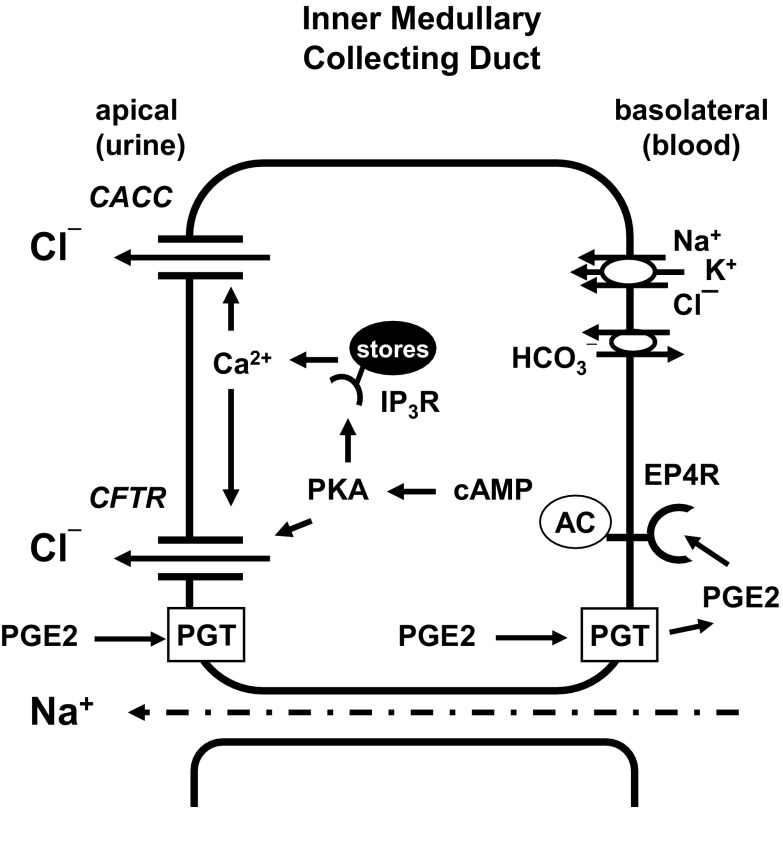
Model for PGE2 action in mIMCD-K2 cells. PGE2 in the apical side of cells can be transported to the basal side through the prostaglandin transporter (PGT). Once PGE2 reaches the basolateral membrane, it can bind to EP4 receptors in an autocrine or paracrine fashion. Binding of EP4 receptor induces activation of adenylate cyclase (AC) to increase cAMP production and stimulate protein kinase A (PKA) activity. PKA can directly stimulate CFTR; additionally PKA may phosphorylate IP3 receptors, which may sensitize them to basal levels of IP3. This could augment IP3 receptor response and enhance release Ca2+ from intracellular stores. An increase in intracellular Ca2+ activates Ca2+-activated Cl− channel (CACC) and perhaps CFTR activity.
DISCUSSION
In this study, we used the mIMCD-K2 cell line to examine direct effects of PGE2 on NaCl transport across IMCD epithelium. Our data demonstrate that PGE2 exclusively activates basolateral EP4 receptors to increase Cl− secretion (Fig. 18). The following findings support this conclusion. First, addition of PGE2 to the basal side of mIMCD-K2 cells elicited a maximal IscPGE2 response; in contrast, addition of PGE2 to the apical side elicited a partial IscPGE2 response, which could be further enhanced with basal addition of PGE2 (Fig. 2). Second, basal, but not apical, addition of the EP4 receptor agonist TCS-2510 induced an increase in Isc, which closely mirrored the IscPGE2 response (Fig. 3). Third, addition of the EP4 receptor antagonist L-161,982 completely blocked IscPGE2 (Fig. 4), whereas addition of other classes of EP receptor antagonists had no effect on IscPGE2. The magnitude and speed of this inhibition differed depending on whether L-161,982 was added to the apical or basal side of cells. Apical addition of L-161,982 led to partial inhibition of IscPGE2, whereas basal addition of L-161,982 led to complete and almost instantaneous inhibition of IscPGE2 (Fig. 5), suggesting that EP4 receptors are expressed on the basolateral side of mIMCD-K2 cells. Fourth, addition of a prostaglandin transporter inhibitor significantly inhibited IscPGE2 but only when PGE2 was added to the apical side of mIMCD-K2 cells (Fig. 6).
If our findings in mIMCD-K2 cells can be extrapolated to the in vivo setting, we suggest that PGE2 could arrive at the basolateral membrane of the IMCD from either the medullary interstitium or the collecting duct, which is known to synthesize and release PGE2 into the urinary space (8, 10, 27, 61). Although it is apparent how PGE2 could directly access basolateral EP4 receptors from the medullary interstitium, PGE2 must take a more circuitous route to reach the basolateral membrane from the urinary space. The prostaglandin transporter (PGT) is expressed in the apical or subapical membrane of the collecting duct (2, 3, 30, 45) and mediates PGE2 uptake from the urinary space via an anion exchange mechanism, exchanging lactate for PGE2 (11). In a Madin-Darby canine kidney cell model system, PGT extracts PGE2 from the apical solution and transports it across the epithelium to the basolateral solution (17). Although the molecular details for how PGE2 traverses the kidney cell are not yet clear, PGE2 may reach the exterior of the basolateral membrane through the organic anion transporter 3, which is expressed on the basolateral surface of renal tubules (44, 58). We infer from these and our own experiments that PGT carries PGE2 from the apical to basal side of IMCD cells, where it activates EP4 receptors in an autocrine or paracrine fashion (Fig. 18). It is noteworthy that high dietary salt intake induces transcription of PGT gene in the mouse renal collecting duct, which may represent an adaptive mechanism for increasing delivery of PGE2 to the basolateral membrane of IMCD cells to stimulate EP4 receptors (14).
Studies with EP4 receptor knockout mice and EP4 receptor-selective agonists/antagonists have demonstrated that EP4 receptors play a critical role in numerous physiological functions, including promoting urinary salt and water excretion. EP4 receptors are expressed in rat IMCD cells (65) and isolated mouse IMCD tubules (35). Moreover, addition of EP4 receptor agonists increase intracellular cAMP concentration in freshly isolated IMCD tubules, indicating that EP4 receptor signaling is intact in isolated IMCD tubules (35). In a hyperprostaglandin E/antenatal Bartter syndrome model in which mice are treated chronically with furosemide, genetic deletion or pharmacological inhibition of EP4 receptors results in a blunted diuretic and natriuretic response, which is associated with an attenuation of the expected rise in plasma renin concentration. The blunted diuretic/natriuretic response in EP4 knockout mice is not accompanied by a change in glomerular filtration (46); these findings are consistent with the notion that PGE2 stimulates EP4 receptors in IMCD cells to increase tubular NaCl secretion.
In a similar study examining PGE2 effects on Cl− secretion, Sandrasagra and colleagues (57) found that, in the presence of amiloride, addition of PGE2 to either side of M1 cortical collecting duct cells stimulates diphenylamine-2-carboxylic acid-sensitive Cl− secretion. In our study with mIMCD-K2 cells, we conclude that PGE2, by activating basolateral EP4 receptors, increases Cl− secretion by stimulating basolateral Cl− entry through Cl−/HCO3− exchange and NKCC transport and apical Cl− exit through CACC and CFTR. Moreover, our experiments demonstrate that PGE2 stimulates Cl− secretion through crosstalk between cAMP and Ca2+ signaling pathways in which cAMP and intracellular Ca2+ also regulate CACC and CFTR activities, respectively (Fig. 18). To our knowledge, this is the first demonstration of crosstalk between these two signaling pathways in kidney epithelial cells.
Several lines of evidence support the existence of crosstalk between cAMP and Ca2+-signaling pathways. First, FFA did not inhibit IscPGE2 to the same extent as BAPTA-AM or 2-APB: the magnitude of inhibition of IscPGE2 after BAPTA-AM or 2-APB was much larger than the magnitude of inhibition of IscPGE2 after FFA treatment (Figs. 14 and 15). This discrepancy suggests that BAPTA-AM or 2-APB may inhibit, not only CACC, but also CFTR activity in PGE2-stimulated mIMCD-K2 cells. Second, maneuvers that decrease intracellular Ca2+ concentration (BAPTA-AM or 2-APB treatment) significantly decreased CFTR-172-sensitive IscPGE2 in mIMCD-K2 cells (Figs. 14 and 15). Because CFTR is classically linked to PKA signaling, the sensitivity of CFTR activity to chelation of intracellular Ca2+ suggests that a component of CFTR activity responds to Ca2+ signaling. This finding adds to growing evidence in other epithelia that Ca2+-mobilizing secretagogues can activate CFTR (4, 15, 42, 64). Third, the PKA inhibitor H-89 significantly blocked FFA-sensitive IscPGE2 (Fig. 12). The sensitivity of CACC activity to H-89 inhibition suggests that PKA, in addition to regulating CFTR, may also regulate CACC activity. Fourth, PGE2 could stimulate FFA-sensitive IscPGE2, even after maximal CFTR-172 inhibition (Fig. 17). Additionally, CFTR-172, but not FFA, decreased genistein-stimulated Isc. Genistein activates CFTR independent of Ca2+ or cAMP/PKA signaling; the last two findings indicate that FFA and CFTR-172 can be used to probe distinct Cl− transport pathways and that activity of CFTR or CACC does not directly regulate the activity of the other channel in mIMCD-K2 cells.
We used a wide array of small molecule inhibitors to characterize the activities of ion transporters and channels and their signaling intermediates in the IscPGE2 response. Our findings should be interpreted with some caution because small molecule inhibitors may not always specifically inhibit their intended targets. For example, we tried to confirm the inhibitory effects of H-89 with myristolated PKA inhibitor (mPKI), a more specific inhibitor of PKA, but we were unable to recapitulate the inhibitory effects of H-89 on IscPGE2 with low doses of mPKI (data not shown). In another example, the inhibitory effects of BAPTA-AM on IscPGE2 occurred over a period of 20 min, which we suggest is consistent with Ca2+ chelation and gradual inhibition of CACC activity, but we cannot rule out the possibility that BAPTA-AM inhibits other pathways regulating CACC activity. In a third example, FFA may inhibit other Cl− transport pathways in mIMCD-K2 cells. During the preparation of this manuscript, small molecule compounds that are potentially more specific for CACC became available through Tocris Bioscience. These new inhibitors may prove useful in characterizing IscPGE2 and confirming CACC activity in mIMCD-K2 cells. To address some of these limitations, we used agonists or antagonists targeting different components of signaling and transport pathways, and the aggregate findings provide a coherent set of mechanisms for the IscPGE2 response in mIMCD-K2 cells. Future studies using new biochemical and genetic approaches to modulate these signaling and transport pathways will ultimately be required to provide a more complete understanding of mechanisms underlying PGE2 action in these cells.
The role of cAMP/PKA signaling in regulating CACC is currently not clear. Several studies have shown that inhibiting components of the cAMP/PKA signaling pathway, including CFTR itself, can decrease CACC-mediated Cl− transport (47–49, 70). We observed that inhibition of PKA significantly decreased, not only the CFTR-172-sensitive component of IscPGE2, but also the FFA-sensitive component, suggesting that PKA activation potentiates Ca2+-activated Cl− secretion in mIMCD-K2 cells. In contrast, we observed no change in the FFA-sensitive component of IscPGE2 when mIMCD-K2 cells were pretreated with CFTR inhibitor-172, indicating that CFTR does not simply regulate the activity of CACC. The mechanisms by which cAMP/PKA signaling potentiates CACC remain to be characterized, but we suggest one mechanism in which PGE2 induces PKA-mediated phosphorylation of IP3 receptors, which may sensitize them to basal levels of IP3 (24, 63). This could lead to an augmented IP3 receptor response and provide a mechanism through which PGE2 activates PKA and subsequently contributes to Ca2+ signaling (Fig. 18).
The role of Ca2+ signaling in regulating CFTR is also not entirely clear. In bronchial serous acinar cells, vasoactive intestinal polypeptide stimulates CFTR activity in part by increasing intracellular Ca2+ concentration through release of Ca2+ from IP3-sensitive Ca2+ stores. Foskett and colleagues (34) have proposed that Ca2+-dependent CFTR-mediated Cl− secretion involves activation of basolateral K+ channels, which mediates K+ efflux, stimulates Cl− influx via NKCC1 at the basolateral membrane, and drives eventual Cl− secretion via CFTR at the apical membrane (34). Similar to serous acinar cells, mIMCD-K2 cells also express basolateral K+ channels that participate in basolateral Cl− uptake (53) and may also drive Ca2+-activated Cl− secretion.
Our findings suggest a molecular mechanism through which PGE2 enhances urinary NaCl excretion under high-salt conditions. High-salt feeding increases expression of enzymes that increase PGE2 production, including cyclooxygenase (COX)-1, COX-2, and mPGES1, in the renal medulla (27, 29, 59). As a consequence, high-salt feeding increases the PGE2 concentration in the renal medulla and urine (12, 21, 36, 37, 72). When PGE2 production is disrupted through deletion of COX-1 or mPGES-1 in mice, salt-sensitive hypertension ensues (29, 72).
We propose that PGE2 activates basolateral EP4 receptors in IMCD cells to stimulate Cl− secretion as an adaptive mechanism in which local increases in PGE2 production in the collecting duct serve to enhance urinary NaCl excretion under conditions of high dietary NaCl intake. The activation of these signaling pathways may be particularly important under states of extracellular fluid volume expansion, when levels of serum aldosterone are low and ENaC activity is suppressed. To date, the contribution of EP4 receptors to the control of NaCl balance and blood pressure in vivo is unclear and awaits phenotypic analysis of EP4 receptor knockout mice challenged with NaCl loading.
GRANTS
This work was supported by a grant from the National Institutes of Health (K08-DK-073487 to A. Pao) and (T32-335 DK07357-26A1 to P. Kathpalia and S. Thomas).
DISCLOSURES
No conflicts of interest, financial or otherwise, are declared by the authors.
AUTHOR CONTRIBUTIONS
Author contributions: M.R. and A.C.P. conception and design of research; M.R., S.V.T., P.P.K., and Y.C. performed experiments; M.R., S.V.T., P.P.K., Y.C., and A.C.P. analyzed data; M.R., S.V.T., P.P.K., Y.C., and A.C.P. interpreted results of experiments; M.R., S.V.T., P.P.K., Y.C., and A.C.P. prepared figures; M.R. and A.C.P. drafted manuscript; M.R. and A.C.P. edited and revised manuscript; M.R. and A.C.P. approved final version of manuscript.
ACKNOWLEDGMENTS
We are grateful to Dr. Bruce Stanton (Dartmouth Medical School) for providing mIMCD-K2 cells for the study. We thank Dr. Rajeev Rohatgi (Mount Sinai School of Medicine) and Dr. Glenn Chertow (Stanford University) for valuable discussions.
REFERENCES
- 1.Andersson C, Servetnyk Z, Roomans GM. Activation of CFTR by genistein in human airway epithelial cell lines. Biochem Biophys Res Commun 308: 518–522, 2003 [DOI] [PubMed] [Google Scholar]
- 2.Banu SK, Arosh JA, Chapdelaine P, Fortier MA. Molecular cloning and spatio-temporal expression of the prostaglandin transporter: a basis for the action of prostaglandins in the bovine reproductive system. Proc Natl Acad Sci USA 100: 11747–11752, 2003 [DOI] [PMC free article] [PubMed] [Google Scholar]
- 3.Bao Y, Pucci ML, Chan BS, Lu R, Ito S, Schuster VL. Prostaglandin transporter PGT is expressed in cell types that synthesize and release prostanoids. Am J Physiol Renal Physiol 282: F1103–F1110, 2002 [DOI] [PubMed] [Google Scholar]
- 4.Billet A, Hanrahan JW. The secret life of CFTR as a calcium-activated chloride channel. J Physiol 591: 5273–5278, 2013 [DOI] [PMC free article] [PubMed] [Google Scholar]
- 5.Bito LZ. Inhibition of renal prostaglandin metabolism and excretion by probenecid, bromcresol green and indomethacin. Prostaglandins 12: 639–646, 1976 [DOI] [PubMed] [Google Scholar]
- 6.Boese SH, Glanville M, Aziz O, Gray MA, Simmons NL. Ca2+ and cAMP-activated Cl- conductances mediate Cl- secretion in a mouse renal inner medullary collecting duct cell line. J Physiol 523: 325–338, 2000 [DOI] [PMC free article] [PubMed] [Google Scholar]
- 7.Boese SH, Gray MA, Simmons NL. Volume-dependent and -independent activated anion conductances and their interaction in the renal inner medullary collecting duct (IMCD). Adv Exp Med Biol 559: 109–118, 2004 [DOI] [PubMed] [Google Scholar]
- 8.Bonvalet JP, Pradelles P, Farman N. Segmental synthesis and actions of prostaglandins along the nephron. Am J Physiol Renal Fluid Electrolyte Physiol 253: F377–F387, 1987 [DOI] [PubMed] [Google Scholar]
- 9.Breyer MD, Jacobson HR, Breyer RM. Functional and molecular aspects of renal prostaglandin receptors. J Am Soc Nephrol 7: 8–17, 1996 [DOI] [PubMed] [Google Scholar]
- 10.Campean V, Theilig F, Paliege A, Breyer M, Bachmann S. Key enzymes for renal prostaglandin synthesis: site-specific expression in rodent kidney (rat, mouse). Am J Physiol Renal Physiol 285: F19–F32, 2003 [DOI] [PubMed] [Google Scholar]
- 11.Chan BS, Endo S, Kanai N, Schuster VL. Identification of lactate as a driving force for prostanoid transport by prostaglandin transporter PGT. Am J Physiol Renal Physiol 282: F1097–F1102, 2002 [DOI] [PubMed] [Google Scholar]
- 12.Chen J, Zhao M, He W, Milne GL, Howard JR, Morrow J, Hebert RL, Breyer RM, Hao CM. Increased dietary NaCl induces renal medullary PGE2 production and natriuresis via the EP2 receptor. Am J Physiol Renal Physiol 295: F818–F825, 2008 [DOI] [PMC free article] [PubMed] [Google Scholar]
- 13.Cheng Y, Wang M, Yu Y, Lawson J, Funk CD, Fitzgerald GA. Cyclooxygenases, microsomal prostaglandin E synthase-1, and cardiovascular function. J Clin Invest 116: 1391–1399, 2006 [DOI] [PMC free article] [PubMed] [Google Scholar]
- 14.Chi Y, Pucci ML, Schuster VL. Dietary salt induces transcription of the prostaglandin transporter gene in renal collecting ducts. Am J Physiol Renal Physiol 295: F765–F771, 2008 [DOI] [PMC free article] [PubMed] [Google Scholar]
- 15.Cho HJ, Joo NS, Wine JJ. Defective fluid secretion from submucosal glands of nasal turbinates from CFTR-/- and CFTR (DeltaF508/DeltaF508) pigs. PloS One 6: e24424, 2011 [DOI] [PMC free article] [PubMed] [Google Scholar]
- 16.Elberg D, Turman MA, Pullen N, Elberg G. Prostaglandin E2 stimulates cystogenesis through EP4 receptor in IMCD-3 cells. Prostaglandins Other Lipid Mediat 98: 11–16, 2012 [DOI] [PubMed] [Google Scholar]
- 17.Endo S, Nomura T, Chan BS, Lu R, Pucci ML, Bao Y, Schuster VL. Expression of PGT in MDCK cell monolayers: polarized apical localization and induction of active PG transport. Am J Physiol Renal Physiol 282: F618–F622, 2002 [DOI] [PubMed] [Google Scholar]
- 18.Ferris CD, Huganir RL, Bredt DS, Cameron AM, Snyder SH. Inositol trisphosphate receptor: phosphorylation by protein kinase C and calcium calmodulin-dependent protein kinases in reconstituted lipid vesicles. Proc Natl Acad Sci USA 88: 2232–2235, 1991 [DOI] [PMC free article] [PubMed] [Google Scholar]
- 19.Fischer H, Illek B, Finkbeiner WE, Widdicombe JH. Basolateral Cl channels in primary airway epithelial cultures. Am J Physiol Lung Cell Mol Physiol 292: L1432–L1443, 2007 [DOI] [PubMed] [Google Scholar]
- 20.French PJ, Bijman J, Bot AG, Boomaars WE, Scholte BJ, de Jonge HR. Genistein activates CFTR Cl- channels via a tyrosine kinase- and protein phosphatase-independent mechanism. Am J Physiol Cell Physiol 273: C747–C753, 1997 [DOI] [PubMed] [Google Scholar]
- 21.Ge Y, Strait KA, Stricklett PK, Yang T, Kohan DE. Role of prostaglandins in collecting duct-derived endothelin-1 regulation of blood pressure and water excretion. Am J Physiol Renal Physiol 293: F1805–F1810, 2007 [DOI] [PubMed] [Google Scholar]
- 22.Grantham JJ, Wallace DP. Return of the secretory kidney. Am J Physiol Renal Physiol 282: F1–F9, 2002 [DOI] [PubMed] [Google Scholar]
- 23.Harris RC., Jr Cyclooxygenase-2 inhibition and renal physiology. Am J Cardiol 89: 10D–17D, 2002 [DOI] [PubMed] [Google Scholar]
- 24.Haug LS, Jensen V, Hvalby O, Walaas SI, Ostvold AC. Phosphorylation of the inositol 1,4,5-trisphosphate receptor by cyclic nucleotide-dependent kinases in vitro and in rat cerebellar slices in situ. J Biol Chem 274: 7467–7473, 1999 [DOI] [PubMed] [Google Scholar]
- 25.Henry PJ, D'Aprile A, Self G, Hong T, Mann TS. Inhibitors of prostaglandin transport and metabolism augment protease-activated receptor-2-mediated increases in prostaglandin E2 levels and smooth muscle relaxation in mouse isolated trachea. J Pharmacol Exp Ther 314: 995–1001, 2005 [DOI] [PubMed] [Google Scholar]
- 26.Illek B, Fischer H, Santos GF, Widdicombe JH, Machen TE, Reenstra WW. cAMP-independent activation of CFTR Cl channels by the tyrosine kinase inhibitor genistein. Am J Physiol Cell Physiol 268: C886–C893, 1995 [DOI] [PubMed] [Google Scholar]
- 27.Jensen BL, Kurtz A. Differential regulation of renal cyclooxygenase mRNA by dietary salt intake. Kidney Int 52: 1242–1249, 1997 [DOI] [PubMed] [Google Scholar]
- 28.Ji R, Chou CL, Xu W, Chen XB, Woodward DF, Regan JW. EP1 prostanoid receptor coupling to G i/o up-regulates the expression of hypoxia-inducible factor-1 alpha through activation of a phosphoinositide-3 kinase signaling pathway. Mol Pharmacol 77: 1025–1036, 2010 [DOI] [PMC free article] [PubMed] [Google Scholar]
- 29.Jia Z, Zhang A, Zhang H, Dong Z, Yang T. Deletion of microsomal prostaglandin E synthase-1 increases sensitivity to salt loading and angiotensin II infusion. Circ Res 99: 1243–1251, 2006 [DOI] [PubMed] [Google Scholar]
- 30.Kanai N, Lu R, Satriano JA, Bao Y, Wolkoff AW, Schuster VL. Identification and characterization of a prostaglandin transporter. Science 268: 866–869, 1995 [DOI] [PubMed] [Google Scholar]
- 31.Kawamura T, Horie S, Maruyama T, Akira T, Imagawa T, Nakamura N. Prostaglandin E1 transported into cells blocks the apoptotic signals induced by nerve growth factor deprivation. J Neurochem 72: 1907–1914, 1999 [DOI] [PubMed] [Google Scholar]
- 32.Kawasaki T, Delea CS, Bartter FC, Smith H. The effect of high-sodium and low-sodium intakes on blood pressure and other related variables in human subjects with idiopathic hypertension. Am J Med 64: 193–198, 1978 [DOI] [PubMed] [Google Scholar]
- 33.Kizer NL, Lewis B, Stanton BA. Electrogenic sodium absorption and chloride secretion by an inner medullary collecting duct cell line (mIMCD-K2). Am J Physiol Renal Fluid Electrolyte Physiol 268: F347–F355, 1995 [DOI] [PubMed] [Google Scholar]
- 34.Lee RJ, Foskett JK. Mechanisms of Ca2+-stimulated fluid secretion by porcine bronchial submucosal gland serous acinar cells. Am J Physiol Lung Cell Mol Physiol 298: L210–L231, 2010 [DOI] [PubMed] [Google Scholar]
- 35.Li JH, Chou CL, Li B, Gavrilova O, Eisner C, Schnermann J, Anderson SA, Deng CX, Knepper MA, Wess J. A selective EP4 PGE2 receptor agonist alleviates disease in a new mouse model of X-linked nephrogenic diabetes insipidus. J Clin Invest 119: 3115–3126, 2009 [DOI] [PMC free article] [PubMed] [Google Scholar]
- 36.Limas C, Goldman P, Limas CJ, Iwai J. Effect of salt on prostaglandin metabolism in hypertension-prone and -resistant Dahl rats. Hypertension 3: 219–224, 1981 [DOI] [PubMed] [Google Scholar]
- 37.Limas C, Limas CJ. Up-regulation of renal prostaglandin receptors in genetic salt-dependent hypertension. Hypertension 8: 566–571, 1986 [DOI] [PubMed] [Google Scholar]
- 38.Liu Y, Rajagopal M, Lee K, Battini L, Flores D, Gusella GL, Pao AC, Rohatgi R. Prostaglandin E2 mediates proliferation and chloride secretion in ADPKD cystic renal epithelia. Am J Physiol Renal Physiol 303: F1425–F1434, 2012 [DOI] [PMC free article] [PubMed] [Google Scholar]
- 39.Ma T, Thiagarajah JR, Yang H, Sonawane ND, Folli C, Galietta LJ, Verkman AS. Thiazolidinone CFTR inhibitor identified by high-throughput screening blocks cholera toxin-induced intestinal fluid secretion. J Clin Invest 110: 1651–1658, 2002 [DOI] [PMC free article] [PubMed] [Google Scholar]
- 40.Makhanova N, Hagaman J, Kim HS, Smithies O. Salt-sensitive blood pressure in mice with increased expression of aldosterone synthase. Hypertension 51: 134–140, 2008 [DOI] [PubMed] [Google Scholar]
- 41.Murray RH, Luft FC, Bloch R, Weyman AE. Blood pressure responses to extremes of sodium intake in normal man. Proc Soc Exp Biol Med 159: 432–436, 1978 [DOI] [PubMed] [Google Scholar]
- 42.Namkung W, Lee JA, Ahn W, Han W, Kwon SW, Ahn DS, Kim KH, Lee MG. Ca2+ activates cystic fibrosis transmembrane conductance regulator- and Cl−-dependent HCO3 transport in pancreatic duct cells. J Biol Chem 278: 200–207, 2003 [DOI] [PubMed] [Google Scholar]
- 43.Nesterov V, Dahlmann A, Krueger B, Bertog M, Loffing J, Korbmacher C. Aldosterone dependent and independent regulation of the epithelial sodium channel (ENaC) in mouse distal nephron. Am J Physiol Renal Physiol 303: F1289–F1299, 2012 [DOI] [PubMed] [Google Scholar]
- 44.Nilwarangkoon S, Anzai N, Shiraya K, Yu E, Islam R, Cha SH, Onozato ML, Miura D, Jutabha P, Tojo A, Kanai Y, Endou H. Role of mouse organic anion transporter 3 (mOat3) as a basolateral prostaglandin E2 transport pathway. J Pharm Sci 103: 48–55, 2007 [DOI] [PubMed] [Google Scholar]
- 45.Nomura T, Chang HY, Lu R, Hankin J, Murphy RC, Schuster VL. Prostaglandin signaling in the renal collecting duct: release, reuptake, and oxidation in the same cell. J Biol Chem 280: 28424–28429, 2005 [DOI] [PubMed] [Google Scholar]
- 46.Nusing RM, Treude A, Weissenberger C, Jensen B, Bek M, Wagner C, Narumiya S, Seyberth HW. Dominant role of prostaglandin E2 EP4 receptor in furosemide-induced salt-losing tubulopathy: a model for hyperprostaglandin E syndrome/antenatal Bartter syndrome. J Am Soc Nephrol 16: 2354–2362, 2005 [DOI] [PubMed] [Google Scholar]
- 47.Nuttle LC, Farley JM. Frequency modulation of acetylcholine-induced oscillations in Ca++ and Ca(++)-activated Cl- current by cAMP in tracheal smooth muscle. J Pharmacol Exp Ther 277: 753–760, 1996 [PubMed] [Google Scholar]
- 48.Ousingsawat J, Kongsuphol P, Schreiber R, Kunzelmann K. CFTR and TMEM16A are separate but functionally related Cl- channels. Cell Physiol Biochem 28: 715–724, 2011 [DOI] [PubMed] [Google Scholar]
- 49.Perez-Cornejo P, Arreola J. Regulation of Ca(2+)-activated chloride channels by cAMP and CFTR in parotid acinar cells. Biochem Biophys Res Commun 316: 612–617, 2004 [DOI] [PubMed] [Google Scholar]
- 50.Pochynyuk O, Rieg T, Bugaj V, Schroth J, Fridman A, Boss GR, Insel PA, Stockand JD, Vallon V. Dietary Na+ inhibits the open probability of the epithelial sodium channel in the kidney by enhancing apical P2Y2-receptor tone. FASEB J 24: 2056–2065, 2010 [DOI] [PMC free article] [PubMed] [Google Scholar]
- 51.Pucci ML, Endo S, Nomura T, Lu R, Khine C, Chan BS, Bao Y, Schuster VL. Coordinate control of prostaglandin E2 synthesis and uptake by hyperosmolarity in renal medullary interstitial cells. Am J Physiol Renal Physiol 290: F641–F649, 2006 [DOI] [PubMed] [Google Scholar]
- 52.Rajagopal M, Fischer H, Widdicombe JH. Hormonal and purinergic stimulation of bicarbonate secretion in oviducts of rhesus monkey. Am J Physiol Endocrinol Metab 295: E55–E62, 2008 [DOI] [PubMed] [Google Scholar]
- 53.Rajagopal M, Kathpalia PP, Thomas SV, Pao AC. Activation of P2Y1 and P2Y2 receptors induces chloride secretion via calcium-activated chloride channels in kidney inner medullary collecting duct cells. Am J Physiol Renal Physiol 301: F544–F553, 2011 [DOI] [PMC free article] [PubMed] [Google Scholar]
- 54.Rajagopal M, Kathpalia PP, Widdicombe JH, Pao AC. Differential effects of extracellular ATP on chloride transport in cortical collecting duct cells. Am J Physiol Renal Physiol 303: F483–F491, 2012 [DOI] [PMC free article] [PubMed] [Google Scholar]
- 55.Rajagopal M, Pao AC. Adenosine activates a2b receptors and enhances chloride secretion in kidney inner medullary collecting duct cells. Hypertension 55: 1123–1128, 2010 [DOI] [PMC free article] [PubMed] [Google Scholar]
- 56.Roos JC, Koomans HA, Dorhout Mees EJ, Delawi IM. Renal sodium handling in normal humans subjected to low, normal, and extremely high sodium supplies. Am J Physiol Renal Fluid Electrolyte Physiol 249: F941–F947, 1985 [DOI] [PubMed] [Google Scholar]
- 57.Sandrasagra S, Cuffe JE, Regardsoe EL, Korbmacher C. PGE2 stimulates Cl- secretion in murine M-1 cortical collecting duct cells in an autocrine manner. Pflügers Arch 448: 411–421, 2004 [DOI] [PubMed] [Google Scholar]
- 58.Sauvant C, Holzinger H, Gekle M. Prostaglandin E2 inhibits its own renal transport by downregulation of organic anion transporters rOAT1 and rOAT3. J Am Soc Nephrol 17: 46–53, 2006 [DOI] [PubMed] [Google Scholar]
- 59.Schneider A, Zhang Y, Zhang M, Lu WJ, Rao R, Fan X, Redha R, Davis L, Breyer RM, Harris R, Guan Y, Breyer MD. Membrane-associated PGE synthase-1 (mPGES-1) is coexpressed with both COX-1 and COX-2 in the kidney. Kidney Int 65: 1205–1213, 2004 [DOI] [PubMed] [Google Scholar]
- 60.Siragy HM, Linden J. Sodium intake markedly alters renal interstitial fluid adenosine. Hypertension 27: 404–407, 1996 [DOI] [PubMed] [Google Scholar]
- 61.Smith WL, Bell TG. Immunohistochemical localization of the prostaglandin-forming cyclooxygenase in renal cortex. Am J Physiol Renal Fluid Electrolyte Physiol 235: F451–F457, 1978 [DOI] [PubMed] [Google Scholar]
- 62.Sonnenberg H. Secretion of salt and water into the medullary collecting duct of Ringer-infused rats. Am J Physiol 228: 565–568, 1975 [DOI] [PubMed] [Google Scholar]
- 63.Soulsby MD, Wojcikiewicz RJ. The type III inositol 1,4,5-trisphosphate receptor is phosphorylated by cAMP-dependent protein kinase at three sites. Biochem J 392: 493–497, 2005 [DOI] [PMC free article] [PubMed] [Google Scholar]
- 64.Thiagarajah JR, Song Y, Haggie PM, Verkman AS. A small molecule CFTR inhibitor produces cystic fibrosis-like submucosal gland fluid secretions in normal airways. FASEB J 18: 875–877, 2004 [DOI] [PubMed] [Google Scholar]
- 65.Uawithya P, Pisitkun T, Ruttenberg BE, Knepper MA. Transcriptional profiling of native inner medullary collecting duct cells from rat kidney. Physiol Genomics 32: 229–253, 2008 [DOI] [PMC free article] [PubMed] [Google Scholar]
- 66.Vandorpe D, Kizer N, Ciampollilo F, Moyer B, Karlson K, Guggino WB, Stanton BA. CFTR mediates electrogenic chloride secretion in mouse inner medullary collecting duct (mIMCD-K2) cells. Am J Physiol Cell Physiol 269: C683–C689, 1995 [DOI] [PubMed] [Google Scholar]
- 67.Vandorpe DH, Ciampolillo F, Green RB, Stanton BA. Cyclic nucleotide-gated cation channels mediate sodium absorption by IMCD (mIMCD-K2) cells. Am J Physiol Cell Physiol 272: C901–C910, 1997 [DOI] [PubMed] [Google Scholar]
- 68.Wallace DP, Christensen M, Reif G, Belibi F, Thrasher B, Herrell D, Grantham JJ. Electrolyte and fluid secretion by cultured human inner medullary collecting duct cells. Am J Physiol Renal Physiol 283: F1337–F1350, 2002 [DOI] [PubMed] [Google Scholar]
- 69.Wallace DP, Rome LA, Sullivan LP, Grantham JJ. cAMP-dependent fluid secretion in rat inner medullary collecting ducts. Am J Physiol Renal Physiol 280: F1019–F1029, 2001 [DOI] [PubMed] [Google Scholar]
- 70.Wei L, Vankeerberghen A, Cuppens H, Cassiman JJ, Droogmans G, Nilius B. The C-terminal part of the R-domain, but not the PDZ binding motif, of CFTR is involved in interaction with Ca(2+)-activated Cl- channels. Pflügers Arch 442: 280–285, 2001 [DOI] [PubMed] [Google Scholar]
- 71.White MM, Aylwin M. Niflumic and flufenamic acids are potent reversible blockers of Ca2(+)-activated Cl- channels in Xenopus oocytes. Mol Pharmacol 37: 720–724, 1990 [PubMed] [Google Scholar]
- 72.Ye W, Zhang H, Hillas E, Kohan DE, Miller RL, Nelson RD, Honeggar M, Yang T. Expression and function of COX isoforms in renal medulla: evidence for regulation of salt sensitivity and blood pressure. Am J Physiol Renal Physiol 290: F542–F549, 2006 [DOI] [PubMed] [Google Scholar]


