

Abstract
The extracellular matrix (ECM) plays an important role in the maintenance of white adipose tissue (WAT) architecture and function, and proper ECM remodeling is critical to support WAT malleability to accomodate changes in energy storage needs. Obesity and adipocyte hypertrophy place a strain on the ECM remodeling machinery, which may promote disordered ECM and altered tissue integrity and could promote proinflammatory and cell stress signals. To explore these questions, new methods were developed to quantify omental and subcutaneous WAT tensile strength and WAT collagen content by three-dimensional confocal imaging, using collagen VI knockout mice as a methods validation tool. These methods, combined with comprehensive measurement of WAT ECM proteolytic enzymes, transcript, and blood analyte analyses, were used to identify unique pathophenotypes of metabolic syndrome and type 2 diabetes mellitus in obese women, using multivariate statistical modeling and univariate comparisons with weight-matched healthy obese individuals. In addition to the expected differences in inflammation and glycemic control, approximately 20 ECM-related factors, including omental tensile strength, collagen, and enzyme transcripts, helped discriminate metabolically compromised obesity. This is consistent with the hypothesis that WAT ECM physiology is intimately linked to metabolic health in obese humans, and the studies provide new tools to explore this relationship.
Keywords: matrix metalloproteinase, bariatric surgery, adipose inflammation, type 2 diabetes mellitus, extracellular matrix
white adipose tissue (WAT) is the primary site of energy storage in humans and by its nature must be malleable to respond to changes in energy balance through expansion and contraction. Under healthy conditions, changes in WAT architecture and the extracellular matrix (ECM) are coordinated with alterations in adipocyte size to accommodate fat storage needs. In contrast, sustained excessive energy intake with concomitant development of hypertrophic adipocytes creates a strain on ECM adaptation with pathophysiological consequences such as inflammation and insulin resistance.
Adipose transcript abundances of several ECM-related genes were increased in obese compared with nonobese human subjects, including cell adhesion molecules and ECM receptor interaction genes, whereas weight loss after gastric bypass surgery led to decreased expression of these genes (18). Collagen VI is enriched in adipose tissue, and visceral WAT mass is related to increased expression of collagen 6α3 in humans and in genetically obese mice (21, 38). Some studies have indicated that, at least in severe obesity, WAT fibrosis is more prevalent compared with nonobese individuals and that fibrosis decreases with weight loss (13, 14), and this is believed to play a role in obesity-associated inflammation. Genetically obese ob/ob mice deficient in collagen VI (and thus lower fibrosis) fed a high-fat diet have improved glucose tolerance, insulin signaling, and triglyceride disposal with greater adipocyte size along with reduced WAT inflammation (21). Further highlighting the associations between ECM and metabolic phenotypes, studies have shown changes in insulin sensitivity, adipocyte size, and visceral adipose depot mass with genetic or chemical modulation of the ECM proteolytic and fibrinolytic systems in mice (7, 11, 12, 28, 30, 56). In humans, obese subjects with metabolic syndrome have greater serum levels of plasminogen activator inhibitor-1 (PAI-1) and matrix metalloproteinase-9 (MMP-9), factors that are involved in ECM remodeling (3, 23). Thus, evidence clearly points to an important role for the ECM and its modulators in driving and/or reflecting WAT-specific and system-wide metabolic and inflammatory outcomes.
Interestingly, a subset of obese women are considered metabolically healthy (58), but the specific phenomena that underlie or track health vs. disease manifestations in obesity remain to be identified. It is reasonable to consider that differences in the WAT ECM, fibrosis, and inflammation play a role in this regard. Understanding the specific factors that underlie changes in WAT structure and ECM in response to changes in nutritional status and obesity will provide insight into the events that lead to or accompany metabolic disease. It has been difficult to unravel natural nonpathological events that accompany weight gain from those that lead to metabolic dysfunction. A case in point is the observation that severe diet-induced obesity (DIO) in mice is accompanied by inflammation and areas in WAT of adipocyte death, in synchrony with reduced insulin sensitivity (35, 46, 59). Similar increases in macrophage infiltration and inflammation also occur in humans (3, 23). This suggests that macrophages have a functional role in “repair” of dysfunctional “injured” WAT and that chronic inflammation stemming from macrophage activation contributes to insulin resistance. However, we and others have shown that WAT macrophage infiltration markers are strongly correlated with body weight over a large range in nonobese and moderately obese DIO mice (52, 53), supporting a normal physiological role for macrophages in the course of well-controlled WAT expansion and remodeling. DIO mouse WAT is enriched in macrophages with a combination of classic M1 and alternative M2 characteristics, and genes involved in remodeling and angiogenesis are upregulated (42). Altogether, these observations highlight that the nature of the WAT, and not its bulk per se, may be the driver of metabolic disease susceptibility in obesity.
Considering the uncertainties surrounding the roles of the ECM and its potential regulators on metabolic health or obesity-associated disease, we tested the hypothesis that the ECM and WAT architecture phenotype differs in metabolically healthy and unhealthy WAT in equally obese women. Specifically, we tested the relationships between indices of metabolic dysfunction, inflammation, and subcutaneous (sc) and visceral (omental) WAT structure by integrating novel biophysical parameters, tissue proteolytic activity, patterns in a suite of WAT inflammation- and ECM-related gene transcripts, and unique three-dimensional collagen content analyses to identify multivariate signatures that mark health and disease. Since some treatments used for metabolic disorders [e.g., thiazolidinediones (TZD) and statins] have been shown to influence ECM integrity and remodeling (9, 17, 26, 39), our primary aim was to compare the ECM phenotype in weight-matched healthy vs. unhealthy [metabolic syndrome (MetS)] obese women not taking these classes of medications. In addition, we had an opportunity to make a secondary comparison between weight-matched type 2 diabetic (T2DM) women and healthy obese women to understand whether diabetes also impacts the WAT ECM phenotype.
METHODS
Collagen 6a1 knockout mice.
Male Col6a1−/− [Col6 knockout (KO)] mice and wild-type (WT) control littermates were obtained from the laboratory of Bonaldo et al. (4). Eighteen- to 25-wk-old male mice were maintained in the University of California Davis vivarium on rodent chow (Picolab Mouse Diet 20; Purina LabDiet). Mice were briefly food deprived (between 3 and 8 h starting at 0600) prior to being deeply anesthetized via isoflurane inhalation (3% in O2). Retroperitoneal (RP) fat pads, epididymal (EPI) fat pads, femoral sc fat pads, and liver were excised and weighed. The right RP fat pad was put into ice-cold Hanks' balanced salt solution (HBSS) before tensile strength was measured (described below). Extreme care was exercised in dissection to ensure that the integrity of the depot sheath was not compromised, since this could impact tensile strength measurements. In addition, one fat pad each for EPI and sc WAT was fixed in 10% neutral buffered formalin and paraffin embedded. The animal protocol was approved by the University of California Davis Institutional Animal Care and Use Committee according to Animal Welfare Act guidelines.
Healthy and metabolically compromised obese human subjects.
All human protocols were approved by the University of California at Davis Institutional Review Board, and all participants provided written informed consent. Subjects between 20 and 55 yr of age and BMI between 35 and 55 undergoing bariatric surgery at the University of California Davis Medical Center were recruited. Adult women with fasting glucose <100 mg/dl, total insulin <19 μU/ml, triglycerides <150 mg/dl, HDL >39 mg/dl, systolic blood pressure <140 mmHg, and diastolic blood pressure <90 mmHg and who were not taking medication for T2DM or dyslipidemia were considered metabolically healthy and free of metabolic syndrome (n = 12). Nondiabetic subjects with fasting glucose >100 mg/dl or total insulin >19 μU/ml as well as dyslipidemia (triglyceride ≥150 mg/dl or HDL ≤39 mg/dl) or hypertension (systolic blood pressure ≥140 mmHg or diastolic blood pressure ≥90 mmHg) who were not previously taking medication for blood sugar control or dyslipidemia were assigned to the MetS group (n = 10). Prior to surgery, subjects underwent a 2-day clear liquid diet and bowel preparation with GoLYTELY (polyethylene glycol-electrolyte solution; Braintree Laboratories, Braintree, MA), followed by 1 g of neomycin treatment. Omental and sc WAT samples were collected during bariatric surgery under Diprivan (propofol) and sevoflurane anesthesia. Tissue samples were subsectioned for fixation in 10% neutral buffered formalin, stored in ice-cold HBSS for measuring tensile strength, or flash-frozen and stored at −80°C. The primary comparison for this study was healthy vs. MetS subjects; however, samples were also opportunistically collected from obese women previously diagnosed with T2DM (n = 10), for which secondary comparisons with healthy obese were conducted. For this subject cohort, fasting blood sugar was >126 mg/dl, and subjects had varying numbers of additional MetS components either pharmacologically treated and managed or untreated. Medications used for glucose management included metformin and insulin glargine; no subject was taking any medications in the TZD class. For dyslipidemia management, some T2DM subjects were using simvastatin, lovastatin, ezetimibe, and niacin. For hypertension management, some T2DM group members were using one or more of atenolol, diltiazem, hydrochlorothiazide, lisinopril, furosemide, carvedilol, losartan, metoprolol, olmesartan, or valsartan.
Tensile strength.
Tensile strength was measured in fresh tissue. Tensile strength of RP WAT from WT and collagen 6a1 KO mice and sc WAT and omental WAT from human subjects was measured using a DMT560 tissue puller (Danish MyoTechnology) fitted with custom tissue clamps (Fig. 1). For mouse RP WAT, one whole fat pad per mouse, carefully dissected so as to maintain the integrity of the outer sheath of the pad, was mounted on the clamps, cranial end to the top clamp and caudal end to the bottom clamp. Dimensions of the fat pad were recorded for use in calculating tensile strength. For human WAT samples, an ∼2-cm-long surgical biopsy was clamped to the tissue puller. The tissue was pulled until complete rupture at 50 μm/s, and force and displacement were measured during the pulling. Peak force was the greatest force attained during pulling. Tensile strength is defined as peak force/tissue cross-sectional area.
Fig. 1.

Apparatus for white adipose tissue (WAT) tensile strength measurement (A) and force/displacement curve example from murine retroperitoneal (RP) WAT (B). A DMT560 tissue puller with custom clamps used for measuring peak force of fresh murine RP WAT was used to measure slope, peak force, and tensile strength (see methods). Following peak force, the tissue begins to rupture, thus resulting in variable reductions in force/displacement, as illustrated.
Gelatin zymography.
Flash-frozen RP WAT samples (mice) or sc and omental WAT (humans) were homogenized in zymography protein lysis buffer (10 mM sodium phosphate buffer, pH 7.2, 150 mM sodium chloride, 1% Triton X-100, 0.1% SDS, 0.5% sodium deoxycholate, and 0.2% sodium azide) and 100 mg of tissue/200 μl of buffer. Lysates were centrifuged at 10,000 g for 10 min to clear. Protein concentrations were quantified using the bicinchoninic protein assay (Thermo Fisher Scientific). Thirty micrograms of protein from each sample was loaded onto Novex 10% Zymogram Gelatin polyacrylamide gels in Novex Tris-Glycine SDS Sample Buffer (Life Technologies). Gels were electrophoresed in Tris-Glycine SDS buffer, renatured in renaturing buffer (Life Technologies), incubated in developing buffer (Life Technologies) at 37°C overnight, and stained. Gels were dried and scanned (GS-800 Calibrated Densitometer; Bio-Rad, Hercules, CA), and bands of clearance were analyzed by densitometry (Quantity One version 4.6.9; Bio-Rad).
Fluorogenic proteolytic activity assay.
Twenty micrograms of protein from flash-frozen WAT homogenized with zymography protein lysis buffer was assayed for proteolytic activity in 1× assay buffer (50 mM HEPES, 10 mM CaCl2, 0.05% Brij-35, pH 7.0) containing 5 μM OmniMMP fluorogenic substrate (stock 15 mM in DMSO; Enzo Life Sciences) and incubated in black 96-well plates for 24 h in the dark at room temperature. MMP proteolytic activity was measured using excitation wavelength at 320 nm and emission wavelength at 405 nm on a Molecular Devices Spectra Gemini instrument.
Histology.
WAT was fixed in 10% neutral buffered formalin then embedded in paraffin, sectioned at 6-μm thickness onto slides, and stained with Picrosirius red for collagen identification. Slides were imaged at ×20 magnification. Collagen staining and cross-sectional adipocyte area were quantified using National Institutes of Health (NIH) Image J software (version 1.46r) from 10 fields for collagen analysis and from ≥200 cells in five fields for adipocyte area measurement. Analysis was conducted in a blinded fashion.
Confocal microscopy for three-dimensional collagen imaging and quantitation.
RP WAT from WT and Col6a1 KO mice or sc WAT and omental WAT from human subjects were cut to 3 × 3 × 3 mm and fixed in 10% neutral buffered formalin, washed in PBS for 1 h, and permeabilized with 0.3% Triton X-100 in PBS for 10 min followed by 0.4 U proteinase K (Sigma) in 10 mM Tris·HCl, pH 7.4, for 5 min and then 100% methanol for 30 min. Samples were washed with 0.1% Triton X-100 in PBS 3 × 20 min, stained overnight at 4°C with 200 mg/ml 5-(4,6-dichlorotriazinyl) aminofluorescein (5-DTAF) in 0.1 M sodium bicarbonate (pH 9.0), washed with 0.1% Triton X-100 in PBS 3 × 15 min, stained for 30 min with 5 μM Bodipy 558/568 C12 (Life Technologies) in PBS, washed with PBS for 3 × 5 min, and stored in PBS at 4°C prior to imaging. Samples were imaged using a Leica SP5 AOBS scanning confocal microscope and a ×20 0.7 NA multi-immersion objective with water as the immersion liquid (5-DTAF: excitation 488 nm, emission between 496–553 nm; BODIPY: excitation 561 nm, emission between 572 and 649 nm). Images were collected in resonant scanning mode with bidirectional scanning of 16,000 Hz, with a line average of 8. Typical z-stacks were ∼100–130 μm in thickness with 1.26 μm/z-step. Total volume of DTAF positive pixels (μm3) was collected for analysis with Imaris BitPlane software.
Gene expression analysis.
Total RNA was extracted using a RiboPure Kit (Ambion, Austin, TX) per the manufacturer's protocol. RNA concentration was measured using a NanoDrop ND-1000 Spectrophotometer (NanoDrop Technologies, Wilmington, DE). One microgram of total RNA was reverse transcribed into cDNA using the SuperScript III reverse transcriptase (Invitrogen), followed by RNase H treatment according to the manufacturer's instructions. The quantitative real-time PCR assays utilized gene-specific “inventoried” TaqMan primers and FAM-MGB labeled probes (TaqMan Gene Expression Assays; Applied Biosystems, Foster City, CA) and were analyzed in triplicate for each sample using an ABI 7900HT instrument. Reactions were carried out in a 384-well format containing the following in each well: cDNA corresponding to 20 ng of original total RNA, 1× specific primer probe mix, and 1× Master Mix (ABI Taqman Gene Expression Master Mix); cDNA was air-dried in each well prior to quantitative PCR reagents being added to facilitate an 8 μl/well assay. Cycle conditions were 50°C for 2 min, 95°C for 10 min, and then 40 cycles of 95°C for 15 s/60°C for 1 min. Amplification cycle threshold (CT) number of housekeeping mRNA [hypoxanthine phosphoribosyltransferase 1; shown to be a reliable housekeeping gene in adipose tissue (19)] for each sample was determined to correct for template loading differences across all target genes (ΔCT = target gene CT − reference gene CT), and expression values were determined relative to treatment control transcript levels using a previously described mathematical formula (36).
Plasma cytokine/chemokine panel.
Plasma cytokine and chemokine analysis was performed using Meso Scale Discovery (MSD, Rockville, MD) technology multiplex electrochemiluminescence according to the manufacturer's directions. Briefly, 25 mg of EDTA venous plasma (collected during surgery) was thawed and assayed for proinflammatory cytokines (kit no. K15007C) or chemokines (kit no. K15001C) using MSD's Sector Imager 2400 machine.
Statistical analysis.
For between-group comparisons for Col6KO studies and human studies comparing healthy and MetS or healthy and T2DM subjects, Student's t-test was used with P < 0.05, which was considered significant. Unless otherwise noted, sample sizes for human studies were n = 12 (healthy) or n = 10 (MetS or T2DM); some variables differed in sample sizes due to technical issues (e.g., poor quality tissue fixation/staining or RNA) or a lack of adequate sample. Multivariate statistical modeling using partial least squares-discriminant analysis (PLS-DA) to compare healthy and MetS subjects was conducted using scaled and centered standard deviation-normalized data (SIMCA P, version 13.0; Umetrics, San Jose, CA).
RESULTS
Validation of novel tensile strength and three-dimensional imaging measurements using WAT from collagen 6a1 knockout mice.
Collagen VI is abundant in adipose tissue, and since knockout of Col6a1 significantly reduces fibrosis in obese mice (21), we reasoned that this model would display reduced tensile strength compared with WT mice and thus serve as a good positive control for the method development. Using a modified tissue puller (Fig. 1), the force parameters were found to be significantly different in the RP WAT of collagen 6a1 knockout (Col6KO) mice compared with WT mice; Col6KO mice had significantly lower RP WAT tensile strength (calculated with either an assumed rectangular or oval cross sectional area) compared with WT mice (Table 1). The peak force/WAT pad mass and peak force/WAT pad volume were also calculated. These studies established that measurement of WAT tensile strength on a tissue puller is feasible and could discriminate between groups with differing collagen content and structure.
Table 1.
Biophysical tensile strength parameters in RP WAT of WT and Col6KO mice used for methods development
| WT (n = 11) | Col6KO (n = 9) | P Value | |
|---|---|---|---|
| Tensile strength (peak force/rectangular cross-sectional area), mN/mm2 | 10.43 ± 2.49 | 5.12 ± 0.60 | 0.0442 |
| Oval tensile strength (peak force/oval cross-sectional area), mN/mm2 | 13.28 ± 3.17 | 6.52 ± 0.76 | 0.0442 |
| Fold tensile strength vs. WT | 1.00 ± 0.189 | 0.50 ± 0.05 | 0.0274 |
| Force/WAT pad mass, mN/g | 479 ± 102 | 253 ± 16 | NS |
| Force/rectangular volume, mN/mm3 | 0.74 ± 0.17 | 0.34 ± 0.03 | 0.0232 |
| Force/column volume, mN/mm3 | 0.95 ± 0.22 | 0.43 ± 0.04 | 0.0232 |
Values are means ± SE. RP, retroperitoneal; WAT, white adipose tissue; WT, wild type; Col6KO, collagen 6a1 knockout; NS, not significant.
Col6KO collagen volume by confocal microscopy.
Traditional histological approaches to visualizing and measuring collagen are limited by lack of three-dimensional information and may lead to stereoscopic bias and semiquantitative results. We wished to develop a method to measure ECM volume stereoscopically and quantitatively, and similarly to tensile strength measurements, Col6KO mice were used to validate this approach. The protein-binding chemical 5-DTAF was used as an alternative to anti-collagen antibodies (6, 20, 24, 60) since comprehensive preliminary studies with a variety of methods and antibodies indicated poor depth of antibody penetration into WAT. The murine RP WAT used for validation and analysis had the anatomic feature of a collagen sheath surrounding the fat pad (Fig. 2A); DTAF quantitation was performed without this layer included (see Fig. 2 legend). Using the 5-DTAF staining approach, we were able to quantify significantly lower collagen content in RP WAT from Col6KO mice compared with WT mice (Fig. 2B). As a validation using more traditional methods, imaging analysis of Sirius red histology on paraffin-embedded WAT sections also showed a significantly lower collagen content in sc WAT from Col6KO mice compared with WT (Fig. 2C), and although not quantified, the adipocytes in the KO mice were clearly much larger in size. These data indicate that confocal microscopy of 5-DTAF staining in a three-dimensional volume in WAT is feasible and can differentiate between models of varied collagen content. However, we were unable to use this method to differentiate collagen bundle/fibril sizes, one of our goals, because the resolution was not adequate.
Fig. 2.
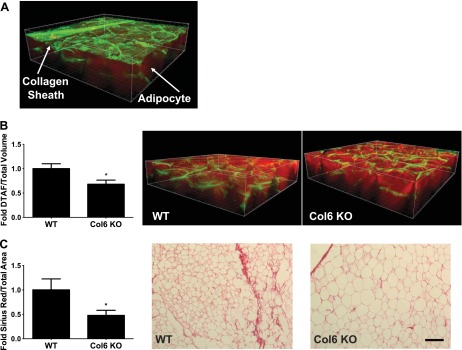
Mouse RP WAT collagen (extracellular matrix) content as measured by 5-(4,6-dichlorotriazinyl) aminofluorescein (5-DTAF) staining/confocal microscopy (A and B) and Sirius red histological staining (C): collagen is stained green (5-DTAF) and adipocytes are red (Bodipy 558/568 C12). In A, the starting image illustrating the collagen sheath typical of murine RP WAT surrounding the depot is depicted; to reduce variance and provide a more uniform method that could be applied to human WAT biopsies lacking a sheath, this layer was not included in the calculations shown in B. Values are presented as means ± SE comparing wild-type (WT) and collagen 6a1 knockout (Col6a) knockout mice. *Statistically significant at P < 0.05 by Student's t-test. Bar, 100 μm.
Clinical status markers, plasma cytokines, and WAT ECM factors in healthy obese women or those with MetS.
Subject characteristics are shown in Table 2 and have been described previously in terms of insulin resistance and elevated serum triglycerides in the MetS group (25). The obese MetS group had significantly greater serum alanine aminotransferase, a marker that increases with liver dysfunction and steatosis, and serum total protein, a measurement that increases with deterioration of liver and kidney function. The average categorical degree of steatosis was increased in the obese MetS group. With respect to adipocyte size, there was a trend for more hypertrophic adipocytes in the omental WAT from the obese MetS group compared with the obese healthy group, but this did not reach statistical significance, and there were no distinct differences in SC WAT (Fig. 3).
Table 2.
Clinical characteristics of obese healthy women and those with MetS characterized for WAT ECM, metabolic, and inflammatory phenotypes*
| Healthy Obese n = 12 | MetS Obese n = 10 | P Value | |
|---|---|---|---|
| Age, yr | 39 ± 3.6 | 41 ± 3.4 | NS |
| BMI | 40.5 ± 1.0 | 43.6 ± 2.3 | NS |
| Plasma glucose, mg/dl | 88 ± 1 | 101 ± 3 | 0.0006 |
| Serum insulin, μU/ml | 14 ± 1 | 53 ± 17 | 0.016 |
| QUICKI | 0.327 ± 0.004 | 0.277 ± 0.006 | <0.0001 |
| Triglycerides, mg/dl | 85 ± 7 | 132 ± 15 | 0.009 |
| Total cholesterol, mg/dl | 191 ± 13 | 184 ± 11 | NS |
| LDL cholesterol, mg/dl | 125 ± 11 | 113 ± 9 | NS |
| HDL cholesterol, mg/dl | 49 ± 2.9 | 44 ± 4.4 | NS |
| Systolic BP, mmHg | 123 ± 2.3 | 130 ± 4.3 | NS |
| Diastolic BP, mmHg | 73 ± 1.3 | 77 ± 1.8 | NS |
| Serum ALT, IU/l | 24 ± 3 | 45 ± 9 | 0.025 |
| Serum AST, IU/l | 21 ± 2 | 41 ± 11 | NS |
| Steatosis** | 0.5 ± 0.2 | 1.2 ± 0.3 | 0.048 |
| Serum protein, g/dl | 7.1 ± 0.1 | 7.6 ± 0.2 | 0.003 |
| hsCRP, mg/l | 0.8 ± 0.2 | 0.8 ± 0.2 | NS |
Data are presented as means ± SE. MetS, metabolic syndrome; ECM, extracellular matrix; BMI, body mass index; QUICKI, quantitative insulin sensitivity check index, calculated as 1/[log (insulin μU/ml) + log (glucose mg/dl)]; BP, blood pressure; ALT, alanine aminotransferase; AST, aspartate aminotransferase; hsCRP, high-sensitivity C-reactive protein.
Clinical values are in the overnight-fasted state taken 1–2 wk before bariatric surgery.
Blinded clinical pathology score derived from histology of surgical liver biopsy (scale 0–3: 0 = none, <5% steatosis; 1 = mild, 5–33% steatosis; 2 = moderate, 34–66% steatosis; 3 = severe, >66% steatosis); n = 11 for healthy steatosis score. Comparisons with P < 0.05 by Student's t-test are considered significantly different. Significant values are in boldface.
Fig. 3.
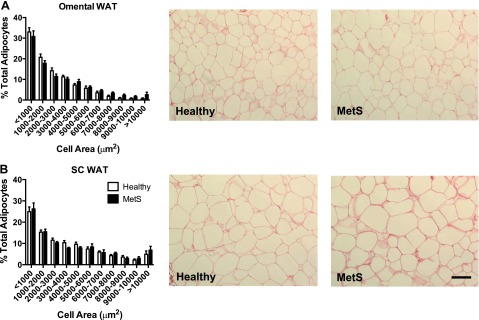
Healthy and metabolic syndrome (MetS) obese human adipocyte size distribution analysis. Adipocyte area was measured from Sirius red-stained paraffin sections of omental WAT (A) and subcutaneous (sc) WAT surgical biopsies (B). Bars indicate %total cells within the specified cell area range, shown as means ± SE. There were no statistically significant differences between healthy and MetS obese within the same size category, as determined by 1-way ANOVA followed by Tukey's post hoc test. Line in histology images indicates 100 μm at ×20 magnification.
Since metabolic dysfunction can involve inflammation and immune cells such as macrophages are important participants in ECM remodeling, a suite of inflammation-related blood analytes and WAT gene transcript levels were measured. These included macrophage markers, proinflammatory cytokines, and anti-inflammatory cytokines. As expected, the MetS obese group had significantly increased plasma IFNγ and TNFα compared with the healthy obese group (Table 3). None of the other measured plasma cytokines or chemokines differed significantly between the healthy obese and MetS obese groups, although most concentrations were increased in absolute terms. MetS was also characterized by increased transcript abundances for the WAT inflammation and pan-macrophage infiltration marker CD68 (Table 4). In omental WAT, upward trends in other inflammation-related transcripts were not statistically significant, which was probably due to high person-to-person variability and a limited sample size. In sc WAT, mRNA abundances for CD68 and integrin αX (ITGAX; CD11c) were increased in the MetS group, but these trends did not reach statistical significance (Table 4).
Table 3.
Plasma concentrations of cytokines and chemokines in healthy obese women compared with those with MetS*
| Healthy Obese n = 11 | MetS Obese n = 9 | P Value | |
|---|---|---|---|
| GM-CSF | 0.083 ± 0.047 | 0.038 ± 0.032 | 0.47 |
| IFN-γ | 0.59 ± 0.15 | 1.60 ± 0.42 | 0.02 |
| IL-1β | 0.40 ± 0.056 | 0.63 ± 0.18 | 0.21 |
| IL-2 | 0.067 ± 0.027 | 0.32 ± 0.24 | 0.26 |
| IL-6 | 3.01 ± 0.46 | 3.71 ± 0.49 | 0.31 |
| IL-8 | 8.0 ± 0.8 | 9.8 ± 1.0 | 0.16 |
| IL-10 | 1.62 ± 0.17 | 2.27 ± 0.35 | 0.09 |
| IL-12p70 | 0.15 ± 0.043 | 0.59 ± 0.29 | 0.11 |
| IP-10 | 215 ± 32 | 263 ± 60 | 0.47 |
| TNFα | 2.93 ± 0.31 | 4.83 ± 0.43 | 0.002 |
| Eotaxin | 618 ± 79 | 607 ± 95 | 0.93 |
| Eotaxin-3 | 3.9 ± 0.82 | 5.0 ± 1.1 | 0.453 |
| MCP-1 | 272.2 ± 26.4 | 315.2 ± 41.9 | 0.38 |
| MCP-4 | 1,203.6 ± 159.4 | 1,316.2 ± 201.0 | 0.66 |
| MDC | 4,330 ± 563 | 4,380 ± 684 | 0.95 |
| MIP-1β | 133.6 ± 11.1 | 138.2 ± 25.2 | 0.86 |
| TARC | 702 ± 202 | 510 ± 147 | 0.47 |
Values are presented as means ± SE; units for all cytokines and chemokines are in pg/ml. GM-CSF, granulocyte macrophage-colony stimulating factor; MCP-1, monocyte chemoattractant protein-1; MDC, macrophage-derived chemokine; MIP-1β, macrophage inflammatory protein-1β; TARC, thymus and activation-regulated chemokine/CCL17.
Samples were collected at the time of bariatric surgery. Comparisons with P < 0.05 by Student's t-test are considered significantly different, and there was a trend (P < 0.1) for altered IL-10 concentrations between groups (values in boldface).
Table 4.
WAT inflammation-associated gene expression in healthy obese women compared with those with MetS*
| Healthy Obese | MetS Obese | P Value | |
|---|---|---|---|
| Omental WAT | |||
| CD68 | 100.0 ± 13.7 | 197.0 ± 44.6* | 0.03 |
| ITGAX | 100.0 ± 20.2 | 179.5 ± 50.4 | 0.13 |
| ITGAD | 100.0 ± 30.2 | 166.2 ± 50.5 | 0.26 |
| TNF | 100.0 ± 14.5 | 103.1 ± 37.0 | 0.93 |
| IL6 | 100.0 ± 88.7 | 185.5 ± 106.7 | 0.54 |
| IL1B | 100.0 ± 31.0 | 125.9 ± 30.8 | 0.57 |
| CCL2 | 100.0 ± 37.5 | 71.3 ± 15.8 | 0.52 |
| NOS2 | 100.0 ± 21.3 | 103.5 ± 37.6 | 0.93 |
| THBS1 | 100.0 ± 21.7 | 125.3 ± 26.9 | 0.47 |
| TGFB1 | 100.0 ± 19.2 | 161.1 ± 31.5 | 0.10 |
| ARG2 | 100.0 ± 29.2 | 98.3 ± 23.6 | 0.97 |
| sc WAT | |||
| CD68 | 100.0 ± 15.9 | 191.1 ± 46.7 | 0.06 |
| ITGAX | 100.0 ± 19.2 | 354.6 ± 150.8 | 0.08 |
| ITGAD | 100.0 ± 29.7 | 120.2 ± 45.8 | 0.70 |
| TNF | 100.0 ± 21.6 | 130.2 ± 37.3 | 0.47 |
| IL6 | 100.0 ± 90.5 | 17.7 ± 10.5 | 0.44 |
| IL1B | 100.0 ± 23.1 | 72.4 ± 38.0 | 0.53 |
| CCL2 | 100.0 ± 22.4 | 64.0 ± 33.5 | 0.37 |
| NOS2 | 100.0 ± 15.3 | 85.5 ± 25.9 | 0.62 |
| THBS1 | 100.0 ± 21.7 | 69.0 ± 16.2 | 0.30 |
| TGFB1 | 100.0 ± 13.7 | 102.6 ± 18.3 | 0.91 |
| ARG2 | 100.0 ± 16.7 | 64.5 ± 14.8 | 0.15 |
Values are presented as means ± SE. ITGAX, integrin αX; ITGAD, integrin αD; CCL2, C-C motif ligand 2; NOS2, nitric oxide synthase; THBS1, thrombospondin-1; TGFB1, transforming growth factor-B1; ARG2, arginase 2; sc, subcutaneous.
mRNA abundances measured in a subset of subjects with available samples, expressed as percent of healthy obese group mean (for omental WAT: n = 11 and 9 in healthy and MetS groups, respectively; for sc WAT: n = 9 and 7 for healthy and MetS, respectively, for mRNA). Values that differ significantly (P < 0.05) or display trends (P < 0.1) by Student's t-test are indicated in boldface.
We next sought to further refine the MetS metabolic phenotype from that of healthy weight-matched obese subjects through determinations of omental and sc WAT ECM parameters such as tensile strength, three-dimensional measurements of collagen content, and zymography. There was a 19% reduction in omental WAT tensile strength in MetS subjects that was not statistically significant, and there were no significant differences between MetS and healthy controls with respect to omental or sc MMP activities and collagen content as measured by three-dimensional confocal microscopy (Tables 5 and 6). Interestingly, there were distinct depot-related differences when omental and sc WAT ECM properties were compared directly regardless of disease status, with omental WAT displaying significantly greater tensile strength (Table 7). In healthy individuals, but not in MetS subjects, pro-MMP-9 activity was higher and overall MMP activity derived from an OmniMMP assay lower in sc WAT compared with omental. This suggests that MetS somehow attenuates WAT depot differences in these parameters.
Table 5.
Omental WAT ECM parameters in healthy obese women and those with MetS
| Healthy Obese | MetS Obese | P Value | |
|---|---|---|---|
| Tensile strength, mN/mm2 | 34.7 ± 4.2 | 28.3 ± 4.4 | 0.31 |
| Sirius red (collagen) | 5,180 ± 1,880 | 5,404 ± 1,909 | 0.93 |
| DTAF (collagen/ECM) | 0.077 ± 0.010 | 0.073 ± 0.011 | 0.82 |
| Zymography (AU) | |||
| Pro-MMP-9 | 0.59 ± 0.13 | 0.70 ± 0.14 | 0.59 |
| Pro-MMP-2 | 0.99 ± 0.40 | 0.70 ± 0.14 | 0.52 |
| OmniMMP* | 667 ± 54 | 514 ± 113 | 0.21 |
| Gene expression** | |||
| COL1A2 | 100.0 ± 12.3 | 88.0 ± 12.2 | 0.50 |
| COL3A1 | 100.0 ± 13.1 | 80.0 ± 13.3 | 0.29 |
| COL5A2 | 100.0 ± 10.7 | 79.7 ± 13.9 | 0.25 |
| COL6A3 | 100.0 ± 12.2 | 64.0 ± 9.6 | 0.04 |
| COL8A1 | 100.0 ± 15.8 | 121.5 ± 37.9 | 0.58 |
| ELN | 100.0 ± 9.6 | 115.3 ± 22.2 | 0.51 |
| TNC | 100.0 ± 25.3 | 98.8 ± 21.8 | 0.97 |
| BGN | 100.0 ± 13.8 | 93.5 ± 16.8 | 0.77 |
| DCN | 100.0 ± 14.9 | 90.5 ± 9.7 | 0.62 |
| LUM | 100.0 ± 13.5 | 113.4 ± 19.8 | 0.57 |
| FBN1 | 100.0 ± 16.6 | 99.7 ± 21.6 | 0.99 |
| MFAP5 | 100.0 ± 21.1 | 113.4 ± 35.4 | 0.74 |
| MMP-2 | 100.0 ± 12.4 | 90.2 ± 18.4 | 0.65 |
| MMP-7 | 100.0 ± 59.9 | 112.6 ± 29.2 | 0.86 |
| MMP-9 | 100.0 ± 36.5 | 100.2 ± 25.4 | 0.99 |
| MMP-14 | 100.0 ± 11.2 | 92.9 ± 15.6 | 0.71 |
| CTSK | 100.0 ± 14.6 | 102.3 ± 12.3 | 0.91 |
| CTSL1 | 100.0 ± 14.5 | 104.9 ± 19.3 | 0.84 |
| CTSS | 100.0 ± 19.2 | 155.7 ± 43.8 | 0.23 |
| SERPINE1 | 100.0 ± 35.1 | 368.1 ± 113.6 | 0.02 |
| PLAUR | 100.0 ± 18.8 | 155.8 ± 26.6 | 0.09 |
Data are presented as means ± SE; n = 10 and n = 9 for healthy Sirius red and pro-matrix metalloproteinase-2 (MMP-2), respectively, and n = 9, 6, and 8 for MetS tensile strength, 5-(4,6-dichlorotriazinyl) aminofluorescein (5-DTAF), and pro-MMP-2, respectively. AU, arbitrary units; CTSK, cathepsin K; CTSL1, cathepsin L1; CTSS, cathepsin S;
OmniMMP units are emission at 405 nm minus blank.
mRNA abundances measured in a subset of subjects with available samples, expressed as percent of healthy obese group mean (n = 11 and 9 in healthy and MetS groups, respectively, for mRNA). Comparisons with P < 0.05 by Student's t-test are considered significantly different, and there was a trend for PLAUR (in boldface).
Table 6.
Subcuteanous WAT ECM parameters in healthy obese women compared with those with MetS
| Healthy Obese | MetS Obese | P Value | |
|---|---|---|---|
| Tensile strength, mN/mm2 | 13.7 ± 2.5 | 10.4 ± 2.3 | 0.36 |
| Sirius red (collagen) | 1,688 ± 386 | 1,326 ± 498 | 0.57 |
| DTAF (collagen/ECM) | 0.095 ± 0.010 | 0.092 ± 0.017 | 0.88 |
| Zymography (AU) | |||
| Pro-MMP-9 | 1.20 ± 0.23 | 0.88 ± 0.13 | 0.30 |
| Pro-MMP-2 | 0.68 ± 0.22 | 0.89 ± 0.18 | 0.49 |
| OmniMMP* | 492 ± 52 | 629 ± 135 | 0.31 |
| Gene Expression** | |||
| COL1A2 | 100.0 ± 17.2 | 81.9 ± 18.7 | 0.49 |
| COL3A1 | 100.0 ± 12.7 | 78.3 ± 10.9 | 0.23 |
| COL5A2 | 100.0 ± 20.4 | 72.2 ± 8.8 | 0.28 |
| COL6A3 | 100.0 ± 19.9 | 73.7 ± 12.2 | 0.31 |
| COL8A1 | 100.0 ± 16.4 | 77.2 ± 25.9 | 0.45 |
| ELN | 100.0 ± 22.2 | 116.5 ± 38.7 | 0.70 |
| TNC | 100.0 ± 25.7 | 94.7 ± 10.7 | 0.87 |
| BGN | 100.0 ± 6.2 | 108.0 ± 27.9 | 0.76 |
| DCN | 100.0 ± 17.8 | 87.1 ± 21.1 | 0.65 |
| LUM | 100.0 ± 17.7 | 107.8 ± 36.4 | 0.84 |
| FBN1 | 100.0 ± 17.3 | 92.2 ± 24.0 | 0.79 |
| MFAP5 | 100.0 ± 24.4 | 109.2 ± 25.3 | 0.80 |
| MMP2 | 100.0 ± 24.5 | 103.9 ± 25.3 | 0.91 |
| MMP7 | 100.0 ± 23.3 | 328.2 ± 139.3 | 0.09 |
| MMP9 | 100.0 ± 17.5 | 250.0 ± 114.9 | 0.16 |
| MMP14 | 100.0 ± 19.0 | 107.2 ± 34.5 | 0.85 |
| CTSK | 100.0 ± 11.8 | 87.8 ± 23.3 | 0.62 |
| CTSL1 | 100.0 ± 8.7 | 92.3 ± 16.5 | 0.67 |
| CTSS | 100.0 ± 9.3 | 173.8 ± 41.1 | 0.07 |
| SERPINE1 | 100.0 ± 35.5 | 97.4 ± 17.4 | 0.95 |
| PLAUR | 100.0 ± 15.9 | 121.7 ± 31.0 | 0.51 |
Data are presented as means ± SE; n = 11 and n = 9 for healthy tensile strength and Sirius red, and n = 5–9 for MetS tensile strength, Sirius red, 5-DTAF, and MMP measurements.
OmniMMP units are emission at 405 nm minus blank.
mRNA abundances measured in a subset of subjects with available samples, expressed as percent of healthy obese group mean (n = 9 and 7 for healthy and MetS, respectively, for mRNA). Statistical comparisons by Student's t-test; there were potential trends (P < 0.1) in MMP-7 and CTSS (values shown in boldface). One healthy subject had a Sirius red value of 122,296 and was thus excluded as an outlier.
Table 7.
Comparison of sc and omental WAT ECM parameters in healthy obese women compared with those with MetS
| Healthy Obese | MetS Obese | |
|---|---|---|
| Tensile strength (omental) | 34.7 ± 4.2 | 28.3 ± 4.4 |
| Tensile strength (sc) | 13.7 ± 2.5*** | 10.4 ± 2.3** |
| DTAF (omental) | 0.077 ± 0.010 | 0.073 ± 0.011 |
| DTAF (sc) | 0.095 ± 0.010 | 0.092 ± 0.017 |
| Zymography | ||
| Pro-MMP-9 (omental) | 0.59 ± 0.13 | 0.70 ± 0.14 |
| Pro-MMP-9 (sc) | 1.20 ± 0.23* | 0.88 ± 0.13 |
| Pro-MMP-2 (omental) | 0.99 ± 0.40 | 0.70 ± 0.14 |
| Pro-MMP-2 (sc) | 0.68 ± 0.22 | 0.89 ± 0.18 |
| OmniMMP (omental) | 667 ± 54 | 514 ± 113 |
| OmniMMP (sc) | 492 ± 52* | 629 ± 135 |
Values are presented as means ± SE. Units: tensile strength (mN/mm2), 5-DTAF (μm3), MMP-9, and MMP-2 (arbitrary densitometry units); OmniMMP (emission at 405 nm; blank value). Significantly different from omental (
P < 0.05,
P < 0.01, and
P < 0.001). Significant values are in boldface.
Development of a phenotype “signature” of MetS using multivariate statistical modeling.
There are limitations in the sole use of iterative pairwise comparisons of individual outcome variables since variation in some factors that do not achieve statistical significance may nevertheless contribute to the phenotypic discrimination of groups. To account for these shortcomings and to understand which phenotypic variables best discriminate between healthy and unhealthy obesity, we leveraged PLS-DA multivariate statistical modeling of all clinical, ECM, and inflammation parameters in healthy and MetS subjects in the study. Typically, parameters with a PLS-DA variable influence on projection (VIP) score >1 explain most of the variance between groups, whereas those with 1 > VIP > 0.5 may also contribute, but with less confidence. Using a VIP cutoff of 0.8 and greater, features were selected from an initial PLS-DA model to derive a new model that best discriminated the subject cohorts (Fig. 4A). The subject scores plot derived from these variables (Fig. 4A) illustrates that variance in this subset of factors contributed to distinct separation of the individual subjects into their respective groups, providing a phenotype “signature” of MetS. A depiction of the relative contributions of specific variables to subject group separation is shown as the factor loadings plot in Fig. 4B.
Fig. 4.
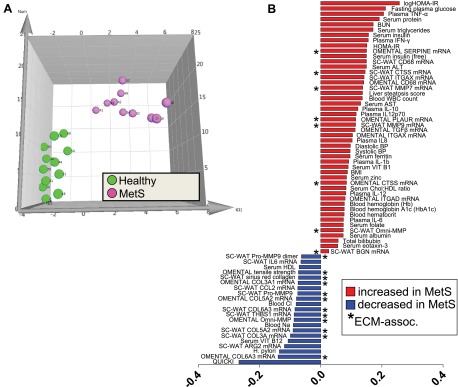
Results from partial least squares-discriminant analysis (PLS-DA) modeling of clinical and WAT phenotype variables to identify features that differentiate healthy obese and MetS obese women. A: subjects scores plot illustrating individuals from the healthy (green) and MetS (pink) cohorts, showing separation of groups along latent variable 1 dimension (x-axis). B: scores separation along the x-axis dimension in A was explained primarily by variance in features depicted in the loadings plot. HOMA-IR, homeostasis model assessment of insulin resistance; BUN, blood urea nitrogren; ALT, alanine aminotransferase; CTSS, cathepsin S; ITGAX, integrin αX; MMP-7 and -9, matrix metalloproteinase-7 and -9, respectively; WBC, white blood cell; AST, aspartate aminotransferase; BP, blood pressure; ITGAD, integrin αD; BGN, biglycan; THBS1, thrombospondin-1; QUICKI, quantitative insulin sensitivity check index; ARG2, arginase 2; ECM, extracellular matrix.
As anticipated, features such as insulin sensitivity indices (e.g., quantitative insulin sensitivity check index, HOMA-IR) and certain plasma and adipose inflammation markers [e.g., plasma cytokines and chemokines and WAT mRNAs for the pan-macrophage cell surface marker CD68 as well as the M1 marker ITGAX (CD11c)] strongly contributed to the model differentiating MetS from healthy obesity (Fig. 4B). The absolute values of these parameters also tracked MetS status in an expected direction since MetS is associated with insulin resistance and inflammation (see associated tables). Transcript for ARG2 (arginase 2; a marker associated with alternatively activated M2 macrophages) was included in the model, and its expression was reduced in MetS sc WAT, consistent with a proinflammatory state. The model factor serum ferritin has been reported to be associated with many insulin-resistant states, including T2DM, metabolic syndrome, gestational diabetes, and polycystic ovarian syndrome as an acute phase protein (40), and was increased in MetS. Subjects' clinical pathology liver steatosis scores contributed to the model, and the value of this factor was increased in MetS.
Twenty ECM-relevant parameters also contributed to the PLS-DA model (asterisks in Fig. 4B factor loadings plot), indicating important MetS-associated changes in both omental and sc ECM. For instance, mRNA abundance of CTSS (cathepsin S; a member of the peptidase C1 family) in both omental and sc WAT was part of the MetS phenotype signature, and this factor was higher in MetS compared with healthy obese. MMP-9, an MMP expressed abundantly by immune cells, also contributed to the model distinguishing MetS and healthy obese subjects. Notably, there were lower activities of both pro-MMP-9 and pro-MMP-9 dimer in MetS sc WAT, as measured by gelatin zymography despite higher MMP-9 mRNA abundance. mRNA expression levels for sc WAT MMP7 and SERPINE (PAI-1) also contributed to the MetS phenotype model and displayed higher expression in MetS. Results from the OmniMMP assay that measures nonspecific MMP activity helped drive separation of the groups, and it was interesting that sc and omental WAT displayed contrasting directionality in the MetS subjects relative to healthy obese women (Fig. 4B). With respect to collagen, despite no differences in gross collagen content by DTAF staining or Sirius red histology (Tables 5 and 6), mRNA abundances of a variety of collagens in both sc and omental WAT were important contributors to the model distinguishing healthy and MetS subjects (Fig. 4B). Generally speaking, WAT collagen mRNA expression levels were reduced in MetS and contributed to the model (e.g., COL3A1, COL5A2, and COL6A3). Interestingly, omental WAT tensile strength was also included in the model.
There were several clinical measurements of micronutrient status whose variances contributed to the MetS phenotype separation. These included vitamins B1 (thiamine) and B12, serum zinc, Na, and Cl, although all mean values fell within normal reference ranges.
Development of an ECM, metabolic, and inflammation phenotype profile of T2DM using multivariate statistical modeling.
Our primary focus was to compare healthy and MetS subjects free of medications that might impact ECM biology. However, we also took advantage of the opportunity to examine ECM and other parameters in a cohort of T2DM patients undergoing bariatric surgery in a secondary analysis of potential diabetes-associated changes in WAT. The clinical characteristics of this group compared with the healthy subjects, as well as a comparison of plasma cytokines, are provided in Tables 8 and 9, respectively. In addition to the expected perturbations in insulin and glucose homeostasis, liver steatosis score was increased in T2DM subjects, and plasma cytokines were generally increased (albeit with high variability and only statistically significant for IL-10 and IP-10). WAT inflammation markers are presented in Table 10, and as for MetS subjects, T2DM women had increased mRNA expression of CD68 in omental but not sc WAT. Notably, ARG2, an M2 macrophage marker, was significantly reduced in sc but not omental WAT in T2DM. Differences in omental and sc WAT ECM parameters between healthy and T2DM subjects are provided in Tables 11 and 12, respectively. As with MetS subjects, a wide variety of ECM-related transcripts in both sc and omental WAT were altered (e.g., collagen transcripts were generally reduced, and MMPs and inflammation/macrophage markers were generally increased), and there was a 24% reduction in omental WAT tensile strength reminiscent of that observed in MetS subjects. Many of these ECM factors contributed to the PLS-DA model that discriminated T2DM from healthy subjects (Fig. 5, A and B). Omental tensile strength was included in the model, as were other expected clinical markers of metabolic dysfunction and inflammation, including insulin resistance indices and Hb A1c, serum triglycerides, and liver steatosis score.
Table 8.
Clinical characteristics of obese healthy and T2DM women
| Healthy Obese n = 12 | T2DM Obese n = 10 | P Value | |
|---|---|---|---|
| Age, yr | 39 ± 3.6 | 46 ± 3.3 | 0.22 |
| BMI | 40.5 ± 1.0 | 40.8 ± 1.9 | 0.88 |
| Plasma glucose, mg/dl | 88 ± 1.2 | 139 ± 12.2 | 0.0001 |
| Serum insulin, μU/ml | 14 ± 1.1 | 35 ± 5.2 | 0.0002 |
| QUICKI | 0.327 ± 0.004 | 0.278 ± 0.007 | <0.0001 |
| Triglycerides, mg/dl | 85 ± 7.4 | 267 ± 81.0 | 0.018 |
| Total cholesterol mg/dl | 191 ± 13 | 192 ± 15 | 0.96 |
| LDL cholesterol, mg/dl | 125 ± 11 | 104 ± 12 | 0.21 |
| HDL cholesterol, mg/dl | 49 ± 2.9 | 46 ± 5.1 | 0.59 |
| Systolic BP, mmHg | 123 ± 2.3 | 130 ± 3.8 | 0.10 |
| Diastolic BP, mmHg | 73 ± 1.3 | 77 ± 2.8 | 0.23 |
| Serum ALT, IU/l | 24 ± 3 | 25 ± 4 | 0.81 |
| Serum AST, IU/l | 21 ± 2 | 24 ± 2 | 0.13 |
| Steatosis* | 0.5 ± 0.2 | 1.3 ± 0.2 | 0.01 |
| Serum protein, g/dl | 7.1 ± 0.1 | 7.2 ± 0.1 | 0.52 |
| hsCRP, mg/l | 0.8 ± 0.2 | 0.7 ± 0.2 | 0.72 |
Data are presented as means ± SE. Healthy obese values are from Table 2; n = 10 for T2DM, except n = 9 for clinical chemistries. T2DM, type 2 diabetic. Clinical values are in the overnight-fasted state taken 1–2 wk before bariatric surgery.
Blinded clinical pathology score derived from histology of surgical liver biopsy (scale 0–3; 0 = none, <5% steatosis; 1 = mild, 5–33% steatosis; 2 = moderate, 34-66% steatosis; 3 = severe, >66% steatosis). Comparisons with P < 0.05 by Student's t-test are considered significantly different. QUICKI is calculated as 1/[log (insulin μU/ml) + log (glucose mg/dl)]. Significant values are in boldface.
Table 9.
Plasma concentrations of cytokines in obese healthy and T2DM women*
| Healthy Obese | T2DM Obese | P Value | |
|---|---|---|---|
| GM-CSF | 0.083 ± 0.047 | 0.109 ± 0.062 | 0.74 |
| IFNγ | 0.59 ± 0.15 | 1.63 ± 0.87 | 0.23 |
| IL-1β | 0.40 ± 0.056 | 0.40 ± 0.090 | 0.96 |
| IL-2 | 0.067 ± 0.027 | 0.150 ± 0.051 | 0.15 |
| IL-6 | 3.01 ± 0.46 | 4.71 ± 1.04 | 0.14 |
| IL-8 | 8.0 ± 0.8 | 10.2 ± 1.4 | 0.17 |
| IL-10 | 1.62 ± 0.17 | 2.35 ± 0.32 | 0.05 |
| IL-12p70 | 0.15 ± 0.043 | 0.25 ± 0.076 | 0.26 |
| IP-10 | 215 ± 32 | 428 ± 93 | 0.04 |
| TNFα | 2.93 ± 0.31 | 7.32 ± 2.92 | 0.13 |
| Eotaxin | 618 ± 79 | 761 ± 106 | 0.29 |
| Eotaxin-3 | 3.9 ± 0.82 | 3.2 ± 0.54 | 0.47 |
| MCP-1 | 272.2 ± 26.4 | 327.6 ± 33.7 | 0.21 |
| MCP-4 | 1,203.6 ± 159.4 | 1,374.0 ± 300.5 | 0.61 |
| MDC | 4,330 ± 563 | 5,003 ± 562 | 0.41 |
| MIP-1β | 133.6 ± 11.1 | 137.7 ± 17.7 | 0.84 |
| TARC | 702 ± 202 | 882 ± 277 | 0.60 |
Values are presented as means ± SE. Plasma concentration units are pg/ml; n = 11 and 10 for healthy and T2DM subjects, respectively.
Samples collected at the time of bariatric surgery. Comparisons with P < 0.05 by Student's t-test are considered significantly different and are indicated in boldface.
Table 10.
WAT inflammation-associated gene expression in obese healthy and T2DM women*
| Healthy Obese | T2DM Obese | P Value | |
|---|---|---|---|
| Omental WAT | |||
| CD68 | 100.0 ± 13.7 | 219.9 ± 47.1 | 0.02 |
| ITGAX | 100.0 ± 20.2 | 263.9 ± 64.8 | 0.02 |
| ITGAD | 100.0 ± 30.2 | 126.9 ± 31.4 | 0.55 |
| TNF | 100.0 ± 14.5 | 232.3 ± 106.9 | 0.19 |
| IL6 | 100.0 ± 88.7 | 62.6 ± 23.0 | 0.71 |
| IL1B | 100.0 ± 31.0 | 196.7 ± 47.9 | 0.10 |
| CCL2 | 100.0 ± 37.5 | 117.9 ± 35.2 | 0.74 |
| NOS2 | 100.0 ± 21.3 | 146.3 ± 35.3 | 0.26 |
| THBS1 | 100.0 ± 21.7 | 83.8 ± 17.6 | 0.58 |
| TGFB1 | 100.0 ± 19.2 | 177.2 ± 36.5 | 0.06 |
| ARG2 | 100.0 ± 29.2 | 97.2 ± 24.2 | 0.94 |
| sc WAT | |||
| CD68 | 100.0 ± 15.9 | 104.4 ± 17.3 | 0.85 |
| ITGAX | 100.0 ± 19.2 | 122.8 ± 43.3 | 0.62 |
| ITGAD | 100.0 ± 29.7 | 82.2 ± 34.0 | 0.71 |
| TNF | 100.0 ± 21.6 | 67.3 ± 15.1 | 0.24 |
| IL6 | 100.0 ± 90.5 | 18.3 ± 5.7 | 0.41 |
| IL1B | 100.0 ± 23.1 | 71.2 ± 20.9 | 0.37 |
| CCL2 | 100.0 ± 22.4 | 79.2 ± 24.7 | 0.54 |
| NOS2 | 100.0 ± 15.3 | 84.0 ± 22.0 | 0.55 |
| THBS1 | 100.0 ± 21.7 | 41.2 ± 8.3 | 0.03 |
| TGFB1 | 100.0 ± 13.7 | 84.5 ± 16.3 | 0.47 |
| ARG2 | 100.0 ± 16.7 | 57.7 ± 9.2 | 0.05 |
Values are presented as means ± SE.
mRNA abundances measured in a subset of subjects with available samples, expressed as percent of healthy obese group mean (n = 11 and 9 for omental; n = 9 and 8 for sc WAT in healthy and T2DM, respectively). Values that differ significantly (P < 0.05) or display potential trends (P < 0.1) by Student's t-test are indicated in boldface.
Table 11.
Omental WAT ECM parameters in obese healthy and T2DM women
| Healthy Obese | T2DM Obese | P Value | |
|---|---|---|---|
| Tensile strength, mN/mm2 | 34.7 ± 4.2 | 26.5 ± 4.4 | 0.20 |
| Sirius red | 5,180 ± 1,880 | 9,786 ± 3,698 | 0.27 |
| DTAF (collagen/ECM) | 0.077 ± 0.010 | 0.076 ± 0.007 | 0.92 |
| Zymography (AU) | |||
| Pro-MMP-9 | 0.59 ± 0.13 | 0.93 ± 0.30 | 0.27 |
| Pro-MMP-2 | 0.99 ± 0.40 | 1.53 ± 0.64 | 0.46 |
| OmniMMP* | 667 ± 54 | 187 ± 85 | 0.26 |
| Gene Expression** | |||
| COL1A2 | 100.0 ± 12.3 | 106.6 ± 15.2 | 0.73 |
| COL3A1 | 100.0 ± 13.1 | 102.0 ± 11.5 | 0.91 |
| COL5A2 | 100.0 ± 10.7 | 96.1 ± 14.3 | 0.82 |
| COL6A3 | 100.0 ± 12.2 | 55.3 ± 12.9 | 0.02 |
| COL8A1 | 100.0 ± 15.8 | 80.6 ± 28.1 | 0.54 |
| ELN | 100.0 ± 9.6 | 128.8 ± 31.4 | 0.36 |
| TNC | 100.0 ± 25.3 | 292.2 ± 174.8 | 0.24 |
| BGN | 100.0 ± 13.8 | 109.5 ± 16.7 | 0.66 |
| DCN | 100.0 ± 14.9 | 90.2 ± 12.4 | 0.63 |
| LUM | 100.0 ± 13.5 | 118.9 ± 23.4 | 0.47 |
| FBN1 | 100.0 ± 16.6 | 110.4 ± 22.7 | 0.71 |
| MFAP5 | 100.0 ± 21.1 | 178.0 ± 51.6 | 0.15 |
| MMP2 | 100.0 ± 12.4 | 82.1 ± 24.6 | 0.50 |
| MMP7 | 100.0 ± 59.9 | 296.4 ± 146.5 | 0.20 |
| MMP9 | 100.0 ± 36.5 | 181.5 ± 52.3 | 0.21 |
| MMP14 | 100.0 ± 11.2 | 80.7 ± 11.5 | 0.25 |
| CTSK | 100.0 ± 14.6 | 83.2 ± 16.5 | 0.45 |
| CTSL1 | 100.0 ± 14.5 | 86.0 ± 8.1 | 0.44 |
| CTSS | 100.0 ± 19.2 | 169.8 ± 28.0 | 0.05 |
| SERPINE1 | 100.0 ± 35.1 | 479.7 ± 206.9 | 0.06 |
| PLAUR | 100.0 ± 18.8 | 142.9 ± 22.9 | 0.16 |
Values are presented as means ± SE. Healthy obese values are from Table 5; n = 9 for T2DM tensile strength, Sirius red, and 5-DTAF, and n = 6 for pro-MMP-2. OmniMMP units are emission at 405 nm minus blank;
mRNA abundances measured in a subset of subjects with available samples, expressed as percent of healthy obese group mean (n = 11 and 9 for healthy and T2DM groups, respectively, for mRNA). Values that differ significantly (P < 0.05) or display potential trends (P < 0.1) by Student's t-test are indicated in boldface.
Table 12.
Subcutaneous WAT ECM parameters in obese healthy and T2DM women
| Healthy Obese | T2DM Obese | P Value | |
|---|---|---|---|
| Tensile strength, mN/mm2 | 13.7 ± 2.5 | 10.5 ± 2.5 | 0.38 |
| Sirius red | 1,688 ± 386 | 19,595 ± 10,169 | 0.80 |
| DTAF (collagen/ECM) | 0.095 ± 0.010 | 0.097 ± 0.008 | 0.89 |
| Zymography (AU) | |||
| Pro-MMP-9 | 1.20 ± 0.23 | 1.00 ± 0.24 | 0.56 |
| Pro-MMP-2 | 0.68 ± 0.22 | 0.74 ± 0.16 | 0.84 |
| OmniMMP* | 492 ± 52 | 874 ± 118 | 0.005 |
| Gene Expression** | |||
| COL1A2 | 100.0 ± 17.2 | 95.2 ± 16.6 | 0.84 |
| COL3A1 | 100.0 ± 12.7 | 96.7 ± 15.0 | 0.87 |
| COL5A2 | 100.0 ± 20.4 | 67.2 ± 11.7 | 0.20 |
| COL6A3 | 100.0 ± 19.9 | 61.0 ± 11.8 | 0.12 |
| COL8A1 | 100.0 ± 16.4 | 28.0 ± 8.1 | 0.002 |
| ELN | 100.0 ± 22.2 | 40.2 ± 8.7 | 0.03 |
| TNC | 100.0 ± 25.7 | 73.9 ± 16.6 | 0.42 |
| BGN | 100.0 ± 6.2 | 98.7 ± 15.6 | 0.93 |
| DCN | 100.0 ± 17.8 | 86.1 ± 16.2 | 0.57 |
| LUM | 100.0 ± 17.7 | 88.2 ± 19.5 | 0.66 |
| FBN1 | 100.0 ± 17.3 | 44.0 ± 7.7 | 0.01 |
| MFAP5 | 100.0 ± 24.4 | 68.7 ± 16.5 | 0.32 |
| MMP2 | 100.0 ± 24.5 | 90.3 ± 20.6 | 0.77 |
| MMP7 | 100.0 ± 23.3 | 352.2 ± 232.3 | 0.27 |
| MMP9 | 100.0 ± 17.5 | 340.6 ± 118.1 | 0.05 |
| MMP14 | 100.0 ± 19.0 | 53.8 ± 9.4 | 0.05 |
| CTSK | 100.0 ± 11.8 | 87.4 ± 14.1 | 0.50 |
| CTSL1 | 100.0 ± 8.7 | 65.3 ± 8.5 | 0.01 |
| CTSS | 100.0 ± 9.3 | 122.2 ± 25.7 | 0.41 |
| SERPINE1 | 100.0 ± 35.5 | 62.5 ± 14.5 | 0.37 |
| PLAUR | 100.0 ± 15.9 | 84.1 ± 16.5 | 0.50 |
Data are presented as means ± SE. Healthy obese values are from Table 6; n = 8 and n = 9 for T2DM Sirius red and DTAF, respectively.
OmniMMP units are emission at 405 nm minus blank.
mRNA abundances measured in a subset of subjects with available sample, expressed as percent of healthy obese group mean (n = 9 and 8 for healthy and T2DM groups, respectively, for mRNA). Values that differ significantly (P < 0.05) or display potential trends (P < 0.1) by Student's t-test are indicated in boldface.
Fig. 5.
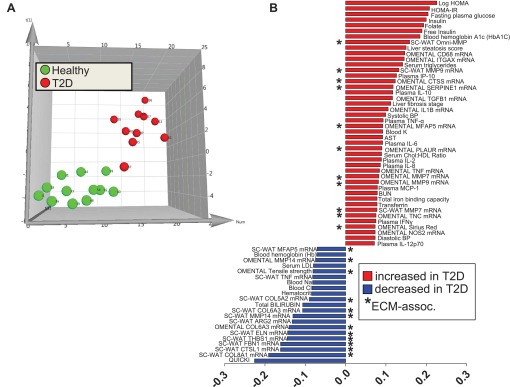
Results from PLS-DA modeling of clinical and WAT phenotype variables to identify features that differentiate healthy obese and T2DM obese women. A: subjects scores plot illustrating individuals from the healthy (green) and MetS (red) cohorts, showing separation of groups along latent variable 1 dimension (x-axis). B: scores separation along the x-axis dimension in A was explained primarily by variance in features depicted in the loadings plot. Abbreviations are defined in tables and Fig. 4 legend.
DISCUSSION
That central obesity, as a part of the diagnostic criteria for MetS, is often accompanied by inflammation and insulin resistance is well established (15), but the underlying basis is the subject of debate. Obesity does not always manifest with metabolic disease, suggesting that there are innate differences among individuals with respect to the health consequences of WAT expansion (58). One possibility is that in susceptible individuals, adipocyte hypertrophy and caloric excess drive oxidative stress, and after a “tipping point” of metabolic and inflammatory events has been reached, disease ensues. It has been proposed that focal tissue hypoxia, due to a mismatch of WAT hypertrophy and vasculogenesis, contributes and elicits a proinflammatory response (48). Fibrosis is also thought to play a role in adipose and hepatic inflammation, and it has been proposed that excess fibrosis in WAT hinders adipocyte hypertrophy and WAT remodeling during periods of overnutrition (as reviewed in Refs. 8, 14, and 48). On the other hand, in healthy obesity, we hypothesize that orderly expansion of WAT with concurrent well-regulated remodeling of vasculature, collagens, and other ECM components takes place as an adaptational response to store excess calories. An analogy is wound healing, in which injury-disrupted ECM (e.g., via integrin and matrix component cell surface signaling) elicits an orchestrated response that involves M2-like macrophage infiltration and ECM remodeling for proper tissue repair (48). Might unhealthy obesity be characterized by disordered WAT ECM and compromised WAT architecture? Current tools to quantitate the WAT ECM are not optimal since they cannot quantify collagen bundle/fibril sizes, detailed architectural features, or functional outcomes such as tissue integrity that would be expected to track disordered ECM. Thus, novel methods to quantify WAT collagen ECM volume in 3D and to measure biophysical properties of WAT samples were developed, combining these approaches with traditional ECM and inflammation measurements to determine phenotype shifts in the WAT of metabolically compromised obesity. To our knowledge, this is the first report using these approaches. Our results in a cohort of matched eqally obese women support the concept that differences in adipose ECM and related variables readily differentiate healthy and unhealthy obesity, although cause/effect remains to be established.
The results indicate that tensile strength measurement is a promising tool for examining adipose tissue integrity and ECM structure/function, since in Col6KO mice there was a significant decrease in tensile strength compared with WT mice, and omental tensile strength was a contributing feature in PLS-DA statistical models distinguishing healthy vs. metabolically compromised obesity. However, this technology requires further refinement for human applications, since we observed high subject-to-subject variability. A major difference between the human and mouse studies was the ability to finely dissect the entire WAT pad in the mouse vs. more variable collection and preparation techniques for the large biopsy samples collected at the time of surgery in humans. This would have made it more difficult to detect MetS- and T2DM-associated differences in tensile strength in the human comparisons for which orientation of the tissue, exact site of collection, etc., can be difficult to control. Nevertheless, we were able to clearly demonstrate significant depot effects, with human omental WAT displaying much higher tensile strength compared with sc WAT. The reason for this depot specificity is not entirely clear but likely involves architectural differences and roles associated with the different depots. Subcutaneous WAT, for instance, may require more malleability to accommodate energy storage and adipocyte hypertophy compared with the omental depot. The sc WAT also has important roles for insulation and protection of the body, and this might also help explain, from a teleologic standpoint, differences in biophysical properties of this depot compared with visceral adipose tissue.
In addition to measurement of gross collagen content, we had hoped to determine subtleties of ECM architecture such as fibril/bundle size differences in healthy and MetS women. However, the three-dimensional collagen imaging technology that was developed for these purposes was not of high enough resolution. Nevertheless, this quantitative method correlated well with traditional histological measurements of total collagen and allowed measurements to to be made in a defined volume of WAT. Future studies should consider application of electron microscopy or other imaging approaches to achieve the goal of fibril subtype quantitation and to quantify the extent of ordered vs. disordered ECM structures. This could be important because we suspect that gross collagen content may not change when healthy and diseased WAT are compared, but there could be irregular collagen architecture in MetS or other metabolic disorders (analogous to tissue injury or poor wound healing) that contribute to inflammation and disease phenotypes. Furthermore, DTAF marks protein and not collagen specifically, so although it is useful for general quantitation of ECM (composed mostly of collagens), its signal may not always correlate with more refined measurements of collagen subtypes (as seen herein for collagen transcripts that differed in MetS and T2DM). Thus, new collagen-specific methods to quantitate WAT ECM should be pursued.
Traditional pairwise comparisons to determine differences between groups do not take into consideration the networked covariate nature of many systems. To identify new factors that mark the MetS condition, and to determine whether WAT ECM-relevant factors contribute to the MetS phenotype, we employed multivariate statistical analysis to identify healthy and MetS “signatures.” To accomplish this, we selected subjects not being treated with statins and TZDs, which have been shown to alter ECM dynamics in other tissues such as the liver, the immune system, and the heart (9, 17, 26, 39). These analyses confirmed the central hypothesis that factors associated with WAT architectural and biophysical properties, e.g., collagens, MMPs, and tensile strength, are altered in the MetS state. For instance, changes in production of collagen molecule transcripts, proteolytic enzyme transcripts, proteolytic activity, and overall omental WAT tensile strength were features that discriminated healthy vs. MetS obese subjects in the PLS-DA model. Variance in omental WAT tensile strength in the MetS obese group that contributed to the PLS-DA model may indicate a greater degree of disordered ECM compared with the healthy obese, but this postulate will require experimental validation. We found that transcript levels of COL3A1, COL5A2, and COL6A3 were decreased in both the omental and sc WAT of the MetS obese group in the PLS model. These results were somewhat unexpected, as it has been shown previously that these collagen genes are increased with obesity (10). Specifically, it has been found in both humans and mouse models that increased levels of collagen VI are associated with decreased insulin sensitivity in obesity (21, 38). Similarly, collagen V gene expression negatively correlated with insulin sensitivity in lean and obese humans (44). It is possible that the decreased expression of the collagen genes in the obese MetS group partially explains the subtle but decreased omental WAT tensile strength in this group.
It has been shown previously that circulating MMP-9 levels are increased in obesity and correlate with insulin resistance (55). Increased MMP-9 transcript has also been found to correlate with increased HOMA-IR in sc WAT and omental WAT of obese subjects (54). However, our study showed contradictory results with increased MMP-9 gene expression in sc WAT but decreased pro-MMP-9 activity by zymography, with no differences in omental WAT in MetS. Circulating MMP-7 was reported to be decreased in obesity and to increase after bariatric surgery (41), but in the current study we showed that MetS subjects had higher sc WAT MMP-7 gene expression than healthy obese subjects. Overall, MMP activity as measured by the OmniMMP assay was increased in sc WAT and decreased in omental WAT of MetS subjects. Expression of CTSS, a cysteine protease whose expression in adipose is strongly correlated with BMI and decreases with weight loss (50, 51), was increased in both omental and sc WAT in the MetS obese group. CTSS expression can be induced in WAT by TNFα and IL-1β (49), both of which were increased in circulation in the MetS obese group. CTSS has a role in ECM remodeling through degradation of its substrates elastin, laminin, fibronectin, and some collagens (50). Thrombospondin-1 (encoded by THBS1), an ECM component and component of platelet α-granules, has been shown to be important in the WAT accumulation of macrophages in DIO mice, and thrombospondin deficiency has been found to improve glucose tolerance and insulin tolerance (27). Coculture of macrophages and adipocytes increases THBS1 expression in both cell types (16), and human sc WAT THBS1 expression has been found to positively correlate with BMI, PAI1 (SERPINE1), MCP1 (CCL2), and CD68 mRNA expression and negatively correlate with insulin sensitivity (57). In the present study, however, THBS1 expression was decreased in the MetS group, whereas both SERPINE1 and CD68 mRNA expression were increased in the omental WAT alone (SERPINE1) or both WAT depots (CD68). Thus, although our overall results support the idea that ECM factors are altered in MetS WAT, there are some discrepancies with prior reports. However, many studies have compared lean vs. obese individuals, whereas we examined weight-matched obese, high-BMI women. Furthermore, we cannot exclude the possibility that nutritional status could impact these variables; the subjects in the current study were sampled after 2–3 days of presurgical intestinal preparation that placed them in a fasting metabolic state.
The phenotypic variables measured herein included macrophage markers, since macrophages play an important role in adipose remodeling during hypertrophy (48). In fact, the COL6α3 cleavage product endotrophin has been shown to act as a macrophage chemoattractant (37). Previously, we have demonstrated that WAT macrophage infiltration is strongly correlated with body weight over a large range in nonobese and moderately obese mice (52, 53), which is indicative of a normal physiological role for macrophages in the course of adaptational WAT expansion and remodeling. However, chronic and extreme obesity can lead to accumulation of classically activated, proinflammatory CD11c+ M1 macrophages (31, 32). This accumulation switches the balance of macrophages from tissue remodeling functions to inflammatory functions, leading to insulin resistance (34). In the present study, examining pairwise comparisons and the PLS-DA model factors, it was clear that MetS subjects displayed an expected proinflammatory state systemically and in WAT. For instance, we found that the pan-macrophage marker CD68 and a marker of the classically activated M1 macrophage ITGAX (CD11c) were both increased in omental and sc WAT in MetS compared with healthy subjects. Plasma IFNγ was increased in the MetS group compared with the healthy obese group. IFNγ production by Th1 cells induces TNFα and IL-1β production by macrophages (34). Both of these factors were increased significantly in the plasma of the MetS group and helped discriminate groups in the PLS-DA model. Plasma IL-6, another cytokine produced by M1 macrophages, was increased the MetS obese group. Increased circulatory IL-1β and IL-6 have been found to increase the risk of T2DM together (45) and have been found to be increased in obese MetS subjects in conjunction with macrophage infiltration into WAT (5). IL-12, produced in abundance by M1 macrophages in response to IFNγ stimulus (33), was also a feature included in the PLS-DA model. The mRNA for PAI-1, SERPINE1, produced by both macrophages and adipocytes and involved in the fibrinolytic system (43), was found in greater abundance in MetS omental WAT. These results echo previous studies showing increased circulating levels of PAI-1 in obese MetS subjects (23) and a role for PAI-1 in the development of insulin resistance (29) and may be partially explained by the finding that increased concentrations of glucose and free fatty acids increase PAI-1 expression (22, 47). At the same time, gene expression of the M2 macrophage-associated marker arginase-2 (ARG2) (32, 34) was decreased in the sc WAT of the MetS obese group. Overall, inflammatory factors that differ between healthy and MetS obese fit a model where classically activated M1 macrophages infiltrate the adipose and disturb the balance of anti-inflammatory, regulatory, and tissue repair macrophages, contributing to insulin resistance and possibly disordered ECM in MetS.
Strengths, limitations, and future directions.
A strength of the study was the use of a weight-matched cohort of obese MetS women for which a healthy comparator group was identified. This approach abrogates potential confounding issues of weight and adiposity on ECM and other outcomes that might come into play when lean and obese individuals are compared, and care was taken to avoid recruitment of subjects taking medications that might impinge upon the ECM or adipocyte dynamics. All subjects were in a similar metabolic state at the time of tissue collection, which is a strength, yet we cannot exclude that the presurgery fasting condition blunted potential group differences that would have manifested in the fed or overnight-fasted situation. Another limitation was that we did not have information on diet patterns or family history of MetS, nor did we evaluate dynamic changes in metabolism or hormones following a meal test or other challenges. Future studies comparing healthy and unhealthy obesity should focus on all of these aspects and consider controlled dietary conditions leading up to sample collection. Finally, we acknowledge that our sample size was limited, and a potential drawback to multivariate statistical analysis is overfit of data that could lead to type 1 error with respect to interpretation of a particular factor's role in discriminating disease phenotype. Despite these limitations, our identification of a MetS pathophenotype signature that includes many ECM factors supports the hypothesis that adipose architecture and maintenance of orderly WAT growth are important factors associated with metabolic health. This point is further supported by the fact that a separate model of controls vs. type 2 diabetes was also characterized by significant alterations in the ECM and WAT inflammation, generally in a manner similar to MetS. It remains to be determined whether the WAT ECM alterations associated with MetS and T2DM precede, contribute to, or follow metabolic perturbations such as insulin resistance and dyslipidemia. Our study also highlights distinct differences in biophysical properties and ECM factors comparing human subcutaneous and omental WAT, which are consistent with new findings on depot-specific biophysical parameters published during the preparation of this article (2). Another new study has measured sc WAT stiffness, which was altered with T2DM status (1). The novel ECM and inflammatory features identified herein, and the new methods developed, will enable a closer experimental evaluation of those factors that underlie or contribute to cardiometabolic disease.
GRANTS
This research was supported by US Department of Agriculture-Agricultural Research Service (USDA-ARS) Intramural Project No. 5306-51530-019-00, a USDA-ARS Headquarters Postdoctoral Award (D. E. Lackey), National Institute of Diabetes and Digestive and Kidney Diseases Grant R01-DK-078328 (to S. H. Adams), and NIH Grants R01-DK-55758 and R01-CA-112023 (to P. E. Scherer). J. Park was supported in part by a fellowship from the Department of Defense (USAMRMC BC085909). This work utilized the facilities of the Pennington Biomedical Research Center Cell Biology and Bioimaging Core, which are supported in part by COBRE (8P20-GM-103528) and NORC (2P30-DK-072476) center grants from the NIH. The USDA is an equal opportunity provider and employer.
DISCLOSURES
No conflicts of interest, financial or otherwise, are declared by the authors.
AUTHOR CONTRIBUTIONS
D.E.L., D.H.B., M.R.A., R. M., W.H.S., J.P., S.A.S., C.S.M. performed the experiments, with P.B. and P.E.S. providing the knockout mouse model; D.E.L., D.H.B., and S.H.A. analyzed the data; D.E.L., D.H.B., M.R.A., P.E.S., and S.H.A. interpreted the results of the experiments; D.E.L., D.H.B., and S.H.A. prepared the figures; D.E.L. and S.H.A. drafted the manuscript; D.E.L., D.H.B., M.R.A, R.M., W.H.S., J.P., P.E.S., S.A.S., C.S.M., P.B., and S.H.A. edited the manuscript and approved the final version of the manuscript; D.E.L., M.R.A., and S.H.A. conceived of and designed the research.
ACKNOWLEDGMENTS
We thank Pieter J. Oort, Dorothy A. Kieffer, and Dr. Trina A. Knotts for valuable technical assistance and advice. We also thank John W. Newman for helpful discussions of multivariate statistics and pattern analysis. We appreciate the efforts of Dr. James Lee Park at Danish MyoTechnology for help in designing and procuring specialized clamps for use in WAT tensile strength studies.
Current Address of D. E. Lackey: Department of Medicine, University of California, San Diego, CA.
REFERENCES
- 1.Abdennour M, Reggio S, La Naour G, Liu Y, Poitou C, Aron-Wisnewsky J, Charlotte F, Bouillot JL, Torcivia A, Sasso M, Miette V, Zucker JD, Bedossa P, Tordjman J, Clement K. Association of adipose tissue and liver fibrosis with tissue stiffness in morbid obesity: links with diabetes and BMI loss after gastric bypass. J Clin Endocrinol Metab. In press [DOI] [PubMed] [Google Scholar]
- 2.Alkhouli N, Mansfield J, Green E, Bell J, Knight B, Liversedge N, Tham JC, Welbourn R, Shore AC, Kos K, Winlove CP. The mechanical properties of human adipose tissues and their relationships to the structure and composition of the extracellular matrix. Am J Physiol Endocrinol Metab 305: E1427–E1435, 2013 [DOI] [PubMed] [Google Scholar]
- 3.Barbarroja N, López-Pedrera R, Mayas MD, García-Fuentes E, Garrido-Sánchez L, Macías-González M, El Bekay R, Vidal-Puig A, Tinahones FJ. The obese healthy paradox: is inflammation the answer? Biochem J 430: 141–149, 2010 [DOI] [PubMed] [Google Scholar]
- 4.Bonaldo P, Braghetta P, Zanetti M, Piccolo S, Volpin D, Bressan GM. Collagen VI deficiency induces early onset myopathy in the mouse: an animal model for Bethlem myopathy. Hum Mol Genet 7: 2135–2140, 1998 [DOI] [PubMed] [Google Scholar]
- 5.Bremer AA, Devaraj S, Afify A, Jialal I. Adipose tissue dysregulation in patients with metabolic syndrome. J Clin Endocrinol Metab 96: E1782–E1788, 2011 [DOI] [PMC free article] [PubMed] [Google Scholar]
- 6.Bruehlmann SB, Matyas JR, Duncan NA. ISSLS prize winner: Collagen fibril sliding governs cell mechanics in the anulus fibrosus: an in situ confocal microscopy study of bovine discs. Spine (Phila Pa 1976) 29: 2612–2620, 2004 [DOI] [PubMed] [Google Scholar]
- 7.Chun TH, Hotary KB, Sabeh F, Saltiel AR, Allen ED, Weiss SJ. A pericellular collagenase directs the 3-dimensional development of white adipose tissue. Cell 125: 577–591, 2006 [DOI] [PubMed] [Google Scholar]
- 8.Chun TH. Peri-adipocyte ECM remodeling in obesity and adipose tissue fibrosis. Adipocyte 1: 89–95, 2012 [DOI] [PMC free article] [PubMed] [Google Scholar]
- 9.Crossno JT, Jr, Garat CV, Reusch JE, Morris KG, Dempsey EC, McMurtry IF, Stenmark KR, Klemm DJ. Rosiglitazone attenuates hypoxia-induced pulmonary arterial remodeling. Am J Physiol Lung Cell Mol Physiol 292: L885–L897, 2007 [DOI] [PubMed] [Google Scholar]
- 10.Dahlman I, Elsen M, Tennagels N, Korn M, Brockmann B, Sell H, Eckel J, Arner P. Functional annotation of the human fat cell secretome. Arch Physiol Biochem 118: 84–91, 2012 [DOI] [PubMed] [Google Scholar]
- 11.Demeulemeester D, Collen D, Lijnen HR. Effect of matrix metalloproteinase inhibition on adipose tissue development. Biochem Biophys Res Commun 329: 105–110, 2005 [DOI] [PubMed] [Google Scholar]
- 12.Demeulemeester D, Scroyen I, Voros G, Snoeys J, De Geest B, Collen D, Lijnen HR. Overexpression of tissue inhibitor of matrix metalloproteinases-1 (TIMP-1) in mice does not affect adipogenesis or adipose tissue development. Thromb Haemost 95: 1019–1024, 2006 [DOI] [PubMed] [Google Scholar]
- 13.Divoux A, Tordjman J, Lacasa D, Veyrie N, Hugol D, Aissat A, Basdevant A, Guerre-Millo M, Poitou C, Zucker JD, Bedossa P, Clement K. Fibrosis in human adipose tissue: composition, distribution, and link with lipid metabolism and fat mass loss. Diabetes 59: 2817–2825, 2010 [DOI] [PMC free article] [PubMed] [Google Scholar]
- 14.Divoux A, Clement K. Architecture and the extracellular matrix: the still unappreciated components of the adipose tissue. Obes Rev 12: e494–e503, 2011 [DOI] [PubMed] [Google Scholar]
- 15.Eckel RH, Grundy SM, Zimmet PZ. The metabolic syndrome. Lancet 365: 1415–1428, 2005 [DOI] [PubMed] [Google Scholar]
- 16.Finlin BS, Zhu B, Starnes CP, McGehee RE, Jr, Peterson CA, Kern PA. Regulation of thrombospondin-1 expression in alternatively activated macrophages and adipocytes: role of cellular cross talk and omega-3 fatty acids. J Nutr Biochem 24: 1571–1579, 2013 [DOI] [PMC free article] [PubMed] [Google Scholar]
- 17.Galli A, Crabb DW, Ceni E, Salzano R, Mello T, Svegliati-Baroni G, Ridolfi F, Trozzi L, Surrenti C, Casini A. Antidiabetic thiazolidinediones inhibit collagen synthesis and hepatic stellate cell activation in vivo and in vitro. Gastroenterology 122: 1924–1940, 2002 [DOI] [PubMed] [Google Scholar]
- 18.Henegar C, Tordjman J, Achard V, Lacasa D, Cremer I, Guerre-Millo M, Poitou C, Basdevant A, Stich V, Viguerie N, Langin D, Bedossa P, Zucker JD, Clement K. Adipose tissue transcriptomic signature highlights the pathological relevance of extracellular matrix in human obesity. Genome Biol 9: R14, 2008 [DOI] [PMC free article] [PubMed] [Google Scholar]
- 19.Hurtado del Pozo C, Calvo RM, Vesperinas-García G, Gómez-Ambrosi J, Frühbeck G, Corripio-Sánchez R, Rubio MA, Obregon MJ. IPO8 and FBXL10: new reference genes for gene expression studies in human adipose tissue. Obesity (Silver Spring) 18: 897–903, 2010 [DOI] [PubMed] [Google Scholar]
- 20.Karamichos D, Lakshman N, Petroll WM. An experimental model for assessing fibroblast migration in 3-D collagen matrices. Cell Motil Cytoskeleton 66: 1–9, 2009 [DOI] [PMC free article] [PubMed] [Google Scholar]
- 21.Khan T, Muise ES, Iyengar P, Wang ZV, Chandalia M, Abate N, Zhang BB, Bonaldo P, Chua S, Scherer PE. Metabolic dysregulation and adipose tissue fibrosis: role of collagen VI. Mol Cell Biol 29: 1575–1591, 2009 [DOI] [PMC free article] [PubMed] [Google Scholar]
- 22.Kishore P, Li W, Tonelli J, Lee DE, Koppaka S, Zhang K, Lin Y, Kehlenbrink S, Scherer PE, Hawkins M. Adipocyte-derived factors potentiate nutrient-induced production of plasminogen activator inhibitor-1 by macrophages. Sci Transl Med 2: 20ra15, 2010 [DOI] [PubMed] [Google Scholar]
- 23.Koster A, Stenholm S, Alley DE, Kim LJ, Simonsick EM, Kanaya AM, Visser M, Houston DK, Nicklas BJ, Tylavsky FA, Satterfield S, Goodpaster BH, Ferrucci L, Harris TB; Health ABC Study Body fat distribution and inflammation among obese older adults with and without metabolic syndrome. Obesity (Silver Spring) 18: 2354–2361, 2010 [DOI] [PMC free article] [PubMed] [Google Scholar]
- 24.Krahn KN, Bouten CV, van Tuijl S, van Zandvoort MA, Merkx M. Fluorescently labeled collagen binding proteins allow specific visualization of collagen in tissues and live cell culture. Anal Biochem 350: 177–185, 2006 [DOI] [PubMed] [Google Scholar]
- 25.Lackey DE, Lynch CJ, Olson KC, Mostaedi R, Ali M, Smith WH, Karpe F, Humphreys S, Bedinger DH, Dunn TN, Thomas AP, Oort PJ, Kieffer DA, Amin R, Bettaieb A, Haj FG, Permana P, Anthony TG, Adams SH. Regulation of adipose branched-chain amino acid catabolism enzyme expression and cross-adipose amino acid flux in human obesity. Am J Physiol Endocrinol Metab 304: E1175–E1187, 2013 [DOI] [PMC free article] [PubMed] [Google Scholar]
- 26.Lee DK, Park EJ, Kim EK, Jin J, Kim JS, Shin IJ, Kim BY, Lee H, Kim DE. Atorvastatin and simvastatin, but not pravastatin, up-regulate LPS-induced MMP-9 expression in macrophages by regulating phosphorylation of ERK and CREB. Cell Physiol Biochem 30: 499–511, 2012 [DOI] [PubMed] [Google Scholar]
- 27.Li Y, Tong X, Rumala C, Clemons K, Wang S. Thrombospondin1 deficiency reduces obesity-associated inflammation and improves insulin sensitivity in a diet-induced obese mouse model. PLoS One 6: e26656, 2011 [DOI] [PMC free article] [PubMed] [Google Scholar]
- 28.Lijnen HR, Demeulemeester D, Van Hoef B, Collen D, Maquoi E. Deficiency of tissue inhibitor of matrix metalloproteinase-1 (TIMP-1) impairs nutritionally induced obesity in mice. Thromb Haemost 89: 249–255, 2003 [PubMed] [Google Scholar]
- 29.Lijnen HR, Alessi MC, Van Hoef B, Collen D, Juhan-Vague I. On the role of plasminogen activator inhibitor-1 in adipose tissue development and insulin resistance in mice. J Thromb Haemost 3: 1174–1179, 2005 [DOI] [PubMed] [Google Scholar]
- 30.Lijnen HR, Frederix L, Scroyen I. Deficiency of plasminogen activator inhibitor-2 impairs nutritionally induced murine adipose tissue development. J Thromb Haemost 5: 2259–2265, 2007 [DOI] [PubMed] [Google Scholar]
- 31.Lumeng CN, Deyoung SM, Bodzin JL, Saltiel AR. Increased inflammatory properties of adipose tissue macrophages recruited during diet-induced obesity. Diabetes 56: 16–23, 2007 [DOI] [PubMed] [Google Scholar]
- 32.Lumeng CN, Bodzin JL, Saltiel AR. Obesity induces a phenotypic switch in adipose tissue macrophage polarization. J Clin Invest 117: 175–184, 2007 [DOI] [PMC free article] [PubMed] [Google Scholar]
- 33.Martinez FO, Sica A, Mantovani A, Locati M. Macrophage activation and polarization. Front Biosci 13: 453–461, 2008 [DOI] [PubMed] [Google Scholar]
- 34.Mosser DM, Edwards JP. Exploring the full spectrum of macrophage activation. Nat Rev Immunol 8: 958–969, 2008 [DOI] [PMC free article] [PubMed] [Google Scholar]
- 35.Olefsky JM, Glass CK. Macrophages, inflammation, and insulin resistance. Annu Rev Physiol 72: 219–246, 2010 [DOI] [PubMed] [Google Scholar]
- 36.Oort PJ, Warden CH, Baumann TK, Knotts TA, Adams SH. Characterization of Tusc5, an adipocyte gene co-expressed in peripheral neurons. Mol Cell Endocrinol 276: 24–35, 2007 [DOI] [PubMed] [Google Scholar]
- 37.Park J, Scherer PE. Adipocyte-derived endotrophin promotes malignant tumor progression. J Clin Invest 122: 4243–4256, 2012 [DOI] [PMC free article] [PubMed] [Google Scholar]
- 38.Pasarica M, Gowronska-Kozak B, Burk D, Remedios I, Hymel D, Gimble J, Ravussin E, Bray GA, Smith SR. Adipose tissue collagen VI in obesity. J Clin Endocrinol Metab 94: 5155–5162, 2009 [DOI] [PMC free article] [PubMed] [Google Scholar]
- 39.Porter KE, Turner NA. Statins and myocardial remodelling: cell and molecular pathways. Expert Rev Mol Med 13: e22, 2011 [DOI] [PubMed] [Google Scholar]
- 40.Rajpathak SN, Crandall JP, Wylie-Rosett J, Kabat GC, Rohan TE, Hu FB. The role of iron in type 2 diabetes in humans. Biochim Biophys Acta 1790: 671–681, 2009 [DOI] [PubMed] [Google Scholar]
- 41.Ress C, Tschoner A, Ciardi C, Laimer MW, Engl JW, Sturm W, Weiss H, Tilg H, Ebenbichler CF, Patsch JR, Kaser S. Influence of significant weight loss on serum matrix metalloproteinase (MMP)-7 levels. Eur Cytokine Netw 21: 65–70, 2010 [DOI] [PubMed] [Google Scholar]
- 42.Shaul ME, Bennett G, Strissel KJ, Greenberg AS, Obin MS. Dynamic, M2-like remodeling phenotypes of CD11c+ adipose tissue macrophages during high-fat diet-induced obesity in mice. Diabetes 59: 1171–1181, 2010 [DOI] [PMC free article] [PubMed] [Google Scholar]
- 43.Spencer M, Yao-Borengasser A, Unal R, Rasouli N, Gurley CM, Zhu B, Peterson CA, Kern PA. Adipose tissue macrophages in insulin-resistant subjects are associated with collagen VI and fibrosis and demonstrate alternative activation. Am J Physiol Endocrinol Metab 299: E1016–E1027, 2010 [DOI] [PMC free article] [PubMed] [Google Scholar]
- 44.Spencer M, Unal R, Zhu B, Rasouli N, McGehee RE, Jr, Peterson CA, Kern PA. Adipose tissue extracellular matrix and vascular abnormalities in obesity and insulin resistance. J Clin Endocrinol Metab 96: E1990–E1998, 2011 [DOI] [PMC free article] [PubMed] [Google Scholar]
- 45.Spranger J, Kroke A, Mohlig M, Hoffmann K, Bergmann MM, Ristow M, Boeing H, Pfeiffer AF. Inflammatory cytokines and the risk to develop type 2 diabetes: results of the prospective population-based European Prospective Investigation into Cancer and Nutrition (EPIC)-Potsdam Study. Diabetes 52: 812–817, 2003 [DOI] [PubMed] [Google Scholar]
- 46.Strissel KJ, Stancheva Z, Miyoshi H, Perfield JW, 2nd, DeFuria J, Jick Z, Greenberg AS, Obin MS. Adipocyte death, adipose tissue remodeling, and obesity complications. Diabetes 56: 2910–2918, 2007 [DOI] [PubMed] [Google Scholar]
- 47.Sun J, Xu Y, Dai Z, Sun Y. Intermittent high glucose stimulate MCP-l, IL-18, and PAI-1, but inhibit adiponectin expression and secretion in adipocytes dependent of ROS. Cell Biochem Biophys 55: 173–180, 2009 [DOI] [PubMed] [Google Scholar]
- 48.Sun K, Kusminski CM, Scherer PE. Adipose tissue remodeling and obesity. J Clin Invest 121: 2094–2101, 2011 [DOI] [PMC free article] [PubMed] [Google Scholar]
- 49.Taleb S, Lacasa D, Bastard JP, Poitou C, Cancello R, Pelloux V, Viguerie N, Benis A, Zucker JD, Bouillot JL, Coussieu C, Basdevant A, Langin D, Clement K. Cathepsin S, a novel biomarker of adiposity: relevance to atherogenesis. FASEB J 19: 1540–1542, 2005 [DOI] [PubMed] [Google Scholar]
- 50.Taleb S, Cancello R, Poitou C, Rouault C, Sellam P, Levy P, Bouillot JL, Coussieu C, Basdevant A, Guerre-Millo M, Lacasa D, Clement K. Weight loss reduces adipose tissue cathepsin S and its circulating levels in morbidly obese women. J Clin Endocrinol Metab 91: 1042–1047, 2006 [DOI] [PubMed] [Google Scholar]
- 51.Taleb S, Clement K. Emerging role of cathepsin S in obesity and its associated diseases. Clin Chem Lab Med 45: 328–332, 2007 [DOI] [PubMed] [Google Scholar]
- 52.Thomas AP, Dunn TN, Oort PJ, Grino M, Adams SH. Inflammatory phenotyping identifies CD11d as a gene markedly induced in white adipose tissue in obese rodents and women. J Nutr 141: 1172–1180, 2011 [DOI] [PubMed] [Google Scholar]
- 53.Thomas AP, Dunn TN, Drayton JB, Oort PJ, Adams SH. A high calcium diet containing nonfat dry milk reduces weight gain and associated adipose tissue inflammation in diet-induced obese mice when compared to high calcium alone. Nutr Metab (Lond) 9: 3, 2012 [DOI] [PMC free article] [PubMed] [Google Scholar]
- 54.Tinahones FJ, Coín-Aragüez L, Mayas MD, Garcia-Fuentes E, Hurtado-Del-Pozo C, Vendrell J, Cardona F, Calvo RM, Obregon MJ, El Bekay R. Obesity-associated insulin resistance is correlated to adipose tissue vascular endothelial growth factors and metalloproteinase levels. BMC Physiol 12: 4, 2012 [DOI] [PMC free article] [PubMed] [Google Scholar]
- 55.Unal R, Yao-Borengasser A, Varma V, Rasouli N, Labbate C, Kern PA, Ranganathan G. Matrix metalloproteinase-9 is increased in obese subjects and decreases in response to pioglitazone. J Clin Endocrinol Metab 95: 2993–3001, 2010 [DOI] [PMC free article] [PubMed] [Google Scholar]
- 56.Van Hul M, Lijnen HR. A functional role of gelatinase A in the development of nutritionally induced obesity in mice. J Thromb Haemost 6: 1198–1206, 2008 [DOI] [PubMed] [Google Scholar]
- 57.Varma V, Yao-Borengasser A, Bodles AM, Rasouli N, Phanavanh B, Nolen GT, Kern EM, Nagarajan R, Spencer HJ, 3rd, Lee MJ, Fried SK, McGehee RE, Jr, Peterson CA, Kern PA. Thrombospondin-1 is an adipokine associated with obesity, adipose inflammation, and insulin resistance. Diabetes 57: 432–439, 2008 [DOI] [PMC free article] [PubMed] [Google Scholar]
- 58.Velho S, Paccaud F, Waeber G, Vollenweider P, Marques-Vidal P. Metabolically healthy obesity: different prevalences using different criteria. Eur J Clin Nutr 64: 1043–1051, 2010 [DOI] [PubMed] [Google Scholar]
- 59.Weisberg SP, McCann D, Desai M, Rosenbaum M, Leibel RL, Ferrante AW., Jr Obesity is associated with macrophage accumulation in adipose tissue. J Clin Invest 112: 1796–1808, 2003 [DOI] [PMC free article] [PubMed] [Google Scholar]
- 60.Wood ML, Lester GE, Dahners LE. Collagen fiber sliding during ligament growth and contracture. J Orthop Res 16: 438–440, 1998 [DOI] [PubMed] [Google Scholar]