

Abstract
We previously reported internephron heterogeneity in the tubuloglomerular feedback (TGF) response 1 wk after subtotal nephrectomy (STN), with 50% of STN nephrons exhibiting anomalous TGF (Singh P, Deng A, Blantz RC, Thomson SC. Am J Physiol Renal Physiol 296: F1158–F1165, 2009). Presently, we tested the theory that anomalous TGF is an adaptation of the STN kidney to facilitate increased distal delivery when NaCl balance forces the per-nephron NaCl excretion to high levels. To this end, the effect of dietary NaCl on the TGF response was tested by micropuncture in STN and sham-operated Wistar rats. An NaCl-deficient (LS) or high-salt NaCl diet (HS; 1% NaCl in drinking water) was started on day 0 after STN or sham surgery. Micropuncture followed 8 days later with measurements of single-nephron GFR (SNGFR), proximal reabsorption, and tubular stop-flow pressure (PSF) obtained at both extremes of TGF activation, while TGF was manipulated by microperfusing Henle's loop (LOH) from the late proximal tubule. Activating TGF caused SNGFR to decline by similar amounts in Sham-LS, Sham-HS and STN-LS [ΔSNGFR (nl/min) = −16 ± 2, −11 ± 3, −11 ± 2; P = not significant by Tukey]. Activating TGF in STN-HS actually increased SNGFR by 5 ± 2 nl/min (P < 0.0005 vs. each other group by Tukey). HS had no effect on the PSF response to LOH perfusion in sham [ΔPSF (mmHg) = −9.6 ± 1.1 vs. −9.8 ± 1.0] but eliminated the PSF response in STN (+0.3 ± 0.9 vs. −5.7 ± 1.0, P = 0.0002). An HS diet leads to anomalous TGF in the early remnant kidney, which facilitates NaCl and fluid delivery to the distal nephron.
Keywords: proximal tubular reabsorption, glomerulotubular balance, hyperfiltration, salt balance
single-nephron glomerular filtration rate (GFR; SNGFR) is coupled to the flow rate or concentration of NaCl in tubular fluid NaCl at the macula densa (MDNaCl). Coupling is achieved by the combined effects of glomerulotubular balance (GTB), which confers a positive effect of SNGFR on distal delivery, and tubuloglomerular feedback (TGF), which confers a reciprocal effect of distal delivery on SNGFR. This negative feedback system normally dampens the effect of outside disturbances on SNGFR or distal delivery by 50–75% (7, 25). TGF remains intact under most circumstances, indicating that the kidney gives priority to stabilizing its own function rather than responding maximally to physical or hormonal stimuli from the broader environment. We previously reported that the early remnant kidney is an exception to this rule and that TGF responses were highly variable and frequently paradoxical in rats 1 wk after subtotal nephrectomy (STN) (20). A possible explanation for this is that the STN kidney deals with a large excretory burden by reducing the priority it normally gives to stabilizing nephron function. Here, we report the results of micropuncture studies designed to test this theory. Findings include a major influence of dietary NaCl on the TGF system in STN, which led to frankly anomalous TGF responses when STN rats were fed a high-NaCl diet. In addition, STN impaired the overall autoregulation of SNGFR and glomerular capillary pressure.
METHODS
All experimentation was conducted according to the National Institutes of Health (NIH) Guide for the Care and Use of Laboratory Animals. Effects of dietary salt on TGF responses and proximal reabsorption were studied using renal micropuncture in male Wistar rats (Harlan) 8 days after STN or sham surgery.
STN.
This procedure was performed as previously described to reduce, by approximately ⅚, the number of functioning nephrons (20). Animals were anesthetized with pentobarbital sodium (50 mg/kg ip) and prepped for sterile surgery. The right kidney was exposed through a 1.5-cm flank incision. The renal artery and vein were ligated with a single 4-0 silk suture, and the right kidney was removed. The adrenal gland and attached vascular tissues were returned to the retroperitoneum, the fascia was closed with silk suture, and the skin was closed with steel wound clips. A left flank incision was then made, and the left kidney was exposed. Two main branches of the left renal artery were ligated with a 4-0 silk suture. The kidney was replaced back into the body, and the incision was closed as noted above. Sham-operated rats underwent anesthesia and manipulation of the renal pedicles. Rats were warmed with a heating pad throughout the period of anesthesia and were administered a dose of buprenorphine analgesic.
Experimental diets.
From the first postoperative day, animals were given ad libitum access to drinking water and were free fed a low-salt or high-salt diet. The low-salt diet consisted of standard rat chow modified to contain no NaCl (Teklad). The high-salt diet consisted of standard rat chow (0.4% NaCl) with 1 g NaCl/100 ml added to the drinking water.
Surgical preparation for renal micropuncture.
Animals were surgically prepared according to previously established protocols (28). Briefly, animals were anesthetized with Inactin (100 mg/kg ip, Research Biochemicals, Natick MA), and body temperature was maintained at 37°C by a servo-controlled heating table. After a tracheostomy (PE-240), catheters (PE-50) were placed in the jugular vein, femoral artery, and urinary bladder. The left kidney was exposed by a flank incision and immobilized in a Lucite cup. The left ureter was cannulated (PE-50). Once vascular access was secured, and Ringer saline was administered at 2 ml/h in low-salt animals and 3 ml/h in high-salt animals, reflecting prior differences in water intake. [3H]inulin (80 μCi/h) was administered as a marker of GFR. Arterial blood pressure (BP) was monitored continuously by an arterial catheter.
Micropuncture protocols.
TGF responses were evaluated based on changes in tubular stop-flow pressure (PSF) or SNGFR when the TGF signal was manipulated by orthograde perfusion of Henle's loop with a Hample nanoliter pump (University of Tuebingen) containing artificial tubular fluid (ATF). A late proximal nephron segment was identified by injecting a small amount of dye-stained artificial tubular fluid into a random surface nephron. Next, an occluding wax block was inserted just upstream of the most distal accessible late proximal segment. The Hampel pump pipette was inserted directly downstream of the wax block for perfusion of Henle's loop with ATF containing (in mM) 130 NaCl, 10 NaHCO3, 4 KCl, and 2 CaCl2 as well as 45 mg% urea and 0.1% FD&C green, pH 7.4. Data were obtained in each nephron during minimal and maximal TGF activation. A minimal TGF stimulus consisted of loop perfusion at 0–8 nl/min. Maximal TGF stimulation was attained by perfusing at 50 nl/min in STN and 40 nl/min in Sham animals. The first collection in each nephron was made during maximal TGF stimulation, and the second collection during minimal TGF stimulation. STN animals were perfused at a higher rate than Sham because the tubular flow rate is naturally higher in STN (20). BP was recorded during each collection. SNGFR was measured by [3H]inulin clearance in late proximal tubular fluid collections during maximum, then minimum, loop perfusion. Perfusion at a given rate was allowed to come to equilibrium for 90 s before the start of tubular fluid collection. Collections were for a minimum of 3.5 min. Between collections, a pipette was kept in the proximal tubule to drain fluid and prevent pressure from accumulating. Late proximal flow (VLP) was measured by transferring each tubular fluid collection to a constant-bore pipette before scintillation counting. Proximal reabsorption (Jprox) was computed as the difference between SNGFR and VLP. In addition to determining TGF responses, these data were utilized to assess effects of STN and dietary salt on Jprox. SNGFR affects Jprox through GTB. Effects of STN or dietary salt on Jprox that are not mediated through GTB are detected by applying analysis of covariance (ANCOVA), with STN and diet as independent categorical variables and SNGFR as a covariate (29).
Tubular pressure was measured with a servo-nulling micropressure apparatus (Vista Electronics, Ramona, CA) as previously described (21, 31). In nephrons used for pressure measurements, pressure in the free flowing tubule (PFF) was measured before insertion of the wax block. Then, the wax block was inserted and PSF was allowed to equilibrate for 3 min at zero loop perfusion. Then, the perfusion was begun at 40 or 50 nl/min and continued for 3–5 min. Then, the pump was turned off for another 3–5 min. PSF measurements were taken during the final 60–90 s of a microperfusion cycle. The TGF response was computed as the difference between PSF during high perfusion and the average of pre- and postperfusion values. Incident effective filtration pressure (EFPa) was taken to be the difference between PSF and PFF. Glomerular capillary pressure (PGC) was taken to be the sum of PSF and plasma oncotic pressure, Π, where Π = 1.76c +0.28c2, and c is the systemic plasma protein concentration in grams per deciliter (10) measured by refractometry. We previously validated the PSF method for estimating PGC by comparison with direct PGC measurements (21). Data were obtained from several nephrons in each animal.
Statistics.
Statistical analysis was by ANOVA, ANCOVA, ANOVA with design for repeated measures, and multiviariate linear regression as appropriate. Outliers were excluded for a Studentized residual >3. A degree of freedom was assigned to each nephron in the micropuncture analysis, after ANOVA confirmed the absence of interanimal effects. Analysis was performed using proprietary software (Systat, Evanston, IL).
RESULTS
Micropuncture and whole kidney data were obtained from 37 animals among the 4 groups (STN-HS, STN-LS, Sham-HS, Sham-LS). SNGFR measurements were made in 163 nephrons in 37 animals, and PSF measurements were made in 81 nephrons in 21 animals.
Systemic and whole kidney results.
Table 1 summarizes data on body weight, mean arterial pressure (MAP), hematocrit, plasma protein concentration, GFR, and urine flow rate obtained during micropuncture for the entire set of 37 animals. Groups were matched for body weight at time of STN or sham surgery. Body weight diverged after surgery for those undergoing STN vs. sham nephrectomy. Thus STN animals weighed ∼15% less than sham-operated animals at the time of micropuncture. GFR was 70% less among STN animals, while fractional excretion of filtered fluid volume was greater by about fourfold. The data were underpowered to verify effects of STN or dietary NaCl on urine flow rate, hematocrit, or plasma protein concentration, although each of these variables tended to respond to dietary NaCl in a way to suggest that HS led to extracellular fluid volume expansion. Body weight and MAP were weak, albeit statistically significant, covariates for GFR. Adjusting for these covariates did not appreciably alter the apparent effects of dietary NaCl or STN on GFR.
Table 1.
Whole-animal data
| Body Weight, g | Arterial BP, mmHg | GFR, ml/min | Urine Flow Rate, μl/min | FE Fluid, % | Hct, % | Plasma Protein, g/dl | |
|---|---|---|---|---|---|---|---|
| STN-HS (n = 11) | 268 ± 11 | 113 ± 9 | 0.95 ± 0.19 (1.20 ± 0.18)* | 13 ± 2 | 1.6 ± 0.2 | 45 ± 2 | 6.2 ± 0.1 |
| STN-LS (n = 9) | 280 ± 12 | 130 ± 10 | 1.05 ± 0.20 (1.18 ± 0.18)* | 9 ± 2 | 0.9 ± 0.2 | 51 ± 2 | 6.5 ± 0.2 |
| Sham-HS (n = 8) | 319 ± 13 | 117 ± 11 | 3.01 ± 0.23 (2.78 ± 0.20)* | 12 ± 2 | 0.4 ± 0.2 | 48 ± 2 | 6.9 ± 0.2 |
| Sham-LS (n = 9) | 324 ± 13 | 114 ± 11 | 3.12 ± 0.23 (2.84 ± 0.21)* | 10 ± 2 | 0.3 ± 0.2 | 49 ± 2 | 7.0 ± 0.2 |
| ANOVA P Values | |||||||
| STN | <0.0006 | NS | <0.0001 | NS | 0.0001 | NS | 0.002 |
| NaCl | NS | NS | NS | 0.218 | 0.109 | 0.036 | 0.192 |
| STN × dietary NaCl | NS | NS | NS | NS | 0.152 | 0.119 | NS |
Values are means ± SE with P values from 2-way analysis of covariance [AN(C)OVA].
Body weight was a covariate for glomerular filtration rate (GFR). Values shown in parenthesis are adjusted for body weight by ANCOVA. BP, arterial blood pressure; FE, fractional excretion; Hct, hematocrit; STN, subtotal nephrectomy; HS, high salt; LS, low salt; NS, not significant. P values for effects of STN and diet on GFR were essentially the same for testing by ANOVA or ANCOVA.
Micropuncture results.
We tested for effects of STN and dietary salt on SNGFR and late proximal flow at both extremes of the TGF spectrum, on the within-nephron TGF response, on the relationship of SNGFR to arterial BP, and on the relationship of proximal reabsorption to SNGFR. PFF and PSF measurements were used to compute PGC, the transcapillary pressure difference (ΔP) in the absence of TGF activation, and the effect of TGF on PSF (ΔPSF). We also tested for effects of STN and dietary salt on the sensitivity of PGC to BP.
Effects of STN and dietary salt on SNGFR.
Late proximal collections were made in each nephron with and without imposing a TGF stimulus. Analysis was by two-way ANOVA with design for repeated measures. The between-subjects portion of the ANOVA tests for effects of dietary NaCl and STN that are independent of the state of TGF activation. By this analysis, SNGFR was higher by 50% among STN than Sham groups (44 ± 1 vs. 29 ± 1 nl/min, P < 0.00005). There was a nonsignificant tendency for SNGFR to be greater in HS (38 ± 1 vs. 36 ± 1 nl/min, P = 0.24). SNGFR appeared more likely to increase on HS among Sham rats (P = 0.08). Details are shown in Table 2.
Table 2.
Micropuncture results: late proximal collections
| SNGFR, nl/min |
FRp |
VLP, nl/min |
||||
|---|---|---|---|---|---|---|
| No TGF | Max TGF | No TGF | Max TGF | No TGF | Max TGF | |
| STN-HS (n = 46) | 41.6 ± 3.3 | 45.8 ± 3.3 | 0.30 ± 0.02 | 0.32 ± 0.02 | 29.6 ± 2.5 | 31.4 ± 2.5 |
| STN-LS (n = 42) | 50.9 ± 3.2 | 38.7 ± 2.8 | 0.33 ± 0.02 | 0.36 ± 0.02 | 34.4 ± 2.2 | 25.1 ± 2.0 |
| Sham-HS (n = 31) | 37.2 ± 1.6 | 27.3 ± 1.8 | 0.34 ± 0.03 | 0.50 ± 0.03 | 24.5 ± 1.4 | 13.5 ± 1.0 |
| Sham-LS (n = 44) | 35.0 ± 2.0 | 17.7 ± 1.3 | 0.33 ± 0.03 | 0.49 ± 0.03 | 24.5 ± 1.9 | 9.7 ± 1.0 |
| ANOVA P Values for Effects of Dietary NaCl and STN | ||||||
| STN | <0.001 | <0.001 | NS | <0.001 | <0.001 | <0.001 |
| Dietary NaCl | 0.207 | <0.002 | NS | NS | 0.267 | 0.009 |
| STN × dietary NaCl | 0.044 | NS | NS | NS | 0.268 | NS |
Values are means ± SE. SNGFR- single-nephron GFR; FRp, fractional proximal reabsorption; VLP, late proximal flow; TGF, tubuloglomerular feedback.
Effects of STN and dietary salt on the SNGFR response to TGF activation.
The within-subjects portion of the repeated-measures ANOVA tests for primary effects and interactions between STN and dietary salt on the TGF response. The decline in SNGFR during TGF activation was greater in Sham than STN rats (13.6 ± 1.3 vs. 4.0 ± 1.2 nl/min, P < 0.00005) and greater in LS than HS (14.7 ± 1.2 vs. 2.9 ± 1.3 nl/min, P < 0.00005). The effect of dietary NaCl on the TGF response was greater among STN than Sham rats (16 vs. 7 nl/min, P = 0.01). Among STN HS, the mean TGF response was frankly paradoxical. In other words, rather than causing SNGFR to decrease, activating TGF in STN-HS caused SNGFR to increase (P = 0.02). TGF responses for each nephron and group mean responses are shown in Fig. 1.
Fig. 1.

Changes in single-nephron glomerular filtration rate (SNGFR) upon tubuloglomerular feedback (TGF) activation. Left: TGF responses for individual nephrons. A downward deflection indicates a normal TGF response. An upward deflection reflects anomalous TGF. Nine of 11 subtotal nephrectomy (STN) high-salt (HS)-fed animals contributed nephrons with a paradoxical TGF response. Right: group means ± SE. LS, low-salt-fed animals. *P < 0.00005 for effect of dietary salt. †P < 0.01 for stronger effect of dietary salt in STN. §P < 0.02 for the TGF response being anomalous in STN HS, on average.
Effects of STN and dietary salt on the relationship of SNGFR to arterial BP.
BP was logged during each tubular fluid collection and tested as a predictor of SNGFR in each group. The relationship of SNGFR to BP was qualitatively different between the groups. In STN-HS, where there was no stabilizing influence of TGF, there was a strong correlation of SNGFR with BP (0.32 ± 0.06 nl·min−1·mmHg−1). In STN-LS, where TGF was more normal, there was a weaker positive effect of BP on SNGFR (0.14 ± 0.03 nl·min−1·mmHg−1). In Sham-HS, BP and SNGFR correlated inversely (−0.41 ± 0.10 nl·min−1·mmHg−1), suggesting that spontaneous variations in BP and SNGFR were parallel consequences of fluctuations in overall vascular tone. In Sham-LS, BP and SNGFR were uncorrelated, possibly owing to TGF being most efficient in this group (see Fig. 2).
Fig. 2.
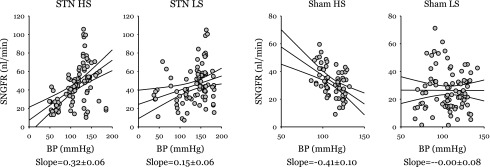
SNGFR vs. mean arterial blood pressure (BP). Lines are results of linear regression with 95% confidence intervals. A more positive regression slope, as with STN-HS, indicates greater sensitivity of SNGFR to BP, to wit, less efficient autoregulation of SNGFR. A negative regression slope, as with Sham HS, suggests that variations in both BP and SNGFR are primary accounted for by changes in the hormonal milieu that exert parallel effects on vascular resistance in the kidney and other organs. A horizontal slope, as with Sham LS, suggests efficient autoregulation of SNGFR where differences in BP do not account for variability in SNGFR. Multivariate general linear hypothesis testing for dependence of SNGFR on interactions among STN, diet, and BP confirmed strong effects of STN (P < 0.00005) and diet × STN (P = 0.004) on the regression slopes shown in this figure. Making separate regressions for collections ±TGF activation gave different intercepts, but did not affect the regression slopes. Thus data from both levels of TGF activation were pooled for the analysis shown in this figure.
Effects of STN and dietary salt on Jprox.
Jprox is plotted against SNGFR for each tubular fluid collection in Fig. 3. To examine the direct effects of STN and dietary salt on Jprox, it is necessary to remove the confounding dependence of Jprox on SNGFR. The influence of SNGFR on Jprox was removed by ANCOVA, and the result was designated as Primary effects of STN and dietary NaCl on Jprox are reflected by differences in (bar graph in Fig. 3). There was a positive correlation between and dietary NaCl in Sham rats and a negative correlation between and dietary NaCl in STN (P < 0.0005 for differential response to NaCl). It is counterintuitive that increasing dietary salt in Sham rats should cause to increase, but this phenomenon has been seen before (see text of discussion). Effects on late proximal flow (VLP) are shown in Fig. 4. The prevailing VLP under normal operating conditions is rendered indeterminate by the act of late proximal collection, which interrupts the TGF system, but resides somewhere between the values obtained at the TGF limits. Statistical comparisons were done by interpolating to the TGF midpoint for each nephron. VLP was greater in STN (P < 0.00005) and further increased by HS in STN (P < 0.04). The impact of HS was roughly fourfold greater in STN, albeit the STN × diet interaction did not achieve statistical significance (P = 0.3 for ANOVA cross term). Based on the ratio of GFR to SNGFR, there were roughly 4.5-fold fewer functioning nephrons in STN. Multiplying VLP by the GFR/SNGFR ratio suggests that changing from a LS to a HS diet will cause whole-kidney distal fluid delivery to increase by 90–100 μl/min in both STN and Sham rats.
Fig. 3.
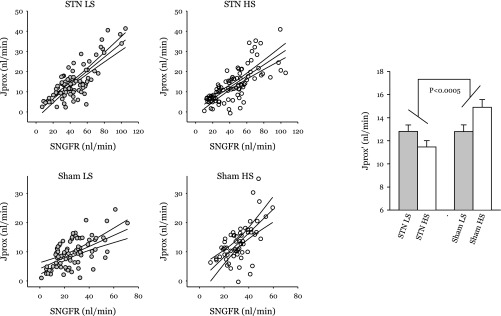
Scatterplots of proximal reabsorption (Jprox) vs. SNGFR for each group. Regression lines are shown with 95% confidence intervals. Bar chart: primary effects of STN and dietary NaCl on proximal reabsorption after controlling for SNGFR by ANOVA for covariance (ANCOVA). Proximal reabsorption adjusted for SNGFR is designated as Differences in reflect primary effects on the tubule, which are independent of filtered load. The effect of dietary NaCl on is distinctly different between STN and Sham (*P < 0.0005). The counterintuitive tendency for to increase on HS in Sham animals is a reproducible finding in normal rats (see text of discussion).
Fig. 4.
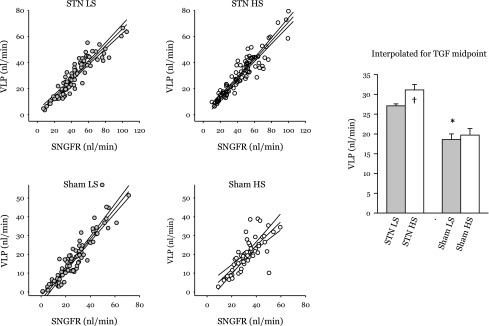
Effects of STN and dietary NaCl on late proximal flow (VLP). Scatterplot shows results of 326 individual late proximal tubular fluid collections divided among 4 groups with linear regression and 95% confidence intervals. The bar graph was generated by ANCOVA with blood pressure as covariate. *P < 0.00005 for effect of STN. †P < 0.04 for effect of diet in STN. The impact of HS was roughly 4-fold greater in STN, albeit the STN × diet interaction did not achieve statistical significance (P = 0.3 for ANOVA crossterm). Based on the ratio of GFR to SNGFR, there were roughly 4.5-fold fewer functioning nephrons in STN. Multiplying VLP by the GFR/SNGFR ratio suggests that changing from a LS to HS diet will cause whole-kidney distal fluid delivery to increase by 90–100 μl/min in both STN and Sham groups.
Tubular pressure responses.
Summary statistics for PFF and PSF at both extremes of TGF activation are presented in Table 3, and TGF responses for individual nephrons are shown in Fig. 5. PGC and ΔP, which are preferred variables for describing glomerular hemodynamics, were computed from PFF, PSF, and plasma oncotic pressure. Effects of STN and dietary salt on PFF were evaluated by two-way ANOVA. Effects of STN and dietary salt on the TGF response were evaluated by repeated-measures ANOVA. PFF was not affected by STN (16.7 ± 0.5 vs. 16.1 ± 0.5 mmHg), but was decreased by HS (14.9 ± 0.5 vs. 17.9 ± 0.5 mmHg, P < 0.00005). Absent TGF activation, STN caused glomerular capillary hypertension, both in absolute terms (PGC= 71 ± 2 vs. 60 ± 2 mmHg, P < 0.000005) and relative terms (PGC/BP = 0.55 ± 0.01 vs. 0.49 ± 0.01, P < 0.003). HS was associated with lower PGC (63 ± 2 vs. 69 ± 2, P < 0.02). ΔP was elevated in STN vs. Sham (55 ± 1 vs. 43 ± 1 mmHg, P < 0.00005). The effects of dietary salt on PFF and PGC were offset, such that dietary salt was not a determinant of ΔP. Activating TGF in Sham rats reduced PSF by 10 ± 1 mmHg on either diet. In STN-LS, the TGF response was reduced to 6 ± 1 mmHg and in STN-HS it was further reduced to −0.3 ± 1.0. From the within-subjects portion of the repeated-measures ANOVA, the effects of STN (P < 0.00005), dietary salt (P < 0.003), and the interaction between STN and dietary salt (P = 0.005) were all significant. The relationship of PGC to BP for individual nephrons differed between the groups in a way that mirrored the relationship of SNGFR to BP. Scatter plots with regression lines are shown in Fig. 6.
Table 3.
Micropuncture results: tubular pressures
| ΔP, mmHg |
PGC/BP |
||||
|---|---|---|---|---|---|
| PFF, mmHg | No TGF | Max TGF | No TGF | Max TGF | |
| STN-HS (n = 24) | 14.0 ± 0.6 | 55 ± 2 | 55 ± 2 | 0.61 ± 0.02 | 0.61 ± 0.02 |
| STN-LS (n = 19) | 18.1 ± 0.7 | 56 ± 2 | 50 ± 2 | 0.49 ± 0.02 | 0.46 ± 0.02 |
| Sham-HS (n = 16) | 15.7 ± 0.8 | 41 ± 2 | 32 ± 2 | 0.46 ± 0.02 | 0.38 ± 0.02 |
| Sham-LS (n = 22) | 17.6 ± 0.7 | 46 ± 2 | 36 ± 2 | 0.52 ± 0.02 | 0.43 ± 0.02 |
| ANOVA P Values for Effects of Dietary NaCl and STN | |||||
| STN | NS | <0.000005 | <0.000005 | 0.003 | <0.000005 |
| Dietary NaCl | 0.00007 | 0.014 | NS | 0.13 | 0.02 |
| STN*Dietary NaCl | 0.13 | NS | 0.02 | 0.00004 | <0.000005 |
Values are means ± SE from least squares ANOVA. PFF, free-flow tubular pressure; ΔP, transcapillary pressure difference; PGC, glomerular capillary pressure.
Fig. 5.

Changes in stop-flow pressure (PSF) upon TGF activation. Left: TGF responses for individual nephrons. A downward deflection indicates a normal TGF response. An upward deflection reflects anomalous TGF. Right: group means ± SE. By 2-way ANOVA, effects of STN (P < 0.00005), dietary salt (P < 0.003), and the interaction of STN with dietary salt (P < 0.005) were all significant. *P < 0.001 for difference between STN-HS and each other group by Tukey. †P < 0.03 for difference between STN-LS and Sham-LS by Tukey.
Fig. 6.
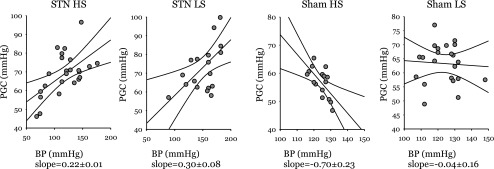
Glomerular capillary pressure (PGC) vs. mean arterial BP. Lines are results of linear regression with 95% confidence intervals. A more positive regression slope, as with STN-HS and STN-LS, indicates greater sensitivity of PGC to BP. A negative regression slope, as with Sham-HS, suggests that variations in both BP and PGC are primarilyy accounted for by changes in the hormonal milieu that exert parallel effects on vascular resistance in the renal afferent arteriole and other resistance vessels throughout the body. A horizontal slope, as with Sham-LS. suggests efficient autoregulation of PGC. Multivariate general linear hypothesis testing for dependence of PGC on interactions among STN, diet, and BP confirmed significant effects of STN (P < 0.00005) and diet × STN (P = 0.03) on the regression slopes shown in this figure. These interactions between STN and dietary NaCl on the autoregulation of PGC resemble the effects of these same treatments on the autoregulation of SNGFR shown in Fig. 2.
DISCUSSION
All mammals and many other animals are equipped for TGF, which suggests that TGF confers some health or survival advantage. Putative advantages afforded by TGF include the forestalling of volume depletion should there be a failure of Jprox, the attenuation of stretch-relaxation strain on the fragile glomerular capillary, a smoothing out of fluctuations in metabolic supply-demand, and the provision of a relatively stable load to the distal nephron, thereby aiding the distal nephron to make fine adjustments to the final urine. The present findings reveal that the early remnant kidney will forego the advantages of a normal TGF system when challenged with a high-NaCl diet.
While the requirement for long-term balance is absolute, the kidney has flexibility to achieve this through any feasible combination of adjustments in SNGFR, Jprox, and distal reabsorption that adds up to a prior change in NaCl intake. If TGF confers a more stable distal delivery, then it also reduces the contribution of nephron segments upstream of the macula densa to NaCl homeostasis, thereby making the process of NaCl homeostasis less efficient. Phenomenologically, Na balance resembles a first-order linear dissipative process with a time constant ≈0.8 day−1 (35). In other words, for every 1 meq/day increase in dietary salt, a normal animal will retain 1.25 meq of total body Na before reaching the new steady state. A simple model for estimating the impacts of TGF and GTB on the efficiency of Na homeostasis predicts that the amount of retained Na would be reduced by ≈35% if TGF did not exist (26).
To accommodate a given change in dietary NaCl, the STN kidney, which operates with fivefold fewer nephrons, must effect a fivefold greater change in NaCl excretion per nephron than its sham-operated counterpart. The present data reveal that the STN kidney meets the requirement for wider variations in per-nephron NaCl excretion by making both TGF and Jprox sensitive to dietary NaCl. Each of these effects facilitates increased participation of nephron segments upstream of the macula densa in NaCl homeostasis.
The current data do not preclude some resetting of the TGF response to dietary salt in sham-operated rats, but they do indicate that TGF remains grossly intact in normal rats on a high-NaCl diet, as previously reported (14, 32). In stark contrast to the usual case, the STN kidney adapts to a high-NaCl diet by converting its TGF response from negative to positive feedback. Positive feedback is inherently destabilizing and arises only occasionally in physiology.
The present data reveal that TGF, which is well known for negative feedback, can also manifest positive feedback under at least one extreme circumstance. How might this occur? The simplest paradigm for a controller capable of both negative and positive feedback consists of two parallel feedback loops, one with negative gain and the other with positive gain. These gains are additive for determining overall system behavior. Such a system can be converted from negative to positive feedback by adjusting the strength of its two components without changing their inherent nature. Exposing the macula densa to NaCl leads to formation of adenosine, which mediates for the usual TGF-mediated vasoconstriction (22, 24). Exposing the macula densa to NaCl (8) also leads to formation of vasodilatory nitric oxide, which is normally viewed as a modulator that lessens the TGF response (16, 34). If adenosine and nitric oxide arise in parallel from the macula densa, it is no contradiction that a situation should exist where nitric oxide dominates, leading to TGF with positive feedback. Nitric oxide was first shown to mediate the natriuretic response to a high-salt diet in normal rats by Shultz (19) in 1993. Shortly thereafter, Ollerstam et al. (15) produced data indicating that nitric oxide emanating from the macula densa was largely responsible. Furthering the notion that an altered balance between nitric oxide and adenosine might apply to the present case, dietary salt was recently discovered to induce splice variants of macula densa nitric oxide synthase that are most stimulated by tubular fluid NaCl (11). Positive feedback might also result if vasodilation linked to sodium reabsorption in the connecting tubule (so-called cTGF) (17, 36) were shown to affect SNGFR and to achieve dominance over traditional TGF. Finally, there are vasodilator (A2AR) and vasonconstrictor (A1AR) adenosine receptors in the glomerulus (2), so, in theory, one could convert adenosine to a vasodilator by increasing the A2AR/A1AR ratio. These are a few testable hypotheses to explain the present findings based on mechanisms known to operate in the juxtaglomerular apparatus.
The anomalous TGF response in STN rats fed high NaCl should have ramifications beyond NaCl homeostasis. For example, eliminating TGF reduces the efficiency of renal blood flow autoregulation by ∼50% (6, 9). The effect of converting TGF to a positive feedback system should reduce rebal blood flow autoregulatory efficiency to a greater degree than merely eliminating TGF. Positive feedback from TGF should also result in wider fluctuations in mechanical strain experienced by the glomerular capillary wall, where cyclic stretch-relaxation induces the adjacent mesangium to form matrix and express leukocyte adhesion molecules (4, 18). Hence, accelerated glomerulosclerosis may be a price to pay for maintaining efficient NaCl homeostasis with fewer functioning nephrons.
A traditional assessment of autoregulatory efficiency involves repeated measures of the variable being autoregulated at different perfusion pressures. Nonetheless, the regression plots in Figs. 2 and 6, which contain only one BP value per nephron, suggest major effects of STN and dietary salt on the autoregulation of SNGFR and PGC. Differences among the regression slopes can be explained by a simple paradigm where SNGFR and PGC are subject to the influence of three factors: BP, systemic vascular tone, and autoregulation. Changes in BP affect SNGFR and PGC directly. Changes in systemic vascular tone that affect the kidney more than other organs cause SNGFR and PGC to vary inversely with BP. Renal autoregulation offsets changes in SNGFR and PGC caused by the other two factors. The data shown in Figs. 2 and 6 indicate that STN renders both SNGFR and PGC susceptible to changes in BP, whereas BP is a nondeterminant of PGC or SNGFR in Sham-LS and correlates negatively with SNGFR and PGC in Sham-HS. Working from our paradigm, the effects of BP in STN reflect poor autoregulation, while the negative regression slopes for Sham-HS suggest that variation in BP, SNGFR, and PGC are parallel consequences of differences in overall tone of the arterial circulation, which holds sway either because HS leads to more variability in vascular tone or because there is less efficient autoregulation than in Sham-LS. Ironically, when two variables are coupled by perfect negative feedback, they appear uncorrelaed since all variability owes to uncorrelated noise. Consequently, SNGFR and PGC are uncorrelated with BP in Sham-LS, due to efficient autoregulation. The act of measuring SNGFR or PSF renders the TGF system inoperative in the nephron where measurements are done. However, perfusion of the index nephron is coupled to TGF activation in nearby nephrons, such that intergroup differences in TGF are expected to contribute to the findings in Figs. 2 and 6 (1, 3, 12). Studies are underway to test the effect of dietary salt on renal blood flow autoregulation in STN at the whole kidney level, where a TGF signature appears in the dynamics.
While anomalous TGF is the most striking feature of this study, STN also modified the effect of dietary NaCl on Jprox. Delivered load is always the main determinant of tubular reabsorption. So, the confounding influence of SNGFR was taken into account in testing for direct effects of a treatment on Jprox as previously described (5, 14, 20, 27, 30).
It is intuitive that HS should reduce in STN, since expanding the extracellular volume should suppress the renal nerve traffic and systemic renin-angiotensin system, which stimulate Jprox. What is not intuitive is that HS should cause to actually increase in control rats. However, increased in normal rats fed HS is a consistent finding whenever we have tested for the effect of dietary salt on Jprox in normal rats (14, 27, 28). A likely explanation for the phenomenon is that the proximal tubule undergoes hypertrophy on HS (28, 33) in response to a sustained increase in SNGFR, which is “permitted” to increase more than necessary to excrete the additional salt intake. In other words, the increase in represents a form of long-term GTB. A boundary condition for any form of GTB is that it cannot cause SNGFR and VLP to change in opposite directions. This minimal requirement is met by the current data (see Table 2, Figs. 3 and 4) where feeding HS to normal rats causes both and VLP to increase. Another factor that normally prevents from declining during HS diet is a compartmentalized proximal tubular renin-angiotensin system. HS suppresses the systemic renin-angiotensin system, but does not reduce the amount of angiotensin II in proximal tubular fluid or the strong tonic influence of angiotenstin II on in normal rats (27).
If normally increases on HS due to tubular hypertrophy, then might decline on HS if HS were somehow unable to elicit growth of the tubule. In the early STN, compensatory hypertrophy may exhaust the capacity for further growth, such that dietary salt has no effect on the amount of reabsorptive machinery. Another model in which HS so markedly suppresses is the hyperfiltering kidney of early diabetes where salt sensitivity of has been tied directly to hypertrophy (14). Diabetes and STN appear to hold in common that both are models of nephron hypertrophy/hyperfunction where becomes sensitive to dietary salt. However, they differ in the major regard that HS makes for anomalous TGF responses only in STN. In diabetes, salt-sensitive engages a normal TGF response, leading to a reciprocal effect of dietary salt on GFR, known as the “salt paradox” (13, 14, 23, 32). Due to anomalous TGF, there is no salt paradox in STN.
To summarize, normal TGF stabilizes nephron function but slows the process of NaCl homeostasis. The early remnant kidney responds to a HS diet by suppressing Jprox and converting TGF from a negative to a positive feedback system. This compromise is expected to result in more erratic nephron function but more stable total body NaCl. Positive feedback from TGF has not previously been reported but could, in theory, be explained by modulating the activities of known mediators within the juxtaglomerular apparatus. To reveal the cause(s) and confirm the consequences of anomalous TGF in the remnant kidney will require further investigation.
GRANTS
This work was supported by a Merit Review Grant from the Department of Veterans Affairs (S. C. Thomson), National Institutes of Health (NIH) Grant K08-DK084305 (P. Singh), and the NIH O'Brien Center for Acute Kidney Injury Research (P30 DK079337).
DISCLOSURES
No conflicts of interest, financial or otherwise, are declared by the authors.
AUTHOR CONTRIBUTIONS
Author contributions: P.S. and S.C.T. provided conception and design of research; P.S. and S.C.T. performed experiments; P.S. and S.C.T. interpreted results of experiments; P.S. and S.C.T. edited and revised manuscript; P.S. and S.C.T. approved final version of manuscript; S.C.T. analyzed data; S.C.T. prepared figures; S.C.T. drafted manuscript.
ACKNOWLEDGMENTS
Some of the results have been presented as an oral presentation by P. Singh at the American Society of Nephrology Renal Week, 2010.
REFERENCES
- 1.Bayram S, Stepien TL, Pitman EB. TGF-mediated dynamics in a system of many coupled nephrons. Bull Math Biol 71: 1482–1506, 2009 [DOI] [PubMed] [Google Scholar]
- 2.Carlstrom M, Wilcox CS, Welch WJ. Adenosine A2 receptors modulate tubuloglomerular feedback. Am J Physiol Renal Physiol 299: F412–F417, 2010 [DOI] [PMC free article] [PubMed] [Google Scholar]
- 3.Chen YM, Yip KP, Marsh DJ, Holstein-Rathlou NH. Magnitude of TGF-initiated nephron-nephron interactions is increased in SHR. Am J Physiol Renal Fluid Electrolyte Physiol 269: F198–F204, 1995 [DOI] [PubMed] [Google Scholar]
- 4.Cortes P, Riser BL, Yee J, Narins RG. Mechanical strain of glomerular mesangial cells in the pathogenesis of glomerulosclerosis: clinical implications. Nephrol Dial Transplant 14: 1351–1354, 1999 [DOI] [PubMed] [Google Scholar]
- 5.Deng A, Thomson SC. Renal NMDA receptors independently stimulate proximal reabsorption and glomerular filtration. Am J Physiol Renal Physiol 296: F976–F982, 2009 [DOI] [PMC free article] [PubMed] [Google Scholar]
- 6.Hashimoto S, Huang Y, Briggs J, Schnermann J. Reduced autoregulatory effectiveness in adenosine 1 receptor-deficient mice. Am J Physiol Renal Physiol 290: F888–F891, 2006 [DOI] [PubMed] [Google Scholar]
- 7.Holstein-Rathlou NH. A closed-loop analysis of the tubuloglomerular feedback mechanism. Am J Physiol Renal Fluid Electrolyte Physiol 261: F880–F889, 1991 [DOI] [PubMed] [Google Scholar]
- 8.Ito S, Ren Y. Evidence for the role of nitric oxide in macula densa control of glomerular hemodynamics. J Clin Invest 92: 1093–1098, 1993 [DOI] [PMC free article] [PubMed] [Google Scholar]
- 9.Just A. Mechanisms of renal blood flow autoregulation: dynamics and contributions. Am J Physiol Regul Integr Comp Physiol 292: R1–R17, 2007 [DOI] [PubMed] [Google Scholar]
- 10.Landis EM, Pappenheimer JR. Exchange of substances through the capillary walls. In: Handbook of Physiology. Circulation. Bethesda, MD: Am Physiol Soc, 1963, sect. 2, vol. II, chapt. 29, p. 961–1034 [Google Scholar]
- 11.Lu D, Fu Y, Lopez-Ruiz A, Zhang R, Juncos R, Liu H, Manning RD, Jr, Juncos LA, Liu R. Salt-sensitive splice variant of nNOS expressed in the macula densa cells. Am J Physiol Renal Physiol 298: F1465–F1471, 2010 [DOI] [PMC free article] [PubMed] [Google Scholar]
- 12.Marsh DJ, Toma I, Sosnovtseva OV, Peti-Peterdi J, Holstein-Rathlou NH. Electrotonic vascular signal conduction and nephron synchronization. Am J Physiol Renal Physiol 296: F751–F761, 2009 [DOI] [PMC free article] [PubMed] [Google Scholar]
- 13.Miller JA. Renal responses to sodium restriction in patients with early diabetes mellitus. J Am Soc Nephrol 8: 749–755, 1997 [DOI] [PubMed] [Google Scholar]
- 14.Miracle CM, Rieg T, Mansoury H, Vallon V, Thomson SC. Ornithine decarboxylase inhibitor eliminates hyperresponsiveness of the early diabetic proximal tubule to dietary salt. Am J Physiol Renal Physiol 295: F995–F1002, 2008 [DOI] [PMC free article] [PubMed] [Google Scholar]
- 15.Ollerstam A, Pittner J, Persson AE, Thorup C. Increased blood pressure in rats after long-term inhibition of the neuronal isoform of nitric oxide synthase. J Clin Invest 99: 2212–2218, 1997 [DOI] [PMC free article] [PubMed] [Google Scholar]
- 16.Persson AE, Lai EY, Gao X, Carlström M, Patzak A. Interactions between adenosine, angiotensin II and nitric oxide on the afferent arteriole influence sensitivity of the tubuloglomerular feedback. Front Physiol 18: 187, 2013 [DOI] [PMC free article] [PubMed] [Google Scholar]
- 17.Ren Y, Garvin JL, Liu R, Carretero OA. Crosstalk between the connecting tubule and the afferent arteriole regulates renal microcirculation. Kidney Int 71: 1116–1121, 2007 [DOI] [PubMed] [Google Scholar]
- 18.Riser BL, Varani J, Cortes P, Yee J, Dame M, Sharba AK. Cyclic stretching of mesangial cells up-regulates intercellular adhesion molecule-1 and leukocyte adherence: a possible new mechanism for glomerulosclerosis. Am J Pathol 158: 11–17, 2001 [DOI] [PMC free article] [PubMed] [Google Scholar]
- 19.Shultz PJ, Tolins JP. Adaptation to increased dietary salt intake in the rat. Role of endogenous nitric oxide. J Clin Invest 91: 642–650, 1993 [DOI] [PMC free article] [PubMed] [Google Scholar]
- 20.Singh P, Deng A, Blantz RC, Thomson SC. Unexpected effect of angiotensin AT1 receptor blockade on tubuloglomerular feedback in early subtotal nephrectomy. Am J Physiol Renal Physiol 296: F1158–F1165, 2009 [DOI] [PMC free article] [PubMed] [Google Scholar]
- 21.Slomowitz LA, Peterson OW, Thomson SC. Converting enzyme inhibition and the glomerular hemodynamic response to glycine in diabetic rats. J Am Soc Nephrol 10: 1447–1454, 1999 [DOI] [PubMed] [Google Scholar]
- 22.Sun D, Samuelson LC, Yang T, Huang Y, Paliege A, Saunders T, Briggs J, Schnermann J. Mediation of tubuloglomerular feedback by adenosine: evidence from mice lacking adenosine 1 receptors. Proc Natl Acad Sci USA 98: 9983–9988, 2001 [DOI] [PMC free article] [PubMed] [Google Scholar]
- 23.Takenaka T, Inoue T, Ohno Y, Miyazaki T, Nishiyama A, Ishii N, Suzuki H. Elucidating mechanisms underlying altered renal autoregulation in diabetes. Am J Physiol Regul Integr Comp Physiol 303: R495–R504, 2012 [DOI] [PubMed] [Google Scholar]
- 24.Thomson S, Bao D, Deng A, Vallon V. Adenosine formed by 5′-nucleotidase mediates tubuloglomerular feedback. J Clin Invest 106: 289–298, 2000 [DOI] [PMC free article] [PubMed] [Google Scholar]
- 25.Thomson SC, Blantz RC. Homeostatic efficiency of tubuloglomerular feedback in hydropenia, euvolemia, and acute volume expansion. Am J Physiol Renal Fluid Electrolyte Physiol 264: F930–F936, 1993 [DOI] [PubMed] [Google Scholar]
- 26.Thomson SC, Blantz RC. Glomerulotubular balance, tubuloglomerular feedback, and salt homeostasis. J Am Soc Nephrol 19: 2272–2275, 2008 [DOI] [PubMed] [Google Scholar]
- 27.Thomson SC, Deng A, Wead L, Richter K, Blantz RC, Vallon V. An unexpected role for angiotensin II in the link between dietary salt and proximal reabsorption. J Clin Invest 116: 1110–1116, 2006 [DOI] [PMC free article] [PubMed] [Google Scholar]
- 28.Thomson SC, Deng A, Bao D, Satriano J, Blantz RC, Vallon V. Ornithine decarboxylase, kidney size, and the tubular hypothesis of glomerular hyperfiltration in experimental diabetes. J Clin Invest 107: 217–224, 2001 [DOI] [PMC free article] [PubMed] [Google Scholar]
- 29.Thomson SC, Kashkouli A, Singh P. Glucagon-like peptide-1 receptor stimulation increases GFR and suppresses proximal reabsorption in the rat. Am J Physiol Renal Physiol 304: F137–F144, 2013 [DOI] [PMC free article] [PubMed] [Google Scholar]
- 30.Thomson SC, Rieg T, Miracle C, Mansoury H, Whaley J, Vallon V, Singh P. Acute and chronic effects of SGLT2 blockade on glomerular and tubular function in the early diabetic rat. Am J Physiol Regul Integr Comp Physiol 302: R75–R83, 2012 [DOI] [PMC free article] [PubMed] [Google Scholar]
- 31.Thomson SC, Tucker BJ, Gabbai F, Blantz RC. Functional effects on glomerular hemodynamics of short-term chronic cyclosporine in male rats. J Clin Invest 83: 960–969, 1989 [DOI] [PMC free article] [PubMed] [Google Scholar]
- 32.Vallon V, Huang DY, Deng A, Richter K, Blantz RC, Thomson S. Salt-sensitivity of proximal reabsorption alters macula densa salt and explains the paradoxical effect of dietary salt on glomerular filtration rate in diabetes mellitus. J Am Soc Nephrol 13: 1865–1871, 2002 [DOI] [PubMed] [Google Scholar]
- 33.Vallon V, Kirschenmann D, Wead LM, Lortie MJ, Satriano J, Blantz RC, Thomson SC. Effect of chronic salt loading on kidney function in early and established diabetes mellitus in rats. J Lab Clin Med 130: 76–82, 1997 [DOI] [PubMed] [Google Scholar]
- 34.Vallon V, Thomson S. Inhibition of local nitric oxide synthase increases homeostatic efficiency of tubuloglomerular feedback. Am J Physiol Renal Fluid Electrolyte Physiol 269: F892–F899, 1995 [DOI] [PubMed] [Google Scholar]
- 35.Walser M. Phenomenological analysis of renal regulation of sodium and potassium balance. Kidney Int 27: 837–841, 1985 [DOI] [PubMed] [Google Scholar]
- 36.Wang H, D'Ambrosio MA, Garvin JL, Ren Y, Carretero OA. Connecting tubule glomerular feedback mediates acute tubuloglomerular feedback resetting. Am J Physiol Renal Physiol 302: F1300–F1304, 2012 [DOI] [PMC free article] [PubMed] [Google Scholar]