



Abstract
This UNIT describes approaches and tools for studying the dynamics and organization of endoplasmic reticulum (ER) membranes and proteins in living cells using commercially available widefield and confocal laser scanning microscopes (CLSM). It has been long appreciated that the ER plays a number of key roles in secretory protein biogenesis, calcium regulation, and lipid synthesis. However, study of these processes has been often restricted to biochemical assays that average the behaviors of millions of lysed cells or to imaging static fixed cells. Now, with new fluorescent protein reporter tools, highly sensitive commercial microscopes, and photobleaching techniques, it is possible to interrogate the behaviors of ER proteins, membranes, and stress pathways in single cells with exquisite spatial and temporal resolution. The ER presents a unique set of imaging challenges including the high mobility of ER membranes, a diverse range of dynamic ER structures, and the influence of post-translational modifications on fluorescent protein reporters. Solutions to these challenges are described and considerations for performing photobleaching assays, especially Fluorescence Recovery after Photobleaching (FRAP) and Fluorescence Loss in Photobleaching (FLIP) for ER proteins will be discussed. In addition, ER reporters and ER-specific pharmacologic compounds are presented with a focus on misfolded secretory protein stress and the Unfolded Protein Response (UPR).
Keywords: FRAP, FLIP, Confocal microscopy, Live cell imaging, superfolder Green Fluorescent Protein, diffusion, membrane, tubule, microtubule
INTRODUCTION
The development of live cell microscopy techniques has fostered a growing appreciation for how the ER’s dynamic, intricate, and varied architecture (Figure 3) influence its diverse functions (Lee and Chen, 1988; Voeltz et al., 2002; Snapp, 2003; Snapp et al., 2003; Shibata et al., 2006; English et al., 2009; Friedman and Voeltz, 2011; West et al., 2011). Earlier models of the ER considered the organlle as a relatively static matrix of chemicals and enzymes. This view probably arose due to the static nature of electron microscopy and immunofluorescence microscopy. Fluorescent dyes and FP probes have revealed that the ER membrane structures apparent in transmission electron micrographs are in constant motion. The connections between ER structure and function are only now becoming apparent. For example, live fluorescence microscopy has revealed how mitochondria use the branching ER tubules as a site for mitochondrial fission (Friedman et al., 2011). The ER plays roles in the biogenesis and maintenance of other cellular membranous organelles including lipid droplets, peroxisomes, and the Golgi Apparatus. While traditional biochemistry, genetics, and electron microscopy remain powerful and essential tools for the cell biologist, live cell imaging permits the asking of new types of questions. For example, one may know how many molecules of a protein are in a cell and how they are distributed in space. However, with live cell imaging, one can determine how “available” molecules are, whether and how molecules move from one region of a cell to another, and how an individual cell will fare with particular starting conditions. Molecular availability encompasses the idea that how molecules can and do encounter each other defines a key facet of protein-protein interactions. Is a protein mobile or fixed in place, such that other molecules must be able to travel to it? If a protein is mobile, how mobile is it? Are there subpopulations of mobile and immobile proteins, and if so, do the amounts of these subpopulations change with cell stress or other environmental alterations? The ability to quantitate a protein’s availiability provides an important new molecular parameter that is arguably as fundamental a protein’s amino acid sequence and crystal structure.
Figure 3. ER Membrane Structures.
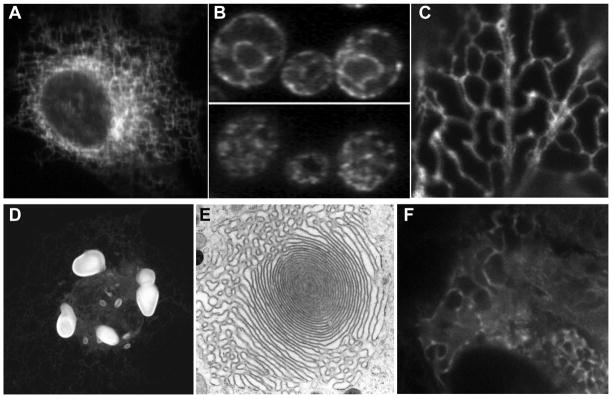
(A–C) Examples of branching tubule networks in a mammalian Cos-7 cell, fungus (S. cerevisiae), and plants (N. tobacum)(plant ER image courtesy of Dr. Federica Brandizzi), respectively. For yeast, focal planes are shown for the middle of the cell (B, top) and periphery of the cell (B, bottom). (D) Cos-7 cell expressing an EGFP-tagged ER membrane protein that induces formation of large dense whorl structures termed OSER. (E) Transmission electron micrograph of whorl structure (courtesy of Dr. Maura Francolini). (F) ER sheet membrane in MDCK cell expressing ER-mRFP.
STRATEGIC PLANNING
Live cell imaging of the ER can be performed by tagging resident ER proteins with fluorescent proteins (FPs) or by adding specific ER targeting sequences to FPs. Commercial dyes can also be used (see UNIT 4.4). One can image the ER in live cells to quantitate changes in ER structure, as well as interactions between the ER and mitochondria and the cytoskeleton. Changes in the organization and availability of resident ER and secretory proteins can be investigated with FRAP and FLIP protocols.
Live Cell Sample Preparation
-
Plate cells in a suitable imaging chamber with microscope appropriate coverglass, at least 16 hr before transfecting cells or imaging. When working with fluorescent ER reporters, it is recommended to first make a stable cell line expressing the reporter. Transient transfections and overexpression driven by CMV promoters can stress cells, and in turn, impact ER homeostasis. For primary cultures where markers cannot be stably expressed, transient expression systems (cationic lipids or lentiviruses) can be used to express molecules at low levels for short period of time. In addition, fluorescent dyes can stain the ER for short-term experiments. Dye-labeled ER should NOT be used for photobleaching experiments. The dyes tend to release high levels of reactive oxygen species when photobleached.
When overexpressing proteins in the ER, one should confirm that expression of the fluorescent reporter does not significantly impact ER morphology. This can be done by comparing ER morphology in the transfected or stable expressing cells and the untransfected cells with an antibody against the ER (rabbit anti-PDI (ADI-SPA-890-D)(Assay Designs Inc. or Thermo Fisher Scientific, Inc.) is one of the best general antibodies to label the entire ER in mammalian cells) (see BASIC PROTOCOL 1 on ER Immunofluorescence). If significant differences are apparent in some of the transfected cells, the investigator should assess whether this is a general property of the protein or only observed with highly overexpressing cells. To do this, take several images of fields of cells with the same exposure and imaging conditions. Identify imaging conditions that avoid pixel saturation, but enable detection of low expressing cells. Use ImageJ (http://rsbweb.nih.gov/ij/) to quantitate mean fluorescence intensities of cells expressing the fluorescence reporter. Score the cells for the presence or absence of distorted ER structure and then determine if there is a correlation with reporter expression levels. It may be possible to still use the reporter for imaging experiments, but only in cells expressing the lowest levels.
Pre-warm imaging medium at 37°C and replace the medium in imaging chambers.
Prior to the experiment, pre-warm the stage warmer or environmental housing on the microscope for at least 20 min before the experiment. For live cell imaging and especially for diffusion measurements, it is critical that the cells be warmed to the appropriate temperature. Diffusion is directly dependent on temperature and we have observed significant differences in FRAP measurements collected at 25°C and 30°C and 37°C for both mammalian cells and yeast.
Choice of ER Reporter
To correctly interpret imaging results, it is important to understand the differences between types of ER reporters. At light microscopy resolution, one cannot distinguish between ER membranes and the ER lumen. Yet, the viscosity of ER membranes and the physico-chemical environment of the ER lumen will affect reporter mobility and processing.
For photobleaching experiments, the ER fluorescent reporter should be bright and photostable, but can photobleach irreversibly. Irreversible photobleaching is critical for diffusion measurements because refluorescence of a photobleached molecule will artifactually contribute to the apparent fluorescence recovery in the photobleach region of interest. This can be checked by performing a control photobleaching experiment by bleaching the entire cell or fluorescent ER distribution. If significant recovery (greater than 10%) of mean fluorescence intensity is observed within a minute, the fluorescence reporter is unlikely to be suitable for photobleaching experiments, as it appears to be undergoing reversible photobleaching.
Fluorescent Proteins in the ER
Live cell fluorescence imaging depends on robustly fluorescent reporters. While a number of FPs do fluoresce in the ER, not all FPs are appropriate for use in the ER. A number of issues influence choice of FP selection for live cell imaging experiments (see UNITS 21.4 & 21.5). It is important to appreciate that FPs evolved in the cytoplasm of organisms. Modifed variants are typically selected for in the cytoplasm of bacteria. Thus, the FPs have not necessarily been optimized for use in the ER. ER reporters need to fold and fluoresce in the ER lumen and not artifactually oligomerize. We recommend superfolder GFP (sfGFP) (Pedelacq et al., 2006; Aronson et al., 2011) for all ER applications and mCherry (Shaner et al., 2004) for some ER luminal applications. See the Commentary section for an extensive discussion of FP choices and issues for the ER.
Making correctly targeted fusion proteins
This topic is discussed extensively in UNIT 21.4 and (Snapp, 2009). Briefly, ER proteins have one or more targeting sequence motifs that are essential for targeting to and enrichment in the ER. These motifs include the signal peptide for translocation into the ER and ER retrieval motifs such as KDEL for luminal proteins and KKXX for membrane proteins. These targeting motifs have absolute sequence position requirements. They must be at the NH2- or -COOH terminus to be functional (Munro and Pelham, 1987; Jackson et al., 1993; Hegde and Bernstein, 2006). Therefore, placement of FPs in fusions must factor in these considerations. We find several proteins are tolerant of placement of the FP at the COOH terminus followed by the addition of the KKXX or KDEL to the COOH-terminus of the FP by PCR (Snapp et al., 2006; Lai et al., 2010; Lajoie et al., 2012). In addition, insertion of the FP after the signal peptide cleavage site, if known, can also be tolerated. Always validate localization of a fusion protein relative to the native protein lacking epitope tags by immunofluorescence. Even a small 9 amino acid HA tag placed after a KDEL renders the KDEL inactive. Antibodies remain valuable tools even in the age of FPs.
Special Considerations for Aquiring Images of the ER
Confocal microscopy is covered in UNIT 4.5 and widefield fluorescence microscopy is described in UNIT 4.2. This UNIT assumes that the investigator has been trained in the basic operation of the microscope to be used for the described assays.
Gross changes in the organization of ER membranes and the rates of membrane movements can be readily captured by confocal, widefield, and deconvolution microscopy (Wallace et al., 2001; Swedlow, 2007). However, many of the details of ER architecture are not fully resolved by light resolution microscopy (~200 nm in the lateral plane and 500–800 nm in the axial plane). This is because most ER structures are quite narrow (tubules are 40–70 nm in diameter, but very long (microns)). Investigators are cautioned that fluorescence microscopy measurements of ER membrane diameters are inherently inaccurate (often appearing as 0.1–0.3 μm and several hundred nm in the axial plane).
To optimize ER membrane imaging, a high resolution objective (i.e. 60–100x N.A. 1.4), a bright fluorescent reporter, and a sensitive detector that enables capture of image pixels ~0.1–0.2 μm wide (achievable with most confocal microscopes built since the late 1990’s) will help resolve many of the fine details of most ER structures- for fixed cells. Detector sensitivity and frame acquisition rates become more important for some live cell assays of ER structure. In the first protocol, we consider fixed samples and then we consider requirements for the highly dynamic live cells.
BASIC PROTOCOL 1 IMAGING ER STRUCTURES IN FIXED CELLS
This protocol is appropriate for a confocal laser scanning microscope, spinning disk confocal microscope or a deconvolution microscope. Standard widefield fluorescence microscopes can be used to image ER structures in the periphery of large flat cells, such as Cos-7 and U2-OS cells. Thicker cells with dense ER membranes in multiple focal planes often require the improved axial resolving power of confocal or deconvolution microscopes.
Photobleaching protocols have been described extensively in UNIT 21.1. That UNIT also describes some practical issues of expressing and imaging FP-reporters in living cells, preparation of transfected mammalian cells for imaging on a CLSM, CLSM setup, and quantitation of protein mobility and organelle dynamics. In this UNIT, we describe ER-specific considerations. The protocols are described primarily for mammalian cells, though the concepts can apply to ER structures in other systems, including plant and yeast cells.
MATERIALS LIST
Cells expressing fluorescent protein reporter or to be stained with dye-labeled antibodies
Primary antibody against antigen and Secondary antibody labeled with fluorescent dye
-
Immersion oil for microscope objective
(Note: oils from different microscope manufacturers are NOT interchangeable. Some oils corrode objectives made by other companies).
Labtek or Mattek chambers
Confocal (laser scanning or spinning disk) or widefield fluorescence microscope adapted for deconvolution with appropriate filter set(s) and illumination source(s)
63x NA 1.4 oil plan apochromat objective
-
Grow adherent cells on coverslip or coverglass chamber, such as a MatTek glass bottom dish or a Labtek coverglass chamber (Nunc). Suspension cells can be adhered to coverglass treated with concentrated poly-lysine. Cells should be either transfected to express an FP reporter or investigator should identify an antibody to appropriately label the ER. We find rabbit anti-PDI (ADI-SPA-890-D)(Assay Designs Inc. or Thermo Fisher Scientific, Inc.) is one of the best general antibodies to label the entire ER in mammalian cells.
Note: Poly-L-Lysine (available from multiple sources including Electron Microscopy Sciences, #19320-A) binds any proteins. Cell media contains high concentrations of proteins, which will compete with cells for poly-lysine binding sites. Therefore, it is important to first wash cells twice in 1 X PBS (appropriate growth temperature, i.e. 37°C for mammalian cells) before adhering cells.
-
Wash cells once with PBS to remove media. Fix cells with an appropriate fix for 15 minutes.
For membranous organelles, it is critical to use a “hard” fix to preserve membrane structure. Formaldehyde or paraformaldehyde are the best choices. Methanol generally does not preserve membrane structure. Formaldehyde can be freshly diluted 1:10 (i.e. 3.7% in 1 X PBS) from a 37% solution (which is stabilized in methanol) open for less than six months. Formaldehyde solutions with a white precipitate will be less concentrated and will fix cells poorly. Paraformaldehyde can be made fresh or purchased in glass ampules (Electron Microscopy Sciences, #15700) and also diluted to 4% in 1 X PBS. After fixation, rinse cells twice with 1 X PBS to remove formaldehyde. Dispose of formaldehyde according to institution’s hazardous chemicals rules.
-
If cells are expressing an ER FP reporter, cells should be ready for imaging. If cells need to be labeled with an antibody, permeabilize cells with 0.1% triton X-100 in 1 X PBS for 10 minutes.
Saponin and digitonin are not appropriate for permeabilizing the ER, as these detergents bind cholesterol, which is not present in high concentrations in the ER membrane.
-
Block cells in 10% fetal bovine serum in 1 X PBS for 30 min. Label with primary and secondary antibodies using empirically determined appropriate concentrations and times.
We use 1 hr for each antibody in block solution, separated by two quick washes and four five minute washes. Cells can be imaged in PBS or a mounting medium (such as Fluormount G, Southern Biotechnology).
One can affix fixed cells on a coverslip onto a glass slide with mounting medium. However, in spite of their small size, cells on coverslips can be crushed against the glass slide and this will distort cell structure. We recommend fixing and imaging cells under conditions that avoid crushing cells.
Prewarm microscope light source, lasers or arc lamp to ensure stable light source output. Use a high resolution objective (i.e. NA = 1.4). The higher the numerical aperture, the better defined the ER membrane structures will be.
-
Identify the cell of interest on the microscope. Bring the desired cell into focus. Scan or capture an image of the whole cell at the desired excitation light intensity.
To improve image quality, the investigator can slow scan speeds, apply line or frame averaging, and shut the confocal pinhole down to one airy unit, etc. For example, a 16 frame averaged image at high laser power will appear very sharp. However, these conditions will likely cause substantial photobleaching of the cell such that Z series will lose most of the fluorescent signal in the middle of acquisition. With a high quality detector and robust fluorescence labeling of a sample, it should be possible to capture a robust Z series of high quality images. Modify pinhole to a single airy unit (for a confocal microscope) and detector gain for maximal fluorescence signal and minimal pixel saturation. Detector gain and offset will vary depending on the concentration of the fluorophore and the illumination power.
-
Collect images in a single focal plane and/or a Z series. For 3D reconstruction, one must oversample images, collecting slices half of the effective resolution, so called “Nyquist sampling.” Adjust the Z-stack acquisition parameters for Nyquist sampling at one half the distance of Z resolution. This can be roughly calculated using the resolution equation:
For an NA 1.4 objective on a confocal microscope, maximal resolution is ~500 nm in the axial or Z dimension for most fluorophore wavelengths, assuming image acquisition is with a pinhole closed to image focal planes of 1 airy unit. Therefore, Nyquist sampling will be 250 nm (0.25 μm) per Z slice for a 500 nm axial resolution. For a deconvolution microscope, the maximum resolution of an NA 1.4 objective is closer to 800 nm, so Z slices should be acquired at 400 nm.
-
Acquire the Z series. Confirm there is no obvious/significant photobleaching of the cell with successive image slices. Then use the microscope software, ImageJ (http://rsbweb.nih.gov/ij/) or a commercial program, such as Volocity (Perkin Elmer) to create a 3D reconstruction of the cell for confocal images or the deconvolution software appropriate to the system for widefield images (Wallace et al., 2001; Swedlow, 2007).
While this protocol is not meant to be a tutorial on deconvolution, we remind investigators to use image restoration software that incorporates information about the point spread function. Nearest neighbor algorithms are deblurring filters and not true deconvolution and should not be used for any quantitative imaging experiments. Confocal and deconvolution microscopes can achieve comparable images. While confocal microscopes are typically simple to use because no additional image processing is required, confocal microscopes discard greater than 90% of a fluorescent signal. Deconvolution microscopes capture and utilize all of the photons from a sample. Therefore, investigators with dim samples are strongly encouraged to consider deconvolution microscopy for their imaging experiments.
-
Carry out Dual Color FRAP analysis
See “Critical Parameters” for in depth discussion of special considerations.For live cell imaging of ER architecture, see “Critical Parameters” for an in depth discussion of special considerations.
REAGENTS AND SOLUTIONS
Imaging medium
Phenol red free medium (such as RPMI or DMEM)
10% fetal bovine serum
2 mM glutamine
25 mM HEPES pH 7.4
Formaldehyde/PBS
PBS (APPENDIX 2A) containing
3.7 to 4% formaldehyde (diluted from commercial stock solution 37% formaldehyde open less than six months or freshly prepared paraformaldehyde 4% final concentration.
Block Solution
PBS (APPENDIX 2A) containing
10% fetal bovine serum
Permeabilization Solution
PBS (APPENDIX 2A) containing 0.1% triton X-100 (due to viscosity of 100% triton X-100, it is easiest to first make a pre-mixed 10% stock in 1 X PBS)
Drug Treatments
Nocodazole
Dilute to 5 μg/ml from a 5 mg/ml stock solution in DMSO (store −20°C). Note that inhibition of microtubule polymerization is slow and inefficient. To disrupt the microtubule network, it is easier to add nocodazole to imaging media (mixed well) and then put cell chamber on ice for 10 min and rewarm in incubator at 37°C for 10 min and then image cells.
Brefeldin A
Dilute to 5 μg/ml from a 5 mg/ml stock solution in ethanol (store −20°C). Treat cells for 30 min to induce Golgi complex absorption into the ER in most cells.
A23187
Dilute to 50–100 μM from a stock solution in DMSO or ethanol (10 mg/ml). Typically causes dramatic ER fragmentation within 5–10 min.
Tunicamycin
Dilute from 5 mg/ml stock solution in DMSO. Tunicamycin is not very soluble in media, so add it neat to the side of the mixing tube above the media and then vortex vigorously for minimal precipitation. Depending on the degree of stress, cells can be treated with 10–1000 ng/ml Tm to partially or completely inhibit N-linked glycosylation of secretory proteins and induce ER stress. Treat cells for 2–6 hrs for maximal stress. Cells treated with 100 ng/ml or less of Tm can survive this treatment for several days and will adapt and begin growing at a near normal rate (Rutkowski et al., 2006).
DTT
Dilute to 0.5–5 mM solution from 1 M stock in dH2O (store −20°C). Treat for 30 min for maximal ER stress. Cells may die after 1 hr or more of DTT treatment. Note that cells can be treated with DTT for 30 min, the DTT can be washed out of the media for 1 hr, and most misfolded proteins will refold leading to re-establishment of a homeostatic ER (Kaji and Lodish, 1993; Lodish and Kong, 1993; Lai et al., 2010).
Thapsigargin
Dilute to 10–100 nM from a 1 M stock in DMSO. Treat for 1–5 min for calcium release and 0.5–1 hr for substantial ER stress. Note that in most cells, 10 nM is sufficient for maximal calcium release. Use at concentrations in the high nM to low μM range is not only excessive, but can inhibit other calcium channels in the cell in addition to the ER SERCA channels (Taylor and Broad, 1998; Michelangeli and East, 2011).
COMMENTARY
Background Information
The ER plays an important role in the biosynthesis of two types of proteins: 1) transmembrane proteins 2) soluble secretory proteins. These proteins are often modified with N-linked oligosaccharides and disulfide bonds in the oxidizing ER lumen. The influx (~0.1–1 million per minute per cell) of nascent peptides is extremely high in cells secretory cells. Yet, the ER lumen is crowded (~100 mg/ml protein). This crowding provides a challenge to secretory protein folding. Protein folding in the ER is regulated by multiple families of ER chaperones. How these chaperones encounter nascent and misfolded secretory proteins in live cells has been a recent subject of investigation (Nehls et al., 2000; Snapp et al., 2006; Ostrovsky et al., 2009; Lai et al., 2010; Lai et al., 2012; Lajoie et al., 2012; Guo and Snapp, 2013). One area of intense interest for ER biology is ER stress and the UPR (Walter and Ron, 2011). Misfolding of secretory proteins can lead to loss of protein function, instability of partner proteins, and even toxic gain-of-function products that deplete vital ER chaperones (Ma and Hendershot, 2004). The UPR plays a major role in re-establishing ER homeostasis after the accumulation of misfolded secretory proteins. However, failure to reestablish ER homeostasis can trigger a UPR-associated apoptotic death signaling cascade (Tabas and Ron, 2011; Upton et al., 2012). Several major human diseases, i.e. heart disease and type 2 diabetes, have been linked to excessive or inadequate UPR activation (Wang and Kaufman, 2012). Some of the approaches and tools described in this UNIT should aid in the investigation of secretory protein quality control and regulation of the UPR.
ER-specific imaging tools, approaches, and concerns are discussed below.
Fluorescent Proteins in the ER
Three parameters are especially important for imaging in the ER. First, the ER is the site of N-linked glycosylation of secretory proteins. Proteins containing a luminal N-X-S/T sequence (where X is any amino acid other than proline) are usually glycosylated on the asparagine by the oligosaccharide transferase complex that is closely associated with the ER translocation channel. N-linked sugars are not small (~1.5 nm). They can interfere with correct protein folding or sterically inhibit interactions with proteins. In addition, sugars are recognized by a subset of ER chaperones (calnexin, calreticulin, and UGGT) that can bind and alter the mobilities, retention, and halflife of glycosylated proteins. In addition, the large size of the sugar can decrease protein mobility (Costantini et al., 2013). Second, the ER is an oxidizing environment. Cysteines can interact with ER chaperones that belong to the protein disulfide isomerase family and form disulfide bonds (Gruber et al., 2006). Many FPs contain cysteines and none of the FPs have disulfide bonds in the correctly folded versions. Jain et al. (Jain et al., 2001) first reported that members of the GFP family can form interchain disulfide bonds in the ER lumen. The cysteines of EGFP normally face inwards in the EGFP β-barrel structure. Formation of interchain disulfide bonds would prevent formation of the β-barrel, which is essential for forming the fluorophore (Kelkar et al., 2012). Based on immunoblots of nonreducing gels, up to 50% or more of EGFP can be sequestered into dark incorrectly folded disulfide bonded oligomers (Figure 4). EGFP has been used in the ER lumen successfully in several studies indicating some fraction does correctly fold. However, based on the Jain et al results, a significant fraction is dark and misfolded. We have not established whether the pool of misfolded ER-mGFP is somehow stressful to cells. We do not find evidence for upregulation of endogenous BiP, which suggests the misfolded mGFP does not induce the UPR (our unpublished data). We cannot rule out the possibility of induction of other cellular stress pathways. At the very least, samples will be dimmer than protein levels suggest and immunoblot quantitation of fusion protein expression will overestimate the amount of folded and functional fusion proteins. Unfortunately, the cysteines in EGFP cannot be easily mutated as the resulting proteins are significantly dimmer (Jain et al., 2001).
Figure 4. GFP Variants in the ER.

ER-sfGFP and ER-mGFP constructs were transiently transfected in U2-OS cells. While both constructs clearly localize to an ER pattern of networked tubules and the nuclear envelope, large differences in fluorescence intensity are apparent. Cells were imaged on a Zeiss Axiovert 200 microscope with 63X NA 1.4 objective with the same camera settings at two different exposures. At the low exposure, mGFP is not visible, while sfGFP is intensely fluorescent in the majority of cells. mGFP becomes visible only at a much longer exposure. In an immunoblot of Cos-7 cell lysates, the propensity of mGFP to oligomerize in the ER is apparent by the laddering observed in the nonreducing lane. In contrast, no laddering is apparent for sfGFP. Note how much of the mGFP remains monomeric (the lowest band) in the nonreducing gel. Only this pool of protein can still form a β-barrel and potentially fluoresce.
The third consideration for FPs is that they be monomeric. This is especially critical for integral membrane proteins. The weak dimerizing affinity of EGFP, when fused to the cytoplasmic side of ER membrane proteins, can lead to gross reorganization of the ER architecture (Figure 3D and E) (Snapp et al., 2003). Tubular networks are transformed into stacked cisternal membranes, sinusoidal and crystalloid membranes.
Fortunately, FPs exist that can satisfy all of these criteria. SfGFP (Pedelacq et al., 2006) is monomeric (Costantini et al., 2012), lacks N-linked glycosylation sites, and is resistant to disulfide bond formation, despite containing cysteines (Figure 4) (Aronson et al., 2011). The superfolder mutations can be incorporated into other GFP-related proteins, BFP, CFP (cerulean), and YFP (venus and citrine) (Pedelacq et al., 2006). Red FPs are more problematic. Many contain essential cysteines that cannot be easily removed without dimming the protein (our unpublished results). Several contain N-linked glycosylation consensus motifs and are not necessarily monomeric. The best behaved red FP, mCherry (Shaner et al., 2004), seems to be inherently sticky when attached to membrane proteins or oligomeric proteins, similar to its parent mRFP (see UNIT 21.4). mCherry is generally acceptable for soluble luminal proteins and should be used with extreme caution for membrane proteins. When making fusion proteins, always first test with sfGFP. If the fusion mimics the distribution of the protein observed with an antibody against the untagged protein, the fusion is partially validated, though not necessarily functional (see UNIT 21.4). If another FP fusion results in a different protein distribution, it is vital that the investigator suspect the FP is altering correct localization of the fusion protein. If two fusion proteins are being imaged and one is a membrane protein, select sfGFP for the membrane protein and mCherry for the soluble protein. If two membrane proteins are being studied, we recommend sfGFP and EBFP2 (Ai et al., 2007).
Photoconversion and reversible photobleaching are phenomena that can seriously complicate photobleaching analysis by generating artificially high D values. Photoconversion is the process by which a fluorophore is excited and becomes transiently or permanently altered in its fluorescence excitation and emission spectra. Reversible photobleaching occurs when a fluorophore’s excitation state is changed by intense illumination, which appears to an observer as destruction of the fluorophore. However, the fluorophore reverts to its native excitation and emission spectra and becomes fluorescent again. In our experience, and that of others, Emerald (Cubitt et al., 1999), GFPuv, and YFP variants, are prone to reversible photobleaching or photoactivation (Shaner et al., 2008). Thus, photobleaching experiments using fusion proteins with these FPs should be avoided when possible. Photoconversion and reversible photobleaching are minimal for sfGFP, EBFP2, mRFP, and mCherry.
ER Architecture and Diffusion
The shape of the ER ranges from tubes to cisternae to exotic OSER structures (Figure 3)(Snapp, 2003; Snapp et al., 2003; Shibata et al., 2010). The different ER shapes can have profound effects on apparent diffusion coefficients (Olveczky and Verkman, 1998; Dayel et al., 1999; Sbalzarini et al., 2005). These geometric affects can slow effective diffusion coefficients up to four fold. In simple terms, in solution, a molecule can diffuse in all 720° of directions. At each time point, the molecule can change direction on its “random walk.” When the molecule becomes confined in a simple straight tube, the molecule can now only diffuse in two directions and will be forced to move along the shortest path between the ends of the tube. If the tube curves, the distance that the molecule must travel between the ends is inherently longer than the shortest distance between the two ends. The distance a molecule must travel is further complicated when the tube branches. Branches further increase the distance a molecule can travel between two points. This increase in path length is quantified as “tortuosity.” In addition, depending on the angle of the branch, a tight angle can act as a barrier to free diffusion. Taken together, a branching network will slow the ability of molecules in the ER to diffuse from one end of the cell to the other.
Because the ER is composed of multiple types of structures, it becomes very important to compare similar ER structures when performing FRAP measurements. Measuring D values in cisternal/sheet ER should result in faster D values than for the same molecule in a highly branching tubular network.
When performing photobleaching, it is helpful to note that ER structures are not confined to a single focal plane in mammalian cells (or other kingdoms either). In mammalian cells, the ER occupies a substantial fraction of the cytoplasmic volume (Griffiths et al., 1984). Despite the considerable volume of the ER, one rarely needs to be concerned with recovery of fluorescence from above and below the focal plane. This is because most photobleaching conditions will robustly photobleach the entire depth of a standard adherent tissue culture cell (Figure 5).
Figure 5. Photobleach Depth.

Photobleach of an ROI of a fixed U2-OS cell expressing ER-sfGFP. 3D reconstruction and orthogonal views after photobleach reveals that the laser robustly photobleaches all fluorescence in the ROI through the depth of the cell. Cell was imaged on a Zeiss LSM 5 LIVE confocal microscope with Duoscan attachment and the figure was prepared with the Zeiss LSM software.
It is also important to be aware of potential barriers to diffusion. The nuclear envelope contains proteins that bridge the inner and outer nuclear envelope membranes (Crisp et al., 2006). In sheet ER, proteins with large luminal coiled-coil domains, such as CLIMP63, are enriched (Shibata et al., 2010). In both cases, such barriers may not be an issue for small proteins, but could be problematic for structurally large proteins, such as extracellular matrix components.
The ER under almost all conditions is continuous. Some older studies suggested that the ER fragments during mitosis (Zeligs and Wollman, 1979; Koch et al., 1988), but this appears to be a fixation artifact. Live cell photobleaching studies have established that the ER remains connected throughout mitosis (Ellenberg et al., 1997). ER continuity is disruptable by perturbing ER calcium levels. A calcium wave in sea urchin oocytes during fertilization causes ER fragmentation and treatment with the calcium ionophore A23187 can fragment the ER (Terasaki and Jaffe, 1991; Subramanian and Meyer, 1997). In addition, depletion of the ER membrane fusion proteins atlastin or Rab10 by siRNA knockdown can induce ER fragmentation (English and Voeltz, 2012). This can be imaged with a fluorescently labeled ER and loss of continuity can be validated by FLIP. In a FLIP experiment, ER-FP fluorescence can normally be depleted from the entire ER (Nehls et al., 2000), while discontinous fluorescent compartments will leave multiple pools of ER-FP fluorescence unable to move through the bleach ROI (Subramanian and Meyer, 1997; Nehls et al., 2000).
ER Dynamics and Protein Diffusion
A potential complication for investigating ER protein mobility is that mobility is defined by factors in addition to diffusion. Most importantly, the ER is a highly dynamic organelle. ER tubules are in constant motion due to the cytoskeletal motions and the association of the ER with molecular motors, kinesins on microtubules (in metazoans) and myosins on actin (in fungi and plants). In addition, ER membranes can undergo fusion upon collision to change the absolute architecture of the ER. Importantly the motions are substantial enough that tubule organization can undergo dramatic pattern changes in seconds (Figure 1). The directed motions of ER membranes are distinct from random movement of diffusion. Is this a problem for photobleaching studies? Yes and no.
Figure 1. ER Dynamics.
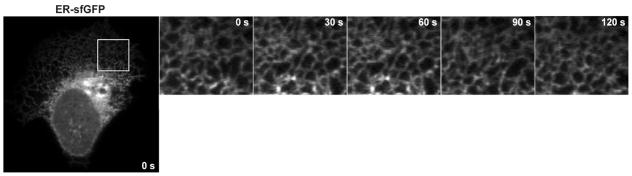
A typical network of ER tubule membranes is highly dynamic. While the ER is consistently recognizable as interconnected branching tubules, the pattern is in constant flux. In this time series of a U2-OS cell expressing ER-sfGFP, the tubular network undergoes gross reorganization over tens of seconds.
If movement of a molecule is studied in a single ER tubule, then chances are excellent that the tubule is likely to move in a 60 s experiment. In theory, one could track the photobleach region with software and quantitate changes in the fluorescence intensity. However, if the tubule stretches or curls, contributions of diffusion specifically to molecular mobility become more difficult to tease out.
However, ER motions tend to be highly localized over short time periods. A region of the ER does not generally traffic from one side of the cell to the other. Therefore, if one samples an area of a couple of microns that includes multiple tubules (more than 5 or 6), then relative contributions of tubule motion become surprisingly small. One can further lessen the impact of ER motion by performing short experiments (tens of seconds, rather than several minutes). The ER structure changes less over shorter time periods. Finally, one can completely abrogate ER motions by disrupting the cytoskeleton with ice and nocodazole for metazoans and latrunculin for plants and fungi. For some experimental problems, this may be a valuable tool. Over the short term (tens of minutes), the ER structure is maintained. Over longer times, tubes and other membranes tend to lose tension and spread out (Figure 6) (Terasaki et al., 1986). Therefore, there is a window of time for which one can specifically investigate the contributions of membrane motions to protein mobility before changes in architecture will begin to have a different impact on ER protein mobility. This will vary between cell types and conditions must be empirically determined.
Figure 6. Influence of Cytoskeleton on ER Morphology.
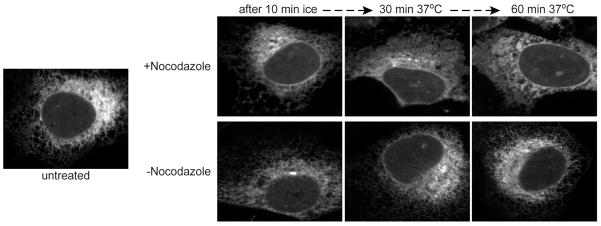
Representative U2-OS cells expressing ER-sfGFP were incubated on ice with or without nocodazole and then imaged after warming to 37°C. After immediate disruption of microtubules after incubation on ice, cells still maintain network of tubules. However, continued absence of microtubules in the nocodazole treated cells leads to loss of tubule morphology and spreading of ER membranes into sheets or cisterna. Images were acquired on a Zeiss LSM 5 LIVE confocal microscope with Duoscan attachment.
The Importance of an Environmental Control Protein
Given the potential influence of ER architecture, motions, and changes in the ER environment on protein mobility, it is vital to use a control protein for diffusion measurements. The protein needs to be inert (not interact with other ER proteins) and appropriate for the environment being probed. For luminal diffusion measurements of soluble proteins, we recommend ER-sfGFP and ER-mRFP (Snapp et al., 2006). A commercial variant that can be expressed in cells without the use of transfection reagents is available from Molecular Probes (CellLight ER-GFP and ER-RFP, C10590 and C10591, respectively). For a membrane reporter, we suggest CyTERM fused to sfGFP (Figure 7) (Costantini et al., 2012). We currently provide both plasmids for free from our lab and will deposit them with Addgene in the near future.
Figure 7. Environmentally Inert ER Membrane Reporter Construct.
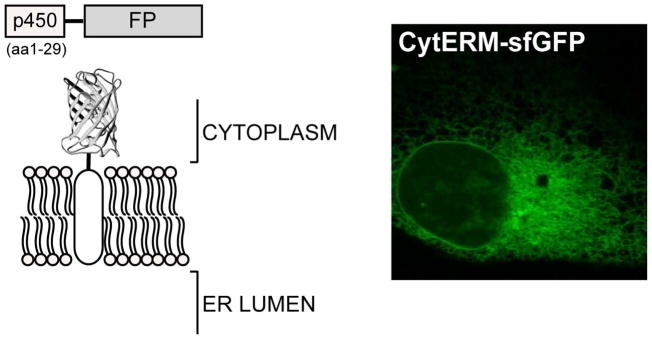
Diagram of CyTERM in ER membrane and a U2-OS cell expressing the construct.
Dual Color FRAP
The availability of a range different FP colors now makes it possible to perform FRAP in multiple colors simultaneously. This is important because a well designed series of FRAP experiments will include both a protein of interest and an inert control protein, i.e. ER-FP. The control protein can help the investigator distinguish between effects specific to the protein of interest and gross environmental effects, such as an increase in the viscosity of the cellular compartment. Previously, the two different proteins were typically transfected into separate populations of cells and data are collected from several cells in each group to determine the mean D for each protein for each condition tested. While this methodology is powerful, one caveat has been the assumption that cells selected for each measurement are representative and comparable for each protein.
In DCFRAP, both the control and protein of interest mobilities are measured in the same cell, in the same ROI, at the same time and can be directly compared for more informative controls. The environment within each individual cell can be monitored at the same time as the experimental protein is assayed. It should be possible to better interpret data sets for individual cells. That is, proteins exhibit variabilities in D values between individual cells. If both the control protein and protein of interest exhibit similar relative increases or decreases in mobility, relative to mean D values for other cells, then the environment or condition of the cell is affecting protein mobility.
To perform simultaneous FRAP measurements of two proteins, we have found two good pairs, 2) EBFP2 and sfGFP, and 2) sfGFP and mRFP or mCherry (for example, see Figure 8). In a proof of principal DCFRAP experiment, two lumenal ER chaperone proteins of similar sizes (~7 nm hydrodynamic radius), BiP-mCherry (Snapp et al., 2006; Lai et al., 2010) and Calreticulin-mGFP (~7 nm hydrodynamic radius (Snapp et al., 2006)), were transiently transfected and co-expressed in Cos-7 cells. In Figure 8, both proteins were substantially photobleached in the same ROI and then diffusion of the two pools of unbleached FPs into the ROI proceeded at visibly distinct rates. Quantitation in Figure 8B confirms that the D values of the two proteins can be readily distinguished and during ER stress (see below), calreticulin-mGFP mobility increases, while BiP-mCherry decreases.
Figure 8. Dual Color FRAP.

(A) HeLa cell co-expressing two FP-tagged ER chaperones, calreticulin-mGFP and BiP-mCherry. The two fluorophores can be simultaneously photobleached in the same ROI. The similarly sized Calreticulin-mGFP recovers much more rapidly than BiP-mCherry. (B) Plot of D values for the two proteins in untreated and stressed cells. Note how BiP-mCherry D values decrease during tunicamycin treatment, while calreticulin-mGFP D values increases. Calreticulin is a lectin chaperone and tunicamycin blocks glycosylation of secretory proteins, which leads to depletion of the ER of calreticulin substrates.
In addition, it is implicitly assumed that expression of the protein of interest does not change the viscosity of the environment. The ability to follow both the protein of interest and the control protein in the same cell permits direct comparison of each protein in the identical environment and could reveal environmental effects caused by the protein of interest. DCFRAP allows the investigator to determine whether the overexpressed protein of interest changes the environment of the compartment by the protein’s presence. The principles of DCFRAP can be extended to other fluorescence photobleaching imaging techniques including FLIP and inverse FRAP (iFRAP). DCFRAP represents an important refinement of photobleaching applications that can be applied to study the mobility parameters of all cellular proteins.
ER Stress and the Unfolded Protein Response
When unfolded or misfolded proteins accumulate in a cellular compartments, the accumulations can be stressful to the cell. The stress can take various forms, but the main problems are a) loss of function of the unfolded protein, b) titration of chaperones by the unfolded proteins, which would, in turn, deprive nascent proteins of these often essential protein folding factors, c) generation of oxidative radicals in the process of repeated attempts by chaperones to correctly fold the protein and d) increased occupancy and even overload of the protein turnover machinery, leading to even higher levels of unfolded proteins. In the ER, the accumulation of unfolded secretory proteins can lead to considerable stress and ER dysfunction. To cope with the unfolded secretory protein burden, cells evolved the Unfolded Protein Response (UPR) (Brodsky and Skach, 2011; Walter and Ron, 2011). One or more sensor proteins (Ire1p in yeast and IRE1α, ATF6, and PERK in humans) detect increased levels of unfolded secretory proteins. The sensors then activate transcriptional programs to upregulate ER chaperones, the ER Associated Degradation (ERAD) machinery, and secretory trafficking machinery. The UPR can restore homeostasis and plays a key role in differentiation of professional secretory cells including pancreatic beta cells and plasma B cells (Harding et al., 2000; Gass et al., 2002; Iwakoshi et al., 2003). However, failure to resolve the UPR can trigger cell death (Tabas and Ron, 2011; Upton et al., 2012). Excessive or misregulated UPR has been linked to several human diseases including type II diabetes, heart disease, and cancer. Thus, the UPR is a major focus of biomedical research and ER studies. In the following section, some imaging tools for study of the UPR are briefly described.
Live Cell UPR Reporters
Numerous methods exist for assessing the status of the UPR in populations of cells. However, such methods ultimately average out phenotypes for millions of cells and make it difficult to establish correlations in cell behavior. For example, increases in levels of markers “x” and “y” do not necessarily mean that both markers are increased in all cells or even in the same cell (Spencer et al., 2009). Fluorescence microscopy enables investigators to exploit the power of single cell analysis. For the UPR, single cell and live cell reporters include detection of transcriptional FP reporters driven by a UPR promoter, reporters of mRNA splicing that results from IRE1α (in humans and Ire1p in yeast)(Iwawaki et al., 2004; Merksamer et al., 2008), and spatial reporters showing a change in distribution of ATF6 from the ER to the nucleus (Chen et al., 2002). In our experience, the yeast HAC1-mCherry splicing reporter and the mCherry UPR transcriptional reporter (Merksamer et al., 2008) both robustly report increases in UPR activation. Similarly, the human GRP78 UPR promoter element x5 tdTomato reporter increases with UPR activation (Luo and Lee, 2002). Other reporters work with more variable results and are recommended with some caution. For example, we find the XBP1-GFP splicing reporter (Brunsing et al., 2008) is constitutively activated in transient transfections, but works well in stable cell lines. This is likely due to low level consitutive activation of the UPR in cells (DuRose et al., 2006), which could generate considerable amounts of FP signal if the reporter is highly abundant.
A major caveat of quantitative reporters of UPR activation is that FPs have very long halflives, (>24 h). Therefore, reporters must be followed from the unactivated condition or measured at steady state in cells. Once synthesized, the reporters do not provide insights into UPR resolution. Newer reporter variants are needed. A second caveat is that the reporters depend on the presence of activated sensors. That is, deletion or inhibition of a UPR sensor prevents further monitoring of ER stress. Thus, studies of UPR activation in mutant cells can be challenging at best. The laboratory of Peter Walter created a modified HAC1-GFP splicing reporter with no transcriptional activity (Pincus et al., 2010) for use in yeast deleted for HAC1 (thus permitting detection of Ire1p activation in cells that cannot mount the downstream response to unfolded protein stress).
BiP-GFP
It is important to differentiate ER stress, the insult, from the UPR, the response to the insult. When the stress, itself, can be measured, then one can begin to quantitate the nature of the stress signal. For example, the drug N-linked glycosylation inhibitor tunicamycin (see below) can be titrated over a range of concentrations to achieve a broad dose-response relationship for UPR activation (Rutkowski et al., 2006; Lai et al., 2010). Yet, the actual tunicamycin stress is poorly defined. Tm does not equally prevent glycosylation of all glycoproteins at different drug concentrations. Furthermore, not all unglycosylated glycoproteins are dysfunctional or misfolded (Kwon and Chapman, 2012). Currently, no general antibody or dye specifically recognizes unfolded proteins. Our lab developed a live cell reporter of changes in the unfolded protein burden for both yeast and mammalian cells (Lai et al., 2010; Lajoie et al., 2012). The ER Hsp70 chaperone BiP (in mammalian cells and Kar2p in yeast) recognizes and binds unfolded proteins. Fusion of BiP to GFP does not impair binding of clients. Using FRAP and FLIP, BiP-GFP mobility has been shown to be influenced by changes in levels of clients, with BiP-GFP mobility decreasing as unfolded secretory protein levels increase (Figure 9). This reporter does not require an intact UPR to function and BiP-GFP mobility can be used to detect resolution of the unfolded protein burden (Lai et al., 2012; Lajoie et al., 2012).
Figure 9. BiP-GFP as a Live Cell Reporter of Changes in the Unfolded Secretory Protein Burden.

(A) Illustration of how interactions of the chaperone BiP with unfolded proteins will change its hydrodynamic radius (Rh) and thus decrease or increase its ability to diffuse D. (B) FRAP of BiP-GFP in untreated and stressed (5 mM DTT 30 min) cells. ROI recovers nearly completely by 8 s for untreated cells, but is still incompletely recovered at 18 s for stressed cells with a large burden of unfolded secretory proteins.
BiP-GFP has enabled new lines of inquiry into ER stress. For example, a classic activator of yeast Ire1p, inositol withdrawal, was shown not to increase secretory protein misfolding (Lajoie et al., 2012). Thus, at least one mode of activation of an ER stress sensor is independent of the unfolded protein burden and suggests Ire1p regulation extends beyond traditional ER stresses. The BiP-sfGFP and Kar2-sfGFP plasmid and yeast strain, respectively, are available from the authors.
ER Stress Drugs
To induce ER stress, many investigators use drugs that induce global secretory protein misfolding, such as DTT, Tm, and thapsigargin (Tg). These three drugs have very different modes of action- prevention of disulfide bond formation, inhibition of synthesis of a precursor of N-linked sugars, and depletion of luminal ER calcium levels, respectively. These drugs stress cells at different rates. Tg and DTT act immediately and cause ER stress within 10–15 min, while cells must first deplete the existing pool of N-glycans before Tm begins stressing cells. This is typically 1–2 h (DuRose et al., 2006; Lai et al., 2010; Pincus et al., 2010; Lajoie et al., 2012). While Tg and Tm are irreversible, DTT can be washed out and the folding environment of the ER recovers within an hour (Kaji and Lodish, 1993; Lodish and Kong, 1993; Lai et al., 2010).
Other pharmacologic ER stressors have been described including Brefeldin A (an inhibitor of secretory traffic that causes accumulation of secretory proteins in the ER) and castanospermine (an inhibitor of processing of N-linked sugars, which prevents glycoproteins from interacting with often critical lectin chaperones such as calreticulin).
To investigate the impact of the UPR on ER homeostasis and resistance to stress, knockout cell lines have been described in mammalian cells (Harding et al., 2000; Harding et al., 2000; Calfon et al., 2002; Wu et al., 2007). RNAi mediated knockdown can be effective in blocking specific UPR pathways (for example, see (Lee et al., 2003)). In yeast, IRE1 is nonessential for unstressed cells. More recently, compounds have been described that can selectively inhibit UPR sensors (Volkmann et al., 2011; Cross et al., 2012; Harding et al., 2012) and downstream effectors (i.e. eIF2α dephosphorylation)(Boyce et al., 2005; Tsaytler et al., 2011).
CRITICAL PARAMETERS
Live Cell Imaging of ER Architecture: Some Considerations
For live single focal plane experiments, neither confocal or deconvolution microscopy are essential. Cells need to be in an imaging chamber (Mattek dish or Labtek chamber, for example), immersed in phenol red-free imaging media, and maintained at their optimal temperature. Phenol red can cause autofluorescence. The HEPES buffered imaging media makes CO2 concerns superfluous, as cells in this media can be maintained and imaged for 18 hr at 37°C and undergo mitosis. To image the ER in live cells, the only special considerations are to use a high NA objective (NA = 1.4) for improved resolution and details and to use a bright, ER-appropriate fluorescent reporter.
For time series, ER structures are sufficiently dynamic that image acquisition rates of 5 frames per second (fps) (and preferably faster, 30 fps) are needed to assemble temporally well resolved movies of ER motion
Note: The morphology of the ER can reflect cellular homeostasis. Stressed cells can exhibit fragmented ER or a loss of ER dynamics. In most cells, the ER tends to be in constant motion (Figure 1) and ER fragmentation is only observed during disruption of calcium homeostasis (Terasaki and Jaffe, 1991; Subramanian and Meyer, 1997). The ER generally does not fragment during mitosis (Ellenberg et al., 1997; Lu et al., 2009).
For capture of the entire ER in a time series, it is essential that the user have access to a sensitive high speed microscope, such as spinning disk confocal, a Zeiss Live, a Nikon Swept Field or a deconvolution microscope, such as a Applied Precision Deltavision. These instruments must have a high speed motorized stage or a piezo motor on the objective to achieve rapid acquisition of Z stacks.
ER tubules move with subsecond dynamics. Therefore, frames must be acquired extremely rapidly, at least 10 fps or preferably much faster. Many standard laser scanning confocal microscopes construct images by acquiring a single pixel at a time. This can be too slow to capture even two successive Z slices. The time at the start of the first frame and end of the second frame can allow for substantial ER movement. The result is a blurred ER image with loss of sharp connectivity of a tubule between successive focal planes.
To minimize these problems, rapid whole frame acquisition by a spinning disk, widefield or superfast scanning microscope is necessary. For a single image plane, increased speed can be achieved for a scanning microscope by minimizing the area scanned (i.e. it is not usually necessary to scan a whole 512×512 frame to capture a cell. Total scan time can be decreased if one decreases the total frame size. A bright sample will decrease the time required to capture a frame. Also, high quality cameras or detectors can decrease the necessary acquisition time. Finally, a question may not depend on imaging the entire ER of a cell. If only a representative area needs to be imaged, one could image a region of the cell with ER restricted to a few focal planes, such as in the periphery of the cell and this will enable more rapid acquisition of successive time points.
Photobleaching of ER Reporters and Structures
In FRAP, a distinct region of interest (ROI) in a cell expressing a FP-reporters is briefly photobleached with a high intensity laser and the movement of unbleached fluorescent molecules into the bleached region is followed with low intensity laser light. FRAP is useful for determining a protein’s diffusion coefficient (D), which reflects the mean squared displacement (μm2/sec) explored by a protein during a random walk (i.e. Brownian motion). Environtmental crowdedness or viscosity (whether the protein is soluble or integrated into a membrane) and size (the hydrodynamic radius, not the molecular weight) of the protein are the primary regulators of protein diffusion. In addition, protein interactions and collisions with other molecules can also hinder free diffusion. Measuring D enables investigators to obtain information related to a protein’s environment and whether the protein is interacting with large complexes.
FRAP also can be used to quantitate the fraction of molecules capable of recovering into a photobleached area, the mobile fraction (Mf). In contrast to FRAP, photobleaching is repeated several times, alternating each photobleach with a low laser intensity image of the whole cell for FLIP. FLIP can reveal the interconnectivity of cellular compartments and the spatial distribution of immobile pools of proteins.
Photobleaching protocols are described in detail in UNIT 21.1. For FRAP, we often leave the confocal pinhole wide open. The confocal microscope is used for photobleaching primarily because of the available scanning laser with high temporal and spatial precision for photobleaching a specific region of interest. Many studies of ER architecture do not necessarily require acquisition of the entire ER to quantitatively describe the mobility of ER proteins. However, ER morphology and environmental changes can impact protein mobility. To adequately control for cell to cell variations in ER structure and conditions, we strongly encourage investigators to perform dual color FRAP (DCFRAP) with an inert fluorescent reporter.
Modifications for Dual Color FRAP
DCFRAP is performed identically to the FRAP protocol in UNIT 21.1 with a few modifications. First, the investigator must express two FP reporters in the cells of interest. The reporters must be spectrally well separated.
Many commercial confocal microscopes do not have optimal laser set ups for photobleaching applications. Either the wavelength for excitation overlaps for both FPs or the laser is too weak for robust photobleaching. To enhance the fluorescence intensity signals and improve photobleaching power for both RFPs and sfGFP, we replaced the relatively weak 1 mW 543 nm HeNe laser that is standard with most CLSMs, with a more powerful 50 mW 561 nm diode laser. The replacement laser permits more of the sfGFP spectral emission to be captured without spectral interference from a 543 nm laser. In addition, 561 nm is closer to the mRFP and mCherry excitation maximum (584 nm (Campbell et al., 2002)). Together, these improvements in fluorescence signal strength enhance the robustness of diffusion analysis and now permit the investigator to simultaneously study the mobility parameters of two proteins in the same cell. Furthermore, the more powerful lasers permit more rapid photobleaching of samples to decrease unintentional FLIP effects (see UNIT 21.1).
Another issue with laser power is that a 1 mW 543 nm laser is so weak that it achieves poor photobleaching of red FPs. Fortunately, one of the properties of most red FPs is the presence of a long tail in the excitation spectra that permits excitation with the usually much more powerful 488 nm laser (Figure 2). Normally, low intensity laser light at 488 nm does not significantly excite RFP despite the wide spectral excitation profile of mRFP that extends from 450 to 630 nm. However, upon application of high intensity 476, 488, 514, and 561 nm laser light, RFPs are substantially photobleached. A 543 nm and 488 nm laser can be combined to achieve more efficient photobleaching of red FPs. Similarly, improved bleaching of sfGFP with a weak 488 nm laser line can be achieved by simultaneously employing the 478, 488, 514 nm laser lines that usually accompany most argon lasers.
Figure 2. Absorbance Spectra of sfGFP and mRFP.

The dashed box highlights a significant region of overlap between the absorbance profiles of both fluorophores. The practical consequence is that one can use a 488 nm laser line to improve photobleaching of mRFP and mCherry.
Another concern for imaging two different colored FPs is that the objective must be color corrected, preferably an apochromat objective. The type of color correction (if any) is written on the side of the objective. A noncorrected objective with thwart colocalization attempts for the two FPs. Different wavelengths of light focus at different focal planes. A color corrected objective will focus the different wavelengths of light into the same focal plane and enable robust colocalization.
Diffusion Analysis for ER proteins
The most robust method we have found for determining D values is through simulation of diffusive recovery into a ROI (Siggia et al., 2000). The Siggia simulation models inhomogeneous diffusion of unbleached fluorescent proteins in the cell into the photobleach ROI. The simulation compares the simulated recovery to the experimental data to determine D (Siggia et al., 2000). The program has been used for ER membrane proteins (Ellenberg et al., 1997; Zaal et al., 1999; Snapp et al., 2006; Lai et al., 2010; Lajoie et al., 2012) and has been used to calculate D’s comparable to values observed by other labs using different methods.
Update: The Siggia simulation can be obtained by contacting Dr. Snapp at eriklee.snapp@einstein.yu.edu. The simulation has been written for UNIX systems and has been compiled for Apple computers running OS 9. Unfortunately, this means Apple computers built after 2004 cannot run this computer. Appendix 1 of UNIT 21.1 is a simple user’s guide to use the simulation.
Troubleshooting
Table 1.
Troubleshooting Guide to Live Cell ER Imaging
| In the table below, a number of common problems and potential solutions for imaging the ER and secretory proteins are presented. | |
|---|---|
| Problem | Possible Cause and Solutions |
| ER structure movement confounds analysis of ER protein mobility | ER tubules are highly dynamic in many cell types and may move into a photobleached area much more rapidly than a slowly diffusing membrane protein. Disruption of the cytoskeleton (microtubules in metazoans using cold and nocodazole)(actin in plants and fungi using latrunculin-A). If protein is a slow diffusing protein, then smaller region of interest (ROI) can be bleached. The goal is not to necessarily have a specific sized ROI, but to achieve 70–90% bleach depth and collect enough data recovery points to plot a robust curve. Smaller bleach ROIs work well for very slowly diffusing proteins. |
| Substantial spread of D values | The architecture of the ER can alter effective D values up to 4-fold. There are few, if any practical solutions for this. While methods have been developed to account for ER structure effects on D (Sbalzarini et al., 2005), there is an unrealistic expectation that the ER structure is not dynamic (see Figure 1). The main way to circumvent architecture effects is to perform FRAP on a relatively constant structure from cell to cell, the nuclear envelope. Not all ER proteins can enter the nuclear envelope and there are potential luminal obstructions, especially for large proteins. If necessary, this remains a valid option, but it is important to emphasize that measurements were taken in the nuclear envelope and not the reticular network. In general, while photobleaching and photoactivation are powerful methods, they are insensitive to small changes in molecular size. Membrane proteins must increase 8–10 fold in diameter to produce a 2 fold decrease in D (Saffman and Delbruck, 1975; Marguet et al., 1999; Gambin et al., 2006). Luminal proteins must double in hydrodynamic radius (Rh) and this does not necessarily happen with simple dimerization. Furthermore, D must change for a substantial pool (> 20%, at least) of the total pool of molecules interrogated to detect changes in D, which is inherently an ensemble measurement in FRAP. |
| Alternatives to FRAP to measure diffusion in the ER if sample is too dim. | FRAP depends on a robust fluorescent signal for sufficient signal to noise for diffusion measurements. However, not all proteins can or should be expressed at high levels in cells. For dim samples, there is an alternative to photobleaching or photoactivation, Fluorescence Correlation Spectroscopy (FCS) (see UNIT 4.24). This method has been successfully used with ER proteins and it is ideal for dim samples (Lippincott-Schwartz et al., 2000; Nagaya et al., 2008). However, most institutions do not have FCS systems. FCS is also more challenging for the ER. Measurements are made in a confocal or multiphoton volume (250×250×500 nm). This volume is large enough to include multiple ER tubules, which can confound counting of the movement of small numbers of molecules. Also, ER tubules move and may move out of the FCS measurement volume. ER FP movements could be assessed in the comparatively immobile nuclear envelope, which is continuous with the ER. However, some ER proteins are excluded from the nuclear envelope and the luminal environment is different from the inside of an ER tubule. |
| Expression of FP-fusion protein alters ER structure | Overexpression of proteins can affect ER structure in at least three fundamental ways. First, a protein can cause ER stress, which can induce the UPR, ER swelling, and ER proliferation. It is worth assessing whether constructs induce ER stress for any secretory proteins. There are a number of measures of the UPR (Fribley et al., 2009; Cawley et al., 2011; Oslowski and Urano, 2011) and the sensitivity of the methods will depend on transfection/expression efficiency. For example, induction of BiP expression as measured by Northern Blot, qPCR or immunoblot will not be detectable if transfection efficiencies are less than 30–40% of cells. If a construct is stressful, it may be less problematic if expression is decreased either by making a stable cell line or an inducible expression cell line (i.e. tet on). Similarly, some proteins when overexpressed induce ER membrane proliferation and the formation of anastomosing smooth ER (Snapp et al., 2003; Maiuolo et al., 2011). The effects of this can be minimized by taking steps to lower protein expression (stable cell lines and/or inducible expression systems). The second possibility is that the protein of interest is a structure-inducing protein. For example, overexpression of a reticulon or CLIMP63 can change the relative amounts of ER tubule and sheet structures (Figure 3) (Shibata et al., 2010). Similarly, expression of an ER membrane protein with EGFP facing into the cytoplasm readily induces OSER formation (Snapp et al., 2003). To validate a structural function for one’s protein, it is important to establish whether any tags (EGFP) are contributing to structure formation and to show a dose-response effect. In cells expressing higher levels of the protein, structural changes should be increasingly apparent. Typically, capturing images of 50–100 cells expressing the protein at various levels, quantitating protein expression by immunofluorescence or FP signal, and then scoring for a structural phenotype relative to expression levels in cells will reveal a role for proteins in structure regulation. Some secretory proteins do not induce the UPR, nor are they specifically structural proteins. Yet, proteins such as the a1-antitrypsin Z mutant can grossly alter ER structure (Ordonez et al., 2012). The Z mutant polymerizes and forms 0.5 μm spherical aggregates that cause ER tubules to resemble beads on a string. In all of these cases, it is often worth performing transmission electron microscopy on negatively stained cell sections to inspect changes in ER ultrastructure. Fluorescence imaging often lacks the resolution to distinguish between many ER structures. |
| Detection of early protein folding events in the ER. | Currently, there are no technologies, in live cells, for detecting FPs in less than 10–15 min after translation. Protein translation elongation is 5.6 amino acids per second in cells (Ingolia et al., 2011). The entire β-barrel sequence of an FP must emerge from a ribosome before the β-barrel can form (Kelkar et al., 2012). FPs form the β-barrel quickly in seconds (Iizuka et al., 2011) and then undergo the autocatalytic fluorophore formation reaction over a time of minutes. FlAsH/ReAsH does not work in the oxidizing lumenal environments of the secretory pathway (Gaietta et al., 2002). Therefore, detection of protein folding events at the ER translocation channel or shortly after release are highly unlikely to be detectable for the majority of proteins. |
| FP signal is dim in ER. | This issue could arise for several reasons. First, if FP expression is under the control of an endogenous promoter, expression levels may be too low for a detectable fluorescence signal. If this is the case, the investigator must decide whether substantial overexpression of a protein will be physiologically appropriate. Second, the construct may have misfolded. Some secretory proteins have low rates of folding success and this could potentially affect the ability of the attached FP to fold. Misfolding of the protein of interest may be due to the absence of a key folding factor (i.e. Hsp47 for collagens)(Nagai et al., 2000)(i.e. a co-factor for formation of a stable hetero-oligomer, such as the many components of the T cell receptor)(Chen et al., 1988) or insufficient levels of folding factors due to overexpression. Solutions include 1) expressing the fusion protein in an appropriate cell type that co-expresses key co-factors for the protein of interest and 2) expressing the fusion protein at lower levels either by making stable cell lines (usually a single copy of the construct is integrated into the genome) or making an inducible cell line that enables regulated low expression. Third, the FP of choice folds poorly in the ER due to cysteines and/or N-glycosylation sites. The easiest solution is to switch to a sfGFP variant or a DsRed derivative (mRFP, mCherry, etc. see (Shaner et al., 2004)). If the FP properties are critical to the experiment, then the investigator can attempt to mutate the potentially problematic sequences, N-X-S/T to D-X-S/T, and C to other amino acids. Note that cysteines may not tolerate mutagenesis to most amino acids and may result in a dark protein. In addition, unpredicted residues may be key to correct folding in the ER and this may make FP adaptation a major project (Jain et al., 2001; Suzuki et al., 2012; Costantini et al., 2013). |
Anticipated results
The methods described in this UNIT should permit the investigator to obtain and interpret fluorescence intensity recovery data following photobleaching of ER FP-reporters with a CLSM or widefield fluorescence microscope adapted for deconvolution. The investigator should be able to calculate FP reporter parameters including the Mf and either the D or t1/2 of fluorescence recovery of a protein in a cell (see UNIT 21.1). The investigator should also be able to perform a FLIP experiment to investigate changes in the connectivity of sfGFP-labeled ER membranes, as well as to identify pools of mobile and immobile FP-reporters throughout the ER. Finally, the investigator can begin to exploit live cell tools for studying ER stress and the UPR.
Time Considerations
Creation of FP-reporters consists of standard cloning procedures and biochemical or genetic assays to confirm that the properties of the reporter are similar to the parent protein. Preparation for photobleaching experiments consists of transferring cells to coverslips or imaging chambers and transfecting the cells with a sfGFP construct 16–48 hour prior to imaging. The initial setup for photobleaching experiments requires a time investment of a few hours to determine conditions for each protein to be bleached. The actual FRAP experiments can be very rapid, ranging from 30 seconds for the recovery of a soluble lumenal ER protein to 5 min for an integral membrane protein. FLIP experiments often take 10–20 min. FRAP experiments require at least 12 (and preferably 15) data sets for useful statistics to compare D values. Data processing depends on the method used and the power of the computer. Due to the large numbers of data sets to be processed (typically 12–20 cells per condition), data analysis can be time consuming.
Acknowledgments
We thank the Albert Einstein College of Medicine Analytical Imaging Facility for use of the Zeiss Live confocal microscope. We thank Drs. Federica Brandizzi and Maura Francolini for providing images. We are grateful to the Marion Bessin Liver Center for funding and NIH grant from the National Institute of Diabetes and Digestive and Kidney Diseases NIDDK (5PO1DK041918). The content is solely the responsibility of the authors and does not necessarily represent the official views of NIDDK or the NIH.
LITERATURE CITED
- Ai HW, Shaner NC, Cheng Z, Tsien RY, Campbell RE. Exploration of new chromophore structures leads to the identification of improved blue fluorescent proteins. Biochem. 2007;46:5904–5910. doi: 10.1021/bi700199g. [DOI] [PubMed] [Google Scholar]
- Aronson DE, Costantini LM, Snapp EL. Superfolder GFP is fluorescent in oxidizing environments when targeted via the Sec translocon. Traffic. 2011;12:543–548. doi: 10.1111/j.1600-0854.2011.01168.x. [DOI] [PMC free article] [PubMed] [Google Scholar]
- Boyce M, Bryant KF, Jousse C, Long K, Harding HP, Scheuner D, Kaufman RJ, Ma D, Coen DM, Ron D, Yuan J. A selective inhibitor of eIF2alpha dephosphorylation protects cells from ER stress. Science. 2005;307:935–939. doi: 10.1126/science.1101902. [DOI] [PubMed] [Google Scholar]
- Brodsky JL, Skach WR. Protein folding and quality control in the endoplasmic reticulum: Recent lessons from yeast and mammalian cell systems. Curr Opin Cell Biol. 2011;23:464–475. doi: 10.1016/j.ceb.2011.05.004. [DOI] [PMC free article] [PubMed] [Google Scholar]
- Brunsing R, Omori SA, Weber F, Bicknell A, Friend L, Rickert R, Niwa M. B- and T-cell development both involve activity of the unfolded protein response pathway. J Biol Chem. 2008;283:17954–17961. doi: 10.1074/jbc.M801395200. [DOI] [PubMed] [Google Scholar]
- Calfon M, Zeng H, Urano F, Till JH, Hubbard SR, Harding HP, Clark SG, Ron D. IRE1 couples endoplasmic reticulum load to secretory capacity by processing the XBP-1 mRNA. Nature. 2002;415:92–96. doi: 10.1038/415092a. [DOI] [PubMed] [Google Scholar]
- Campbell RE, Tour O, Palmer AE, Steinbach PA, Baird GS, Zacharias DA, Tsien RY. A monomeric red fluorescent protein. Proc Natl Acad Sci U S A. 2002;99:7877–7882. doi: 10.1073/pnas.082243699. [DOI] [PMC free article] [PubMed] [Google Scholar]
- Cawley K, Deegan S, Samali A, Gupta S. Assays for detecting the unfolded protein response. Methods Enzymol. 2011;490:31–51. doi: 10.1016/B978-0-12-385114-7.00002-7. [DOI] [PubMed] [Google Scholar]
- Chen C, Bonifacino JS, Yuan LC, Klausner RD. Selective degradation of T cell antigen receptor chains retained in a pre-Golgi compartment. J Cell Biol. 1988;107:2149–2161. doi: 10.1083/jcb.107.6.2149. [DOI] [PMC free article] [PubMed] [Google Scholar]
- Chen X, Shen J, Prywes R. The luminal domain of ATF6 senses endoplasmic reticulum (ER) stress and causes translocation of ATF6 from the ER to the Golgi. J Biol Chem. 2002;277:13045–13052. doi: 10.1074/jbc.M110636200. [DOI] [PubMed] [Google Scholar]
- Costantini LM, Fossati M, Francolini M, Snapp EL. Assessing the tendency of fluorescent proteins to oligomerize under physiologic conditions. Traffic. 2012;13:643–649. doi: 10.1111/j.1600-0854.2012.01336.x. [DOI] [PMC free article] [PubMed] [Google Scholar]
- Costantini LM, Subach OM, Jaureguiberry-Bravo M, Verkhusha VV, Snapp EL. Cysteineless non-glycosylated monomeric blue fluorescent protein, secBFP2, for studies in the eukaryotic secretory pathway. Biochem Biophys Res Commun. 2013;430:1114–1119. doi: 10.1016/j.bbrc.2012.12.028. [DOI] [PMC free article] [PubMed] [Google Scholar]
- Crisp M, Liu Q, Roux K, Rattner JB, Shanahan C, Burke B, Stahl PD, Hodzic D. Coupling of the nucleus and cytoplasm: role of the LINC complex. J Cell Biol. 2006;172:41–53. doi: 10.1083/jcb.200509124. [DOI] [PMC free article] [PubMed] [Google Scholar]
- Cross BC, Bond PJ, Sadowski PG, Jha BK, Zak J, Goodman JM, Silverman RH, Neubert TA, Baxendale IR, Ron D, Harding HP. The molecular basis for selective inhibition of unconventional mRNA splicing by an IRE1-binding small molecule. Proc Natl Acad Sci U S A. 2012;109:E869–878. doi: 10.1073/pnas.1115623109. [DOI] [PMC free article] [PubMed] [Google Scholar]
- Cubitt AB, Woollenweber LA, Heim R. Understanding structure-function relationships in the Aequorea victoria green fluorescent protein. Methods in cell biology. 1999;58:19–30. doi: 10.1016/s0091-679x(08)61946-9. [DOI] [PubMed] [Google Scholar]
- Dayel MJ, Hom EF, Verkman AS. Diffusion of green fluorescent protein in the aqueous-phase lumen of endoplasmic reticulum. Biophys J. 1999;76:2843–2851. doi: 10.1016/S0006-3495(99)77438-2. [DOI] [PMC free article] [PubMed] [Google Scholar]
- DuRose JB, Tam AB, Niwa M. Intrinsic capacities of molecular sensors of the unfolded protein response to sense alternate forms of endoplasmic reticulum stress. Mol Biol Cell. 2006;17:3095–3107. doi: 10.1091/mbc.E06-01-0055. [DOI] [PMC free article] [PubMed] [Google Scholar]
- Ellenberg J, Siggia ED, Moreira JE, Smith CL, Presley JF, Worman HJ, Lippincott-Schwartz J. Nuclear membrane dynamics and reassembly in living cells: targeting of an inner nuclear membrane protein in interphase and mitosis. J Cell Biol. 1997;138:1193–1206. doi: 10.1083/jcb.138.6.1193. [DOI] [PMC free article] [PubMed] [Google Scholar]
- English AR, Voeltz GK. Rab10 GTPase regulates ER dynamics and morphology. Nat Cell Biol. 2012;15:169–178. doi: 10.1038/ncb2647. [DOI] [PMC free article] [PubMed] [Google Scholar]
- English AR, Zurek N, Voeltz GK. Peripheral ER structure and function. Curr Opin Cell Biol. 2009;21:596–602. doi: 10.1016/j.ceb.2009.04.004. [DOI] [PMC free article] [PubMed] [Google Scholar]
- Fribley A, Zhang K, Kaufman RJ. Regulation of apoptosis by the unfolded protein response. Methods Mol Biol. 2009;559:191–204. doi: 10.1007/978-1-60327-017-5_14. [DOI] [PMC free article] [PubMed] [Google Scholar]
- Friedman JR, Lackner LL, West M, DiBenedetto JR, Nunnari J, Voeltz GK. ER tubules mark sites of mitochondrial division. Science. 2011;334:358–362. doi: 10.1126/science.1207385. [DOI] [PMC free article] [PubMed] [Google Scholar]
- Friedman JR, Voeltz GK. The ER in 3D: a multifunctional dynamic membrane network. Trends Cell Biol. 2011;21:709–717. doi: 10.1016/j.tcb.2011.07.004. [DOI] [PMC free article] [PubMed] [Google Scholar]
- Gaietta G, Deerinck TJ, Adams SR, Bouwer J, Tour O, Laird DW, Sosinsky GE, Tsien RY, Ellisman MH. Multicolor and electron microscopic imaging of connexin trafficking. Science. 2002;296:503–507. doi: 10.1126/science.1068793. [DOI] [PubMed] [Google Scholar]
- Gambin Y, Lopez-Esparza R, Reffay M, Sierecki E, Gov NS, Genest M, Hodges RS, Urbach W. Lateral mobility of proteins in liquid membranes revisited. Proc Natl Acad Sci U S A. 2006;103:2098–2102. doi: 10.1073/pnas.0511026103. [DOI] [PMC free article] [PubMed] [Google Scholar]
- Gass JN, Gifford NM, Brewer JW. Activation of an unfolded protein response during differentiation of antibody-secreting B cells. J Biol Chem. 2002;277:49047–49054. doi: 10.1074/jbc.M205011200. [DOI] [PubMed] [Google Scholar]
- Griffiths G, Warren G, Quinn P, Mathieu-Costello O, Hoppeler H. Density of newly synthesized plasma membrane proteins in intracellular membranes. I. Stereological studies. J Cell Biol. 1984;98:2133–2141. doi: 10.1083/jcb.98.6.2133. [DOI] [PMC free article] [PubMed] [Google Scholar]
- Gruber CW, Cemazar M, Heras B, Martin JL, Craik DJ. Protein disulfide isomerase: the structure of oxidative folding. Trends Biochem Sci. 2006;31:455–464. doi: 10.1016/j.tibs.2006.06.001. [DOI] [PubMed] [Google Scholar]
- Guo F, Snapp EL. ERdj3 Regulates BiP Occupancy in Living Cells. J Cell Sci. 2013 doi: 10.1242/jcs.118182. [DOI] [PMC free article] [PubMed] [Google Scholar]
- Harding HP, Novoa I, Zhang Y, Zeng H, Wek R, Schapira M, Ron D. Regulated translation initiation controls stress-induced gene expression in mammalian cells. Mol Cell. 2000;6:1099–1108. doi: 10.1016/s1097-2765(00)00108-8. [DOI] [PubMed] [Google Scholar]
- Harding HP, Zhang Y, Bertolotti A, Zeng H, Ron D. Perk is essential for translational regulation and cell survival during the unfolded protein response. Mol Cell. 2000;5:897–904. doi: 10.1016/s1097-2765(00)80330-5. [DOI] [PubMed] [Google Scholar]
- Harding HP, Zyryanova AF, Ron D. Uncoupling proteostasis and development in vitro with a small molecule inhibitor of the pancreatic endoplasmic reticulum kinase, PERK. J Biol Chem. 2012;287:44338–44344. doi: 10.1074/jbc.M112.428987. [DOI] [PMC free article] [PubMed] [Google Scholar]
- Hegde RS, Bernstein HD. The surprising complexity of signal sequences. Trends Biochem Sci. 2006;31:563–571. doi: 10.1016/j.tibs.2006.08.004. [DOI] [PubMed] [Google Scholar]
- Iizuka R, Yamagishi-Shirasaki M, Funatsu T. Kinetic study of de novo chromophore maturation of fluorescent proteins. Anal Biochem. 2011;414:173–178. doi: 10.1016/j.ab.2011.03.036. [DOI] [PubMed] [Google Scholar]
- Ingolia NT, Lareau LF, Weissman JS. Ribosome profiling of mouse embryonic stem cells reveals the complexity and dynamics of mammalian proteomes. Cell. 2011;147:789–802. doi: 10.1016/j.cell.2011.10.002. [DOI] [PMC free article] [PubMed] [Google Scholar]
- Iwakoshi NN, Lee AH, Vallabhajosyula P, Otipoby KL, Rajewsky K, Glimcher LH. Plasma cell differentiation and the unfolded protein response intersect at the transcription factor XBP-1. Nature immunology. 2003;4:321–329. doi: 10.1038/ni907. [DOI] [PubMed] [Google Scholar]
- Iwawaki T, Akai R, Kohno K, Miura M. A transgenic mouse model for monitoring endoplasmic reticulum stress. Nature Med. 2004;10:98–102. doi: 10.1038/nm970. [DOI] [PubMed] [Google Scholar]
- Jackson MR, Nilsson T, Peterson PA. Retrieval of transmembrane proteins to the endoplasmic reticulum. J Cell Biol. 1993;121:317–333. doi: 10.1083/jcb.121.2.317. [DOI] [PMC free article] [PubMed] [Google Scholar]
- Jain RK, Joyce PB, Molinete M, Halban PA, Gorr SU. Oligomerization of green fluorescent protein in the secretory pathway of endocrine cells. Biochem J. 2001;360:645–649. doi: 10.1042/0264-6021:3600645. [DOI] [PMC free article] [PubMed] [Google Scholar]
- Kaji EH, Lodish HF. In vitro unfolding of retinol-binding protein by dithiothreitol. Endoplasmic reticulum-associated factors. J Biol Chem. 1993;268:22195–22202. [PubMed] [Google Scholar]
- Kelkar DA, Khushoo A, Yang Z, Skach WR. Kinetic analysis of ribosome-bound fluorescent proteins reveals an early, stable, cotranslational folding intermediate. J Biol Chem. 2012;287:2568–2578. doi: 10.1074/jbc.M111.318766. [DOI] [PMC free article] [PubMed] [Google Scholar]
- Koch GL, Booth C, Wooding FB. Dissociation and re-assembly of the endoplasmic reticulum in live cells. J Cell Sci. 1988;91:511–522. doi: 10.1242/jcs.91.4.511. [DOI] [PubMed] [Google Scholar]
- Kwon SE, Chapman ER. Glycosylation is dispensable for sorting of synaptotagmin 1 but is critical for targeting of SV2 and synaptophysin to recycling synaptic vesicles. J Biol Chem. 2012;287:35658–35668. doi: 10.1074/jbc.M112.398883. [DOI] [PMC free article] [PubMed] [Google Scholar]
- Lai CW, Aronson DE, Snapp EL. BiP availability distinguishes states of homeostasis and stress in the endoplasmic reticulum of living cells. Mol Biol Cell. 2010;21:1909–1921. doi: 10.1091/mbc.E09-12-1066. [DOI] [PMC free article] [PubMed] [Google Scholar]
- Lai CW, Otero JH, Hendershot LM, Snapp E. ERdj4 protein is a soluble endoplasmic reticulum (ER) DnaJ family protein that interacts with ER-associated degradation machinery. J Biol Chem. 2012;287:7969–7978. doi: 10.1074/jbc.M111.311290. [DOI] [PMC free article] [PubMed] [Google Scholar]
- Lajoie P, Moir RD, Willis IM, Snapp EL. Kar2p Availability Defines Distinct Forms of Endoplasmic Reticulum Stress in Living Cells. Mol Biol Cell. 2012 doi: 10.1091/mbc.E11-12-0995. [DOI] [PMC free article] [PubMed] [Google Scholar]
- Lee AH, Iwakoshi NN, Anderson KC, Glimcher LH. Proteasome inhibitors disrupt the unfolded protein response in myeloma cells. Proc Natl Acad Sci U S A. 2003;100:9946–9951. doi: 10.1073/pnas.1334037100. [DOI] [PMC free article] [PubMed] [Google Scholar]
- Lee C, Chen LB. Dynamic behavior of endoplasmic reticulum in living cells. Cell. 1988;54:37–46. doi: 10.1016/0092-8674(88)90177-8. [DOI] [PubMed] [Google Scholar]
- Lippincott-Schwartz J, Roberts TH, Hirschberg K. Secretory protein trafficking and organelle dynamics in living cells. Annu Rev Cell Dev Biol. 2000;16:557–589. doi: 10.1146/annurev.cellbio.16.1.557. [DOI] [PMC free article] [PubMed] [Google Scholar]
- Lodish HF, Kong N. The secretory pathway is normal in dithiothreitol-treated cells, but disulfide-bonded proteins are reduced and reversibly retained in the endoplasmic reticulum. J Biol Chem. 1993;268:20598–20605. [PubMed] [Google Scholar]
- Lu L, Ladinsky MS, Kirchhausen T. Cisternal organization of the endoplasmic reticulum during mitosis. Mol Biol Cell. 2009;20:3471–3480. doi: 10.1091/mbc.E09-04-0327. [DOI] [PMC free article] [PubMed] [Google Scholar]
- Luo S, Lee AS. Requirement of the p38 mitogen-activated protein kinase signalling pathway for the induction of the 78 kDa glucose-regulated protein/immunoglobulin heavy-chain binding protein by azetidine stress: activating transcription factor 6 as a target for stress-induced phosphorylation. Biochem J. 2002;366:787–795. doi: 10.1042/BJ20011802. [DOI] [PMC free article] [PubMed] [Google Scholar]
- Ma Y, Hendershot LM. ER chaperone functions during normal and stress conditions. J Chem Neuroanat. 2004;28:51–65. doi: 10.1016/j.jchemneu.2003.08.007. [DOI] [PubMed] [Google Scholar]
- Maiuolo J, Bulotta S, Verderio C, Benfante R, Borgese N. Selective activation of the transcription factor ATF6 mediates endoplasmic reticulum proliferation triggered by a membrane protein. Proc Natl Acad Sci U S A. 2011;108:7832–7837. doi: 10.1073/pnas.1101379108. [DOI] [PMC free article] [PubMed] [Google Scholar]
- Marguet D, Spiliotis ET, Pentcheva T, Lebowitz M, Schneck J, Edidin M. Lateral diffusion of GFP-tagged H2Ld molecules and of GFP-TAP1 reports on the assembly and retention of these molecules in the endoplasmic reticulum. Immunity. 1999;11:231–240. doi: 10.1016/s1074-7613(00)80098-9. [DOI] [PubMed] [Google Scholar]
- Merksamer PI, Trusina A, Papa FR. Real-time redox measurements during endoplasmic reticulum stress reveal interlinked protein folding functions. Cell. 2008;135:933–947. doi: 10.1016/j.cell.2008.10.011. [DOI] [PMC free article] [PubMed] [Google Scholar]
- Michelangeli F, East JM. A diversity of SERCA Ca2+ pump inhibitors. Biochem Soc Trans. 2011;39:789–797. doi: 10.1042/BST0390789. [DOI] [PubMed] [Google Scholar]
- Munro S, Pelham HRB. A C-terminal signal prevents secretion of luminal ER proteins. Cell. 1987;48:899–907. doi: 10.1016/0092-8674(87)90086-9. [DOI] [PubMed] [Google Scholar]
- Nagai N, Hosokawa M, Itohara S, Adachi E, Matsushita T, Hosokawa N, Nagata K. Embryonic lethality of molecular chaperone hsp47 knockout mice is associated with defects in collagen biosynthesis. J Cell Biol. 2000;150:1499–1506. doi: 10.1083/jcb.150.6.1499. [DOI] [PMC free article] [PubMed] [Google Scholar]
- Nagaya H, Tamura T, Higa-Nishiyama A, Ohashi K, Takeuchi M, Hashimoto H, Hatsuzawa K, Kinjo M, Okada T, Wada I. Regulated motion of glycoproteins revealed by direct visualization of a single cargo in the endoplasmic reticulum. J Cell Biol. 2008;180:129–143. doi: 10.1083/jcb.200704078. [DOI] [PMC free article] [PubMed] [Google Scholar]
- Nehls S, Snapp EL, Cole NB, Zaal KJ, Kenworthy AK, Roberts TH, Ellenberg J, Presley JF, Siggia E, Lippincott-Schwartz J. Dynamics and retention of misfolded proteins in native ER membranes. Nat Cell Biol. 2000;2:288–295. doi: 10.1038/35010558. [DOI] [PubMed] [Google Scholar]
- Olveczky BP, Verkman AS. Monte Carlo analysis of obstructed diffusion in three dimensions: application to molecular diffusion in organelles. Biophys J. 1998;74:2722–2730. doi: 10.1016/S0006-3495(98)77978-0. [DOI] [PMC free article] [PubMed] [Google Scholar]
- Ordonez A, Snapp EL, Tan L, Miranda E, Marciniak SJ, Lomas DA. Endoplasmic reticulum polymers impair luminal protein mobility and sensitise to cellular stress in alpha (1) -antitrypsin deficiency. Hepatology. 2012 doi: 10.1002/hep.26173. [DOI] [PMC free article] [PubMed] [Google Scholar]
- Oslowski CM, Urano F. Measuring ER stress and the unfolded protein response using mammalian tissue culture system. Methods Enzymol. 2011;490:71–92. doi: 10.1016/B978-0-12-385114-7.00004-0. [DOI] [PMC free article] [PubMed] [Google Scholar]
- Ostrovsky O, Makarewich CA, Snapp EL, Argon Y. An essential role for ATP binding and hydrolysis in the chaperone activity of GRP94 in cells. Proc Natl Acad Sci U S A. 2009;106:11600–11605. doi: 10.1073/pnas.0902626106. [DOI] [PMC free article] [PubMed] [Google Scholar]
- Pedelacq JD, Cabantous S, Tran T, Terwilliger TC, Waldo GS. Engineering and characterization of a superfolder green fluorescent protein. Nat Biotechnol. 2006;24:79–88. doi: 10.1038/nbt1172. [DOI] [PubMed] [Google Scholar]
- Pincus D, Chevalier MW, Aragon T, van Anken E, Vidal SE, El-Samad H, Walter P. BiP binding to the ER-stress sensor Ire1 tunes the homeostatic behavior of the unfolded protein response. PLoS Biol. 2010;8:e1000415. doi: 10.1371/journal.pbio.1000415. [DOI] [PMC free article] [PubMed] [Google Scholar]
- Rutkowski DT, Arnold SM, Miller CN, Wu J, Li J, Gunnison KM, Mori K, Sadighi Akha AA, Raden D, Kaufman RJ. Adaptation to ER stress is mediated by differential stabilities of pro-survival and pro-apoptotic mRNAs and proteins. PLoS Biol. 2006;4:e374. doi: 10.1371/journal.pbio.0040374. [DOI] [PMC free article] [PubMed] [Google Scholar]
- Saffman PG, Delbruck M. Brownian motion in biological membranes. Proc Natl Acad Sci U S A. 1975;72:3111–3113. doi: 10.1073/pnas.72.8.3111. [DOI] [PMC free article] [PubMed] [Google Scholar]
- Sbalzarini IF, Mezzacasa A, Helenius A, Koumoutsakos P. Effects of organelle shape on fluorescence recovery after photobleaching. Biophys J. 2005;89:1482–1492. doi: 10.1529/biophysj.104.057885. [DOI] [PMC free article] [PubMed] [Google Scholar]
- Shaner NC, Campbell RE, Steinbach PA, Giepmans BN, Palmer AE, Tsien RY. Improved monomeric red, orange and yellow fluorescent proteins derived from Discosoma sp. red fluorescent protein. Nat Biotechnol. 2004;22:1567–1572. doi: 10.1038/nbt1037. [DOI] [PubMed] [Google Scholar]
- Shaner NC, Lin MZ, McKeown MR, Steinbach PA, Hazelwood KL, Davidson MW, Tsien RY. Improving the photostability of bright monomeric orange and red fluorescent proteins. Nat Methods. 2008;5:545–551. doi: 10.1038/nmeth.1209. [DOI] [PMC free article] [PubMed] [Google Scholar]
- Shibata Y, Shemesh T, Prinz WA, Palazzo AF, Kozlov MM, Rapoport TA. Mechanisms determining the morphology of the peripheral ER. Cell. 2010;143:774–788. doi: 10.1016/j.cell.2010.11.007. [DOI] [PMC free article] [PubMed] [Google Scholar]
- Shibata Y, Voeltz GK, Rapoport TA. Rough sheets and smooth tubules. Cell. 2006;126:435–439. doi: 10.1016/j.cell.2006.07.019. [DOI] [PubMed] [Google Scholar]
- Snapp EL. ER biogenesis: proliferation and differentiation. In: Mullins C, editor. The Biogenesis of Cellular Organelles. New York: Landes Bioscience and Kluwer Academic/Plenum Publishers; 2003. pp. 63–95. [Google Scholar]
- Snapp EL. Fluorescent proteins: a cell biologist’s user guide. Trends Cell Biol. 2009;19:649–655. doi: 10.1016/j.tcb.2009.08.002. [DOI] [PMC free article] [PubMed] [Google Scholar]
- Snapp EL, Hegde RS, Francolini M, Lombardo F, Colombo S, Pedrazzini E, Borgese N, Lippincott-Schwartz J. Formation of stacked ER cisternae by low affinity protein interactions. J Cell Biol. 2003;163:257–269. doi: 10.1083/jcb.200306020. [DOI] [PMC free article] [PubMed] [Google Scholar]
- Snapp EL, Sharma A, Lippincott-Schwartz J, Hegde RS. Monitoring chaperone engagement of substrates in the endoplasmic reticulum of live cells. Proc Natl Acad Sci U S A. 2006;103:6536–6541. doi: 10.1073/pnas.0510657103. [DOI] [PMC free article] [PubMed] [Google Scholar]
- Spencer SL, Gaudet S, Albeck JG, Burke JM, Sorger PK. Non-genetic origins of cell-to-cell variability in TRAIL-induced apoptosis. Nature. 2009;459:428–432. doi: 10.1038/nature08012. [DOI] [PMC free article] [PubMed] [Google Scholar]
- Subramanian K, Meyer T. Calcium-induced restructuring of nuclear envelope and endoplasmic reticulum calcium stores. Cell. 1997;89:963–971. doi: 10.1016/s0092-8674(00)80281-0. [DOI] [PubMed] [Google Scholar]
- Suzuki T, Arai S, Takeuchi M, Sakurai C, Ebana H, Higashi T, Hashimoto H, Hatsuzawa K, Wada I. Development of cysteine-free fluorescent proteins for the oxidative environment. PLoS One. 2012;7:e37551. doi: 10.1371/journal.pone.0037551. [DOI] [PMC free article] [PubMed] [Google Scholar]
- Swedlow JR. Quantitative fluorescence microscopy and image deconvolution. Methods in cell biology. 2007;81:447–465. doi: 10.1016/S0091-679X(06)81021-6. [DOI] [PubMed] [Google Scholar]
- Tabas I, Ron D. Integrating the mechanisms of apoptosis induced by endoplasmic reticulum stress. Nat Cell Biol. 2011;13:184–190. doi: 10.1038/ncb0311-184. [DOI] [PMC free article] [PubMed] [Google Scholar]
- Taylor CW, Broad LM. Pharmacological analysis of intracellular Ca2+ signalling: problems and pitfalls. Trends in pharmacological sciences. 1998;19:370–375. doi: 10.1016/s0165-6147(98)01243-7. [DOI] [PubMed] [Google Scholar]
- Terasaki M, Chen LB, Fujiwara K. Microtubules and the endoplasmic reticulum are highly interdependent structures. J Cell Biol. 1986;103:1557–1568. doi: 10.1083/jcb.103.4.1557. [DOI] [PMC free article] [PubMed] [Google Scholar]
- Terasaki M, Jaffe LA. Organization of the sea urchin egg endoplasmic reticulum and its reorganization at fertilization. J Cell Biol. 1991;114:929–940. doi: 10.1083/jcb.114.5.929. [DOI] [PMC free article] [PubMed] [Google Scholar]
- Tsaytler P, Harding HP, Ron D, Bertolotti A. Selective inhibition of a regulatory subunit of protein phosphatase 1 restores proteostasis. Science. 2011;332:91–94. doi: 10.1126/science.1201396. [DOI] [PubMed] [Google Scholar]
- Upton JP, Wang L, Han D, Wang ES, Huskey NE, Lim L, Truitt M, McManus MT, Ruggero D, Goga A, Papa FR, Oakes SA. IRE1alpha cleaves select microRNAs during ER stress to derepress translation of proapoptotic Caspase-2. Science. 2012;338:818–822. doi: 10.1126/science.1226191. [DOI] [PMC free article] [PubMed] [Google Scholar]
- Voeltz GK, Rolls MM, Rapoport TA. Structural organization of the endoplasmic reticulum. EMBO Rep. 2002;3:944–950. doi: 10.1093/embo-reports/kvf202. [DOI] [PMC free article] [PubMed] [Google Scholar]
- Volkmann K, Lucas JL, Vuga D, Wang X, Brumm D, Stiles C, Kriebel D, Der-Sarkissian A, Krishnan K, Schweitzer C, Liu Z, Malyankar UM, Chiovitti D, Canny M, Durocher D, Sicheri F, Patterson JB. Potent and selective inhibitors of the inositol-requiring enzyme 1 endoribonuclease. J Biol Chem. 2011;286:12743–12755. doi: 10.1074/jbc.M110.199737. [DOI] [PMC free article] [PubMed] [Google Scholar]
- Wallace W, Schaefer LH, Swedlow JR. A workingperson’s guide to deconvolution in light microscopy. Biotechniques. 2001;31:1076–1078. 1080. doi: 10.2144/01315bi01. 1082 passim. [DOI] [PubMed] [Google Scholar]
- Walter P, Ron D. The unfolded protein response: from stress pathway to homeostatic regulation. Science. 2011;334:1081–1086. doi: 10.1126/science.1209038. [DOI] [PubMed] [Google Scholar]
- Wang S, Kaufman RJ. The impact of the unfolded protein response on human disease. J Cell Biol. 2012;197:857–867. doi: 10.1083/jcb.201110131. [DOI] [PMC free article] [PubMed] [Google Scholar]
- West M, Zurek N, Hoenger A, Voeltz GK. A 3D analysis of yeast ER structure reveals how ER domains are organized by membrane curvature. J Cell Biol. 2011;193:333–346. doi: 10.1083/jcb.201011039. [DOI] [PMC free article] [PubMed] [Google Scholar]
- Wu J, Rutkowski DT, Dubois M, Swathirajan J, Saunders T, Wang J, Song B, Yau GD, Kaufman RJ. ATF6alpha optimizes long-term endoplasmic reticulum function to protect cells from chronic stress. Dev Cell. 2007;13:351–364. doi: 10.1016/j.devcel.2007.07.005. [DOI] [PubMed] [Google Scholar]
- Zeligs JD, Wollman SH. Mitosis in rat thyroid epithelial cells in vivo. J Ultrastruct Res. 1979;66:53–77. doi: 10.1016/s0022-5320(79)80065-9. [DOI] [PubMed] [Google Scholar]