

Abstract
Coronary artery disease (CAD) is the leading cause of death and disability worldwide, and its prevalence is expected to increase in the coming years. CAD events are caused by the interplay of genetic and environmental factors, the effects of which are mainly mediated through cardiovascular risk factors. The techniques used to study the genetic basis of these diseases have evolved from linkage studies to candidate gene studies and genome-wide association studies. Linkage studies have been able to identify genetic variants associated with monogenic diseases, whereas genome-wide association studies have been more successful in determining genetic variants associated with complex diseases. Currently, genome-wide association studies have identified approximately 40 loci that explain 6% of the heritability of CAD. The application of this knowledge to clinical practice is challenging, but can be achieved using various strategies, such as genetic variants to identify new therapeutic targets, personal genetic information to improve disease risk prediction, and pharmacogenomics. The main aim of this narrative review is to provide a general overview of our current understanding of the genetics of coronary artery disease and its potential clinical utility.
Keywords: coronary artery disease, pathogenesis, genetic risk factors, genetic variants
Introduction
Coronary artery disease (CAD) is the principal individual cause of mortality and morbidity worldwide. A recent report on the Global Burden of Disease, which proposes disability-adjusted life years (DALYs, calculated as the sum of years of life lost and years lived with disability) as a new metric to measure disease burden, indicates that CAD accounted for the largest proportion of DALYs due to a single cause worldwide in 2010, explaining 5% of the total number of DALYS (Figure 1).1
Figure 1.

The top eleven diseases explain 37.7% of the global burden of disease measured as DALYs, with coronary artery disease as the leading cause of DALYs in 2010.
Abbreviations: DALYs, disability-adjusted life years; AIDS, acquired immune deficiency syndrome; HIV, human immunodeficiency virus.
CAD is a complex chronic inflammatory disease, characterized by remodeling and narrowing of the coronary arteries supplying oxygen to the heart. It can have various clinical manifestations, including stable angina, acute coronary syndrome, and sudden cardiac death. It has a complex etiopathogenesis and a multifactorial origin related to environmental factors, such as diet, smoking, and physical activity, and genetic factors2 that modulate risk of the disease both individually and through interaction.
In this narrative review, we summarize the main etiopathogenic mechanisms that underlie CAD, with a focus on current knowledge concerning the genetic architecture of the disease and the clinical utility of this knowledge.
Atherosclerosis, the main etiopathogenic mechanism of CAD
Atherosclerosis is the main etiopathogenic process that causes CAD, and its progression is related to an interplay between environmental and genetic factors, with the latter exerting their effects either directly or via cardiovascular risk factors (Figure 2). Although clinical ischemic cardiovascular events usually appear after the fifth decade of life in men and the sixth decade of life in women, this process starts early in life, even during fetal development.3
Figure 2.
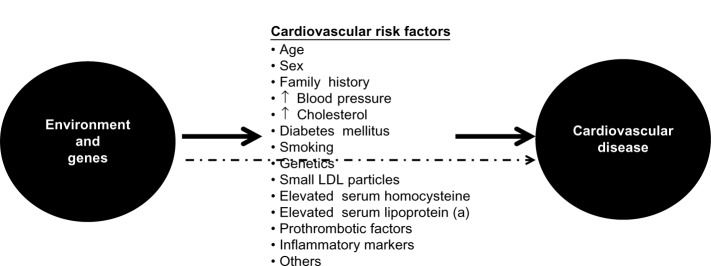
Genetic and environmental causes of development and progression of atherosclerosis act directly or through known intermediate traits.
Abbreviation: LDL, low-density lipoprotein.
Briefly, atherosclerosis is a silent progressive chronic process characterized by accumulation of lipids, fibrous elements, and inflammatory molecules in the walls of the large arteries.4–8 This process begins with the efflux of low-density lipoprotein (LDL) cholesterol to the subendothelial space, which can then be modified and oxidized by various agents. Oxidized/modified LDL particles are potent chemotactic molecules that induce expression of vascular cell adhesion molecule and intercellular adhesion molecule at the endothelial surface, and promote monocyte adhesion and migration to the subendothelial space. Monocytes differentiate to macrophages in the intima media. Recently, different subsets of monocytes have been identified, and their roles appear to be different according to the phase of atherosclerosis in which they are involved.9 Macrophages bind oxidized LDL via scavenger receptors to become foam cells,5 and also have proinflammatory functions, including the release of cytokines such as interleukins and tumor necrosis factor. The final result of this process is formation of the first typical atherosclerotic lesion, ie, the fatty streak, in which foam cells are present in the subendothelial space.
Other types of leukocytes, such as lymphocytes and mast cells, also accumulate in the subendothelial space.10 The cross-talk between monocytes, macrophages, foam cells, and T-cells results in cellular and humoral immune responses, and ultimately in a chronic inflammatory state with the production of several proinflammatory molecules.11,12 This process continues with the migration of smooth muscle cells from the medial layer of the artery into the intima, resulting in the transition from a fatty streak to a more complex lesion.5 Once smooth muscle cells are in the intima media, they produce extracellular matrix molecules, creating a fibrous cap that covers the original fatty streak. Foam cells inside the fibrous cap die and release lipids that accumulate in the extracellular space, forming a lipid-rich pool known as the necrotic core.13 The result of this process is formation of the second atherosclerotic lesion, the fibrous plaque.
The thickness of the fibrous cap is key for maintaining the integrity of the atherosclerotic plaque,8 and two types of plaque can be defined depending on the balance between formation and degradation of this fibrous cap, ie, stable and unstable or vulnerable. Stable plaques have an intact, thick fibrous cap composed of smooth muscle cells in a matrix rich in type I and III collagen.14 Protrusion of this type of plaque into the lumen of the artery produces flow-limiting stenosis, leading to tissue ischemia and usually stable angina. Vulnerable plaques have a thin fibrous cap made mostly of type I collagen and few or no smooth muscle cells, but abundant macrophages and proinflammatory and prothrombotic molecules.8,10 These plaques are prone to erosion or rupture, exposing the core of the plaque to circulating coagulation proteins, causing thrombosis, sudden occlusion of the artery lumen,8,10 and usually an acute coronary syndrome. Intraplaque hemorrhage is also a potential contributor to progression of atherosclerosis, and appears to occur when the vasa vasorum invades the intima from the adventitia.15
Study of the genetic architecture of disease
In order to study the genetic factors associated with a disease, several sequential steps must be followed. The first step involves quantification of the genetic component of the disease, which can be expressed as its heritability, ie, the proportion of the total population variance of the phenotype at a particular time or age that is attributable to genetic variation.16 The heritability of some phenotypes associated with arteriosclerosis has already been determined, and generally ranges from 40% to 55% (Table 1).17,18
Table 1.
Main results of different studies analyzing the heritability of several phenotypes associated with arteriosclerosis
| Phenotype | Heritability | References |
|---|---|---|
| CAD | ||
| Acute myocardial infarction | 0.56 | Nora et al89 |
| Mortality from | 0.53–0.57 (men) | Zdravkovic et al,90 |
| CAD | 0.58 (women) | Wienke et al91 |
| Coronary artery calcification | 0.42 | Peyser et al92 |
| Atherosclerosis | ||
| Carotid artery atherosclerosis | 0.21–0.64 | Xiang et al,93 Fox et al,94 Swan et al,95 North et al,96 Hunt et al97 |
Abbreviation: CAD, coronary artery disease.
The second step is to study the genetic architecture of the disease, ie, identify the loci, and within these loci, the genetic variants that modulate disease susceptibility. However, this task is one of the greatest challenges in current genetic research. Depending on the observed patterns of inheritance, it is possible to classify genetic diseases in two broad classes, ie, monogenic or Mendelian diseases, in which genetic variation in one gene accounts for most or all of the variation in disease risk;19 and complex diseases, which are characterized by complex patterns of inheritance caused by the combination of multiple genetic variants (often with a small effect) and environmental factors, and modulated by their mutual interaction.20 For example, in the case of CAD, the effects of known genetic variants range from an odds ratio of 1.04 to approximately 1.30 per copy of the risk allele.21 Studies of the genetic architecture of a disease generally have two approaches, ie, linkage and association studies.17
Linkage studies
In these studies, large families with several affected and unaffected relatives across one or more generations are identified and recruited.22,23 Classically, large numbers of genetic markers, uniformly distributed throughout the genome, are analyzed to see if their transmission from generation to generation is associated with the presence of the disease (segregation). The initial objective is to identify regions of the genome that contain genes predisposing to or causing the disease under study. Thereafter, the chromosomal region that segregates with the disease can be fine-mapped to identify the causal gene.17,22,23 This type of study has been successful in identifying many disease genes, particularly those that cause Mendelian traits, but less successful in identifying genes associated with complex diseases.24 In the case of CAD, notable successes include the identification of variants in ALOX5AP as being associated with coronary and cerebrovascular diseases,25 in MEF2A as being associated with CAD,26 and in PCSK9 as a gene for which variation is relevant in the metabolism of cholesterol.27
Association studies
Association studies are likely to be more effective tools than linkage studies for studying genetically complex traits because they can have greater statistical power to detect genetic variants with small effects.28 These types of studies evaluate the association between genetic variants (usually single nucleotide polymorphisms or copy number variations) and the presence/absence of a disease or a specific phenotype. The biggest challenges for this type of study are the accuracy of phenotype definition and replication of the findings. In order to identify genetic variants with small effects, large sample sizes are required, which are usually obtained by pooling different samples and populations, potentially with different phenotyping methods or criteria. In many cases, this heterogeneity results in dilution of the effects of causal genetic variants. In other cases, the phenotype itself may be difficult to define (eg, fibromyalgia) or show substantial intraindividual variability (eg, blood pressure), diluting the observable effect of the causal variant on the phenotype of interest. There are several types of association studies, as follows.
Candidate gene studies
Association studies in candidate genes, usually known to be related to intermediate traits, have been widely used for the study of complex diseases.4,29,30 This approach is based on an a priori hypothesis generated from knowledge of the disease pathogenesis or previous results.17,31 In the 1990s, this type of research became very popular and many studies analyzing the relationship between genetic variants and phenotypes were published, although their main findings were often difficult to replicate.32
Genome-wide association studies
The goal of genome-wide association studies (GWAS) is to identify genetic variants associated with complex phenotypes without the need for prior selection of candidate loci or genes.33 GWAS are based on two assumptions: first, a large proportion of common variation in the genome can be captured by a relatively small number of genetic variants, an hypothesis that is supported by evidence from the HapMap project;34 and, second, common complex diseases are mainly caused by common genetic variants.
This type of study became possible through technologic advances that allowed large numbers of single nucleotide polymorphisms to be genotyped throughout the genome and common patterns of linkage disequilibrium in different populations to be determined, thanks to studies like the Human Genome Project and the HapMap Project.34,35 This evidence allowed the possibility of searching the human genome for common variants associated with a huge variety of phenotypes and diseases.36 Moreover, powerful association analysis methods and software have also been developed.37,38 These studies are hypothesis-free, and due to the multiple comparisons and the need to reduce the burden of potential type I errors, they have to correct the P-value to be considered statistically significant according to the number of tests performed. Usually, this statistical significance threshold is located at a P-value, 10−8.
In parallel, international collaborations and consortia have provided new insights in medical research.39 While the number of studies that use this methodology has increased rapidly in recent years (Figure 3), this type of design is known to have some limitations (Table 2). These include the low proportion of heritability explained by the genetic variants identified, which has been found to be lower than 10% for most phenotypes,4,40 and the fact that the results are based on statistical association and do not provide functional insights. However, these studies have consistently identified hundreds of loci in dozens of clinically important phenotypes,4,41 providing further insights into the genetics of complex diseases.
Figure 3.

Number of articles published per year according to the genome-wide association studies catalog (accessed on September 27, 2013).
Table 2.
Comparison between candidate gene studies and GWAS
| Feature | Candidate gene studies | Genome-wide association studies |
|---|---|---|
| Hypothesis | Need a priori hypothesis | Hypothesis-free |
| Number of genetic variants | Limited (one to hundreds) | Large (hundreds of thousands to millions, with imputation) |
| Sample size | Limited (usually hundreds) | Large (hundreds to hundreds of thousands) |
| Biases | Selection bias Confounding Population stratification Publication bias |
Selection bias Confounding Population stratification (methods to control) |
| Limitations | Sample size Nonreplicability of results Lack of thoroughness Low genetic coverage |
Control for multiple testing Phenotype definition Based on common variants Statistical versus functional association |
| False positive rate | Large | Low |
| False negative rate | Low | Large |
Whole-genome sequencing studies
The human genome contains approximately 3.1 billion nucleotides with approximately 56 million genetic variants. The exome, ie, the part of the genome formed by protein-coding exons, comprises approximately 30 million nucleotides and 23,500 genes.42 Rapidly improving whole-genome sequencing (WGS) technologies are creating new research avenues based on sequencing entire individuals,39,42 and the rapidly decreasing costs of WGS will soon allow this technology to be used for tackling the genetic architecture of disease.43 WGS are expected to contribute to better definition of the genetic basis of a range of phenotypes, responses to therapy, and clinical outcomes. Although WGS mainly focus on Mendelian disorders, the WGS approach is becoming important for identifying and analyzing rare variants, which might have larger effects on disease risk than the common variants identified by GWAS.42
One of the main disadvantages of WGS is the rate of false positive/false negative results in variant calling, and identification of the true causal genetic variant. Considering a false positive rate of 2%, an analysis of three billion genetic variants per genome would yield 60,000,000 miscalled variants. Therefore, false positives are expected to remain a major limitation of WGS, and alternative methods for validating variants identified by this approach will be necessary. Also, WGS will have a real challenge in identifying the true causal genetic variants among all alleles because all genes and proteins carry several nonpathogenic variants. For this reason, a classification of genetic variants according to the strength of the evidence for causality has been proposed as follows: disease-causing, likely disease-causing, disease-associated, functional but not associated with disease; and unknown biological function.42
Current knowledge of genetic architecture of CAD
Our understanding of the genetic architecture of CAD has improved considerably since 2007 when the first GWAS of this disease were published. The first two studies were published simultaneously and identified the 9p21 locus to be associated with myocardial infarction44 and CAD,45 and a third study replicated these findings.46 At the beginning of 2013, a meta-analysis of several GWAS identified a final set of about 40 genetic variants associated with CAD (Table 3) that explains approximately 6% of the heritability of CAD.21 Some of these variants are related to lipid metabolism, blood pressure, and inflammation, which confirms the importance of these pathways in the pathogenesis of CAD.21 In contrast, this study found no overlap between these CAD loci and those associated with type 2 diabetes or glucometabolic traits. Moreover, most of these CAD loci are located in intergenic regions, or in regions with unknown function or where the relationship to atherosclerosis or its intermediate traits is unknown.
Table 3.
Summary of main findings of most recent meta-analysis of genome-wide association studies in coronary artery disease, showing the lead single nucleotide polymorphism of each locus, the closest gene, chromosomal location, risk allele and frequency, P-value, and effect size of the reported associations
| rsID | Gene located at or near loci | Chr | Risk/nonrisk allele (risk allele frequency) | Combined P-value | Combined OR |
|---|---|---|---|---|---|
| rs602633 | SORT1 | 1 | C/A (0.77) | 1.47 × 10⁻²⁵ | 1.12 |
| rs17114036 | PPAP2B | 1 | A/G (0.91) | 5.80 × 10⁻¹² | 1.11 |
| rs4845625 | IL6R | 1 | T/C (0.47) | 3.64 × 10⁻¹⁰ | 1.09 |
| rs67258870 | WDR12 | 2 | C/T (0.11) | 1.16 × 10⁻¹⁵ | 1.12 |
| rs515135 | APOB | 2 | G/A (0.83) | 2.56 × 10⁻¹⁰ | 1.03 |
| rs2252641 | ZEB2-ACO74093 | 2 | G/A (0.46) | 5.30 × 10⁻⁸ | 1.06 |
| rs1561198 | VAMP5-VAMP8-GGCX | 2 | A/G (0.45) | 1.22 × 10⁻¹⁰ | 1.07 |
| rs6544713 | ABCG5-ABCG8 | 2 | T/C (0.30) | 2.12 × 10⁻⁹ | 0.96 |
| rs9818870 | MRAS | 3 | T/C (0.14) | 2.62 × 10⁻⁹ | 1.07 |
| rs7692387 | GUCY1A3 | 4 | G/A (0.81) | 2.65 × 10⁻¹¹ | 1.13 |
| rs1878406 | EDNRA | 4 | T/C (0.15) | 2.54 × 10⁻⁸ | 1.09 |
| rs273909 | SLC22A4-SLC22A5 | 5 | C/T (0.14) | 9.62 × 10⁻¹⁰ | 1.11 |
| rs12190287 | TCF21 | 6 | C/G (0.59) | 4.94 × 10⁻¹³ | 1.07 |
| rs2048327 | SLC22A3-LPAL2-LPA | 6 | G/A (0.35) | 6.86 × 10⁻¹¹ | 1.06 |
| rs9369640 | PHACTR1 | 6 | A/C (0.65) | 7.53 × 10⁻²² | 1.09 |
| rs10947789 | KCKN5 | 6 | T/C (0.76) | 9.81 × 10⁻⁹ | 1.01 |
| rs4252120 | PLG | 6 | T/C (0.73) | 4.88 × 10¹⁰ | 1.07 |
| rs11556924 | ZC3HC1 | 7 | C/T (0.65) | 6.74 × 10⁻¹⁷ | 1.09 |
| rs2023938 | HDAC9 | 7 | G/A (0.10) | 4.94 × 10⁻⁸ | 1.13 |
| rs264 | LPL | 8 | G/A (0.86) | 2.88 × 10⁻⁹ | 1.06 |
| rs2954029 | TRIB1 | 8 | A/T (0.55) | 4.75 × 10⁻⁹ | 1.05 |
| rs1333049 | CDKN2BAS1 | 9 | C/G (0.47) | 1.39 × 10−52 | 1.23 |
| rs3217992 | 9 | A/G (0.38) | 7.75 × 10−57 | 1.16 | |
| rs579459 | ABO | 9 | C/T (0.21) | 2.66 × 10⁻⁸ | 1.07 |
| rs12413409 | CYP17A1-CNNM2-NT5C2 | 10 | G/A (0.89) | 6.26 × 10⁻⁸ | 1.10 |
| rs2505083 | KIAA1462 | 10 | C/T (0.42) | 1.35 × 10⁻¹¹ | 1.06 |
| rs501120 | CXCL12 | 10 | A/G (0.83) | 1.79 × 10⁻⁹ | 1.07 |
| rs2047009 | 10 | C/A (0.48) | 1.59 × 10⁻⁹ | 1.05 | |
| rs974819 | PDGFD | 11 | A/G (0.29) | 3.55 × 10⁻¹¹ | 1.07 |
| rs3184504 | SH2B3 | 12 | T/C (0.40) | 5.44 × 10⁻¹¹ | 1.07 |
| rs4773144 | COL4A1-COL4A2 | 13 | G/A (0.42) | 1.43 × 10⁻¹¹ | 1.07 |
| rs9515203 | 13 | T/C (0.74) | 5.85 × 10⁻¹² | 1.08 | |
| rs9319428 | FLT1 | 13 | A/G (0.32) | 7.32 × 10⁻¹¹ | 1.10 |
| rs2895811 | HHIPL1 | 14 | C/T (0.43) | 4.08 × 10⁻¹⁰ | 1.06 |
| rs7173743 | ADAMTS7 | 15 | T/C (0.58) | 6.74 × 10⁻¹³ | 1.07 |
| rs17514846 | FURIN-FES | 15 | A/C (0.44) | 9.33 × 10⁻¹¹ | 1.04 |
| rs12936587 | RAI1-PEMT-RASD1 | 17 | G/A (0.59) | 1.24 × 10⁻⁹ | 1.06 |
| rs2281727 | SMG6 | 17 | C/T (0.36) | 7.83 × 10⁻⁹ | 1.05 |
| rs1122608 | LDLR | 19 | G/T (0.76) | 6.33 × 10⁻¹⁴ | 1.10 |
| rs9982601 | Gene desert (KCNE2) | 21 | T/C (0.13) | 7.67 × 10⁻¹⁷ | 1.13 |
Abbreviations: Chr, chromosome; OR, odds ratio.
Genetics of cardiovascular risk factors
Classical cardiovascular risk factors, such as hypertension, diabetes, dyslipidemia, and obesity, are also considered to be complex traits caused by the interplay between genetic and environmental factors, as in the case of CAD. The GWAS approach has had a similar degree of success in identifying the genetic architecture of these risk factors and that of CAD, in that only a small fraction of the heritability of these phenotypes has been explained (Table 4).47–53 While some of these genetic variants are also associated with CAD risk, others are not, ie, they have such small effects that very sample sizes would be required to detect them.
Table 4.
Summary of main findings of most recent meta-analyses of genome-wide association studies of cardiovascular risk factors, showing the lead single nucleotide polymorphism of each locus, the closest gene, chromosomal location, risk allele and frequency, and P-value of the reported associations
| rsID | Loci | Chr | Risk allele (Risk allele frequency) | Combined P-value | Known effect on CAD | Reference | |
|---|---|---|---|---|---|---|---|
| Obesity | |||||||
| rs2815752 | NEGR1 | 1 | A (0.61) | 1.61 × 10⁻²² | No | 50 | |
| rs543874 | SEC16B | 1 | G (0.19) | 3.56 × 10⁻²³ | No | 50 | |
| rs1514175 | TNNI3K | 1 | A (0.43) | 8.16 × 10⁻¹⁴ | No | 50 | |
| rs1555543 | PTBP2 | 1 | C (0.59) | 3.68 × 10⁻¹⁰ | No | 50 | |
| rs984222 | TBX15-WARS2 | 1 | G (0.64) | 3.81 × 10⁻¹⁴ | No | 49 | |
| rs2867125 | TMEM18 | 2 | C (0.83) | 2.77 × 10−49 | No | 50 | |
| rs713586 | RBJ | 2 | C (0.47) | 6.17 × 10⁻²² | No | 50 | |
| rs887912 | FANCL | 2 | T (0.29) | 1.79 × 10⁻¹² | No | 50 | |
| rs10195252 | GRB14 | 2 | T (0.60) | 2.09 × 10⁻²⁴ | No | 49 | |
| rs13078807 | LRP1B | 2 | C (0.18) | 1.35 × 10⁻¹⁰ | No | 50 | |
| rs9816226 | ETV5 | 3 | T (0.82) | 1.69 × 10⁻¹⁸ | No | 50 | |
| rs13078807 | CADM2 | 3 | G (0.20) | 3.94 × 10⁻¹¹ | No | 50 | |
| rs6795735 | ADAMTS9 | 3 | C (0.60) | 9.79 × 10⁻¹⁴ | No | 49 | |
| rs6784615 | NISCH-STAB1 | 3 | T (0.94) | 3.84 × 10⁻¹⁰ | No | 49 | |
| rs13107325 | SLC39A8 | 4 | T (0.07) | 1.50 × 10⁻¹³ | No | 50 | |
| rs10938397 | GNPDA2 | 4 | G (0.43) | 3.78 × 10⁻³¹ | No | 50 | |
| rs2112347 | FLJ35779 | 5 | T (0.63) | 2.17 × 10⁻¹³ | No | 50 | |
| rs4836133 | ZNF608 | 5 | A (0.48) | 1.97 × 10⁻⁹ | No | 50 | |
| rs681681 | CPEB4 | 5 | A (0.34) | 1.91 × 10⁻⁹ | No | 49 | |
| rs987237 | TFAP2B | 6 | G (0.18) | 2.90 × 10⁻²⁰ | No | 50 | |
| rs206936 | NUDT3 | 6 | G (0.21) | 3.02 × 10⁻⁸ | No | 50 | |
| rs9491696 | RSPO3 | 6 | G (0.48) | 1.84 × 10−40 | No | 49 | |
| rs6905288 | VEGFA | 6 | A (0.56) | 5.88 × 10⁻²⁵ | No | 49 | |
| rs1294421 | LY86 | 6 | G (0.61) | 1.75 × 10⁻¹⁷ | No | 49 | |
| rs1055144 | NFE2L3 | 7 | T (0.21) | 9.97 × 10⁻¹⁸ | No | 49 | |
| rs10968576 | LRRN6C | 9 | G (0.31) | 2.65 × 10⁻¹³ | No | 50 | |
| rs10767664 | BNF | 11 | A (0.78) | 4.69 × 10⁻²⁶ | No | 50 | |
| rs3817334 | MTCH2 | 11 | T (0.40) | 1.59 × 10⁻¹² | No | 50 | |
| rs4929949 | RPL27A | 11 | C (0.52) | 2.80 × 10⁻⁹ | No | 50 | |
| rs7138803 | FAIM2 | 12 | A (0.38) | 1.82 × 10⁻¹⁷ | No | 50 | |
| rs718314 | ITPR2-SSPN | 12 | G (0.26) | 1.14 × 10⁻¹⁷ | No | 50 | |
| rs1443512 | HOXC13 | 12 | A (0.24) | 6.38 × 10⁻¹⁷ | No | 49 | |
| rs4771122 | MTIF3 | 13 | G (0.24) | 9.48 × 10⁻¹⁰ | No | 50 | |
| rs10150332 | NRXN3 | 14 | C (0.21) | 2.75 × 10⁻¹¹ | No | 50 | |
| rs11847697 | PRKD1 | 14 | T (0.04) | 5.76 × 10⁻¹¹ | No | 50 | |
| rs2241423 | MAP2K5 | 15 | G (0.78) | 1.19 × 10⁻¹⁸ | No | 50 | |
| rs1558902 | FTO | 16 | A (0.42) | 4.8 × 10−120 | No | 50 | |
| rs7359397 | SH2B1 | 16 | T (0.40) | 1.88 × 10⁻²⁰ | No | 50 | |
| rs12444979 | GPRC5B | 16 | C (0.87) | 2.91 × 10⁻²¹ | No | 50 | |
| rs571312 | MC4R | 18 | A (0.24) | 6.43 × 10−42 | No | 50 | |
| rs29941 | KCTD15 | 19 | G (0.67) | 3.01 × 10⁻⁹ | No | 50 | |
| rs2287019 | QPCTL | 19 | C (0.80) | 1.88 × 10⁻¹⁶ | No | 50 | |
| rs3810291 | TMEM160 | 19 | A (0.67) | 1.64 × 10⁻¹² | No | 50 | |
| rs4823006 | ZNRF3-KREMEN1 | 22 | A (0.57) | 1.10 × 10⁻¹¹ | No | 49 | |
| Diabetes | |||||||
| rs340874 | PROX1 | 1 | C (0.52) | 6.6 × 10⁻¹² | No | 47 | |
| rs560887 | G6PC2 | 2 | C (0.70) | 8.7 × 10−218 | No | 47 | |
| rs780094 | GCKR | 2 | C (0.62) | 5.6 × 10−38 | No | 47 | |
| rs243021 | BCL11A | 2 | A (0.46) | 2.9 × 10⁻¹⁵ | No | 52 | |
| rs7578326 | IRS1 | 2 | A (0.64) | 5.4 × 10⁻²⁰ | No | 52 | |
| rs11708067 | ADCY5 | 3 | A (0.78) | 7.1 × 10⁻²² | No | 47 | |
| rs11920090 | SLC2A2 | 3 | T (0.87) | 8.1 × 10⁻¹³ | No | 47 | |
| rs4457053 | ZBED3 | 5 | G (0.26) | 2.8 × 10⁻¹² | No | 52 | |
| rs4607517 | GCK | 7 | A (0.16) | 6.5 × 10−92 | No | 47 | |
| rs2191349 | DGKB-TMEM195 | 7 | T (0.52) | 3.0 × 10−44 | No | 47 | |
| rs972283 | KLF14 | 7 | G (0.55) | 2.2 × 10⁻¹⁰ | No | 52 | |
| rs11558471 | SLC30A8 | 8 | A (0.68) | NA | No | 47 | |
| rs896854 | TP53INP1 | 8 | T (0.48) | 9.9 × 10⁻¹⁰ | No | 52 | |
| rs7034200 | GLIS3 | 9 | A (0.49) | 1.0 × 10⁻¹² | No | 47 | |
| rs13292136 | CHCHD9 | 9 | C (0.93) | 2.8 × 10⁻⁸ | No | 52 | |
| rs10885122 | ADRA2A | 10 | G (0.87) | 2.9 × 10⁻¹⁶ | No | 47 | |
| rs4506565 | TCF7L2 | 10 | T (0.31) | NA | No | 47 | |
| rs10830963 | MTNR1B | 11 | G (0.30) | 5.8 × 10−175 | No | 47 | |
| rs7944584 | MADD | 11 | A (0.75) | 2.0 × 10⁻¹⁸ | No | 47 | |
| rs174550 | FADS1 | 11 | T (0.64) | 1.7 × 10⁻¹⁵ | No | 47 | |
| rs11605924 | CRY2 | 11 | A (0.49) | 1.0 × 10⁻¹⁴ | No | 47 | |
| rs231362 | KCNQ1 | 11 | G (0.52) | 2.8 × 10⁻¹³ | No | 52 | |
| rs1552224 | CENTD2 | 11 | A (0.88) | 1.4 × 10⁻²² | No | 52 | |
| rs1387153 | MTNR1B | 11 | T (0.28) | 7.8 × 10⁻¹⁵ | No | 52 | |
| rs1531343 | HMGA2 | 12 | C (0.10) | 3.6 × 10⁻⁹ | No | 52 | |
| rs7957197 | HNF1A | 12 | T (0.85) | 2.4 × 10⁻⁸ | No | 52 | |
| rs11634397 | ZFAND6 | 15 | G (0.60) | 2.4 × 10⁻⁹ | No | 52 | |
| rs11071657 | C2CD4B | 15 | A (0.63) | 3.6 × 10⁻⁸ | No | 47 | |
| rs8042680 | PRC1 | 15 | A (0.22) | 2.4 × 10⁻¹⁰ | No | 52 | |
| rs5945326 | DUSP9 | X | A (0.79) | 3.0 × 10⁻¹⁰ | No | 52 | |
| Total cholesterol | |||||||
| rs12027135 | LDLRAP1 | 1 | T (0.45) | 4 × 10⁻¹¹ | Yes | 51 | |
| rs7515577 | EVI5 | 1 | A (0.21) | 3 × 10⁻⁸ | No | 51 | |
| rs2642442 | MOSC1 | 1 | T (0.32) | 6 × 10⁻¹³ | No | 51 | |
| rs514230 | IRF2BP2 | 1 | T (0.48) | 5 × 10⁻¹⁴ | No | 51 | |
| rs7570971 | RAB3GAP1 | 2 | C (0.34) | 2 × 10⁻⁸ | No | 51 | |
| rs2290159 | RAF1 | 3 | G (0.22) | 4 × 10⁻⁹ | No | 51 | |
| rs12916 | HMGCR | 5 | T (0.39) | 9 × 10−47 | No | 51 | |
| rs6882076 | TIMD4 | 5 | C (0.35) | 7 × 10⁻²⁸ | No | 51 | |
| rs3177928 | HLA | 6 | G (0.16) | 4 × 10⁻¹⁹ | No | 51 | |
| rs2814982 | C6orf106 | 6 | C (0.11) | 5 × 10⁻¹¹ | No | 51 | |
| rs9488822 | FRK | 6 | A (0.35) | 2 × 10⁻¹⁰ | No | 51 | |
| rs12670798 | DNAH11 | 7 | T (0.23) | 9 × 10⁻¹⁰ | No | 51 | |
| rs2072183 | NPC1L1 | 7 | G (0.25) | 3 × 10⁻¹¹ | No | 51 | |
| rs2081687 | CYP7A1 | 8 | C (0.35) | 2 × 10⁻⁸ | No | 51 | |
| rs2737229 | TRPS1 | 8 | A (0.30) | 2 × 10⁻⁸ | No | 51 | |
| rs2255141 | GPAM | 10 | G (0.30) | 2 × 10⁻¹⁰ | No | 51 | |
| rs10128711 | SPTY2D1 | 11 | C (0.28) | 3 × 10⁻⁸ | No | 51 | |
| rs7941030 | UBASH3B | 11 | C (0.38) | 2 × 10⁻¹⁰ | No | 51 | |
| rs11065987 | BRAP | 12 | A (0.42) | 7 × 10⁻¹² | No | 51 | |
| rs1169288 | HNF1A | 12 | A (0.33) | 1 × 10⁻¹⁴ | No | 51 | |
| rs2000999 | HPR | 16 | G (0.20) | 3 × 10⁻²⁴ | No | 51 | |
| rs4420638 | CILP2 | 19 | T (0.07) | 3 × 10−38 | No | 51 | |
| rs492602 | FLJ36070 | 19 | A (0.49) | 2 × 10⁻¹⁰ | No | 51 | |
| rs2277862 | ERGIC3 | 20 | C (0.15) | 4 × 10⁻¹⁰ | No | 51 | |
| rs2902940 | MAFB | 20 | A (0.29) | 6 × 10⁻¹¹ | No | 51 | |
| Triglycerides | |||||||
| rs2131925 | ANGPTL3 | 1 | T (0.32) | 9 × 10−43 | No | 51 | |
| rs1042034 | APOB | 2 | T (0.22) | 1 × 10−45 | Yes | 51 | |
| rs1260326 | GCKR | 2 | C (0.41) | 6 × 10−133 | No | 51 | |
| rs10195252 | COBLL1 | 2 | T (0.40) | 2 × 10⁻¹⁰ | No | 51 | |
| rs645040 | MSL2L1 | 3 | T (0.22) | 3 × 10⁻⁸ | No | 51 | |
| rs442177 | KLHL8 | 4 | T (0.41) | 9 × 10⁻¹² | No | 51 | |
| rs9686661 | MAP3K1 | 5 | C (0.20) | 1 × 10⁻¹⁰ | No | 51 | |
| rs2247056 | HLA | 6 | C (0.25) | 2 × 10⁻¹⁵ | No | 51 | |
| rs13238203 | TYW1B | 7 | C (0.04) | 1 × 10⁻⁹ | No | 51 | |
| rs17145738 | MLXIPL | 7 | C (0.12) | 6 × 10−58 | No | 51 | |
| rs11776767 | PINX1 | 8 | G (0.37) | 1 × 10⁻⁸ | No | 51 | |
| rs1495741 | NAT2 | 8 | A (0.22) | 5 × 10⁻¹⁴ | No | 51 | |
| rs12678919 | LPL | 8 | A (0.12) | 2 × 10−115 | Yes | 51 | |
| rs2954029 | TRIB1 | 8 | A (0.47) | 3 × 10−55 | Yes | 51 | |
| rs10761731 | JMJD1C | 10 | A (0.43) | 3 × 10⁻¹² | No | 51 | |
| rs2068888 | CYP26A1 | 10 | G (0.46) | 2 × 10⁻⁸ | No | 51 | |
| rs174546 | FADS1–2–3 | 11 | C (0.34) | 5 × 10⁻²⁴ | No | 51 | |
| rs964184 | APOA1 | 11 | C (0.13) | 7 × 10−240 | Yes | 51 | |
| rs11613352 | LRP1 | 12 | C (0.23) | 4 × 10⁻¹⁰ | No | 51 | |
| rs2412710 | CAPN3 | 15 | G (0.02) | 2 × 10⁻⁸ | No | 51 | |
| rs2929282 | FRMD5 | 15 | A (0.05) | 2 × 10⁻¹¹ | No | 51 | |
| rs11649653 | CTF1 | 16 | C (0.40) | 3 × 10⁻⁸ | No | 51 | |
| rs439401 | APOE | 19 | C (0.36) | 1 × 10⁻³⁰ | No | 51 | |
| rs5756931 | PLA2G6 | 22 | T (0.40) | 4 × 10⁻⁸ | No | 51 | |
| Low-density lipoprotein | |||||||
| rs2479409 | PCSK9 | 1 | A (0.23) | 2 × 10⁻²⁸ | No | 51 | |
| rs629301 | SORT1 | 1 | T (0.22) | 1 × 10−170 | Yes | 51 | |
| rs1367117 | APOB | 2 | G (0.30) | 4 × 10−114 | Yes | 51 | |
| rs499376 | ABCG5/8 | 2 | T (0.30) | 2 × 10−47 | Yes | 51 | |
| rs3757354 | MYLIP | 6 | C (0.22) | 1 × 10⁻¹¹ | No | 51 | |
| rs1800562 | HFE | 6 | G (0.06) | 6 × 10⁻¹⁰ | No | 51 | |
| rs1564348 | LPA | 6 | T (0.17) | 2 × 10⁻¹⁷ | Yes | 51 | |
| rs11136341 | PLEC1 | 8 | A (0.40) | 4 × 10⁻¹³ | No | 51 | |
| rs9411489 | ABO | 9 | C (0.20) | 6 × 10⁻¹³ | Yes | 51 | |
| rs11220462 | ST3GAL4 | 11 | G (0.14) | 1 × 10⁻¹⁵ | No | 51 | |
| rs8017377 | NYNRIN | 14 | G (0.47) | 5 × 10⁻¹¹ | No | 51 | |
| rs7206971 | OSBPL7 | 17 | G (0.49) | 2 × 10⁻⁸ | No | 51 | |
| rs6511720 | LDLR | 19 | G (0.11) | 4 × 10−117 | Yes | 51 | |
| rs4420638 | APOE | 19 | A (0.17) | 9 × 10−147 | No | 51 | |
| rs6029526 | TOP1 | 20 | T (0.47) | 4 × 10⁻¹⁹ | No | 51 | |
| High-density lipoprotein | |||||||
| rs4660293 | PABPC4 | 1 | A (0.23) | 4 × 10⁻¹⁰ | No | 51 | |
| rs1689800 | ZNF648 | 1 | A (0.35) | 3 × 10⁻¹⁰ | No | 51 | |
| rs4846914 | GALNT2 | 1 | A (0.40) | 4 × 10⁻²¹ | No | 51 | |
| rs2972146 | IRS1 | 2 | T (0.37) | 3 × 10⁻⁹ | No | 51 | |
| rs12328675 | COBLL1 | 2 | T (0.13) | 3 × 10⁻¹⁰ | No | 51 | |
| rs13107325 | SLC39A8 | 4 | C (0.07) | 7 × 10⁻¹¹ | No | 51 | |
| rs6450176 | ARL15 | 5 | G (0.26) | 5 × 10⁻⁸ | No | 51 | |
| rs2814944 | C6orf106 | 6 | G (0.16) | 4 × 10⁻⁹ | No | 51 | |
| rs605066 | CITED2 | 6 | T (0.42) | 3 × 10⁻⁸ | No | 51 | |
| rs1084651 | LPA | 6 | G (0.16) | 3 × 10⁻⁸ | Yes | 51 | |
| rs2293889 | TRPS1 | 8 | G (0.41) | 6 × 10⁻¹¹ | No | 51 | |
| rs4731702 | KLF14 | 7 | C (0.48) | 1 × 10⁻¹⁵ | No | 51 | |
| rs9987289 | PPP1R3B | 8 | G (0.09) | 6 × 10⁻²⁵ | No | 51 | |
| rs581080 | TTC39B | 9 | C (0.18) | 3 × 10⁻¹² | No | 51 | |
| rs1883025 | ABCA1 | 9 | C (0.25) | 2 × 10⁻³³ | No | 51 | |
| rs2923084 | AMPD3 | 11 | A (0.17) | 5 × 10⁻⁸ | No | 51 | |
| rs3136441 | LRP4 | 11 | T (0.15) | 3 × 10⁻¹⁸ | No | 51 | |
| rs7134594 | PDE3A | 12 | C (0.42) | 4 × 10⁻⁸ | No | 51 | |
| rs7134594 | MVK | 12 | T (0.47) | 7 × 10⁻¹⁵ | No | 51 | |
| rs4759375 | SBNO1 | 12 | C (0.06) | 7 × 10⁻⁹ | No | 51 | |
| rs4765127 | ZNF664 | 12 | G (0.34) | 3 × 10⁻¹⁰ | No | 51 | |
| rs838880 | SCARB1 | 12 | T (0.31) | 3 × 10⁻¹⁴ | No | 51 | |
| rs1532085 | LIPC | 15 | G (0.39) | 3 × 10−96 | No | 51 | |
| rs2652834 | LACTB | 15 | G (0.20) | 9 × 10⁻⁹ | No | 51 | |
| rs3764261 | CETP | 16 | C (0.32) | 7 × 10−380 | No | 51 | |
| rs16942887 | LCAT | 16 | G (0.12) | 8 × 10⁻³³ | No | 51 | |
| rs2925979 | CMIP | 16 | C (0.30) | 2 × 10⁻¹¹ | No | 51 | |
| rs11869286 | STARD3 | 17 | C (0.34) | 1 × 10⁻¹³ | No | 51 | |
| rs4148008 | ABCA8 | 17 | C (0.32) | 2 × 10⁻¹⁰ | No | 51 | |
| rs4129767 | PGS1 | 17 | A (0.49) | 8 × 10⁻⁹ | No | 51 | |
| rs7241918 | LIPG | 18 | T (0.17) | 3 × 10−49 | No | 51 | |
| rs12967135 | MC4R | 18 | G (0.23) | 7 × 10⁻⁹ | No | 51 | |
| rs7255436 | ANGPTL4 | 19 | A (0.47) | 3 × 10⁻⁸ | No | 51 | |
| rs737337 | LOC55908 | 19 | T (0.08) | 3 × 10⁻⁹ | No | 51 | |
| rs386000 | LILRA3 | 19 | G (0.20) | 4 × 10⁻¹⁹ | No | 51 | |
| rs1800961 | HNF4A | 20 | C (0.03) | 1 × 10⁻¹⁵ | No | 51 | |
| rs6065906 | PLTP | 20 | T (0.18) | 2 × 10⁻²² | No | 51 | |
| rs181362 | UBE2L3 | 22 | C (0.20) | 1 × 10⁻⁸ | No | 51 | |
| rsID | Loci | Chr | Risk allele (Risk allele frequency) |
P-value
|
Known effect On CAD | Reference | |
| SBP | DBP | ||||||
|
| |||||||
| Blood pressure | |||||||
| rs2932538 | MOV10 | 1 | G (0.75) | 1.2 × 10⁻⁹ | 9.9 × 10⁻¹⁰ | No | 48 |
| rs17367504 | MTHFR-NPPB | 1 | G (0.15) | 8.7 × 10⁻²² | 3.5 × 10⁻¹⁹ | No | 48 |
| rs13002573 | FIGN | 2 | G (0.20) | 3.25 × 10⁻⁷ | 4.02 × 10⁻² | No | 53 |
| rs1446468 | FIGN | 2 | T (0.53) | 1.82 × 10⁻¹² | 6.88 × 10⁻⁹ | No | 53 |
| rs319690 | MAP4 | 3 | T (0.51) | 4.74 × 10⁻⁸ | 1.84 × 10⁻⁸ | No | 53 |
| rs13082711 | SLC4A7 | 3 | T (0.78) | 1.5 × 10⁻⁶ | 3.8 × 10⁻⁹ | No | 48 |
| rs419076 | MECOM | 3 | T (0.47) | 1.80 × 10⁻¹³ | 2.1 × 10⁻¹² | No | 48 |
| rs3774372 | ULK4 | 3 | T (0.83) | 0.39 | 9.0 × 10⁻¹⁴ | No | 48 |
| rs871606 | CHIC2 | 4 | T (0.86) | 3.04 × 10⁻⁴ | 8.85 × 10⁻¹ | No | 53 |
| rs13107325 | SLC39A8 | 4 | T (0.05) | 3.3 × 10⁻¹⁴ | 2.3 × 10⁻¹⁷ | No | 48 |
| rs13139571 | GUCY1A3-GUCY1B3 | 4 | C (0.76) | 1.2 × 10⁻⁶ | 2.2 × 10⁻¹⁰ | Yes | 48 |
| rs1458038 | FGF5 | 4 | T (0.29) | 1.5 × 10⁻²³ | 8.5 × 10⁻²⁵ | No | 48 |
| rs1173771 | NPR3-C5orf23 | 5 | G (0.60) | 1.8 × 10⁻¹⁶ | 9.1 × 10⁻¹² | No | 48 |
| rs11953630 | EBF1 | 5 | T (0.37) | 3.0 × 10⁻¹¹ | 3.8 × 10⁻¹³ | No | 48 |
| rs1799945 | HFE | 6 | G (0.14) | 7.7 × 10⁻¹² | 1.5 × 10⁻¹⁵ | No | 48 |
| rs805303 | BAT2-BAT5 | 6 | G (0.61) | 1.5 × 10⁻¹¹ | 4.4 × 10⁻¹⁰ | No | 48 |
| rs17477177 | PIK3CG | 7 | T (0.72) | 5.67 × 10⁻¹¹ | 1.40 × 10⁻¹ | No | 53 |
| rs2071518 | NOV | 8 | T (0.17) | 2.08 × 10⁻² | 3.89 × 10⁻³ | No | 53 |
| rs2782980 | ADRB1 | 10 | T (0.20) | 7.66 × 10⁻⁷ | 9.60 × 10⁻⁸ | No | 53 |
| rs4373814 | CACNB2 | 10 | G (0.55) | 4.8 × 10⁻¹¹ | 4.4 × 10⁻¹⁰ | No | 48 |
| rs932764 | PLCE1 | 10 | G (0.44) | 7.1 × 10⁻¹⁶ | 8.1 × 10⁻⁷ | No | 48 |
| rs1813353 | CACNB2 | 10 | T (0.68) | 2.6 × 10⁻¹² | 2.3 × 10⁻¹⁵ | No | 48 |
| rs4590817 | C10orf107 | 10 | G (0.84) | 4.0 × 10⁻¹² | 1.3 × 10⁻¹² | No | 48 |
| rs11191548 | CYP17A1-NT5C2 | 10 | T (0.91) | 6.9 × 10⁻²⁶ | 9.4 × 10⁻¹³ | Yes | 48 |
| rs11222084 | ADAMTS8 | 11 | T (0.38) | 4.00 × 10⁻⁴ | 3.44 × 10⁻² | No | 53 |
| rs7129220 | ADM | 11 | G (0.89) | 3.0 × 10⁻¹² | 6.4 × 10⁻⁸ | No | 48 |
| rs633185 | FLJ32810-TMEM133 | 11 | G (0.28) | 1.2 × 10⁻¹⁷ | 2.0 × 10⁻¹⁵ | No | 48 |
| rs381815 | PLEKHA7 | 11 | T (0.26) | 5.3 × 10⁻¹¹ | 5.3 × 10⁻¹⁰ | No | 48 |
| rs17249754 | ATP2B1 | 12 | G (0.84) | 1.8 × 10⁻¹⁸ | 1.2 × 10⁻¹⁴ | No | 48 |
| rs3184504 | SH2B3 | 12 | T (0.47) | 3.8 × 10⁻¹⁸ | 3.6 × 10⁻²⁵ | Yes | 48 |
| rs10850411 | TBX5-TBX3 | 12 | T (0.70) | 5.4 × 10⁻⁸ | 5.4 × 10⁻¹⁰ | No | 48 |
| rs2521501 | FURIN-FES | 15 | T (0.31) | 5.2 × 10⁻¹⁹ | 1.9 × 10⁻¹⁵ | Yes | 48 |
| rs1378942 | CYP1A1-ULK3 | 15 | C (0.35) | 5.7 × 10⁻²³ | 2.7 × 10⁻²⁶ | No | 48 |
| rs17608766 | GOSR2 | 17 | T (0.86) | 1.1 × 10⁻¹⁰ | 0.017 | No | 48 |
| rs12940887 | ZNF652 | 17 | T (0.38) | 1.8 × 10⁻¹⁰ | 2.3 × 10⁻¹⁴ | No | 48 |
| rs1327235 | JAG1 | 20 | G (0.46) | 1.9 × 10⁻⁸ | 1.4 × 10⁻¹⁵ | No | 48 |
| rs6015450 | GNAS-EDN3 | 20 | G (0.12) | 3.9 × 10⁻²³ | 5.6 × 10⁻²³ | No | 48 |
Abbreviations: Chr, chromosome; CAD, coronary artery disease; SBP, systolic blood pressure; DBP, diastolic blood pressure.
Clinical utility of genetic knowledge
The identification of genetic variants associated with disease has allowed us to improve our understanding of its pathogenesis, and ultimately to reduce the burden of disease at both the individual and population levels. Information derived from genetic studies could potentially help to reduce the burden of disease in three main ways, ie, the identification of new pharmacologic targets, improvements in identification of high-risk individuals, and pharmacogenomics.
Identification of new pharmacologic targets
Genetic studies can shed light on new metabolic pathways associated with the development and progression of atherosclerosis, and provide clues for identifying new pharmacologic targets. The following two examples illustrate the promise as well as the potential difficulties of this field.
PCSK9
A clear example of the success of genetic studies in identifying molecules that may become new therapeutic targets is the PCSK9 gene. This gene was initially discovered by linkage studies to be associated with autosomal dominant hypercholesterolemia,27 for which new causal mutations were identified in 2003.54 The PCSK9 protein is crucial for metabolism of LDL cholesterol through its role in degradation of the LDL receptor, such that inhibition of this protein could become a viable treatment for hypercholesterolemia.55 Recent clinical trials in patients with primary hypercholesterolemia have shown that combination treatment with REGN727/SAR236553, a human monoclonal antibody to PCSK9, and either 10 mg or 80 mg of atorvastatin resulted in significantly greater reduction of LDL cholesterol than that obtained by 80 mg of atorvastatin alone.56
9p21 region
The genetic variants associated with CAD at the 9p21 locus, which has been the top hit in all CAD GWAS since 2007, lie in an intergenic region close to a cluster of cell-cycle regulating tumor suppressor genes (CDKN2A and CDKN2B) that overlap with a nonprotein coding RNA (CDKN2BAS or ANRIL). While various hypotheses have been proposed to explain the functional basis of this association, the mechanism remains unclear,39,57 and this has prevented the identification of a therapeutic target.
Improved identification of high-risk individuals
In the case of CAD, primary prevention strategies in healthy asymptomatic individuals are very important because the first clinical manifestation of the disease is often catastrophic (MI or sudden death). Two main prevention strategies can be defined: the population approach, based on public health policies that affect the whole population, such as smoking bans;58 and the approach that targets high-risk individuals, based on implementing intensive preventive treatment in individuals at high risk of having the disease, based on their cardiovascular risk factor profile.59 Two main screening strategies are usually undertaken to identify high-risk individuals, ie, opportunistic screening and high-risk screening. In opportunistic screening, evaluation of cardiovascular risk factors and estimation of CAD risk is carried out in all individuals who come into contact with the health care system for any reason. Risk functions are the most commonly used method for estimating individual risk of having a CAD event, usually for a 10-year period.59–61 Risk functions are mathematical equations that estimate the probability of developing CAD/cardiovascular disease using information about cardiovascular risk factors that are strongly and independently related to CAD and can be evaluated by simple procedures in the laboratory or doctor’s office.
Depending on their estimated risk, it is possible to categorize individuals into different risk categories (low, intermediate, high, and very high), and these categories are used to determine the intensity of preventive cardiovascular measures to be applied, which may range from lifestyle recommendations to prescription of drugs with various clinical objectives. Although risk functions can accurately predict the numbers of events that will occur in each risk category, many CAD events occur in individuals whose risk is too low to justify intensive treatment.62 For this reason, considerable effort has been invested in improving the classification of these intermediate-risk individuals into more appropriate risk categories.
Several biomarkers, including genetic variants, have been analyzed as candidates for improving the predictive capacity of risks functions.63 The main advantage of genetic variants is that they remain invariable throughout life, so it is possible to determine a person’s genetic risk profile before the development of an adverse cardiovascular risk factor profile, which would allow primary prevention measures to be undertaken earlier in life.2,63 Another advantage is the lower cost and higher replicability of genotyping compared with other cardiovascular risk factors. Among the limitations, the small effect sizes of known variants are most notable, despite the highly statistically significant associations between these variants and CAD risk.
Several studies have evaluated the effects on the predictive capacity of classical risk functions when genetic factors are taken into account. While most of the studies have found that these genetic variants (usually expressed as a single variable corresponding to the number of risk alleles carried, known as a genetic risk score) are associated with risk of future CAD events, they have not been found to improve the ability to discriminate between those individuals at particular risk who will develop the disease, although they do improve the reclassification of individuals into more appropriate risk categories, especially those at intermediate risk (Table 5).
Table 5.
Main characteristics and results of studies assessing improvement of predictive capacity of classical cardiovascular risk functions after inclusion of genetic information
| Author | Population | Clinical outcome | Genetic variants | Other covariates
|
Results
|
||||
|---|---|---|---|---|---|---|---|---|---|
| Risk factors | Family history | Association | Discrimination | NRI | Clinical NRI | ||||
| Case-control | |||||||||
| Davies et al105 | OHGS3,323Ca/2,319 Co WTCC: 1,926 Ca/2,938 Co |
CAD | One SNP(9p21) 12 SNPs (related and unrelated CVRF) |
Yes | No | NR | ΔAUC 0.003 ΔAUC 0.008‡ |
– | – |
| Anderson et al106 | Patients undergoing coronary angiography: 1,086 Ca/482 Co | CAD | 5 SNPs (related and unrelated CVRF) | Yes | Yes | OR 1.24‡ | ΔAUC 0.008 | 16.0%‡ | 28.3%‡ |
| Qi et al107 | Hispanic: 1,989 Ca/2,096 Co | Ml | 3 SNPs (related and unrelated CVFR) | Yes | No | OR 1.18‡ | ΔAUC 0.010‡ | – | – |
| Qi et al108 | Type II DM patients: 1,076 Ca/1,430 Co |
CAD | 5 SNPs (related and unrelated CVRF) | Yes | No | OR 1.19‡ | – | – | |
| Lv et al105 | Chinese Han population: 1,007 Ca/889 Co | CAD | 8 SNPs (related and unrelated CVRF) | Yes | No | OR 1.28‡ | ΔAUC 0.022‡ | – | – |
| Patel et al110 | US population: 1,338 Ca/1,649 Co (>70 years) | Ml <70 years | 11 SNPs | Yes | Yes | OR 1.12‡ | ΔAUC 0.012‡ | – | – |
| Case-cohort | |||||||||
| Hughes et al111 | Middle-aged men, European general population 632 Ca/1,361 subcohort |
CAD | 11 SNPs + two haplotypes 11 SNPs + 4 SNPs (unrelated CVRF) |
Yes Yes |
No No |
NR NR |
ΔAUC 0.009 ΔAUC 0.011‡ |
7.5%‡ 6.5%‡ |
6.3% 5.1% |
| Vaarhorst et al112 | European general population 742 Ca/2,22l subcohort | 12.1 years follow-up, CAD | 29 SNPs (unrelated CVRF) | Yes | No | HR 1.12‡ | 2.8%‡ | NR | |
| Cohort | |||||||||
| Morrison et al113 | ARIC, US general population 13,907 | 13 years follow-up, 1,452 CAD | 10 SNPs – White population 11 SNPs – Black population |
Yes | No | HR 1.10‡ HR 1.20‡ |
ΔAUC 0.002 ΔAUC 0.011‡ |
NR | NR |
| Kathiresan et al114 | Malmö, European general population, 4,232 | 10.6 years follow-up, 238 CVD | 9 SNPs, lipid-related | Yes | No | HR 1.15‡ | ΔAUC 0.003 | – | – |
| Talmud et al115 | NPHS-II, UK middle-aged men, 2,742 | 15 years follow-up, 270 CAD | 1 SNP(9p21) | Yes | Yes | AA versus AG 1.38‡ AA versus GG 1.57‡ |
ΔAUC 0.02 | 13.8%‡ | NR |
| Brautbar et al116 | ARIC, US general population (Whites), 9,998 | 14.6 years follow-up, 1,349 CAD | 1 SNP(9p21) | Yes | No | HR 1.20‡ | ΔAUC 0.004‡ | 0.8% | 6.2‡ |
| Paynter et al117 | WGHS, US middle-aged White women, 22,192 |
10.2 years follow-up, 1,349 CVD | 1 SNP(9p21) | Yes | Yes | AA versus AG 1.25‡ AA versus GG 1.32‡ |
ΔAUC 0.002 | Framingham, 2.7% Reynolds, 0.2% |
NR |
| Paynter et al118 | WGHS, US White women, 19,313 | 12.3 years follow-up, 777 CVD | 101 SNPs 12 SNPs (related and unrelated CVRF) |
Yes | Yes | HR 1.00 HR 1.04 |
ΔAUC 0.000 ΔAUC 0.001 |
0.5% 0.5% |
NR |
| Ripatti et al119 | General European population, 30,725 | 10.7 years follow-up, 1,264 CHD | 13 SNPs (related and unrelated CVRF) | Yes | Yes | HR 1.66(Q5 versus Q1)‡ | ΔAUC 0.001 | 2.2% | 9.7%‡ |
| Shiffman et al120 | CHS, US old population (>65 years), 4,284 | 12.6 years follow-up, Ml | 1 SNP(9p2l) 1 SNP(KIF6719 Arg) carriers |
Yes | No | HR 1.22 (White men)‡ HR 1.16 (White women)‡ HR NR (Black men)HR 1.42 (White men)‡ HR 1.05 (White women) |
ΔAUC 0.005 ΔAUC 0.002 ΔAUC 0.034 ΔAUC 0.015‡ ΔAUC −0.001 |
2.1% −1.8% 18.2%‡ 2.7% 0.7% |
|
| Thanassoulis et al121 | Framingham, US general population, 3,014 | 11 years follow-up, 182 hard CHD | 13 SNPs (related and unrelated CVRF) | Yes | Yes | HR 1.07‡ | ΔAUC 0.002 | 19.0%‡ | NR |
| Lluis-Ganella et al122 | General population, Framingham 3,537 + REGICOR 2,351 |
11.9 years follow-up, 536 CHD | 8 SNPs (unrelated CVRF) | Yes | Yes | HR 1.13‡ | ΔAUC No | 6.4% | 17.4%‡ |
| Gransbo et al123 | Malmö, 24,777 | 11.7 years follow-up, 2,668 CVD | 9p21 variant | Yes | No | HR 1.17‡ | ΔAUC 0.001 | 1.2%‡ | – |
| Isaacs et al124 | Erasmus Family study 2,269 + Rotterdam Study 8,130 | 9.5 years follow-up, 924 CHD | Lipid-related GRS | Yes | No | GRSTC HR 1.09‡ GRSLDL HR 1.08‡ GRSHDL HR 0.99 GRSTG HR 1.04 |
ΔAUC 0.000 | – | – |
| Ganna et al125 | 6 Swedish cohorts, 10,612 | 781 CHD | GRSglobal, 395 GRSCHD, 46 |
Yes | No | HR 1.54‡ HR 1.52‡ |
ΔAUC 0.002 ΔAUC 0.004‡ |
4.2%‡ 4.9%‡ |
– |
| Tikkanen et al126 | 4 Finnish cohorts, 24,124 | 12 years follow-up, 1,093 CHD | 28 SNPs (related and unrelated CVRF) | Yes | Yes | HR 1.27‡ | ΔAUC 0.003‡ | 5.0%‡ | 27.0%‡ |
Notes:
P-value<0.05.
Abbreviations: ARIC, Atherosclerosis Risk in Communities study; CAD, coronary artery disease; Ml, myocardial infarction; CVD, cardiovascular disease; OHGS, Ottawa Heart Genomics Study; WTCCC, Wellcome Trust Case Control Consortium; Ca, Cases; Co, Controls; DM, diabetes mellitus; NPHS-11: Northwick Park Heart Study 11; WGHS, Women Genome Health Study; CHS, Cardiac Health Study; REGICOR, Registre Gironi del Cor (Girona Heart Registry); OR, odds ratio; HR, hazard ratio; NR, not reported; AUC, area under the receiver operating curve; NRI, Net Reclassification Index; CVRF, cardiovascular risk factors; GRS, genetic risk score; SNP, single nucleotide polymorphism.
Pharmacogenomics
Pharmacogenomics is the study of the relationship between genetic variability and a patient’s response to drug treatment, ie, the efficacy of the drug and/or its adverse effects.64–68 Candidate gene and GWAS approaches have been used to identify genetic variants associated with variability in drug response, including several examples in the cardiovascular field,69,70 the majority of which have focused on statins, antiplatelet drugs, oral anticoagulants, or beta-blockers. The case of statins and the antiplatelet agent clopidogrel provide two interesting examples in this area.
Statins are widely prescribed to reduce plasma cholesterol levels and cardiovascular risk, and although the majority of patients show a 30%–50% reduction in LDL cholesterol, high interindividual variability is observed.71 Several genetic variants in the HMGCR, APOE, CETP, and CLMN genes have been reported to be associated with this interindividual variability, but the results have been discordant.69,70 Similarly, a variant in the KIF6 gene has been reported to modulate the effect of statins on clinical outcome,72,73 but recent studies have not corroborated this finding.74,75 Finally, more than one variant in the SLCO1B1 gene is consistently associated with the risk of simvastatin-induced myopathy, with an odds ratio >4.69,76
Our second example concerns the prodrug clopidogrel, which is converted into an active metabolite that selectively and irreversibly binds to the P2Y12 receptor on the platelet membrane. Conversion is achieved by the hepatic cytochrome P450 system in a two-step oxidative process, and cytochrome P450 2C19 is involved in both of these steps. The response to treatment with clopidogrel varies markedly between individuals, and the causes of a poor response are not clearly understood, but have been suggested to be related to clinical, cellular, or genetic factors.66,77,78 In March 2010, the US Food and Drug Administration added a “boxed warning” to the labeling of clopidogrel, including a reference to patients who do not effectively metabolize the drug and therefore may not receive the full benefits on the basis of their genetic characteristics.79 Recently, the American College of Cardiology Foundation and the American Heart Association have published a consensus document addressing this US Food and Drug Administration warning,80 stating that the role of genetic tests and the clinical implications and consequences of this testing remain to be determined. Moreover, three recent meta-analyses question the validity of this warning based on the fact that the reported associations are mainly driven by studies with small sample sizes;78,81,82 thus, they concluded that current evidence does not support the use of individualized clopidogrel regimens guided by the CYP2C19 genotype.
Conclusion
In the past 7 years, GWAS have contributed substantially to our understanding of the genetic architecture of complex diseases, including CAD. To date, approximately 40 unique loci have been found to be robustly associated with disease risk in large samples from several populations, a much higher number than those identified by linkage and candidate gene association studies. However, these variants explain only a small proportion of the heritability of CAD.40 Additional efforts to improve the analysis strategies, including new imputation and meta-analytic methods, analysis of gene-gene and gene-environment interactions, the integration of different omics, and use of sequencing technologies, are being performed.83–85
Although it is not yet clear if or how all of this information on the genetic architecture of CAD can be translated into clinical practice,86 we already have some exciting examples of its potential utility. To identify new therapeutic targets, we must first make the difficult transition from the statistical associations reported in GWAS to the functional mechanisms behind these associations. Research on the use of genetic information to improve cardiovascular risk estimation in individuals at intermediate risk can be carried out as a second step or in parallel, and further studies to develop new ways to include this information in risk functions, to evaluate its cost-effectiveness, and to explore the ethical issues are also warranted.87–89 Finally, although medicine is always a “personalized science and art”, use of genetic information to identify the most effective and least harmful drug for each patient is also a goal of so-called genetic personalized medicine.
Acknowledgments
This work was supported by the Spanish Ministry of Science and Innovation through the Carlos III Health Institute (Red de Inves-tigación Cardiovascular; Programa HERACLES RD12/0042), Health Research Fund (FIS-PI09/90506), and the Government of Catalunya through the Agency for Management of University and Research Grants (2009 SGR 1195). We acknowledge the contribution of ThePaperMill (http://www.thepapermill.cat) to the critical reading and English language review of this paper.
Footnotes
Disclosure
The authors report no other conficts of interest in this work.
References
- 1.Murray CJ, Vos T, Lozano R, et al. Disability-adjusted life years (DALYs) for 291 diseases and injuries in 21 regions, 1990–2010: a systematic analysis for the Global Burden of Disease Study 2010. Lancet. 2012;380:2197–2223. doi: 10.1016/S0140-6736(12)61689-4. [DOI] [PubMed] [Google Scholar]
- 2.Lluis-Ganella C. Genetic Factors Associated with Coronary Heart Disease and Analysis of their Predictive Capacity. Barcelona, Spain: Universitat Pompeu Fabra; 2012. [Google Scholar]
- 3.Mecchia D, Lavezzi AM, Mauri M, Matturri L. Feto-placental atherosclerotic lesions in intrauterine fetal demise: role of parental cigarette smoking. Open Cardiovasc Med J. 2009;3:51–56. doi: 10.2174/1874192400903010051. [DOI] [PMC free article] [PubMed] [Google Scholar]
- 4.Lusis AJ, Mar R, Pajukanta P. Genetics of atherosclerosis. Annu Rev Genomics Hum Genet. 2004;5:189–218. doi: 10.1146/annurev.genom.5.061903.175930. [DOI] [PubMed] [Google Scholar]
- 5.Glass CK, Witztum JL. Atherosclerosis. the road ahead. Cell. 2001;104:503–516. doi: 10.1016/s0092-8674(01)00238-0. [DOI] [PubMed] [Google Scholar]
- 6.Sanz J, Moreno P, Fuster V. The year in atherothrombosis. J Am Coll Cardiol. 2013;24(62):1131–1143. doi: 10.1016/j.jacc.2013.06.045. [DOI] [PubMed] [Google Scholar]
- 7.Tabas I, Glass CK. Anti-inflammatory therapy in chronic disease: challenges and opportunities. Science. 2013;339:166–172. doi: 10.1126/science.1230720. [DOI] [PMC free article] [PubMed] [Google Scholar]
- 8.Sakakura K, Nakano M, Otsuka F, Ladich E, Kolodgie FD, Virmani R. Pathophysiology of atherosclerosis plaque progression. Heart Lung Circ. 2013;22:399–411. doi: 10.1016/j.hlc.2013.03.001. [DOI] [PubMed] [Google Scholar]
- 9.Ghattas A, Griffiths HR, Devitt A, Lip GY, Shantsila E. Monocytes in coronary artery disease and atherosclerosis: where are we now? J Am Coll Cardiol. 2013;62:1541–1551. doi: 10.1016/j.jacc.2013.07.043. [DOI] [PubMed] [Google Scholar]
- 10.Libby P, Ridker PM, Hansson GK. Progress and challenges in translating the biology of atherosclerosis. Nature. 2011;473:317–325. doi: 10.1038/nature10146. [DOI] [PubMed] [Google Scholar]
- 11.Witztum JL, Lichtman AH. The infuence of innate and adaptive immune responses on atherosclerosis. Annu Rev Pathol. 2013 Aug 7; doi: 10.1146/annurev-pathol-020712-163936. [Epub ahead of print.] [DOI] [PMC free article] [PubMed] [Google Scholar]
- 12.Libby P. Inflammation in atherosclerosis. Arterioscler Thromb Vasc Biol. 2012;32:2045–2051. doi: 10.1161/ATVBAHA.108.179705. [DOI] [PMC free article] [PubMed] [Google Scholar]
- 13.Tabas I. Macrophage death and defective infammation resolution in atherosclerosis. Nat Rev Immunol. 2010;10:36–46. doi: 10.1038/nri2675. [DOI] [PMC free article] [PubMed] [Google Scholar]
- 14.Finn AV, Nakano M, Narula J, Kolodgie FD, Virmani R. Concept of vulnerable/unstable plaque. Arterioscler Thromb Vasc Biol. 2010;30:1282–1292. doi: 10.1161/ATVBAHA.108.179739. [DOI] [PubMed] [Google Scholar]
- 15.Doyle B, Caplice N. Plaque neovascularization and antiangiogenic therapy for atherosclerosis. J Am Coll Cardiol. 2007;49:2073–2080. doi: 10.1016/j.jacc.2007.01.089. [DOI] [PubMed] [Google Scholar]
- 16.Visscher PM, Hill WG, Wray NR. Heritability in the genomics era – concepts and misconceptions. Nat Rev Genet. 2008;9:255–266. doi: 10.1038/nrg2322. [DOI] [PubMed] [Google Scholar]
- 17.Elosua R, Lluis-Ganella C, Lucas G. Research into the genetic component of heart disease: from linkage studies to genome-wide genotyping. Rev Esp Cardiol Suppl. 2009;9(Suppl):24B–38B. [Google Scholar]
- 18.Peden JF, Farrall M. Thirty-fve common variants for coronary artery disease: the fruits of much collaborative labour. Hum Mol Genet. 2011;20:R198–R205. doi: 10.1093/hmg/ddr384. [DOI] [PMC free article] [PubMed] [Google Scholar]
- 19.Chial H. Mendelian genetics: patterns of inheritance and single-gene disorders. [Accessed November 4, 2013];Nature Education. 2008 1(1) Available from: http://www.nature.com/scitable/topicpage/mendelian-genetics-patterns-of-inheritance-and-single-966. [Google Scholar]
- 20.Lobo I. Multifactorial inheritance and genetic disease. [Accessed November 4, 2013];Nature Education. 2008 1(1) Available from: http://www.nature.com/scitable/topicpage/multifactorial-inheritance-and-genetic-disease-919. [Google Scholar]
- 21.Deloukas P, Kanoni S, Willenborg C, et al. Large-scale association analysis identifies new risk loci for coronary artery disease. Nat Genet. 2013;45:25–33. doi: 10.1038/ng.2480. [DOI] [PMC free article] [PubMed] [Google Scholar]
- 22.Dawn TM, Barrett JH. Genetic linkage studies. Lancet. 2005;366:1036–1044. doi: 10.1016/S0140-6736(05)67382-5. [DOI] [PubMed] [Google Scholar]
- 23.Kathiresan S, Srivastava D. Genetics of human cardiovascular disease. Cell. 2012;148:1242–1257. doi: 10.1016/j.cell.2012.03.001. [DOI] [PMC free article] [PubMed] [Google Scholar]
- 24.Wang JG, Staessen JA, Franklin SS, Fagard R, Gueyffier F. Systolic and diastolic blood pressure lowering as determinants of cardiovascular outcome. Hypertension. 2005;45:907–913. doi: 10.1161/01.HYP.0000165020.14745.79. [DOI] [PubMed] [Google Scholar]
- 25.Helgadottir A, Manolescu A, Thorleifsson G, et al. The gene encoding 5-lipoxygenase activating protein confers risk of myocardial infarction and stroke. Nat Genet. 2004;36:233–239. doi: 10.1038/ng1311. [DOI] [PubMed] [Google Scholar]
- 26.Wang L, Fan C, Topol SE, Topol EJ, Wang Q. Mutation of MEF2A in an inherited disorder with features of coronary artery disease. Science. 2003;302:1578–1581. doi: 10.1126/science.1088477. [DOI] [PMC free article] [PubMed] [Google Scholar]
- 27.Varret M, Rabes JP, Saint-Jore B, et al. A third major locus for autosomal dominant hypercholesterolemia maps to 1p34.1-p32. Am J Hum Genet. 1999;64:1378–1387. doi: 10.1086/302370. [DOI] [PMC free article] [PubMed] [Google Scholar]
- 28.Risch N, Merikangas K. The future of genetic studies of complex human diseases. Science. 1996;273:1516–1517. doi: 10.1126/science.273.5281.1516. [DOI] [PubMed] [Google Scholar]
- 29.Zhu M, Zhao S. Candidate gene identification approach: progress and challenges. Int J Biol Sci. 2007;3:420–427. doi: 10.7150/ijbs.3.420. [DOI] [PMC free article] [PubMed] [Google Scholar]
- 30.Tabor HK, Risch NJ, Myers RM. Candidate-gene approaches for studying complex genetic traits: practical considerations. Nat Rev Genet. 2002;3:391–397. doi: 10.1038/nrg796. [DOI] [PubMed] [Google Scholar]
- 31.Attia J, Ioannidis JP, Thakkinstian A, et al. How to use an article about genetic association. C: What are the results and will they help me in caring for my patients? JAMA. 2009;301:304–308. doi: 10.1001/jama.2008.993. [DOI] [PubMed] [Google Scholar]
- 32.Lohmueller KE, Pearce CL, Pike M, Lander ES, Hirschhorn JN. Meta-analysis of genetic association studies supports a contribution of common variants to susceptibility to common disease. Nat Genet. 2003;33:177–182. doi: 10.1038/ng1071. [DOI] [PubMed] [Google Scholar]
- 33.Visscher PM, Brown MA, McCarthy MI, Yang J. Five years of GWAS discovery. Am J Hum Genet. 2012;90:7–24. doi: 10.1016/j.ajhg.2011.11.029. [DOI] [PMC free article] [PubMed] [Google Scholar]
- 34.The International HapMap Consortium A haplotype map of the human genome. Nature. 2005;437:1299–1320. doi: 10.1038/nature04226. [DOI] [PMC free article] [PubMed] [Google Scholar]
- 35.US Department of Energy Human Genome Project. [Accessed November 4, 2013]. Available from: http://www.ornl.gov/hgmis.
- 36.Arking DE, Chakravarti A. Understanding cardiovascular disease through the lens of genome-wide association studies. Trends Genet. 2009;25:387–394. doi: 10.1016/j.tig.2009.07.007. [DOI] [PubMed] [Google Scholar]
- 37.Purcell S, Neale B, Todd-Brown K, et al. PLINK: a tool set for whole-genome association and population-based linkage analyses. Am J Hum Genet. 2007;81:559–575. doi: 10.1086/519795. [DOI] [PMC free article] [PubMed] [Google Scholar]
- 38.Aulchenko YS, Ripke S, Isaacs A, van Duijn CM. GenABEL: an Rlibrary for genome-wide association analysis. Bioinformatics. 2007;23:1294–1296. doi: 10.1093/bioinformatics/btm108. [DOI] [PubMed] [Google Scholar]
- 39.Roberts R, Stewart AF. Genes and coronary artery disease: where are we? J Am Coll Cardiol. 2012;60:1715–1721. doi: 10.1016/j.jacc.2011.12.062. [DOI] [PubMed] [Google Scholar]
- 40.Manolio TA, Collins FS, Cox NJ, et al. Finding the missing heritability of complex diseases. Nature. 2009;461:747–753. doi: 10.1038/nature08494. [DOI] [PMC free article] [PubMed] [Google Scholar]
- 41.Hindorff LA, Junkins HA, Mehta JP, Manolio TA. A catalog of published genome-wide association studies. [Accessed November 4, 2013]. Available from: http://www.genome.gov/gwastudies.
- 42.Marian AJ. Challenges in medical applications of whole exome/genome sequencing discoveries. Trends Cardiovasc Med. 2012;22:219–223. doi: 10.1016/j.tcm.2012.08.001. [DOI] [PMC free article] [PubMed] [Google Scholar]
- 43.Almasy L. The role of phenotype in gene discovery in the whole genome sequencing era. Hum Genet. 2012;131:1533–1540. doi: 10.1007/s00439-012-1191-1. [DOI] [PMC free article] [PubMed] [Google Scholar]
- 44.Helgadottir A, Thorleifsson G, Manolescu A, et al. A common variant on chromosome 9p21 affects the risk of myocardial infarction. Science. 2007;316:1491–1493. doi: 10.1126/science.1142842. [DOI] [PubMed] [Google Scholar]
- 45.McPherson R, Pertsemlidis A, Kavaslar N, et al. A common allele on chromosome 9 associated with coronary heart disease. Science. 2007;316:1488–1491. doi: 10.1126/science.1142447. [DOI] [PMC free article] [PubMed] [Google Scholar]
- 46.Wellcome Trust Case Control Consortium Genome-wide association study of 14,000 cases of seven common diseases and 3,000 shared controls. Nature. 2007;447:661–678. doi: 10.1038/nature05911. [DOI] [PMC free article] [PubMed] [Google Scholar]
- 47.Dupuis J, Langenberg C, Prokopenko I, et al. New genetic loci implicated in fasting glucose homeostasis and their impact on type 2 diabetes risk. Nat Genet. 2010;42:105–116. doi: 10.1038/ng.520. [DOI] [PMC free article] [PubMed] [Google Scholar]
- 48.Ehret GB, Munroe PB, Rice KM, et al. Genetic variants in novel pathways infuence blood pressure and cardiovascular disease risk. Nature. 2011;478:103–109. doi: 10.1038/nature10405. [DOI] [PMC free article] [PubMed] [Google Scholar]
- 49.Heid IM, Jackson AU, Randall JC, et al. Meta-analysis identifies 13 new loci associated with waist-hip ratio and reveals sexual dimorphism in the genetic basis of fat distribution. Nat Genet. 2010;42:949–960. doi: 10.1038/ng.685. [DOI] [PMC free article] [PubMed] [Google Scholar]
- 50.Speliotes EK, Willer CJ, Berndt SI, et al. Association analyses of 249,796 individuals reveal 18 new loci associated with body mass index. Nat Genet. 2010;42:937–948. doi: 10.1038/ng.686. [DOI] [PMC free article] [PubMed] [Google Scholar]
- 51.Teslovich TM, Musunuru K, Smith AV, et al. Biological, clinical and population relevance of 95 loci for blood lipids. Nature. 2010;466:707–713. doi: 10.1038/nature09270. [DOI] [PMC free article] [PubMed] [Google Scholar]
- 52.Voight BF, Scott LJ, Steinthorsdottir V, et al. Twelve type 2 diabetes susceptibility loci identified through large-scale association analysis. Nat Genet. 2010;42:579–589. doi: 10.1038/ng.609. [DOI] [PMC free article] [PubMed] [Google Scholar]
- 53.Wain LV, Verwoert GC, O’Reilly PF, et al. Genome-wide association study identifies six new loci influencing pulse pressure and mean arterial pressure. Nat Genet. 2011;43:1005–1011. doi: 10.1038/ng.922. [DOI] [PMC free article] [PubMed] [Google Scholar]
- 54.Abifadel M, Varret M, Rabes JP, et al. Mutations in PCSK9 cause autosomal dominant hypercholesterolemia. Nat Genet. 2003;34:154–156. doi: 10.1038/ng1161. [DOI] [PubMed] [Google Scholar]
- 55.Lambert G, Sjouke B, Choque B, Kastelein JJ, Hovingh GK. The PCSK9 decade. J Lipid Res. 2012;53:2515–2524. doi: 10.1194/jlr.R026658. [DOI] [PMC free article] [PubMed] [Google Scholar]
- 56.Roth EM, McKenney JM, Hanotin C, Asset G, Stein EA. Atorvastatin with or without an antibody to PCSK9 in primary hypercholesterolemia. N Engl J Med. 2012;367:1891–1900. doi: 10.1056/NEJMoa1201832. [DOI] [PubMed] [Google Scholar]
- 57.McPherson R. Chromosome 9p21.3 locus for coronary artery disease: how little we know. J Am Coll Cardiol. 2013;62(15):1382–1383. doi: 10.1016/j.jacc.2013.07.032. [DOI] [PubMed] [Google Scholar]
- 58.Aguero F, Degano IR, Subirana I, et al. Impact of a partial smoke-free legislation on myocardial infarction incidence, mortality and case-fatality in a population-based registry: the REGICOR study. PLoS One. 2013;8:e53722. doi: 10.1371/journal.pone.0053722. [DOI] [PMC free article] [PubMed] [Google Scholar]
- 59.Perk J, De Backer G, Gohlke H, et al. European guidelines on cardiovascular disease prevention in clinical practice (version 2012) Rev Esp Cardiol. 2012;65:66–241. doi: 10.1016/j.rec.2012.10.006. [DOI] [PubMed] [Google Scholar]
- 60.Expert Panel on Detection, Evaluation, and Treatment of High Blood Cholesterol in Adults Executive Summary of The Third Report of The National Cholesterol Education Program (NCEP) Expert Panel on Detection, Evaluation, And Treatment of High Blood Cholesterol In Adults (Adult Treatment Panel III) JAMA. 2001;285:2486–2497. doi: 10.1001/jama.285.19.2486. [DOI] [PubMed] [Google Scholar]
- 61.Wilson PW, D’Agostino RB, Levy D, Belanger AM, Silbershatz H, Kannel WB. Prediction of coronary heart disease using risk factor categories. Circulation. 1998;97:1837–1847. doi: 10.1161/01.cir.97.18.1837. [DOI] [PubMed] [Google Scholar]
- 62.Marrugat J, Vila J, Baena-Diez JM, et al. Relative validity of the 10-year cardiovascular risk estimate in a population cohort of the REGICOR study. Rev Esp Cardiol. 2011;64:385–394. doi: 10.1016/j.recesp.2010.12.011. [DOI] [PubMed] [Google Scholar]
- 63.Wang TJ. Assessing the role of circulating, genetic, and imaging biomarkers in cardiovascular risk prediction. Circulation. 2011;123:551–565. doi: 10.1161/CIRCULATIONAHA.109.912568. [DOI] [PMC free article] [PubMed] [Google Scholar]
- 64.Candore G, Balistreri CR, Caruso M, et al. Pharmacogenomics: a tool to prevent and cure coronary heart disease. Curr Pharm Des. 2007;13:3726–3734. doi: 10.2174/138161207783018617. [DOI] [PubMed] [Google Scholar]
- 65.Evans WE, McLeod HL. Pharmacogenomics – drug disposition, drug targets, and side effects. N Engl J Med. 2003;348:538–549. doi: 10.1056/NEJMra020526. [DOI] [PubMed] [Google Scholar]
- 66.Marin F, Gonzalez-Conejero R, Capranzano P, Bass TA, Roldan V, Angiolillo DJ. Pharmacogenetics in cardiovascular antithrombotic therapy. J Am Coll Cardiol. 2009;54:1041–1057. doi: 10.1016/j.jacc.2009.04.084. [DOI] [PubMed] [Google Scholar]
- 67.Motulsky AG. Drug reactions enzymes, and biochemical genetics. J Am Med Assoc. 1957;165:835–837. doi: 10.1001/jama.1957.72980250010016. [DOI] [PubMed] [Google Scholar]
- 68.Roses AD. Pharmacogenetics and future drug development and delivery. Lancet. 2000;355:1358–1361. doi: 10.1016/S0140-6736(00)02126-7. [DOI] [PubMed] [Google Scholar]
- 69.Voora D, Ginsburg GS. Clinical application of cardiovascular pharmacogenetics. J Am Coll Cardiol. 2012;60:9–20. doi: 10.1016/j.jacc.2012.01.067. [DOI] [PubMed] [Google Scholar]
- 70.Verschuren JJ, Trompet S, Wessels JA, et al. A systematic review on pharmacogenetics in cardiovascular disease: is it ready for clinical application? Eur Heart J. 2012;33:165–175. doi: 10.1093/eurheartj/ehr239. [DOI] [PubMed] [Google Scholar]
- 71.Simon JA, Lin F, Hulley SB, et al. Phenotypic predictors of response to simvastatin therapy among African-Americans and Caucasians: the Cholesterol and Pharmacogenetics (CAP) Study. Am J Cardiol. 2006;97:843–850. doi: 10.1016/j.amjcard.2005.09.134. [DOI] [PubMed] [Google Scholar]
- 72.Iakoubova OA, Sabatine MS, Rowland CM, et al. Polymorphism in KIF6 gene and benefit from statins after acute coronary syndromes: results from the PROVE IT-TIMI 22 study. J Am Coll Cardiol. 2008;51:449–455. doi: 10.1016/j.jacc.2007.10.017. [DOI] [PubMed] [Google Scholar]
- 73.Iakoubova OA, Tong CH, Rowland CM, et al. Association of the Trp719Arg polymorphism in kinesin-like protein 6 with myocardial infarction and coronary heart disease in 2 prospective trials: the CARE and WOSCOPS trials. J Am Coll Cardiol. 2008;51:435–443. doi: 10.1016/j.jacc.2007.05.057. [DOI] [PubMed] [Google Scholar]
- 74.Hopewell JC, Parish S, Clarke R, et al. No impact of KIF6 genotype on vascular risk and statin response among 18,348 randomized patients in the heart protection study. J Am Coll Cardiol. 2011;57:2000–2007. doi: 10.1016/j.jacc.2011.02.015. [DOI] [PubMed] [Google Scholar]
- 75.Ridker PM, MacFadyen JG, Glynn RJ, Chasman DI. Kinesin-like protein 6 (KIF6) polymorphism and the efficacy of rosuvastatin in primary prevention. Circ Cardiovasc Genet. 2011;4:312–317. doi: 10.1161/CIRCGENETICS.110.959353. [DOI] [PubMed] [Google Scholar]
- 76.Link E, Parish S, Armitage J, et al. SLCO1B1 variants and statin-induced myopathy – a genomewide study. N Engl J Med. 2008;359:789–799. doi: 10.1056/NEJMoa0801936. [DOI] [PubMed] [Google Scholar]
- 77.Johnson JA, Cavallari LH, Beitelshees AL, Lewis JP, Shuldiner AR, Roden DM. Pharmacogenomics: application to the management of cardiovascular disease. Clin Pharmacol Ther. 2011;90:519–531. doi: 10.1038/clpt.2011.179. [DOI] [PMC free article] [PubMed] [Google Scholar]
- 78.Zabalza M, Subirana I, Sala J, et al. Meta-analyses of the association between cytochrome CYP2C19 loss- and gain-of-function polymorphisms and cardiovascular outcomes in patients with coronary artery disease treated with clopidogrel. Heart. 2012;98:100–108. doi: 10.1136/hrt.2011.227652. [DOI] [PubMed] [Google Scholar]
- 79.US Department of Health and Human Services Information on clopidogrel bisulfate. 27-10-2007. [Accessed November 4, 2013]. Available from: http://www.fda.gov/Drugs/DrugSafety/PostmarketDrugSafetyInformationforPatientsandProviders/ucm190836.htm.
- 80.Holmes DR, Jr, Dehmer GJ, Kaul S, Leifer D, O’Gara PT, Stein CM. ACCF/AHA Clopidogrel clinical alert: approaches to the FDA “boxed warning”: a report of the American College of Cardiology Foundation Task Force on Clinical Expert Consensus Documents and the American Heart Association. Circulation. 2010;122:537–557. doi: 10.1161/CIR.0b013e3181ee08ed. [DOI] [PubMed] [Google Scholar]
- 81.Bauer T, Bouman HJ, van Werkum JW, Ford NF, ten Berg JM, Taubert D. Impact of CYP2C19 variant genotypes on clinical efficacy of antiplatelet treatment with clopidogrel: systematic review and meta-analysis. BMJ. 2011;343:d4588. doi: 10.1136/bmj.d4588. [DOI] [PMC free article] [PubMed] [Google Scholar]
- 82.Holmes MV, Perel P, Shah T, Hingorani AD, Casas JP. CYP2C19 genotype, clopidogrel metabolism, platelet function, and cardiovascular events: a systematic review and meta-analysis. JAMA. 2011;306:2704–2714. doi: 10.1001/jama.2011.1880. [DOI] [PubMed] [Google Scholar]
- 83.Maouche S, Schunkert H. Strategies beyond genome-wide association studies for atherosclerosis. Arterioscler Thromb Vasc Biol. 2012;32:170–181. doi: 10.1161/ATVBAHA.111.232652. [DOI] [PubMed] [Google Scholar]
- 84.Evangelou E, Ioannidis JP. Meta-analysis methods for genome-wide association studies and beyond. Nat Rev Genet. 2013;14:379–389. doi: 10.1038/nrg3472. [DOI] [PubMed] [Google Scholar]
- 85.Prins BP, Lagou V, Asselbergs FW, Snieder H, Fu J. Genetics of coronary artery disease: genome-wide association studies and beyond. Atherosclerosis. 2012;225:1–10. doi: 10.1016/j.atherosclerosis.2012.05.015. [DOI] [PubMed] [Google Scholar]
- 86.Manolio TA. Bringing genome-wide association findings into clinical use. Nat Rev Genet. 2013;14:549–558. doi: 10.1038/nrg3523. [DOI] [PubMed] [Google Scholar]
- 87.Chatterjee N, Wheeler B, Sampson J, Hartge P, Chanock SJ, Park JH. Projecting the performance of risk prediction based on polygenic analyses of genome-wide association studies. Nat Genet. 2013;45:400–403. doi: 10.1038/ng.2579. [DOI] [PMC free article] [PubMed] [Google Scholar]
- 88.Hudson KL, Holohan MK, Collins FS. Keeping pace with the times – the Genetic Information Nondiscrimination Act of 2008. N Engl J Med. 2008;358:2661–2663. doi: 10.1056/NEJMp0803964. [DOI] [PubMed] [Google Scholar]
- 89.Nora JJ, Lortscher RH, Spangler RD, Nora AH, Kimberling WJ. Genetic-epidemiologic study of early-onset ischemic heart disease. Circulation. 1980;61:503–508. doi: 10.1161/01.cir.61.3.503. [DOI] [PubMed] [Google Scholar]
- 90.Zdravkovic S, Wienke A, Pedersen NL, Marenberg ME, Yashin AI, de Faire U. Heritability of death from coronary heart disease: a 36-year follow-up of 20 966 Swedish twins. J Intern Med. 2002;252:247–254. doi: 10.1046/j.1365-2796.2002.01029.x. [DOI] [PubMed] [Google Scholar]
- 91.Wienke A, Holm NV, Skytthe A, Yashin AI. The heritability of mortality due to heart diseases: a correlated frailty model applied to Danish twins. Twin Res. 2001;4:266–274. doi: 10.1375/1369052012399. [DOI] [PubMed] [Google Scholar]
- 92.Peyser PA, Bielak LF, Chu JS, et al. Heritability of coronary artery calcium quantity measured by electron beam computed tomography in asymptomatic adults. Circulation. 2002;106:304–308. doi: 10.1161/01.cir.0000022664.21832.5d. [DOI] [PubMed] [Google Scholar]
- 93.Xiang AH, Azen SP, Buchanan TA, et al. Heritability of subclinical atherosclerosis in Latino families ascertained through a hypertensive parent. Arterioscler Thromb Vasc Biol. 2002;22:843–848. doi: 10.1161/01.atv.0000015329.15481.e8. [DOI] [PubMed] [Google Scholar]
- 94.Fox CS, Polak JF, Chazaro I, et al. Genetic and environmental contributions to atherosclerosis phenotypes in men and women: heritability of carotid intima-media thickness in the Framingham Heart Study. Stroke. 2003;34:397–401. doi: 10.1161/01.str.0000048214.56981.6f. [DOI] [PubMed] [Google Scholar]
- 95.Swan L, Birnie DH, Inglis G, Connell JM, Hillis WS. The determination of carotid intima medial thickness in adults – a population-based twin study. Atherosclerosis. 2003;166:137–141. doi: 10.1016/s0021-9150(02)00317-9. [DOI] [PubMed] [Google Scholar]
- 96.North KE, MacCluer JW, Devereux RB, et al. Heritability of carotid artery structure and function: the Strong Heart Family Study. Arterioscler Thromb Vasc Biol. 2002;22:1698–1703. doi: 10.1161/01.atv.0000032656.91352.5e. [DOI] [PubMed] [Google Scholar]
- 97.Hunt KJ, Duggirala R, Goring HH, et al. Genetic basis of variation in carotid artery plaque in the San Antonio Family Heart Study. Stroke. 2002;33:2775–2780. doi: 10.1161/01.str.0000043827.03966.ef. [DOI] [PubMed] [Google Scholar]
- 98.Hennekens CH, Buring JE. Epidemiology in Medicine. Boston, MA: Little, Brown and Company; 1987. [Google Scholar]
- 99.Hirschhorn JN, Lohmueller K, Byrne E, Hirschhorn K. A comprehensive review of genetic association studies. Genet Med. 2002;4:45–61. doi: 10.1097/00125817-200203000-00002. [DOI] [PubMed] [Google Scholar]
- 100.Hulley S, Cummings SR, Browner WS. Designing Clinical Research: An Epidemiologic Approach. Baltimore, MD: Lippincott, Williams and Wilkins; 2001. [Google Scholar]
- 101.Khoury MJ, Beaty T, Cohen B. Fundamentals of Genetic Epidemiology. New York, NY: Oxford University Press; 1993. [Google Scholar]
- 102.Ioannidis JP. Why most discovered true associations are infated. Epidemiology. 2008;19:640–648. doi: 10.1097/EDE.0b013e31818131e7. [DOI] [PubMed] [Google Scholar]
- 103.Ioannidis JP. Why most published research findings are false. PLoS Med. 2005;2:e124. doi: 10.1371/journal.pmed.0020124. [DOI] [PMC free article] [PubMed] [Google Scholar]
- 104.Pearson TA, Manolio TA. How to interpret a genome-wide association study. JAMA. 2008;299:1335–1344. doi: 10.1001/jama.299.11.1335. [DOI] [PubMed] [Google Scholar]
- 105.Davies RW, Dandona S, Stewart AF, et al. Improved prediction of cardiovascular disease based on a panel of single nucleotide polymorphisms identified through genome-wide association studies. Circ Cardiovasc Genet. 2010;3:468–474. doi: 10.1161/CIRCGENETICS.110.946269. [DOI] [PMC free article] [PubMed] [Google Scholar]
- 106.Anderson JL, Horne BD, Camp NJ, et al. Joint effects of common genetic variants from multiple genes and pathways on the risk of premature coronary artery disease. Am Heart J. 2010;160:250–256. doi: 10.1016/j.ahj.2010.05.031. [DOI] [PMC free article] [PubMed] [Google Scholar]
- 107.Qi L, Ma J, Qi Q, Hartiala J, Allayee H, Campos H. Genetic risk score and risk of myocardial infarction in Hispanics. Circulation. 2011;123:374–380. doi: 10.1161/CIRCULATIONAHA.110.976613. [DOI] [PMC free article] [PubMed] [Google Scholar]
- 108.Qi L, Parast L, Cai T, et al. Genetic susceptibility to coronary heart disease in type 2 diabetes: 3 independent studies. J Am Coll Cardiol. 2011;58:2675–2682. doi: 10.1016/j.jacc.2011.08.054. [DOI] [PMC free article] [PubMed] [Google Scholar]
- 109.Lv X, Zhang Y, Rao S, et al. Joint effects of genetic variants in multiple loci on the risk of coronary artery disease in Chinese Han subjects. Circ J. 2012;76:1987–1992. doi: 10.1253/circj.cj-12-0156. [DOI] [PubMed] [Google Scholar]
- 110.Patel RS, Sun YV, Hartiala J, et al. Association of a genetic risk score with prevalent and incident myocardial infarction in subjects undergoing coronary angiography. Circ Cardiovasc Genet. 2012;5:441–449. doi: 10.1161/CIRCGENETICS.111.960229. [DOI] [PMC free article] [PubMed] [Google Scholar]
- 111.Hughes MF, Saarela O, Stritzke J, et al. Genetic markers enhance coronary risk prediction in men: the MORGAM prospective cohorts. PLoS One. 2012;7:e40922. doi: 10.1371/journal.pone.0040922. [DOI] [PMC free article] [PubMed] [Google Scholar]
- 112.Vaarhorst AA, Lu Y, Heijmans BT, et al. Literature-based genetic risk scores for coronary heart disease: the Cardiovascular Registry Maastricht (CAREMA) prospective cohort study. Circ Cardiovasc Genet. 2012;5:202–209. doi: 10.1161/CIRCGENETICS.111.960708. [DOI] [PubMed] [Google Scholar]
- 113.Morrison AC, Bare LA, Chambless LE, et al. Prediction of coronary heart disease risk using a genetic risk score: the Atherosclerosis Risk in Communities study. Am J Epidemiol. 2007;166:28–35. doi: 10.1093/aje/kwm060. [DOI] [PubMed] [Google Scholar]
- 114.Kathiresan S, Melander O, Anevski D, et al. Polymorphisms associated with cholesterol and risk of cardiovascular events. N Engl J Med. 2008;358:1240–1249. doi: 10.1056/NEJMoa0706728. [DOI] [PubMed] [Google Scholar]
- 115.Talmud PJ, Cooper JA, Palmen J, et al. Chromosome 9p21.3 coronary heart disease locus genotype and prospective risk of CHD in healthy middle-aged men. Clin Chem. 2008;54:467–474. doi: 10.1373/clinchem.2007.095489. [DOI] [PubMed] [Google Scholar]
- 116.Brautbar A, Ballantyne CM, Lawson K, et al. Impact of adding a single allele in the 9p21 locus to traditional risk factors on reclassification of coronary heart disease risk and implications for lipid-modifying therapy in the Atherosclerosis Risk in Communities study. Circ Cardiovasc Genet. 2009;2:279–285. doi: 10.1161/CIRCGENETICS.108.817338. [DOI] [PMC free article] [PubMed] [Google Scholar]
- 117.Paynter NP, Chasman DI, Buring JE, Shiffman D, Cook NR, Ridker PM. Cardiovascular disease risk prediction with and without knowledge of genetic variation at chromosome 9p21.3. Ann Intern Med. 2009;150:65–72. doi: 10.7326/0003-4819-150-2-200901200-00003. [DOI] [PMC free article] [PubMed] [Google Scholar]
- 118.Paynter NP, Chasman DI, Pare G, et al. Association between a literature-based genetic risk score and cardiovascular events in women. JAMA. 2010;303:631–637. doi: 10.1001/jama.2010.119. [DOI] [PMC free article] [PubMed] [Google Scholar]
- 119.Ripatti S, Tikkanen E, Orho-Melander M, et al. A multilocus genetic risk score for coronary heart disease: case-control and prospective cohort analyses. Lancet. 2010;376:1393–1400. doi: 10.1016/S0140-6736(10)61267-6. [DOI] [PMC free article] [PubMed] [Google Scholar]
- 120.Shiffman D, O’Meara ES, Rowland CM, et al. The contribution of a 9p21.3 variant, a KIF6 variant, and C-reactive protein to predicting risk of myocardial infarction in a prospective study. BMC Cardiovasc Disord. 2011;11:10. doi: 10.1186/1471-2261-11-10. [DOI] [PMC free article] [PubMed] [Google Scholar]
- 121.Thanassoulis G, Peloso GM, Pencina MJ, et al. A genetic risk score is associated with incident cardiovascular disease and coronary artery calcium – the Framingham Heart Study. Circ Cardiovasc Genet. 2012;5:113–121. doi: 10.1161/CIRCGENETICS.111.961342. [DOI] [PMC free article] [PubMed] [Google Scholar]
- 122.Lluis-Ganella C, Subirana I, Lucas G, et al. Assessment of the value of a genetic risk score in improving the estimation of coronary risk. Atherosclerosis. 2012;222:456–463. doi: 10.1016/j.atherosclerosis.2012.03.024. [DOI] [PMC free article] [PubMed] [Google Scholar]
- 123.Gransbo K, Almgren P, Sjogren M, et al. Chromosome 9p21 genetic variation explains 13% of cardiovascular disease incidence but does not improve risk prediction. J Intern Med. 2013;274:233–240. doi: 10.1111/joim.12063. [DOI] [PubMed] [Google Scholar]
- 124.Isaacs A, Willems SM, Bos D, et al. Risk scores of common genetic variants for lipid levels infuence atherosclerosis and incident coronary heart disease. Arterioscler Thromb Vasc Biol. 2013;33:2233–2239. doi: 10.1161/ATVBAHA.113.301236. [DOI] [PubMed] [Google Scholar]
- 125.Ganna A, Magnusson PK, Pedersen NL, et al. Multilocus genetic risk scores for coronary heart disease prediction. Arterioscler Thromb Vasc Biol. 2013;33:2267–2272. doi: 10.1161/ATVBAHA.113.301218. [DOI] [PubMed] [Google Scholar]
- 126.Tikkanen E, Havulinna AS, Palotie A, Salomaa V, Ripatti S. Genetic risk prediction and a 2-stage risk screening strategy for coronary heart disease. Arterioscler Thromb Vasc Biol. 2013;33:2261–2266. doi: 10.1161/ATVBAHA.112.301120. [DOI] [PMC free article] [PubMed] [Google Scholar]