

Abstract
Dendritic cells (DCs) release exosomes with different characteristics based on stimulus. Here, we showed that DC cultures stimulated with low-level IFNγ released exosomes (IFNγ-DC-Exos) that contained microRNA species that can increase baseline myelination, reduce oxidative stress, and improve remyelination following acute lysolecithin-induced demyelination. Furthermore, nasally administered IFNγ-DC-Exos increased CNS myelination in vivo. IFNγ-DC-Exos were preferentially taken up by oligodendroctyes, suggesting they directly impact oligodendrocytes to increase myelination. Thus, our results show great potential for use of these IFNγ-DC-Exos as a therapeutic to promote remyelination in multiple sclerosis and dysmyelinating syndromes.
Keywords: multiple sclerosis, microRNA, exosomes, myelin, dendritic cell, demyelination
1. Introduction
Multiple sclerosis (MS) is an inflammatory disorder involving myelin damage and oligodendrocyte loss. Though patients initially present with a relapsing-remitting disease course during which they have limited ability to remyelinate, over time this ability is diminished and they enter a secondary progressive stage where remyelination declines. With over 400,000 people currently suffering from MS in the United States, it is a significant and devastating healthcare burden (Hogancamp et al., 1997). Damage to cortical structures – that is, grey matter demyelination – is a significant contributor to MS pathogenesis. Though grey matter atrophy is present in early stages as well, hippocampal demyelination and subsequent degeneration is especially common in progressive stages (Geurts et al., 2007; Pirko et al., 2007). This study utilizes hippocampal slice cultures, an ex vivo system that closely parallels its in vivo counterpart and allows for assessment of changes in grey matter myelin.
Treatment options for MS are limited, and consist of conventional immunosuppressors, immunomodulators, or agents to prevent lymphocyte infiltration into the CNS (Ehling et al., 2010). All current treatments induce harmful immune sequelae, and do little to promote repair. Instead, we suggest use of exosomes, naturally occurring, biologically active nanovesicles (30–120 nm) that are exported by cells and can be easily delivered across the blood brain barrier (El Andaloussi et al., 2013), as an adjunct approach to increase remyelination post-injury.
Exosomes are released from a variety of cell types via the endocytic pathway and play important roles in physiologic cell function and disease states (Corrado et al., 2013), and modulation of the immune system (Li et al., 2006). While their exact function in these diverse activities is not yet fully understood, they exert influence through delivery of microRNAs, mRNAs and proteins to recipient cells (Bobrie et al., 2011). Since exosomes do not provoke adverse immune reactions and are non-toxic, research to date has focused on exploiting these naturally formed nanovesicles by re-engineering them as specific immunomodulators and novel delivery platforms for the development of cancer therapeutics (Rountree et al., 2011) and vaccines (Hartman et al., 2011).
The composition of exosomes differs depending on their cellular origin. Dendritic cells (DC), professional antigen presenting cells which are key in modulating adaptive immune responses, are a source of exosomes which can be scalable in vitro (Yin et al., 2013). DC-derived exosomes differ in their composition depending on external stimuli and cell state (Montecalvo et al., 2012). For example, there are vast differences in the miRNA content of exosomes secreted from immature versus mature lipopolysaccharide-stimulated DCs (Montecalvo et al. 2012).
In this study, we stimulated primary DC cultures with low level IFNγ, as we have recently shown that phasic stimulation with low-level IFNγ significantly increases myelination in cultured brain slices or when administered nasally to animals (Pusic and Kraig, 2012). Though others have used IFNγ to produce exosomes expressing surface markers that activate T cells (Viaud et al., 2011), we focus on miRNA contents. Previous studies performed in the lab have shown that exosomes found in the periphery can impact brain myelination, possibly via delivery of miR-219 (Pusic and Kraig, 2012). Here, we found that IFNγ-stimulated DCs exported exosomes, from here on referred to as IFNγ-DC-Exos, that were able to increase myelination and oxidative tolerance from control levels in vitro. In addition, application of IFNγ-DC-Exos improved recovery from MS-like demyelination modeled in slice culture. In vivo work confirmed that nasally administered IFNγ-DC-Exos can effectively increase brain myelination. In vitro tracking assays revealed preferential uptake of IFNγ-DC-Exos by oligodendrocytes, and to a lesser extent, by microglia. This is an important first step in elucidating the mechanisms of exosome-mediated increase in myelin, and will aid in the development of these exosomes as a therapy for remyelination. This work has appeared in preliminary form (Pusic et al., 2013).
2. Material and Methods
2.1 Animal use
Wistar rats were obtained from Charles River Laboratory (Wilmington, MA) and were used in accordance with the University of Chicago Animal Care and Use Committee. Untimed pregnant Wistar female rats were single-housed with Enviro-dri® paper bedding (Shepherd, Watertown, TN) and Nestlets (Ancare, Bellmore, NY) and pups (culled to ten at birth) were used for hippocampal slice cultures. Male Wistar rats (10–12 weeks old) were double-housed and used for bone marrow isolations. Sprague Dawley rats were obtained from Harlan Laboratories (Madison, WI) and used for oligodendrocyte progenitor isolations.
2.2 Isolation of dendritic cells
Immature bone marrow cells were isolated from Wistar rats, as previously described (Powell et al., 2003). Briefly, animals were anesthetized with progressive exposure to 100% carbon dioxide and then immediately decapitated. Using aseptic techniques, bone marrow was aspirated out of the femurs and tibias and stromal cells were purified through the passage of bone and debris through a strainer. Red blood cell lysis buffer consisting of 0.15 M NH4Cl, 10 mM KHCO3, and 0.1 mM EDTA (Sigma, St. Louis, MO) was used to remove the red blood cells. Cells were then washed and plated in 6-well plates (BD Falcon, San Jose, CA) at a density of 106 cells/mL in RPMI 1640 (Invitrogen, Carlsbad, CA) containing 20 ng/mL of GM-CSF (Peprotech Inc., Rocky Hill, NJ) for differentiation into bone marrow derived dendritic cells (BMDCs). Media was changed on day two and five. BMDCs in suspension were harvested on day seven, transferred to new plates, and used for subsequent experiments. Verification of dendritic cell isolation was assessed by surface staining with CD11c (data not shown).
2.3 Generation of dendritic cell-derived exosomes and isolation
Day seven BMDCs were plated at a concentration of 106 cells/mL and were either placed in media alone or stimulated with media containing 500U of IFNγ (R&D Systems, Minneapolis, MN). Three days later culture media was removed and spun down to remove any cells and debris. Exosomes were then isolated using ExoQuick (SBI, Mountain View, CA). ExoQuick was added to culture media at a ratio of 1:5, incubated at 4°C overnight, and exosomes were precipitated by centrifugation at 2000× g for 30 minutes. The exosome pellet was then resuspended in 100 μL of sterile phosphate buffered saline at a pH of 7.3. Isolation of exosomes was confirmed via immunoblot for two exosomal protein markers, CD63 and Alix (AbD Serotec, Raleigh, NC) (Schorey and Bhatnagar, 2008) and electron microscopy (Thery et al., 2006). Quantification of exosomes was performed by BCA assay (ThermoFisher Scientific, Waltham, MA) of protein content.
2.4 Slice culture preparation and use
Hippocampal slice cultures were used to examine grey matter demyelination in vitro. Hippocampal slice cultures allow for the treatment of brain tissue in a controlled environment and are advantageous in that they maintain the following: the neurovascular unit (Kovacs et al., 2011), multi-synaptic electrical activity (Kunkler and Kraig, 1997), pyramidal neuron vitality (Hulse et al., 2008), responsive astrocytes and microglia (Grinberg et al., 2011; Ransohoff and Perry, 2009), and neural immune signaling including the expression of cytokines (Kunkler et al., 2004) as seen in vivo.
Untimed pregnant Wistar female rats (Charles River, Wilmington, MA) were single-housed with Enviro-dri® paper bedding (Shepherd, Watertown, TN) and Nestlets (Ancare, Bellmore, NY). The addition of Nestlets provided enrichment for the pregnant rats thus leading to the improvement of slice culture health; from 80–85% viable (n = 104 litters) to 95–100% viable (n = 156 litters). For culturing, P9–P10 rat pups were used to make hippocampal slice cultures (350 μm thick) as previously described (Kunkler and Kraig, 1997; Mitchell et al., 2010). After 18 days in vitro (DIV) cultures were transferred to a serum-free media, which does not activate microglia and does not contain horse serum-derived exosomes, thus allowing for accurate assessment of the impact of exosome treatments (Pusic and Kraig, 2012). Media composition is further described in Supplementary Materials. Cultures were used between 21–35 DIV, as this time frame is sufficient to allow measurements of neural tissue responses to experimentally induced disease states. All cultures were screened for viability via Sytox™ (Invitrogen) staining, a fluorescent maker of cell death prior to experimental use (Mitchell et al., 2010). Cultures with evidence of CA3 or CA1 pyramidal neuron loss were not used for experiments.
Exosome treatments were applied to the media of slice cultures and incubated for three days unless otherwise noted. Treatments consisted of 100 μg of exosomes in 50 μL of sterile phosphate buffered saline (PBS). All experimental measurements were compared to age-matched control slice culture levels.
For lysolecithin-induced demyelination, mature (21–24 DIV) hippocampal slice cultures were incubated in serum-free media containing lysolecithin (0.5 mg/mL) for 17 hours (Birgbauer et al., 2004). Cultures were then rinsed three times in Neurobasal (Invitrogen), and returned to standard incubation conditions with or without exosome treatment (Pusic and Kraig, 2012).
Oxidative stress [(OS), i.e., excess production of oxidants over that of anti-oxidants] was measured using CellROX™ Deep Red Reagent (Invitrogen), a cell-permeant fluorogenic probe was used as previously described (Grinberg et al., 2012). Menadione treatment (8.6 μg/mL; Supelco Analytical, St. Louis, MO) was used to generate reactive oxygen species. Exosomes were applied to naïve slices for three hours then co-incubated with CellROX™ and menadione for two hours. CellROX™ fluorescence intensity was quantified via digital imaging strategies as described below. A standardized area of interest at the CA3 pyramidal neuron layer was used for all quantifications.
Regional and microglial glutathione levels were assessed using ThiolTracker™ (Invitrogen) a fluorescent dye that reacts with reduced thiols in intact cells, which predominantly reflect glutathione (Mandavilli and Janes, 2010). Procedures for staining followed manufacturer’s protocol, modified for use with hippocampal slice cultures. ThiolTracker™ was dissolved in dimethyl sulfoxide (2 mM, Sigma) and used at 20 μM in a thiol-free solution. Briefly, culture inserts were dipped into three separate 60 mm culture dishes containing 10 mL/each of Gey’s balanced salt solution (Sigma) supplemented with 7.25 mL 45% D-glucose (Sigma) to remove extracellular thiols. Cultures were placed for 30 minutes in glucose supplemented Gey’s solution containing ThiolTracker™ that had been pre-equilibrated to incubator conditions. Inserts were then washed again as described above and fixed in 10% phosphate buffered formalin at 4°C overnight, stained with isolectin GS-IB4 AlexaFluor® 594 conjugate (1:20; Invitrogen), mounted, and cover slipped.
Glutathione was quantified using a self-calibrating sensitive CCD digital imaging system consisting of a QuantEM-512SC camera (Photometrics, Tucson, AZ), electronic shutter (Lambda SC Smart Shutter; Sutter Instruments, Novato, CA), and a standard 100 watt Hg light on a DMIRE2 inverted microscope (Leica, Heidelberg, Germany) at 20x gain. A standardized area of interest at the CA3 pyramidal neuron layer was used for all quantifications. Digital images were thresholded to a uniform range and the average optical intensity registered using MetaMorph software (ver. 7.5.4.0; Molecular Devices, Sunnyvale, CA). Confocal images of microglial ThiolTracker™ staining were acquired using a Leica TCS SP5 II AOBS laser scanning confocal microscope (University of Chicago Integrated Microscopy Core Facility).
2.5 Isolation and use of oligodendrocyte progenitor cells
Oligodendrocyte progenitor cells (OPCs) were isolated from Sprague Dawley rats (Harlan, Madison, WI) using the sequential immunopanning protocol previously described (Dugas et al., 2006). Briefly, cerebral cortices were dissected from P6 rats and enzymatically dissociated with papain at 37°C and 95% O2 and 5% CO2. Following enzymatic dissociation and gentle trituration the single cell suspension was sequentially incubated on dishes coated with antibodies against Ran-2, galactocerebrosidase (GalC), and O4. Ran-2 and GalC removed contaminating astrocytes and mature oligodendrocytes respectively, while the O4 coated plate captured OPCs. Ran-2−, GalC−, O4+ OPCs were then trypsinized from the O4 panning plate and seeded onto poly-D-lysine coated T150 flasks (Fisher Scientific, Hampton, NH) in 20 mL of proliferation media (defined below) at 2,500 cells/mL.
Cells were cultured at 37°C in 10% CO2 in high glucose DMEM (Invitrogen), supplemented with human transferrin (100 μg/mL), bovine serum albumin (100 μg/mL), putrescine (16 μg/mL), progesterone (60 ng/mL), sodium selenite (40 ng/mL), N-acetylL-cysteine (5 μg/mL), D-biotin (10 ng/mL), insulin (5 μg/mL), glutamine (2 mM), sodium pyruvate (1 mM), penicillin-streptomycin (100U each), Trace Elements (1×; Mediatech, Herndon, VA), and the following growth factors for proliferation media: Forskolin (4.2 μg/mL), NT-3 (1 ng/mL, Peprotech, Rocky Hill, NJ) and the OPC mitogens CNTF (10 ng/mL, Peprotech), and PDGF-AA (10 ng/mL, Peprotech). All reagents for OPC isolation were purchased from Sigma unless otherwise noted.
For differentiation experiments, OPCs were passaged from a T150 flask using 0.05% Trypsin-EDTA diluted 1:10 in Earle’s Basic Salt Solution and plated on poly-D-lysine coated 12 mm glass coverslips in 2 mLs of proliferation media minus PDGF-AA at 2,500 cells/mL. OPCs were allowed to recover overnight before treatment. For exosome treatment, IFNγ-DC-Exos (50 μg) were added directly to media. Transfection with mirVana hsa-miR-219-5p mimic (20 nM, Invitrogen) was performed using Lipofectamine RNAiMAX transfection reagent (Invitrogen) as per the manufacturer’s protocol. Control cultures were maintained in proliferation media without PDGF-AA. Positive controls were supplemented with triiodothyronine (T3; 40 ng/mL) to stimulate differentiation. Three days post-treatment, cultures were collected and fixed in cold 4% paraformaldehyde and immunostained for O4 and O1 (hybridoma-derived antibodies provided by the Popko lab), with DAPI (Invitrogen) counterstaining. Percent of O4 and O1 positive cells were calculated as positive cell count/total cell count.
2.6 Immunoblotting
Samples were collected by dissecting out the CA3 region of the hippocampal slice cultures with a diamond knife (Fine Scientific, Foster City, CA) and protein was extracted according to standard protocol (Cook et al., 2011; Rountree et al., 2011). Isolated protein concentration was then measured via BCA assay and run on SDS-PAGE gels, transferred onto PVDF membranes (Bio-Rad, Hercules, CA), and probed with appropriate primary antibody. Antibodies used for probing included CD63, Alix (AbD Serotec, Raleigh, NC) and myelin basic protein (MBP; Novus Biologicals, Littleton, CO), all at a concentration of 1:1000. For assessment of miR-219 target protein levels, PDGFRα (Santa Cruz) was used at 1:200, and ELOVL7 (Sigma) was used at 1:500. Secondary antibody, horseradish peroxidase conjugated anti-mouse or anti-rabbit (Sigma) was used at a concentration of 1:1000 and blots were then visualized via chemiluminescence. Analysis was performed on Quantity One® 1-D Analysis Software (Bio-Rad). All protein was normalized to β–actin (Sigma) with both primary and secondary antibody concentrations of 1:1000.
2.7 Immunohistochemistry and confocal microscopy
Hippocampal slice cultures were fixed with periodate-lysine-paraformaldehyde fixative or methanol for 30 minutes at 4°C (depending on the cell surface stain) and stained for CNPase, Iba1, GFAP, and NeuN. Primary antibodies used in this study are: monoclonal mouse anti-CNPase IgG (1:1000, Millipore, Billerica, MA), polyclonal rabbit anti-Iba1 IgG (1:1000, Wako Pure Chemical Industries, Osaka, Japan), monoclonal mouse anti-GFAP IgG (1:1000, Santa Cruz Biotechnology, Santa Cruz), monoclonal mouse anti-NeuN IgG (1:1000, Millipore, Billerica, MA), polyclonal rabbit anti-Musashi-1 (MSl1) and Musashi-2 (Msi2) (1:50, Cell Signaling Technology, Danvers, MA), monoclonal mouse anti-NG2 (1:250, Life Technologies, Grand Island, NY), and Ki-67 (1:500, Novus). Slices were then incubated with AlexaFluor® 488 or AlexaFluor® 594 labeled secondary antibody specific to the appropriate animal species (1:1000, Millipore, Billerica, MA) and mounted using 1:1 glycerol:PBS (see below). Fluorescently stained slices were then visualized using a confocal laser microscope at the Light Microscopy Core Facility at the University of Chicago. All images were acquired at 100x gain.
2.8 miRNA extraction and profiling
miRNAs were extracted from exosomes using the mirVana™ miRNA Isolation Kit (Life Technologies, Grand Island, NY) according to manufacturer’s instructions. Purity and miRNA yield was assessed by NanoDrop2000 (ThermoFisher Scientific). miRNA (100 ng) was then reverse transcribed into cDNA using the TaqMan® MicroRNA Reverse Transcriptase Kit (Life Technologies) and further amplified with Megaplex™ PreAmp Primers (Rodent Pool set) with TaqMan® PreAmp Master Mix Kit (Life Technologies). Samples were then run on TaqMan® Array Rodent MicroRNA A+B Cards Set v3.0 (Life Technologies) on the 7900HT Real-Time PCR System (Life Technologies). All procedures above were performed according to manufacturer’s instructions.
2.9 DC-derived exosome coupling to Quantum Dots and uptake by slice culture
DC-derived exosomes were coupled to Quantum Dots (QDs), which are 24 nm in size and fluoresce at 620nm. QDs were first conjugated to monoclonal CD63 antibody (AbD Serotec, Raleigh, NC) according to manufacturer’s protocol (Ocean Nanotech, Springdale, AR). Briefly, using covalent coupling chemistry, carboxyl groups on the surface of the QDs (one nmol) were activated and incubated for 2 hours at room temperature with 0.05 mg of CD63. After incubation, the reaction was quenched by adding Ocean’s quenching buffer (Ocean Nanotech) and incubating for 15 minutes. Conjugated QD-CD63 were run on a 1.5% agarose gel to separate conjugated QD-CD63 from unconjugated QDs. The conjugated QD-CD63 band was excised out of the gel and placed into a GeBAflex-tube (GeBa Gene Bio-Application, Yavne, Israel). GeBAflex-tube was used according to manufacturer’s protocol to elute out QD-CD63 from the gel.
Isolated QD-CD63 was then used to tag IFNγ-DC-Exos by gently rocking for two hours at room temperature, referred to from here as QD-Exos. QD-Exos were introduced to 21 DIV hippocampal slice cultures and incubated for three hours, washed with PBS, fixed in methanol, and immunostained for specific cell types to visualize uptake/location of QD-Exos. We found that fixation with methanol preserved QD fluorescence for over two weeks compared to PLP, 4% paraformaldehyde, 10% buffered formalin phosphate which lead to deterioration of fluorescence in days. Mounting with Anti-fade (Invitrogen) also progressively reduced QD fluorescence intensity over days. Accordingly tissue sections tagged QD were cleared with glycerol/PBS and cover slipped.
2.10 Intranasal administration of IFNγ-DC-Exos and assessment of myelin change
Wistar rats were nasally administered exosome preparations. Rats were placed in a fume hood with a heat lamp and thermo-regulator to maintain temperatures at 37°C. Isoflurane (Baxter, Deerfield, IL) anesthesia was delivered via a nose cone (five percent induction and two-three percent maintenance, delivered in oxygen). Fifty μL of exosomes (100 μg protein) were administered over a 20 minute period at a rate of five μL every two minutes to alternating nostrils (Liu et al., 2001a; Liu et al., 2001b). Shams animals were administered fifty μL of PBS alone, following the protocol above.
Three days later, animals were anesthetized with progressive exposure to 100% carbon dioxide and decapitated. Brains were rapidly removed, flash frozen in isopentane, and stored at −80°C until further use. Brains were sectioned (20 μm) using a cryostat (Leica), fixed in 10% buffered formalin phosphate (ThermoFisher Scientific) for 15 minutes, and incubated with FluoroMyelin™ (1:300; Invitrogen) for 40 minutes to stain myelin (Dugas et al., 2010). FluoroMyelin™ intensity was quantified as described above using computer-based digital imaging strategies to assess integrated optical density at defined areas of interest.
2.11 Electron microscopy
Hippocampal slice cultures were sectioned perpendicular to the long axis of CA3 in order to capture Schaffer collateral axons and images were obtained through the Electron Microscopy Core Facility at the University of Chicago. Myelin thickness was measured via g ratio. ImagePro software (v.4.1; Media Cybernetics, Silver Springs, MA) was used to measure inner axonal diameters and total outer diameters for g ratio calculation (inner axonal diameter/total outer diameter) (Guy et al., 1991). Exosomes were also imaged using the Electron Microscopy Core Facility.
2.12 Data handling and statistics
Data were analyzed using SigmaStat software (v.3.5; Systat Software, Chicago, IL). All data were subject to normality testing (p-value to reject: 0.05), equal variance testing (p-value to reject: 0.05), and power (1-β: > 0.8). Mean control data in each experiment was scaled to 1.00 with all subsequent parameters scaled proportionally to better allow inter-experiment comparisons. Molecular biological data (miRNA RT-PCR and Immunoblot of protein) analyses included two technical replicates per experimental (i.e., biological) measurement. All experimental groups consisted of biological replicates of n ≥ 3. Pairwise comparisons were made with the Student’s t-test and multiple comparisons done via ANOVA plus post hoc Holm-Sidak testing.
3. Results
3.1 Confirmation of IFNγ-DC-Exo Isolation
Isolation of exosomes released from IFNγ-stimulated DCs was first confirmed via immunoblot for CD63 (50kDa) and Alix (96kDa), two well-known markers present on exosomes (Figure 1A) (Schorey and Bhatnagar, 2008). Presence of exosomes was further determined by electron microscopy (EM), which revealed the presence of vesicles with a diameter of around 50 nm (Figure 1B). IFNγ-DC-Exos were established to be non-toxic, as hippocampal slice cultures treated with IFNγ-DC-Exos did not show any signs of cell death when stained with a fluorescent marker of cell death (Mitchell et al., 2010) at 3, 6, 9, and 12 days post-application (Figure 1C–D). Additionally, toxicity of UV treated IFNγ-DC-Exos were also assessed, and likewise showed no signs of cell death in hippocampal slice cultures (data not shown). Thus, we proceeded with subsequent experiments involving the use of hippocampal slice cultures.
Figure 1. IFNγ-stimulated dendritic cells produced non-toxic exosomes.

Exosome isolation confirmed by (A) Immunoblot for surface markers CD63 and Alix, and by (B) electron microscopy. Scale bar, 50 nm. (C) Exosome application to slice cultures showed no toxic effects. Slices were stained with Sytox™ at 3, 6, 9, and 12 days post-treatment. NeuN immunostaining image (left) shows normal neuronal architecture. Dotted lines indicate pyramidal (large arc) and dentate gyrus (small arc) principal neuronal layers. Sytox™ positive image (center) shows a control with principal neuronal injury induced by 24 hour exposure to 20 μM N-methyl-d-aspartate. Sytox™ negative image (right) of exosome treated culture showed no injury. Images were inverted to enhance visualization. Scale bar, 250 μm. (D) Quantification of Sytox™ fluorescence intensity (n = 9 slices/group) confirmed no significant change (ANOVA plus post hoc Holm-Sidak testing).
3.2 IFNγ-DC-Exos increased compact myelin and myelin levels in slice cultures
Different exosome treatments were applied to hippocampal slice cultures and EM imaging was performed three days later to determine changes in compact myelin. EM images demonstrated intact and tightly laminated myelin whose thickness was increased with the application of IFNγ-DC-Exos (Figure 2A). Subsequent calculations of g ratios revealed significant (p = 0.008) improvement of laminated myelin with IFNγ-DC-Exo treatment compared to control (Figure 2B).
Figure 2. IFNγ-stimulated-DC-Exos increased myelination in slice culture.
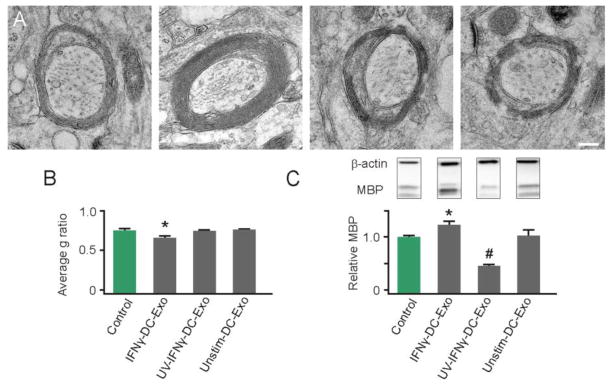
(A) Representative electron microscopy images illustrate increased compact myelin in IFNγ-DC-Exo treated slice cultures. Treatments from left to right: control (no treatment); IFNγ-DC-Exo; UV-IFNγ-DC-Exo; and unstimulated-DC-Exo. Scale bar, 200 nm. (B) Quantification of myelin g ratios from electron microscopy images (n = 3 slices/group; and 10 cells/slice) showed a significant (*, p = 0.008) increase in compact myelin thickness with IFNγ-DC-Exo treatment. (C) Immunoblot confirmation of myelin basic protein (MBP) showed bands at 18, 23, and 45kDa representing three transcripts of MBP. A quantification of all three transcripts of MBP showed a significant (*, p = 0.02) increase in MBP levels in slice cultures treated with IFNγ-DC-Exos and a significant (#, p = <0.001; n = 9, 15, 11, 9 slices/group, respectively) decrease in MBP in slice cultures treated with UV-IFNγ-DC-Exo. Significance was determined by ANOVA plus post hoc Holm-Sidak testing and ANOVA testing.
When applied to naïve 24 DIV hippocampal slice cultures, IFNγ-DC-Exos significantly (p = 0.02) increased production of myelin basic protein (MBP) as measured via immunoblot (Figure 2C). UV-treatment of IFNγ-DC-Exos (545 nm, 45 minutes 100 μWatts/cm2) prior to application abrogated this effect, indicating involvement of RNA species in the observed increase in myelin production (Eldh et al., 2010). Additionally, a significant (p < 0.001) decrease of MBP levels was seen with UV-treatment of IFNγ-DC-Exos compared to control (Figure 2C). This is likely due to the delivery of exosomal proteins damaged through UV treatment (Eldh et al., 2010).
3.3 IFNγ-DC-Exo treatment does not cause progenitor depletion
To determine whether exosome-mediated increase of OPC differentiation has a deleterious effect on progenitor populations, the presence of neural progenitor cells and OPCs were assessed in hippocampal slice cultures treated with IFNγ-DC-Exos and unstimulated-DC-Exos compared to untreated control. Staining with Musashi (Msi1/Msi2) (Figure 3A) for neural stem cells revealed no significant difference in the number of positive cell counts between exosome treated slices and control (Figure 3C). Similarly, staining with NG2 for cells in the OPC stage showed no significant difference in the number of positive cells (Figure 3B and D), suggesting that the progenitor pool was not affected.
Figure 3. Progenitor cell populations were not affected by IFNγ-stimulated-DC-Exo treatments.
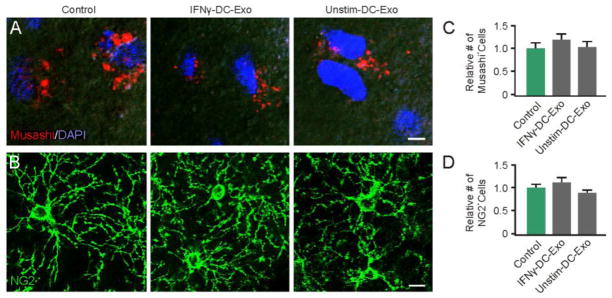
Confocal typical images are shown for (A) neural stem cells (Musashi; red) with DAPI counterstaining (blue) and for (B) oligodendrocyte progenitor cells (NG2; green) in control untreated slice cultures (left panel), IFNγ-stimulated-DC-Exos treated slice cultures (middle panel), and unstimulated-DC-Exos treated slice cultures (right panel). DAPI was used with Musashi staining to enhance determination of cell number since Musashi is a cytoplasmic marker. In contrast, NG2 alone was sufficient to determine cell numbers. Scale bar, 10 μm. Quantification of the number of positive (C) neural stem cells and (D) oligodendrocyte progenitor cells in each treatment group (determined from 9 images/group and n = 3/group). No significant differences were seen between groups via ANOVA plus post hoc Holm-Sidak testing.
3.4 IFNγ-DC-Exos increased oxidative tolerance in hippocampal slice culture
IFNγ-DC-Exo treatment also significantly increased oxidative tolerance of slice cultures. Administration of these exosomes three hours prior to menadione exposure significantly (p < 0.001) reduced oxidative stress, as seen by CellROX™ staining (Figure 4A–B). ThiolTracker™ staining revealed significantly (p = < 0.001) increased levels of reduced glutathione in cultures treated with both types of exosomes compared to untreated controls (Figure 4C–D). However, treatment with IFNγ-DC-Exos triggered a significantly greater rise in reduced glutathione than that seen with unstimulated-DC-Exos alone. Glutathione was found localized to microglia, as seen by isolectin-GS-IB4 double staining (Figure 4C).
Figure 4. IFNγ-stimulated-DC-Exos reduced oxidative stress in slice culture.
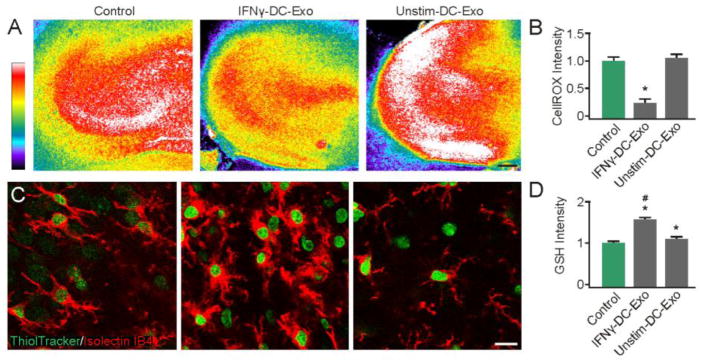
(A) Representative images show oxidative stress induced by acute exposure to menadione measured via CellROX™, a fluorescent marker of oxidative stress after exposure to menadione alone (control, left) and after treatment with IFNγ-stimulated-DC-Exos (middle) and unstimulated-DC-Exos (right). Scale bar, 200 μm. Quantification of fluorescence intensity (B) was performed at the CA3 area and showed that IFNγ-stimulated-DC-Exo treatment significantly (*, p < 0.001; n = 8/group) reduced oxidative stress relative to control and unstimulated-DC-Exo treatment. (C) Representative images show glutathione (ThiolTracker™) and microglia (Iso-lectinB4) costaining. Control (left), IFNγ-stimulated-DC-Exos (middle) and unstimulated-DC-Exos (right). (D) Quantification of ThiolTracker™ fluorescence intensity revealed a significant (*, p < 0.001; n = 9) increase in glutathione content of microglia after treatment with IFNγ-stimulated-DC-Exos and unstimulated-DC-Exos compared to control. Microglial glutathione content after IFNγ-stimulated-DC-Exo treatment was also significantly (#, p < 0.001; n = 9) increased relative to unstimulated-DC-Exo treatment. Significance was determined by ANOVA plus post hoc Holm-Sidak testing.
3.5 Specific miRNA involved in oligodendroctye differentiation and anti-inflammatory pathways are highly expressed in IFNγ-DC-Exos
Screening of exosomal miRNA revealed significant differences between the contents of IFNγ-DC-Exos and unstimulated-DC-Exos. IFNγ-DC-Exos were enriched in a number of miRNA species known to be involved in either oligodendrocyte differentiation or anti-inflammatory responses.
IFNγ treatment of DC cells increased expression and packaging of miRNAs involved in oligodendrocyte differentiation and myelin production pathways, listed in Figure 5A. Notably, miR-219 was very highly enriched in IFNγ-DC-Exos and undetectable in unstimulated-DC-Exos. Enriched anti-inflammatory response miRNAs are shown in Figure 5B. miR-181a, miR-451, miR-532-5p, and miR-665 were especially highly enriched (>10 fold) in IFNγ-DC-Exos versus unstimulated-DC-Exos. Increased presence of these miRNA species indicates the possibility that IFNγ-DC-Exos may reduce inflammation and oxidative stress. Detailed tabulation of miRNA screening is listed in Supplementary Materials.
Figure 5. IFNγ-stimulated-DC-Exo were enriched in miRNA species involved in myelin production and anti-inflammatory response.

miRNA content of IFNγ-stimulated-DC-Exos were compared to that of unstimulated-DC-Exos. Results show expression levels of specific miRNAs involved in (A) myelin production/oligodendrocyte differentiation and (B) anti-inflammatory response. Black panels indicate mature miRNA species that could not be detected; grey panels indicate miRNAs that were readily detectible but not significantly enriched; light green indicate significantly enriched (i.e., >2 fold) miRNAs; and dark green indicates very highly enriched (i.e., >10 fold) miRNAs. Complete screening results are presented in Supplementary Materials.
3.6 IFNγ-DC-Exos deliver functional miR-219, resulting in decreased protein levels from miR-219 target mRNAs
To confirm the functional effect of miR-219 from IFNγ-DC-Exos, exosomes were applied to slice cultures and immunoblots for known targets were performed. Specific targets were: PDGFRα, the receptor for a mitogen that promotes proliferation and inhibits differentiation, and ELOVL7, which regulates lipid metabolism and redox homeostasis (Dugas et al., 2010; Zhao et al., 2010). Three days after IFNγ-DC-Exo application, slice cultures contained significantly (p < 0.001) lower levels of both PDGFRα and ELOVL7 compared to untreated control slice cultures (Figure 6A and B)
Figure 6. IFNγ-stimulated-DC-Exos deliver functional miR-219.

Slice cultures were treated with IFNγ-stimulated-DC-Exos and immunoblots performed on extracted protein to determine levels of (A) PDGFRα and (B) ELOVL7, compared to untreated controls. IFNγ-stimulated-DC-Exo treatment significantly (*, p < 0.001; n = 3 slices/group) decreased PDGFRα protein levels. Similarly, IFNγ-stimulated-DC-Exo treatment significantly (*, p < 0.001; n = 3 slices/group) decreased levels of ELOVL7 protein in slice cultures.
3.7 IFNγ-DC-Exos restores myelin levels post lysolecithin-induced demyelination
Lysolecithin was used as a means to induce demyelination, as a model of MS in hippocampal slice cultures (Birgbauer et al., 2004). Treatment with IFNγ-DC-Exos post lysolecithin exposure significantly (p < 0.001) increased remyelination toward normal levels, measured at five days post injury, compared to cultures treated with lysolecithin alone or given UV-IFNγ-DC-Exos (Figure 7).
Figure 7. IFNγ-stimulated-DC-Exos increased remyelination after acute lysolecithin induced demyelination.

Slice cultures were exposed to lysolecithin to model acute demyelination followed by remyelination, then given different exosome treatments. At five days post-treatment, at the onset of remyelination, cultures were harvested and myelin basic protein (MBP) content quantified via immunoblot. While lysolecithin (Lyso) exposure caused a significant (*, p < 0.001; n = 9 slices/group) reduction of MBP in all groups compared to control, treatment with IFNγ-stimulated-DC-Exos induced a significant (#, p < 0.001) increase in remyelination compared to all other lysolecithin exposed groups. Significance was determined by ANOVA plus post hoc Holm-Sidak testing.
3.8 Nasal administration of IFNγ-DC-Exos increased levels of myelin in the brain
To assess the ability of IFNγ-DC-Exos to increase myelin in vivo, IFNγ-DC-Exos were nasally administered to rats and their ability to increase myelin in vivo was determined. Three days post-nasal administration, brains were harvested and improved myelination was observed in the motor cortex by FluoroMyelin™ staining (Figure 8A) and MBP immunostaining (Figure 8B). FluoroMyelin™ staining intensity was significantly (p < 0.001) higher in IFNγ-DC-Exo treated animals than PBS treated (sham) animals (Figure 8C). Likewise, MBP immunostaining intensity was significantly (p = 0.011) higher in IFNγ-DC-Exo treated animals than shams (Figure 8D). Immunoblot analysis similarly showed significantly (p = 0.019) increased MBP levels in the cortex of animals treated with IFNγ-DC-Exos compared to sham (Figure 8C).
Figure 8. Nasal administration of IFNγ-stimulated-DC-Exos increased production of myelin in neocortex.
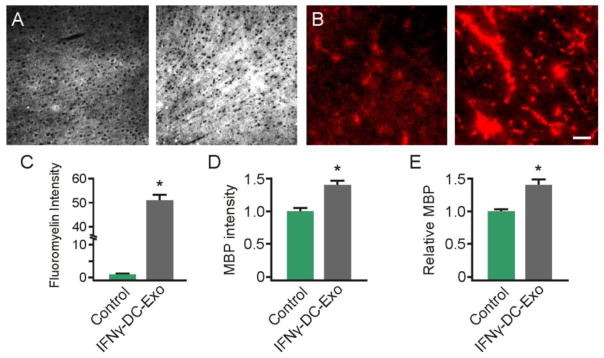
(A) Three days after nasally administered phosphate buffered saline-sham (left) or IFNγ-stimulated-DC-Exos (right), brains were harvested, frozen, and cortex sectioned for staining with FluoroMyelin™ to measure myelin levels and (B) MBP immunostaining. Scale bar, 100 μm. Quantification showed a significant (*, p < 0.001; n = 3 animals/group) increase in (C) FluoroMyelin™ staining intensity and a significant (*, p = 0.011; n = 3 animals/group) increase in (D) MBP immunostaining intensity following nasal administration of IFNγ-stimulated-DC-Exos. (E) Immunoblot for MBP shows a significant (*, p = 0.019; n = 3 animals/group) increase in MBP levels in the parasagittal motor cortex area of animals treated with IFNγ-stimulated-DC-Exos. Motor cortex was chosen as a representative area of brain. Significance was determined by Student’s t-test.
3.9 QD tagged IFNγ-DC-Exos are preferentially taken up by oligodendroctyes
To determine whether QD nanoparticles were successfully conjugated to anti-CD63 antibody, unconjugated QD nanoparticles and conjugated QD-CD63 were analyzed on a 1.5% agarose gel. Conjugated QD-CD63 (Figure 9A, lane 2) migrated at a higher molecular weight in comparison to unconjugated QD (Figure 9A, lane 1) indicating the successful conjugation and a homologous species of conjugated QD-CD63. Further confirmation of the coupling of QD-CD63, seen as a circular structure with an electron dense core (Figure 9B, arrowhead), to exosomes (Figure 9B, arrow) was visualized by EM imaging.
Figure 9. Confirmation of exosome QD tagging.
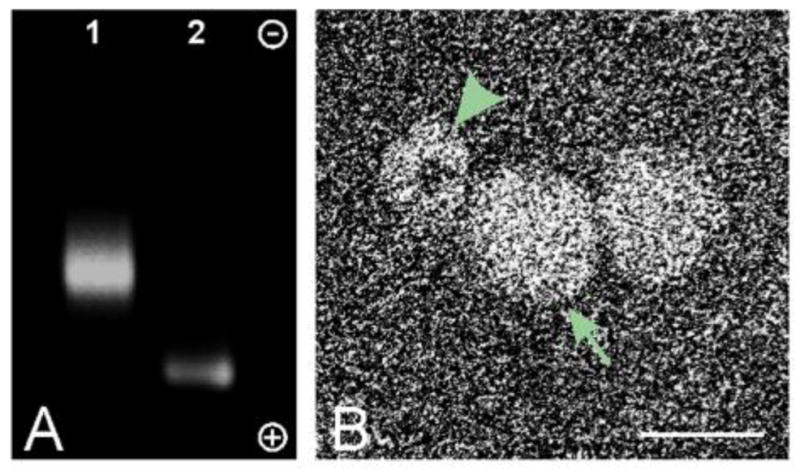
(A) Agarose gel electrophoresis of CD63-conjugated QD nanoparticles (Lane 1) and unconjugated QD nanoparticles (Lane 2). Gel is oriented with the cathode at the top and the anode at the bottom. (B) Electron microscopy image of QD nanoparticle (arrowhead) tagged to exosomes (arrow). Scale bar, 25 nm.
QD-IFNγ-DC-Exos (Figure 10A) and QD-unstimulated-DC-Exos (Figure 10B) were applied to hippocampal slice cultures and immunostained for specific cell types. Tracking of both types of QD-Exos resulted in co-localization with oligodendroctyes, microglia, and astrocytes at different rates; no uptake in neurons was observed.
Figure 10. IFNγ-stimulated-DC-Exos preferentially enter oligodentrocytes.

(A) Merged images (top row) of QD tagged IFNγ-stimulated-DC-Exos (middle row, red) and cell-specific immunofluorescence (bottom row, green). (B) Merged images (top row) of QD tagged unstimulated-DC-Exos (middle row, red) and cell-specific immunofluorescence (bottom row, green). Left to right oligodendroctyes (anti-CNPase), microglia (anti-Iba-1), astrocytes (anti-GFAP), and neurons (anti-NeuN). Scale bars (A and B), 10 μm. (C) Uptake of QD tagged IFNγ-stimulated-DC-Exos and QD tagged unstimulated-DC-Exos for each cell type. Percent uptake calculated per 60 cells from n = 3 slices/group. These results indicate that DC exosomes can track to specific brain cell types. IFNγ-stimulated-DC-Exos were significantly (*, p < 0.001) localized to oligodendrocytes, while unstimulated-DC-Exos were significantly (*, p < 0.001) localized to astrocytes. Significance was determined by Student’s t-test.
QD positive cells are listed as a percentage of cells measured (Figure 10C). The 700 nm thick sections allowed for accurate visualization of cell-specific staining surrounding an unstained nucleus. In this fashion 60 cells per cell-specific staining group were counted and the number of QD-positive cells noted. QD-IFNγ-DC-Exos in slice showed that they were preferentially taken up by oligodendroctyes (72%) and to a lesser extent microglia (34%) and astrocytes (12%). In comparison, QD-unstimulated-DC-Exos were found to also co-localize with oligodendroctyes but to a lesser extent (7%), with uptake by microglia being similar (38%) to QD-IFNγ-DC-Exos, and astrocytes having the highest uptake at 63%. This suggests a difference in surface composition, where IFNγ-DC-Exos were significantly (p < 0.001) targeted to oligodendroctyes and unstimulated-DC-Exos were significantly (p < 0.001) targeted to astrocytes.
3.10 Transfection of primary OPCs with miR-219 mimic showed effects on differentiation and proliferation similar to treatment with IFNγ-DC-Exos
To determine if IFNγ-DC-Exos increase OPC differentiation through miR-219, a miR-219 mimic was applied to primary OPC cultures. Primary OPC cultures were grown at low density on glass coverslips, and either treated with IFNγ-DC-Exos or transfected with a miR-219 mimic. Supplementation with T3, which induces OPC differentiation, was used as a positive control. Three days after treatment, IFNγ-DC-Exo treated OPCs showed increased differentiation compared to control cultures, as determined by increased staining for stage-specific markers, O4 (Figure 11A) and O1 (Figure 11B). OPC cultures transfected with the miR-219 mimic likewise showed increased differentiation (Figure 10A and B). Quantification of the percent O4 and O1 positive cells per treatment group revealed that both IFNγ-DC-Exos and the miR-219 mimic promoted OPC differentiation to the same extent as treatment with T3 (positive control), and were significantly (p = 0.002 and p < 0.001, respectively) increased from control (Figure 11C and D).
Figure 11. miR-219 mimic and IFNγ-stimulated-DC-Exos similarly promote OPC differentiation.

(A) Representative images of O4 positive staining with DAPI counterstain used for quantification. (B) Representative images of O1 positive staining with DAPI counterstain used for quantification. Scale bars (A and B), 20 μm. (C) Representative high-power image of O4 staining to illustrate morphology, and quantification of percent of O4 positive cells (O4+ cells/total DAPI+ cells) per field (3 images per coverslip, n = 3 coverslips/group). Scale bar, 10 μm. Treatment with miR-219 mimic and IFNγ-stimulated-DC-Exos stimulated differentiation of OPCs into O4 expressing cells similar to T3 supplementation, and all groups were significantly (*, p < 0.001) increased from control. (D) Representative high-powered image of O1 positive staining and quantification of percent of O1 positive cells (O1+ cells/total DAPI+ cells) per field (3 images per coverslip, n = 3 coverslips/group). Scale bar, 10 μm. Treatment with miR-219 mimic and IFNγ-stimulated-DC-Exos stimulated differentiation of OPCs into mature O1 expressing cells similar to T3 supplementation, and all groups were significantly (*, p = 0.002) increased from control. (E) Representative images of O4 and Ki-67 positive staining of OPCs given different treatments. From left to right: control, T3, miR-219 mimic, and IFNγ-stimulated-DC-Exos treatments. Quantification of percent O4/Ki-67 double positive cells per field (3 images per coverslip, n = 3 coverslips/group) shows that treatment with miR-219 mimic and IFNγ-stimulated-DC-Exos increased OPC proliferation similar to T3 supplementation, all groups were significantly (*, p < 0.001) increased compared to control. Scale bar, 10 μm.
Additionally, the extent of OPC proliferation was also determined by Ki-67 staining after the above treatments. Compared to control, cultures treated with IFNγ-stimulated-DC-Exos and those transfected with the miR-219 mimic showed significant (p < 0.001) increases in O4 positive OPC proliferation, and proliferated to the same extent as cultures supplemented with T3 (positive control) growth factor (Figure 11E).
4. Discussion
Current MS therapeutics are largely designed to reduce inflammation that contributes to initial demyelination, but do little to promote remyelination. In this study we focused on restoring remyelination, which is lost in MS and significantly contributes to disease progression (Hogancamp et al., 1997). Previously (Pusic and Kraig, 2012), we examined the role of environmental enrichment (EE; volitionally increased physical, intellectual, and social activity) in improving outcomes of neurodegenerative disorders, including demyelinating diseases such as MS (Laviola et al., 2008). EE enhances memory and increases production of myelin at all ages (Fields, 2008). We discovered that exosomes found in the serum of EE animals may play a role in the increase in myelination. These serum-derived exosomes contained increased miR-219 relative to exosomes isolated from non-enriched animals (Pusic and Kraig, 2012). In this study, we promote the use of stimulated DC exosomes as an effective treatment for remyelination, and highlight a number of their positive attributes.
We explored the use of DCs as a scalable, exogenous source of pro-myelinating exosomes and found that stimulation with IFNγ induced production of exosomes containing high levels of miR-219. The contained miR-219 is functional when delivered to slice cultures via exosomes, as evidenced by decreased levels of two targets, PDGFRα and ELOVL7 in treated cultures versus controls (Figure 6). Application of these exosomes to slice cultures increased levels of MBP, which was reflected in the production of structurally normal and thicker myelin sheaths (Figure 2). IFNγ-DC-Exos also effectively increased MBP in MS modeled by acute demyelination of slice culture, further indicating their ability to promote recovery (Figure 7). As miRNA-mediated regulation of various stages of oligodendrocyte maturation and myelin production plays an important role in CNS myelination, we screened exosomal miRNA content with a focus to these species (Figure 5) (Dugas et al., 2010; Zhao et al., 2010). miR-219 plays an essential role in the formation and maintenance of compact myelin (Dugas et al., 2010). It has been shown to be necessary for OPC differentiation (Shin et al., 2009), and is deficient in MS lesions (Junker et al., 2009). The high miR-219 content in IFNγ-DC-Exos suggests that these DC exosomes can modulate oligodendrocyte maturation by targeting multiple steps in the differentiation pathway, as previously observed with EE derived exosomes (Pusic and Kraig, 2012). Other miRNAs also involved in the oligodendrocyte differentiation pathway were found in IFNγ-DC-Exos. miR-9, which is induced during normal oligodendrocyte maturation and enhances differentiation (Lau et al., 2008; Lin and Fu, 2009), was significantly enriched in these exosomes. Additionally, mature species of the miR-17-92 cluster, known to induce OPC proliferation both in vivo and in vitro (Budde et al., 2010), were also present and/or enriched. Thus, IFNγ-DC-Exos contain high levels of several miRNA species that are involved in oligodendrocyte development pathways (Figure 5A), which may account for the observed increase in myelin. Furthermore, the presence of the miR-17-92 cluster indicates that improved recovery from lysolecithin-induced demylination via differentiation of OPCs can be accomplished without the depletion of progenitors. This was validated by equivalent counts of progenitors prior to and after exosome treatments in hippocampal slice cultures (Figure 3). Treatment with IFNγ-DC-Exos was also shown to increase proliferation of OPCs, thus it is likely that IFNγ-DC-Exos can replenish and stabilize the population of OPCs.
Furthermore, we found that IFNγ-DC-Exos also increased oxidative tolerance of slice cultures (Figure 4A–B) and also increased antioxidant levels in microglia (Figure 4C–D), an effect that potentially involves anti-inflammatory miRNAs. A number of miRNA species involved in anti-inflammatory responses were found to be highly enriched in IFNγ-DC-Exos compared to unstimulated-DC-Exos (Figure 5B). For example, miR-181a is involved in regulation monocyte/macrophage responses, where it acts to dampen pro-inflammatory signaling and reduces production of reactive oxygen species (Xie et al., 2013). Recent evidence suggests that miR-181a plays a similar role in regulating inflammation in the CNS (Hutchison et al., 2013). Another enriched miRNA, miR-124, promotes anti-inflammatory signaling and downregulates M1-associated pro-inflammatory IL-6, TNFα and iNOS (Ponomarev et al., 2013). Importantly, high levels of miR-27a were found in IFNγ-DC-Exos. miR-27a is expressed at significantly higher levels throughout the lifespan of the Ames dwarf mouse versus wildtype mice. Ames dwarf mice are used to study healthy aging due to their longevity, and miR-27a may contribute to their increased oxidative tolerance via regulation of glutathione synthesis (Bates et al., 2010). Thus, miRNA species may be responsible for the reduced OS and increased glutathione observed in IFNγ-DC-Exo treated slice cultures. The potential for immune modulation via this exosomal delivery of specific miRNAs should be further explored. It is possible that IFNγ-DC-Exos can also be utilized for immune suppression, as seen with traditional MS drugs, while simultaneously serving to promote myelin repair. Also, IFNγ-DC-Exos might be utilized for immune suppression, as seen with traditional MS drugs, while simultaneously serving to promote myelin repair.
Though we chose to focus on miR-219 for its well-documented involvement in oligodendrocyte differentiation, it will be important to further explore the relative contributions of other highly enriched miRNA species to the observed increase in myelination. It is likely that synergistic activity of multiple miRNA species is necessary to produce conditions supportive of myelination/remyelination.
Nasal administration of drugs to treat MS has recently been shown to be an effective means to lessen the effects of this malady (Duchi et al., 2013). We extend our proof-of-principle work using slice cultures to suggest IFNγ-DC-Exos may also be effectively delivered. Administration of IFNγ-DC-Exos nasally resulted in a significant increase in myelin (Figure 8) within normal brain. Having confirmed that IFNγ-DC-Exos are effective in vivo to promote myelin, we began in vitro tracking studies to determine the cellular targets. Though both QD-tagged exosomes were found in oligodendrocytes, astrocytes, and microglia, the QD-IFNγ-DC-Exos were preferentially taken up by oligodendrocytes (72%), whereas QD-unstimulated-DC-Exos showed no oligodendrocyte specificity (7%) (Figure 10).
If exosome uptake is governed by endocytosis alone, we would have expected highest uptake by microglia, as they have the greatest endocytic activity of neural cell types. However, though there was a comparable and considerable uptake of both types of exosomes by microglia, there was a striking differential increase in uptake by other cell types. This suggests that exosome uptake can be receptor mediated, and indicates a difference in surface composition of each exosome type. Thus, IFNγ-DC-Exos may affect myelin by directly delivering specific miRNA species, such as miR-219, to oligodendrocytes. A better understanding of the mechanism by which IFNγ-DC-Exos interact with oligodendrocytes will be an important next step to further improve efficacy. For example, this could aid in devising strategies to specifically target IFNγ-DC-Exos to oligodendrocytes in order to maximize remyelination. However, the contribution of microglia to the observed increase in remyelination should also be explored. The second-highest uptake of IFNγ-DC-Exos was seen by microglia, and it is possible that they may have indirect effects on myelination and/or may be necessary to create a microenvironment that supports remyelination. Further characterization of the effects of IFNγ-DC-Exos on microglia will be a necessary next step. Additionally, though astrocyte endocytosis is expected to increase in response to inflammatory stimuli, application of unstimulated-DC-Exos produced no significant increase in slice culture oxidative stress, an indirect read-out of increased inflammation, relative to control slices. The significance of preferential uptake of unstimulated-DC-Exos by astrocytes should therefore be further explored.
Since tracking studies suggest preferential uptake of IFNγ-DC-Exos by oligodendrocytes, and IFNγ-DC-Exos contained high levels of miR-219, we assessed their ability to affect OPC differentiation via miR-219 using primary OPC cultures. Primary OPCs treated with IFNγ-DC-Exos or transfected with a miR-219 mimic differentiated to a similar degree (Figure 11). This provides evidence for the role of IFNγ-DC-Exo delivery of miR-219 in promoting remyelination.
Recent evidence has indicated DC involvement in the pathogenesis of MS and that the function of these cells may be altered to improve MS (Nuyts et al., 2013). Here we suggest for the first time the use of these stimulated cells in vitro to generate nutritive exosomes that can remyelinate normal and damaged brain. Our study provides strong evidence that exosomes can be an effective therapeutic for remyelination. Furthermore, our approach indicates that, dependant on the stimulation state of the DCs, generated exosomes can be targeted to specific cell types. Future studies will need to focus on determining the efficacy of IFNγ-DC-Exos in vivo using various MS animal models. Clinical trials utilizing exosomes for cancer treatments indicate their safety (Dai et al., 2008); however, more in-depth toxicity studies utilizing IFNγ-DC-Exos will be necessary. Further development of DC exosomes as a remyelination therapy may include re-engineering them to contain only desired miRNAs, and optimizing in vivo targeting methods to direct exosome to specific cells.
Supplementary Material
Highlights.
IFNγ-stimulated DC exosomes increase brain myelin and oxidative tolerance
IFNγ-stimulated DC exosomes improve remyelination after acute demyelination
Nasal administration of IFNγ-stimulated DC exosomes increase myelination in vivo
IFNγ-stimulated DC exosomes preferentially target oligodendrocytes
IFNγ-stimulated DC exosomes deliver miRNAs involved in differentiation/inflammation
Acknowledgments
This work was supported by the National Center for Advancing Translational Sciences (1 UH 2 TR000918) from the Director’s Office Common Fund program involving Extracellular RNA Communication as well as core facilities funds from the National Center for Advancing Translational Sciences of the National Institutes of Health through Grant Nymber UL1 TR000430. Also, grants from the National Institute of Neurological Disorders and Stroke (NS-19108), the National Institute of Child Health and Human Disorders (5 PO1 HD 09402), the White Foundation, the National Institutes of General Medicine (5T32GM007839-31), and the National Multiple Sclerosis Society (59917678).
We thank Y.Y. Grinberg and Dr. A.T. Reder for reading and commenting on the manuscript. We thank Dr. C. Labno of the University of Chicago Light Microscopy Core for assistance with confocal imaging, and Dr. Y. Chen of the University of Chicago Electron Microscopy Facility for assistance with transmission electron microscopic imaging.
Footnotes
Publisher's Disclaimer: This is a PDF file of an unedited manuscript that has been accepted for publication. As a service to our customers we are providing this early version of the manuscript. The manuscript will undergo copyediting, typesetting, and review of the resulting proof before it is published in its final citable form. Please note that during the production process errors may be discovered which could affect the content, and all legal disclaimers that apply to the journal pertain.
References
- Bates DJ, Li N, Liang R, Sarojini H, An J, Masternak MM, Bartke A, Wang E. MicroRNA regulation in Ames dwarf mouse liver may contribute to delayed aging. Aging Cell. 2010;9:1–18. doi: 10.1111/j.1474-9726.2009.00529.x. [DOI] [PMC free article] [PubMed] [Google Scholar]
- Birgbauer E, Rao TS, Webb M. Lysolecithin induces demyelination in vitro in a cerebellar slice culture system. J Neurosci Res. 2004;78:157–166. doi: 10.1002/jnr.20248. [DOI] [PubMed] [Google Scholar]
- Bobrie A, Colombo M, Raposo G, Thery C. Exosome secretion: molecular mechanisms and roles in immune responses. Traffic. 2011;12:1659–1668. doi: 10.1111/j.1600-0854.2011.01225.x. [DOI] [PubMed] [Google Scholar]
- Budde H, Schmitt S, Fitzner D, Opitz L, Salinas-Riester G, Simons M. Control of oligodendroglial cell number by the miR-17-92 cluster. Development. 2010;137:2127–2132. doi: 10.1242/dev.050633. [DOI] [PubMed] [Google Scholar]
- Cook D, del Sanchez-Carbente MR, Lachance C, Radzioch D, Tremblay S, Khandjian EW, DesGroseillers L, Murai KK. Fragile X related protein 1 clusters with ribosomes and messenger RNAs at a subset of dendritic spines in the mouse hippocampus. PLoS One. 2011;6:e26120. doi: 10.1371/journal.pone.0026120. [DOI] [PMC free article] [PubMed] [Google Scholar]
- Corrado C, Raimondo S, Chiesi A, Ciccia F, De Leo G, Alessandro R. Exosomes as intercellular signaling organelles involved in health and disease: basic science and clinical applications. Int J Mol Sci. 2013;14:5338–5366. doi: 10.3390/ijms14035338. [DOI] [PMC free article] [PubMed] [Google Scholar]
- Dai S, Wei D, Wu Z, Zhou X, Wei X, Huang H, Li G. Phase I clinical trial of autologous ascites-derived exosomes combined with GM-CSF for colorectal cancer. Mol Ther. 2008;16:782–790. doi: 10.1038/mt.2008.1. [DOI] [PMC free article] [PubMed] [Google Scholar]
- Duchi S, Ovadia H, Touitou E. Nasal administration of drugs as a new non-invasive strategy for efficient treatment of multiple sclerosis. J Neuroimmunol. 2013;258:32–40. doi: 10.1016/j.jneuroim.2013.02.013. [DOI] [PubMed] [Google Scholar]
- Dugas JC, Cuellar TL, Scholze A, Ason B, Ibrahim A, Emery B, Zamanian JL, Foo LC, McManus MT, Barres BA. Dicer1 and miR-219 Are required for normal oligodendrocyte differentiation and myelination. Neuron. 2010;65:597–611. doi: 10.1016/j.neuron.2010.01.027. [DOI] [PMC free article] [PubMed] [Google Scholar]
- Dugas JC, Tai YC, Speed TP, Ngai J, Barres BA. Functional genomic analysis of oligodendrocyte differentiation. J Neurosci. 2006;26:10967–10983. doi: 10.1523/JNEUROSCI.2572-06.2006. [DOI] [PMC free article] [PubMed] [Google Scholar]
- Ehling R, Berger T, Reindl M. Multiple sclerosis - established and novel therapeutic approaches. Cent Nerv Syst Agents Med Chem. 2010;10:3–15. doi: 10.2174/187152410790780127. [DOI] [PubMed] [Google Scholar]
- El Andaloussi S, Lakhal S, Mager I, Wood MJ. Exosomes for targeted siRNA delivery across biological barriers. Adv Drug Deliv Rev. 2013;65:391–397. doi: 10.1016/j.addr.2012.08.008. [DOI] [PubMed] [Google Scholar]
- Eldh M, Ekstrom K, Valadi H, Sjostrand M, Olsson B, Jernas M, Lotvall J. Exosomes communicate protective messages during oxidative stress; possible role of exosomal shuttle RNA. PLoS One. 2010;5:e15353. doi: 10.1371/journal.pone.0015353. [DOI] [PMC free article] [PubMed] [Google Scholar]
- Fields RD. White matter in learning, cognition and psychiatric disorders. Trends Neurosci. 2008;31:361–370. doi: 10.1016/j.tins.2008.04.001. [DOI] [PMC free article] [PubMed] [Google Scholar]
- Geurts JJ, Bo L, Roosendaal SD, Hazes T, Daniels R, Barkhof F, Witter MP, Huitinga I, van der Valk P. Extensive hippocampal demyelination in multiple sclerosis. J Neuropathol Exp Neurol. 2007;66:819–827. doi: 10.1097/nen.0b013e3181461f54. [DOI] [PubMed] [Google Scholar]
- Grinberg YY, Milton JG, Kraig RP. Spreading depression sends microglia on Levy flights. PLoS One. 2011;6:e19294. doi: 10.1371/journal.pone.0019294. [DOI] [PMC free article] [PubMed] [Google Scholar]
- Grinberg YY, van Drongelen W, Kraig RP. Insulin-like growth factor-1 lowers spreading depression susceptibility and reduces oxidative stress. J Neurochem. 2012;122:221–229. doi: 10.1111/j.1471-4159.2012.07763.x. [DOI] [PMC free article] [PubMed] [Google Scholar]
- Guy J, Ellis EA, Hope GM, Emerson S. Maintenance of myelinated fibre g ratio in acute experimental allergic encephalomyelitis. Brain. 1991;114 (Pt 1A):281–294. [PubMed] [Google Scholar]
- Hartman ZC, Wei J, Glass OK, Guo H, Lei G, Yang XY, Osada T, Hobeika A, Delcayre A, Le Pecq JB, Morse MA, Clay TM, Lyerly HK. Increasing vaccine potency through exosome antigen targeting. Vaccine. 2011;29:9361–9367. doi: 10.1016/j.vaccine.2011.09.133. [DOI] [PMC free article] [PubMed] [Google Scholar]
- Hogancamp WE, Rodriguez M, Weinshenker BG. The epidemiology of multiple sclerosis. Mayo Clin Proc. 1997;72:871–878. doi: 10.4065/72.9.871. [DOI] [PubMed] [Google Scholar]
- Hulse RE, Swenson WG, Kunkler PE, White DM, Kraig RP. Monomeric IgG is neuroprotective via enhancing microglial recycling endocytosis and TNF-alpha. J Neurosci. 2008;28:12199–12211. doi: 10.1523/JNEUROSCI.3856-08.2008. [DOI] [PMC free article] [PubMed] [Google Scholar]
- Hutchison ER, Kawamoto EM, Taub DD, Lal A, Abdelmohsen K, Zhang Y, Wood WH, 3rd, Lehrmann E, Camandola S, Becker KG, Gorospe M, Mattson MP. Evidence for miR-181 involvement in neuroinflammatory responses of astrocytes. Glia. 2013;61:1018–1028. doi: 10.1002/glia.22483. [DOI] [PMC free article] [PubMed] [Google Scholar]
- Junker A, Krumbholz M, Eisele S, Mohan H, Augstein F, Bittner R, Lassmann H, Wekerle H, Hohlfeld R, Meinl E. MicroRNA profiling of multiple sclerosis lesions identifies modulators of the regulatory protein CD47. Brain. 2009;132:3342–3352. doi: 10.1093/brain/awp300. [DOI] [PubMed] [Google Scholar]
- Kovacs R, Papageorgiou I, Heinemann U. Slice cultures as a model to study neurovascular coupling and blood brain barrier in vitro. Cardiovasc Psychiatry Neurol. 2011;2011:646958. doi: 10.1155/2011/646958. [DOI] [PMC free article] [PubMed] [Google Scholar]
- Kunkler PE, Hulse RE, Kraig RP. Multiplexed cytokine protein expression profiles from spreading depression in hippocampal organotypic cultures. J Cereb Blood Flow Metab. 2004;24:829–839. doi: 10.1097/01.WCB.0000126566.34753.30. [DOI] [PMC free article] [PubMed] [Google Scholar]
- Kunkler PE, Kraig RP. Reactive astrocytosis from excitotoxic injury in hippocampal organ culture parallels that seen in vivo. J Cereb Blood Flow Metab. 1997;17:26–43. doi: 10.1097/00004647-199701000-00005. [DOI] [PMC free article] [PubMed] [Google Scholar]
- Lau P, Verrier JD, Nielsen JA, Johnson KR, Notterpek L, Hudson LD. Identification of dynamically regulated microRNA and mRNA networks in developing oligodendrocytes. J Neurosci. 2008;28:11720–11730. doi: 10.1523/JNEUROSCI.1932-08.2008. [DOI] [PMC free article] [PubMed] [Google Scholar]
- Laviola G, Hannan AJ, Macri S, Solinas M, Jaber M. Effects of enriched environment on animal models of neurodegenerative diseases and psychiatric disorders. Neurobiol Dis. 2008;31:159–168. doi: 10.1016/j.nbd.2008.05.001. [DOI] [PubMed] [Google Scholar]
- Li XB, Zhang ZR, Schluesener HJ, Xu SQ. Role of exosomes in immune regulation. J Cell Mol Med. 2006;10:364–375. doi: 10.1111/j.1582-4934.2006.tb00405.x. [DOI] [PMC free article] [PubMed] [Google Scholar]
- Lin ST, Fu YH. miR-23 regulation of lamin B1 is crucial for oligodendrocyte development and myelination. Dis Model Mech. 2009;2:178–188. doi: 10.1242/dmm.001065. [DOI] [PMC free article] [PubMed] [Google Scholar]
- Liu XF, Fawcett JR, Thorne RG, DeFor TA, Frey WH., 2nd Intranasal administration of insulin-like growth factor-I bypasses the blood-brain barrier and protects against focal cerebral ischemic damage. J Neurol Sci. 2001a;187:91–97. doi: 10.1016/s0022-510x(01)00532-9. [DOI] [PubMed] [Google Scholar]
- Liu XF, Fawcett JR, Thorne RG, Frey WH., 2nd Non-invasive intranasal insulin-like growth factor-I reduces infarct volume and improves neurologic function in rats following middle cerebral artery occlusion. Neurosci Lett. 2001b;308:91–94. doi: 10.1016/s0304-3940(01)01982-6. [DOI] [PubMed] [Google Scholar]
- Mandavilli BS, Janes MS. Detection of intracellular glutathione using ThiolTracker violet stain and fluorescence microscopy. Curr Protoc Cytom. 2010;Chapter 9(Unit 9):35. doi: 10.1002/0471142956.cy0935s53. [DOI] [PubMed] [Google Scholar]
- Mitchell HM, White DM, Kraig RP. Strategies for study of neuroprotection from cold-preconditioning. J Vis Exp. 2010 doi: 10.3791/2192. [DOI] [PMC free article] [PubMed] [Google Scholar]
- Montecalvo A, Larregina AT, Shufesky WJ, Stolz DB, Sullivan ML, Karlsson JM, Baty CJ, Gibson GA, Erdos G, Wang Z, Milosevic J, Tkacheva OA, Divito SJ, Jordan R, Lyons-Weiler J, Watkins SC, Morelli AE. Mechanism of transfer of functional microRNAs between mouse dendritic cells via exosomes. Blood. 2012;119:756–766. doi: 10.1182/blood-2011-02-338004. [DOI] [PMC free article] [PubMed] [Google Scholar]
- Nuyts A, Lee W, Bashir-Dar R, Berneman Z, Cools N. Dendritic cells in multiple sclerosis: key players in the immunopathogenesis, key players for new cellular immunotherapies? Mult Scler. 2013;19:995–1002. doi: 10.1177/1352458512473189. [DOI] [PubMed] [Google Scholar]
- Pirko I, Lucchinetti CF, Sriram S, Bakshi R. Gray matter involvement in multiple sclerosis. Neurology. 2007;68:634–642. doi: 10.1212/01.wnl.0000250267.85698.7a. [DOI] [PubMed] [Google Scholar]
- Ponomarev ED, Veremeyko T, Weiner HL. MicroRNAs are universal regulators of differentiation, activation, and polarization of microglia and macrophages in normal and diseased CNS. Glia. 2013;61:91–103. doi: 10.1002/glia.22363. [DOI] [PMC free article] [PubMed] [Google Scholar]
- Powell TJ, Jenkins CD, Hattori R, MacPherson GG. Rat bone marrow-derived dendritic cells, but not ex vivo dendritic cells, secrete nitric oxide and can inhibit T-cell proliferation. Immunology. 2003;109:197–208. doi: 10.1046/j.1365-2567.2003.01639.x. [DOI] [PMC free article] [PubMed] [Google Scholar]
- Pusic A, Kraig R. Exosome-mediated mitigation of oxidative stress and demyelination. Soc Neurosci. 2012;38:#157.01. [Google Scholar]
- Pusic A, Pusic K, Kraig R. IFNγ Stimulated dendritic cell exosomes as a therapeutic for remyelination. Soc Neurosci. 2013;39 doi: 10.1016/j.jneuroim.2013.10.014. Prog: # (in press) [DOI] [PMC free article] [PubMed] [Google Scholar]
- Ransohoff RM, Perry VH. Microglial physiology: unique stimuli, specialized responses. Annu Rev Immunol. 2009;27:119–145. doi: 10.1146/annurev.immunol.021908.132528. [DOI] [PubMed] [Google Scholar]
- Rountree RB, Mandl SJ, Nachtwey JM, Dalpozzo K, Do L, Lombardo JR, Schoonmaker PL, Brinkmann K, Dirmeier U, Laus R, Delcayre A. Exosome targeting of tumor antigens expressed by cancer vaccines can improve antigen immunogenicity and therapeutic efficacy. Cancer Res. 2011;71:5235–5244. doi: 10.1158/0008-5472.CAN-10-4076. [DOI] [PubMed] [Google Scholar]
- Schorey JS, Bhatnagar S. Exosome function: from tumor immunology to pathogen biology. Traffic. 2008;9:871–881. doi: 10.1111/j.1600-0854.2008.00734.x. [DOI] [PMC free article] [PubMed] [Google Scholar]
- Shin D, Shin JY, McManus MT, Ptacek LJ, Fu YH. Dicer ablation in oligodendrocytes provokes neuronal impairment in mice. Ann Neurol. 2009;66:843–857. doi: 10.1002/ana.21927. [DOI] [PMC free article] [PubMed] [Google Scholar]
- Thery C, Amigorena S, Raposo G, Clayton A. Isolation and characterization of exosomes from cell culture supernatants and biological fluids. Curr Protoc Cell Biol. 2006;Chapter 3(Unit 3):22. doi: 10.1002/0471143030.cb0322s30. [DOI] [PubMed] [Google Scholar]
- Viaud S, Ploix S, Lapierre V, Thery C, Commere PH, Tramalloni D, Gorrichon K, Virault-Rocroy P, Tursz T, Lantz O, Zitvogel L, Chaput N. Updated technology to produce highly immunogenic dendritic cell-derived exosomes of clinical grade: a critical role of interferon-gamma. J Immunother. 2011;34:65–75. doi: 10.1097/CJI.0b013e3181fe535b. [DOI] [PubMed] [Google Scholar]
- Xie W, Li M, Xu N, Lv Q, Huang N, He J, Zhang Y. MiR-181a regulates inflammation responses in monocytes and macrophages. PLoS One. 2013;8:e58639. doi: 10.1371/journal.pone.0058639. [DOI] [PMC free article] [PubMed] [Google Scholar]
- Yin W, Ouyang S, Li Y, Xiao B, Yang H. Immature dendritic cell-derived exosomes: a promise subcellular vaccine for autoimmunity. Inflammation. 2013;36:232–240. doi: 10.1007/s10753-012-9539-1. [DOI] [PubMed] [Google Scholar]
- Zhao X, He X, Han X, Yu Y, Ye F, Chen Y, Hoang T, Xu X, Mi QS, Xin M, Wang F, Appel B, Lu QR. MicroRNA-mediated control of oligodendrocyte differentiation. Neuron. 2010;65:612–626. doi: 10.1016/j.neuron.2010.02.018. [DOI] [PMC free article] [PubMed] [Google Scholar]
Associated Data
This section collects any data citations, data availability statements, or supplementary materials included in this article.