

Abstract
An understanding of ctenophore biology is critical for reconstructing events that occurred early in animal evolution. Towards this goal, we have sequenced, assembled, and annotated the genome of the ctenophore Mnemiopsis leidyi. Our phylogenomic analyses of both amino acid positions and gene content suggests that ctenophores rather than sponges are the sister lineage to all other animals. Mnemiopsis lacks many of the genes found in bilaterian mesodermal cell types, suggesting that these cell types evolved independently. The set of neural genes in Mnemiopsis is similar to that of sponges, indicating that sponges may have lost a nervous system. These results present a new view of early animal evolution that accounts for major losses and/or gains of sophisticated cell types, including nerve and muscle cells.
The phylogenetic position of ctenophores presents a challenge to our understanding of early animal evolution, especially as it relates to complex features such as cell types. The stark difference between the body plans of ctenophores and that of all other animals makes comparisons inherently difficult. Genomic sequencing of animals (1–4) and their closest relatives (5) provides invaluable insight into the molecular innovations contributing to the morphological diversity exhibited among modern-day animals. The vast majority of sequenced animal genomes are from Bilateria, the clade that includes most animal species (including humans and traditional model systems). Three of the four non-bilaterian metazoan lineages – Porifera (sponges), Placozoa, and Cnidaria (e.g., sea anemones, corals, hydroids, and jellyfish) – have at least one species with a sequenced genome. The absence of a complete genome sequence from the fourth non-bilaterian metazoan lineage, Ctenophora (or comb jellies), has made it difficult to resolve the earliest evolutionary events in the animal tree of life and reconstruct the likely gene inventory of the most recent common ancestor of animals.
Ctenophores are gelatinous marine animals characterized by eight longitudinal rows of ciliated comb plates that run along their oral-aboral axis (Fig. 1a–c). Their bodies consist of an inner gastrodermal and an outer epidermal layer separated by a mesoglea. The muscular system, deployed in discrete regions of the body (e.g., in the body wall, pharynx, and tentacles), is composed almost exclusively of smooth muscle cells; however, sarcomeric muscles have been reported in a single ctenophoran species (6). The ctenophore nervous system includes the apical sensory organ, a peripheral subepithelial nerve net, neurons that run through the mesoglea, and nerves associated with the tentacles. Most ctenophores, unlike all other animals, have specialized adhesive cells called colloblasts that are involved in prey capture. Most species are hermaphroditic and capable of self-fertilization. Fertilized eggs undergo a highly stereotyped ctenophore-specific cleavage program (Fig. 1d–m), with embryogenesis in most species leading to a free-swimming cydippid stage that displays most of the features of the adult body plan (i.e., development is direct).
Figure 1. Mnemiopsis leidyi life history and anatomy.

a, Adult M. leidyi (approximately 10 cm long). b, Close view of comb rows. c, Aboral view of cydippid stage. d. One-celled fertilized embryo. e–h, Early cleavage stages. i, Gastrula stage. j–m, Later development of M. leidyi embryo. Panels j–m show oral side down. Embryos are approximately 200 microns. See SOM S1 for a more detailed description of the ctenophore body plan. Panel ‘a’ courtesy of Bruno Vellutini.
Mnemiopsis leidyi is a lobate ctenophore native to the coastal waters of the western Atlantic Ocean. This species has recently invaded the Black, Caspian, and North Seas, causing major economic and ecological impact to native species in those areas. M. leidyi have been used effectively to study regeneration (7), axial patterning (8, 9), and bioluminescence (10–12). In addition, a cell lineage fate map (13–15), as well as resources for collecting and spawning, have been established (16), promoting M. leidyi as a leading model for evolutionary and developmental studies.
The phylogenetic relationship of ctenophores to other animals has been a source of long-standing debate. The group lacks a reliable fossil record and, on the basis of morphological features, ctenophores have been assigned various positions in animal phylogeny, including as sister to cnidarians in a clade called Coelenterata (sometimes called Radiata) (Fig. 2a) and as sister to Bilateria (Fig. 2b). Phylogenetic analyses of ribosomal RNA show little or no support uniting ctenophores with cnidarians or bilaterians and have tended to place ctenophores sister to a clade that includes all animals besides Porifera (Fig. 2c). Phylogenomic studies have also produced conflicting results, with a series of multi-gene analysis placing ctenophores sister to all other metazoans (Fig. 2d) (17, 18) and another, based primarily on ribosomal proteins, supporting the Coelenterata hypothesis (Fig. 2a) (19). Yet another study, also based primarily on ribosomal characters but with expanded taxon sampling, upheld the relationship of ctenophores as sister to all metazoans except Porifera (similar to Fig. 2c) (20). On the basis of its simple morphology, it has been suggested that Placozoa is the sister group to all animals (Fig. 2e) (21). Ctenophores have also been placed in a clade of non-bilaterian animals called “Diploblastica”, based on curated set of nuclear and mitochondrial proteins and a small morphological matrix (Fig. 2f) (22). The most recent analyses of the placement of sponges and ctenophores indicated that supermatrix analyses of the publicly available data are sensitive to gene selection, taxon sampling, model selection, and other factors (23). The inconsistency of reports as to the phylogenetic position of ctenophores (Table S1) has made it difficult to evaluate morphological, developmental, and experimental data involving these animals in an evolutionary context, complicating efforts to understand the early evolution of animals.
Figure 2. Previously proposed relationships of the five deep clades of animals.
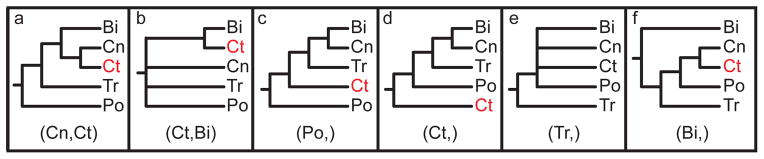
The label at the bottom of each pane corresponds to the header of Table 1. (a) Coelenterata hypothesis. (b) Ctenophora as sister to Bilateria. (c) Porifera as sister group to the rest of Metazoa. (d) Ctenophora as sister group to the rest of Metazoa. (e) Placozoa as sister group to the rest of Metazoa. (f) Diploblastica hypothesis. We see no support in our any of our analyses for the hypotheses in panels a, e, and f, and very little support for panel b (see Table 1). Ct = Ctenophora, Po = Porifera, Tr = Placozoa, Cn = Cnidaria, and Bi = Bilateria.
Genome sequencing and assembly
Genomic DNA was isolated from the embryos of two self-fertilized adult M. leidyi collected in Woods Hole, Massachusetts, USA. DNA from one embryo pool was used to construct a library for Roche 454 sequencing. We generated 7.3 million raw reads, which yielded 2.5 Gb of sequence. Using the Phusion assembler (24), we assembled this data into 24,884 contigs, constituting 150 Mb of sequence and providing roughly 12-fold coverage of the genome. DNA from the other embryo pool was used to create two mate-pair libraries for Illumina GA-II sequencing, one with a 3-kilobase insert and the other with a 4-kilobase insert. After removing duplicate read-pairs, 4.2 million and 2.6 million pairs remained for the 3- and 4-kilobase insert libraries, respectively. These reads were used to construct scaffolds of the original set of Roche 454 contigs. The final assembly consists of 5,100 scaffolds, resulting in 160-fold physical coverage and an N50 of 187 kilobases (SOM S3). To test the accuracy and completeness of our assembly, we aligned 99.4% of 15,752 public ESTs to our assembly. The average coverage of each alignable EST, as determined by baa.pl (25), was 98.2%. In 94.8% of cases, a single EST mapped completely to a single scaffold. These numbers suggest that the assembly is both complete and accurately assembled.
Characteristics of the Mnemiopsis leidyi genome
The M. leidyi genome is among the smallest 7% of genomes when compared to those catalogued in the Animal Genome Size Database (26) and is densely packed with genic sequences. It encodes 16,545 predicted protein-coding loci, which comprises 58% of the genome, and we conservatively assign 44% of these gene predictions into homology groups with non-ctenophores. The average length of an unspliced M. leidyi transcript is 5.8 kilobases. Eight percent of predicted genes are embedded within other genes. This number of nested intronic genes is high compared to other genomes (Table S2), but may be inflated due to a subset of these being alternatively expressed exons. The level of repetitive sequence in the M. leidyi genome is low to moderate, as compared to other metazoans (Tables S3–4); this has made it possible to produce a high-quality genome assembly based on paired-end and mate-pair sequencing alone. Additional characteristics of this genome are presented in the supplementary online material (Tables S5–S10).
Phylogenetic position of Mnemiopsis leidyi
The availability of the complete genome of M. leidyi has allowed us to improve upon the ctenophore sampling used in previous phylogenomic analyses of gene sequence evolution. We assessed two data matrices that differ in breadth of taxon sampling and fraction of missing data: a “Genome Set” that includes only data from complete genomes (13 animals, 19.6% missing data) and an “EST Set” that includes partial genomic data from many taxa (58 animals, 64.9% missing data). We analyzed both matrices using maximum-likelihood (with the GTR+Γ model as implemented in RaxML (27)) and Bayesian (with the CAT model as implemented in PhyloBayes (28)) methods. To understand the effect of outgroup selection on our ingroup topology, we included four different sets of non-metazoan outgroups (Table S11) in each combination of method and matrix. This multifactorial strategy yielded a total of 16 analyses (Table 1).
Table 1.
Support for various hypotheses across 16 phylogenetic analyses
| Position of Ctenophora | Robustness of Cnidaria + Bilateria and Parahoxozoa | |||||||
|---|---|---|---|---|---|---|---|---|
|
| ||||||||
 (Ct,) |
 (Po,) |
 (Ct, Po) |
 (Cn, Ct) |
 (Cn, Bi) |
 (Bi, Cn, Tr) |
|||
|
| ||||||||
|
GENOME SET 104,840 cols 13 animals 80.4% occup. |
ML | Opisthokonta | 47 | 0 | 53 | 0 | 18 | 90 |
| Holozoa | 31 | 0 | 69 | 0 | 27 | 90 | ||
| Choanimalia | 100 | 0 | 0 | 0 | 41 | 100 | ||
| Animalia | * | * | ** | 0 | 92 | 100 | ||
|
| ||||||||
| Bayes | Opisthokonta | 0 | 0 | 100 | 0 | 100 | 100 | |
| Holozoa | 0 | 0 | 100 | 0 | 100 | 100 | ||
| Choanimalia | 0 | 7 | 93 | 0 | 100 | 100 | ||
| Animalia | * | * | ** | 0 | 100 | 100 | ||
|
| ||||||||
|
EST SET 88,384 cols 58 animals 35.1% occup. |
ML | Opisthokonta | 96 | 0 | 0 | 0 | 100 | 82 |
| Holozoa | 96 | 0 | 0 | 0 | 100 | 83 | ||
| Choanimalia | 93 | 0 | 0 | 0 | 100 | 62 | ||
| Animalia | * | * | ** | 0 | 100 | 35 | ||
|
| ||||||||
| Bayes*** | Opisthokonta | 71 | 29 | 0 | 0 | 73 | 72 | |
| Holozoa | 13 | 64 | 0 | 0 | 33 | 30 | ||
| Choanimalia | 2 | 98 | 0 | 0 | 100 | 99 | ||
| Animalia | * | * | ** | 0 | 100 | 97 | ||
Two amino acid matrices (“Genome Set” and “EST Set”) were analyzed with two different method/model combinations (ML = maximum-likelihood with GTR+Γ model using RaxML (27) and Bayes = Bayesian with CAT model using PhyloBayes (28)), using four different sets of non-metazoan outgroups for each analysis (Opisthokonta = fungi, amoeboids, and choanoflagellates; Holozoa = amoeboids and choanoflagellates; Choanimalia = choanoflagellates; and Animalia = no outgroups). Columns represent support for tested hypotheses, and most hypotheses are represented as trees in Fig. 2. Ct = Ctenophora, Po = Porifera, Cn = Cnidaria, Tr = Placozoa, Bi = Bilateria. In the absence of non-animal outgroups:
(Ct,) and (Po,) are concordant with all possible topologies;
(Ct, Po) is the same as (Bi, Cn, Tr);
Despite an average runtime of 205 days per run, none of the Bayesian analyses on the EST data set converged (maxdiff > 0.3).
We found no support in any of these analyses for Coelenterata (Cn, Ct), Diploblastica (Bi,), or Placozoa being the sister lineage to the rest of animals (Tr,) (Table 1; Fig. S1). We recovered broad support for a sister relationship between Cnidaria and Bilateria (Cn, Bi) and for a clade of Placozoa, Cnidaria, and Bilateria (Tr, Cn, Bi). Maximum-likelihood analyses support the placement of Ctenophora as sister group to all other Metazoa (Ct,) regardless of data matrix used (Fig. 3). The Bayesian analysis of the genome data set strongly supports a clade of Ctenophora and Porifera (Ct, Po) as the sister group to all other Metazoa. This relationship also receives some support in our maximum likelihood trees, and we suspect the result is due to poor taxon sampling in the Genome Set. However, until there are more complete genomes available to test this hypothesis, this relationship cannot be completely dismissed. Despite an average runtime of 205 days per run, none of the Bayesian analyses on the EST data set converged (maxdiff > 0.3). The lack of convergence in these analyses suggests that the application of this method to this dataset is insufficent to resolve this relationship.
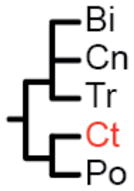
Figure 3. Tree produced by maximum-likelihood analysis of the EST Set.

Tree was produced from a matrix consisting of 242 genes and 104,840 amino acid characters. Circles on nodes indicate 100% bootstrap support. Support placing ctenophores as sister to the rest of Metazoa is 96% of 100 bootstrap replicates.
The analyses run without non-metazoan outgroups show strong support for a monophyletic clade of Cnidaria and Bilateria (Table 1). This evidence contradicts the idea that long-branch attraction between ctenophores and the outgroup are masking a close relationship between ctenophores and cnidarians (19). Another common misconception, based on the extremely high evolutionary rates in the mitochondrial genomes of ctenophores (29, 30), is that the phylogenetic placement of these animals is essentially random, due to equally extreme rates of evolution in the nuclear genomes of ctenophores. We have found instead that the branch lengths in the phylogenetic analyses of our concatenated protein matrices show M. leidyi branches to be of similar length to those of Drosophila melanogaster, therefore exhibiting high (but not extreme) amino acid replacement rates (Tables S12–13).
The conflict between the maximum-likelihood and Bayesian analysis of the amino acid matrix make it difficult to determine from these analyses whether Ctenophora or Porifera are the sister group to the rest of the Metazoa, but there is substantial support for ctenophore as sister group to the rest of animals (Table 1). Furthermore, our results strongly show that Placozoa, Cnidaria, and Bilateria (i.e., Parahoxozoa) are monophyletic. Given the sensitivity of the molecular sequence evolution analyses to taxon sampling and inference method, consistent with other recent analyses (23), we also examined the evolution of gene content.
We clustered genes using default parameters in OrthoMCL (31) and used these clusters to construct a gene presence/absence matrix. Using RAxML with a GTR+Γ model, we conducted a weighted likelihood-based analysis on this matrix. We then calibrated sites on the basis of the congruence of columns to known bilaterian relationships with the “-f u” parameter in RAxML. The result of this analysis was a tree supporting Ctenophora as the sister group to all other animals (Ct,) (Fig. 4) and the rejection of all other alternative topologies (in Fig. 2) at the 5% confidence level by likelihood-based statistical hypothesis testing (Table S14). The pattern of presence and absence of gene families and signaling pathway components seen in previous studies is consistent with these results (32–36). Our re-analysis of an expanded set of near intron pairs (37) was also consistent with these results (Fig. S2).
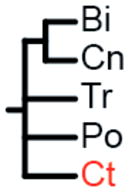
Figure 4. Tree produced by maximum-likelihood analysis of gene content.

Tree was produced from a matrix consisting of 23,910 binary characters indicating the presence or absence of a particular species within a cluster of genes. Clusters were produced with default settings of OrthoMCL. Columns consistent with known relationships within Bilateria were up-weighted while characters conflicting characters were down-weighted. Matrix was analyzed with RAxML under the GTR gamma model of rate heterogeneity. All nodes receive 100% bootstrap support. Constraining known relationships did not affect the position of Ctenophora (Fig. S4).
Cell signaling components in Mnemiopsis leidyi
Across Bilateria, there are seven major cell signaling pathways that play important roles during embryological development: Wnt, TGF-β, receptor tyrosine kinase (RTK), Notch, nuclear receptor, Hedgehog, and JAK/STAT (38). Comparisons of non-bilaterian (2–4) and non-metazoan genomes (5, 39) show that some of these signaling pathways evolved prior to the evolution of animal multicellularity, others are specific to metazoan evolution, and some were lineage-specific innovations. The cell signaling components present in the M. leidyi genome include the RTK family, which predates the origin of Metazoa (40); the TGF-β signaling pathway (33), thought to have evolved in the metazoan common ancestor (39); and the canonical Wnt signaling pathway (34). Notably absent from both the TGF-β and Wnt pathways are the major bilaterian antagonists; members of the Wnt/PCP pathway, such as Flamingo and Strabismus, are not present. Relatively few components of the Notch pathway (Tables S15–16) are present and many of those lack key diagnostic domains. M. leidyi also lacks most of the major genes necessary for Hedgehog signaling (e.g., the Hedgehog ligand, the smoothened receptor, and SUFU). Finally, the JAK/STAT pathway is most likely a bilaterian innovation, as there are no true JAK orthologs in M. leidyi or any other non-bilaterians reported to date.
Neural components in Mnemiopsis leidyi
Ctenophores possess a nervous system, consisting of a nerve net, mesogleal fibers, and tentacular nerves (41). In contrast to the cnidarian nervous system, which contains an ectodermal and endodermal nerve net, the nerve nets of ctenophores consist of polygonal nerve cords spread under the ectodermal epithelium; these nerve nets show high levels of regional specialization and concentrations associated with the apical sensory organ/polar fields and tentacle bulbs, structures without clear homologs in any other animal groups (42). Unlike in cnidarians and bilaterians, immunological investigations have failed to detect the presence of serotonin in ctenophores (43). Ctenophore nervous systems are also unique in their abundance of synaptic connections and their unique pre-synaptic morphology (44).
Many of the genes known to be critical to the nervous system of bilaterians and cnidarians are present in the sponge A. queenslandica, an animal without a nervous system. It had been hypothesized that the origin of the nervous system in non-sponges coincided with the origin of a few neural components that are absent from A. queenslandica (4, 45), but our phylogenetic results and the absence of these same components in M. leidyi challenge this hypothesis. Both A. queenslandica and M. leidyi contain orthologs of transcription factors involved in bilaterian and cnidarian neural development, including lhx (46), bHLH, six, gli, and sox (classes B, C, E, F) genes. The neural differentiation RNA binding genes ELAV and Musashi, as well as the axon guidance genes neurexin, semaphorin, plexin, and an ephrin receptor, are all present in both A. queenslandica and M. leidyi. However, netrin, slit, and unc-5, involved in axon guidance, are absent from both genomes.
Many of the genes involved in the formation of bilaterian synapses and neural differentiation are present in both A. queenslandica and M. leidyi - but, again, sponges and ctenophores lack a similar set of synaptic scaffolding genes (Tables S17–18), all of which are present in cnidarians and bilaterians (Fig. 5). The pattern of presence and absence in these scaffolding genes is consistent with these genes being primitively absent in sponges and ctenophores. Almost all of the enzymes involved in the biosynthesis of dopamine and other catecholamine neurotransmitters are also absent from both A. queenslandica and M. leidyi (Table S19). An exception to this shared pattern with sponges is the presence of two definitive opsin genes in M. leidyi, but not A. queenslandica, that are expressed in photocytes (light producing cells), as well as in putative photosensory cells in the apical sense organ (12).
Figure 5. The origin of post-synaptic genes.

A possible configuration for post-synaptic genes. Genes are colored by their node of origin (figure inset). Accession numbers of M. leidyi genes are in Table S16.
Mesoderm components in Mnemiopsis leidyi
Ctenophores possess several cell types (such as distinct muscle cells and mesesenchymal cells) that, in bilaterians, are characteristically derived from mesodermal tissues. Cell lineage studies (14) have indicated that these cells are derived from a true endomesoderm because mesodermal cells are generated from precursors that also give rise to the endodermal portions of the gut; this is similar to the endomesodermal origins of mesoderm in virtually all bilaterians. However, screening the M. leidyi genome reveals a surprising result, as almost none of the genes involved in bilaterian mesoderm development can be found (Fig. 6; Tables S20–21). Functional components of the fibroblast growth factor, notch, hedgehog, and the nodal (TGF-β superfamily) pathways, all of which are important in the segregation of mesoderm in different bilaterian forms, are also not observed. Other genes known to be involved in bilaterian mesoderm development, such as gli/glis genes, are expressed in neural (but not mesodermal) cells in M. leidyi (47).
Figure 6. Inventory of myogenic components in Mnemiopsis leidyi.

Components present in the M. leidyi genome are in blue and names are underlined. Absent components are in red. (A) The main structural components of smooth muscle are present in the M. leidyi genome. All structural components are present except for Troponin (in red). (B) The majority of signaling molecules and transcription factors involved in specifying and differentiating the mesoderm of bilaterian animals are absent from the genome of M. leidyi. The asterisks next to Snail and GATA indicate that these components have been identified in the transcriptomes of other ctenophores.
Mesoderm and neural components also absent from other ctenophores
To test if these absences from the M. leidyi genome were true for other ctenophores, we searched the deeply sequenced transcriptomes of seven other ctenophore species (Bathyctena chuni, Beroe forskali, Charistephane fugiens, Euplokamis dunlapae, Hormiphora californensis, Lampea lactea, and Thalassocalyce inconstans) for FGF, hedgehog, nodal, twist, snail, Lbx, NK4, NK3, NK2, Myf5, Noggin, Mrf4, Myogenin, Eomesoderm, GATA, MyoD, and troponin. We were able to identify putative snail genes in T. inconstans and E. dunlapae, and putative GATA genes in five of the seven species. We were unable to identify the other 15 missing genes in any of these ctenophore transcriptomes (Tables S22–23). A phylogenetic analysis of ionotropic glutamate receptor sequences from M. leidyi and these ctenophore transcriptomes suggests that the ctenophore receptors form a sister clade to the bilaterian glutamate receptors (Fig. S3). Ionotropic glutamate receptors are absent from A. queenslandica, but are present in the transcriptomes of eight other sponges (48). The tree topology suggest that the ctenophore sequences descended from an ancestral glutamate receptor that differentiated into AMPA, NMDA, kainate-type, and delta2-like glutamate receptors after ctenophores diverged from the rest of animals. These results indicate that, within ctenophores, the majority of absences are not specific to the M. leidyi lineage, but also that there are some intriguing differences in gene content between ctenophores themselves.
Discussion and Conclusion
The sequence of the M. leidyi genome has given rise to multiple categories of evidence that support the placement of ctenophores as the sister group to all other animals, a conclusion supported by phylogenetic analysis of amino acid matrices from concatenated protein sequences. However, these analyses are sensitive to taxon sampling and phylogenetic methods and, therefore, provide some support for alternative hypotheses. With a ctenophore genome in hand, we show that gene content data supports Ctenophora as the sister group to all other animals and statistically reject competing hypotheses. It will be important to test this result once more genomic data is available from other ctenophores, sponges, and other relevant groups. Nevertheless, this result is congruent with the structure and inventory of a variety of gene families and signaling pathways, as well as with genes essential to neural and mesodermal cell types.
It appears that much of the genetic machinery necessary for a nervous system was present in the ancestor of all extant animals. This pattern suggests that a less elaborate nervous system was present in the metazoan ancestor and was secondarily reduced in placozoans and sponges. The alternative is that neural cell types arose independently in both the ctenophore lineage and the lineage that led to cnidarians and bilaterians, which might explain some of the unique aspects of the ctenophore nervous system. Resolving these alternative hypotheses will require functionally characterizing the nervous system-related genes in ctenophores and sponges.
Like the nervous system, the mesoderm appears to have had a complex evolutionary history. Our results are consistent with several alternative hypotheses. One possibility is that the mesoderm was present in the most recent common ancestor of ctenophores and bilaterians but was lost in sponges, placozoans, and cnidarians. However, given the absence of the majority of genes involved in the specification and differentiation of the bilaterian mesoderm from the M. leidyi genome, it appears more likely that ctenophores independently evolved mesodermal cell types after they diverged from the rest of animals. This interpretation is compatible with a recent report that striated musculature evolved independently in bilaterians, cnidarians, and in the ctenophore Euplokamis dunlapae (49).
The implications of these findings go well-beyond the rearrangement of the branches of the metazoan tree of life, arguing for a new way of thinking regarding the emergence and/or conservation of what heretofore were considered to be unique and indispensible biological features. Likewise, theories on the evolution of animal multicellularity have to be reevaluated. This evolutionary framework, along with the comprehensive genomic resources made available through this study, will undoubtedly yield myriad new discoveries about our most distant animal relatives, many of which will shed new light not only on the biology of these extant organisms, but the evolutionary history of all animal species, including our own.
METHODS
Genome sequencing and assembly
We isolated genomic DNA from the embryos of a self-fertilized adult and sequenced this DNA with Roche 454 sequencing. We generated another pool of genomic DNA from the embryos of a second self-fertilized adult and sequenced this DNA using Illumina GA-II mate-pair sequencing. These data were assembled using the Phusion assembler (24). We have deposited the assembly at GenBank as project accession AGCP00000000.
Transcript sequencing and assembly
We isolated RNA from mixed-stage M. leidyi embryos and sequenced this material using Illumina GA-II sequencing. We assembled these data into transcripts using cufflinks (50) and Trinity (51). Assembled transcripts are available through the Mnemiopsis leidyi Genome Project Web site, at http://research.nhgri.nih.gov/mnemiopsis/.
Gene prediction
We generated gene model predictions using a range of gene prediction programs and then used EvidenceModeler (EVM) (52) to combine models, transcripts, and sequence similarity to other protein data sets into a final set of protein-coding gene predictions. These are available through the Mnemiopsis leidyi Genome Project Web site (http://research.nhgri.nih.gov/mnemiopsis/).
Phylogenetic analysis of concatenated gene matrices
We analyzed two matrices constructed from concatenated protein sequences. One consisted of M. leidyi amino acids added to a genome-based data matrix that was reported in the A. queenslandica genome paper (4). The second used a phenetic sequence clustering method as described previously (18). We generated maximum-likelihood trees with the GTR+Γ model using RAxML (27) and Bayesian trees with the CAT model using Phylobayes (28). All alignments and trees are available at http://research.nhgri.nih.gov/manuscripts/Baxevanis/science2013_supplement/
Phylogenetic analysis of gene content
We assembled a presence/absence matrix of gene clusters and analyzed these data with RAxML under the GTR gamma model of rate heterogeneity. We used known bilaterian relationships to generate a weight matrix in RAxML. We used per site log likelihoods generated in RAxML as input to CONSEL (53) to generate p-values for alternative hypotheses.
Supplementary Material
Acknowledgments
Supported by the Intramural Research Program of the National Human Genome Research Institute, National Institutes of Health and NASA and NSF grants to MQM. JFR received additional support from the Sars International Centre for Marine Molecular Biology and the University of Bergen. We thank A. Young, B. Schmidt, N. Gurson, R. Legaspi, B. Novotny, and R. Blakesley, who were responsible for the sequencing performed at NISC; — A. Prasad, D. Gildea, N. Trivedi, A. Yun, K. Siewert, D. Leja, S. Bond, and G. Bouffard at NHGRI; —A. Hejnol, D. Chourrout, L. Leclère, G. Richards, F. Rentzsch, C. Martin, H. Hausen, S. Henriet, S. Church, and S9 at Sars; — B. Vellutini for the photo of M. leidyi used in Fig. 1a; W. Browne for access to additional RNA-seq data from early developmental stages of M. leidyi; J. Lehmann for supplying an updated near intron pair matrix. C. Trapnell for help with the Bowtie short-read aligner and Cufflinks transcript assembly program; M. Srivastava for phylogenetic data sets and advice; I. Ruiz-Trillo and the Origins of Multicellularity Sequencing Project, Broad Institute of Harvard and MIT for use of their genomic data; D. Rokhsar and JGI for use of their genomic data; and other researchers whose publicly available sequence data was used in this study. The views expressed in this paper do not necessarily reflect the views of those acknowledged. We dedicate this manuscript to the pioneering work of the late Sebastian Beroe of the Stazione Zoologica in Naples. The authors declare no competing financial interests. The genome sequence data can be accessed from GenBank as project accession AGCP00000000 and from http://research.nhgri.nih.gov/mnemiopsis/.
Footnotes
Contributions are as follows: Genome and RNA-seq sequencing, assembly: NISC, J.C.M. Annotation: J.F.R., K.P., C.E.S., P.H., N.P., A.N., R.T.M., B.J.K., and T.G.W. Analysis: J.F.R., K.P., C.E.S., D.K.S., B.J.K., P.H., N.P., M.Q.M., and A.D.B. Additional ctenophore data: S.H.D., W.R.F. Phylogenetics: J.F.R., S.A.S., and C.W.D. Writing: J.F.R., K.P., C.E.S., D.K.S., R.T.M., C.W.D., M.Q.M., and A.D.B. Project design and coordination: J.F.R., M.Q.M., and A.D.B.
References and Notes
- 1.Chapman JA, Kirkness EF, Simakov O, Hampson SE, Mitros T, Weinmaier T, Rattei T, Balasubramanian PG, Borman J, Busam D, Disbennett K, Pfannkoch C, Sumin N, Sutton GG, Viswanathan LD, Walenz B, Goodstein DM, Hellsten U, Kawashima T, Prochnik SE, Putnam NH, Shu S, Blumberg B, Dana CE, Gee L, Kibler DF, Law L, Lindgens D, Martinez DE, Peng J, Wigge PA, Bertulat B, Guder C, Nakamura Y, Ozbek S, Watanabe H, Khalturin K, Hemmrich G, Franke A, Augustin R, Fraune S, Hayakawa E, Hayakawa S, Hirose M, Hwang JS, Ikeo K, Nishimiya-Fujisawa C, Ogura A, Takahashi T, Steinmetz PR, Zhang X, Aufschnaiter R, Eder MK, Gorny AK, Salvenmoser W, Heimberg AM, Wheeler BM, Peterson KJ, Bottger A, Tischler P, Wolf A, Gojobori T, Remington KA, Strausberg RL, Venter JC, Technau U, Hobmayer B, Bosch TC, Holstein TW, Fujisawa T, Bode HR, David CN, Rokhsar DS, Steele RE. The dynamic genome of Hydra. Nature. 2010;464:592–596. doi: 10.1038/nature08830. [DOI] [PMC free article] [PubMed] [Google Scholar]
- 2.Putnam NH, Srivastava M, Hellsten U, Dirks B, Chapman J, Salamov A, Terry A, Shapiro H, Lindquist E, Kapitonov VV, Jurka J, Genikhovich G, Grigoriev IV, Lucas SM, Steele RE, Finnerty JR, Technau U, Martindale MQ, Rokhsar DS. Sea anemone genome reveals ancestral eumetazoan gene repertoire and genomic organization. Science. 2007;317:86–94. doi: 10.1126/science.1139158. [DOI] [PubMed] [Google Scholar]
- 3.Srivastava M, Begovic E, Chapman J, Putnam NH, Hellsten U, Kawashima T, Kuo A, Mitros T, Salamov A, Carpenter ML, Signorovitch AY, Moreno MA, Kamm K, Grimwood J, Schmutz J, Shapiro H, Grigoriev IV, Buss LW, Schierwater B, Dellaporta SL, Rokhsar DS. The Trichoplax genome and the nature of placozoans. Nature. 2008;454:955–960. doi: 10.1038/nature07191. [DOI] [PubMed] [Google Scholar]
- 4.Srivastava M, Simakov O, Chapman J, Fahey B, Gauthier ME, Mitros T, Richards GS, Conaco C, Dacre M, Hellsten U, Larroux C, Putnam NH, Stanke M, Adamska M, Darling A, Degnan SM, Oakley TH, Plachetzki DC, Zhai Y, Adamski M, Calcino A, Cummins SF, Goodstein DM, Harris C, Jackson DJ, Leys SP, Shu S, Woodcroft BJ, Vervoort M, Kosik KS, Manning G, Degnan BM, Rokhsar DS. The Amphimedon queenslandica genome and the evolution of animal complexity. Nature. 2010;466:720–726. doi: 10.1038/nature09201. [DOI] [PMC free article] [PubMed] [Google Scholar]
- 5.King N, Westbrook MJ, Young SL, Kuo A, Abedin M, Chapman J, Fairclough S, Hellsten U, Isogai Y, Letunic I, Marr M, Pincus D, Putnam N, Rokas A, Wright KJ, Zuzow R, Dirks W, Good M, Goodstein D, Lemons D, Li W, Lyons JB, Morris A, Nichols S, Richter DJ, Salamov A, Sequencing JG, Bork P, Lim WA, Manning G, Miller WT, McGinnis W, Shapiro H, Tjian R, Grigoriev IV, Rokhsar D. The genome of the choanoflagellate Monosiga brevicollis and the origin of metazoans. Nature. 2008;451:783–788. doi: 10.1038/nature06617. [DOI] [PMC free article] [PubMed] [Google Scholar]
- 6.Mackie GO, Mills CE, Singla CL. Structure and Function of the Prehensile Tentilla of Euplokamis (Ctenophora, Cydippida) Zoomorphology. 1988;107:319–337. [Google Scholar]
- 7.Henry JQ, Martindale MQ. Regulation and regeneration in the ctenophore Mnemiopsis leidyi. Dev Biol. 2000;227:720–733. doi: 10.1006/dbio.2000.9903. [DOI] [PubMed] [Google Scholar]
- 8.Martindale MQ, Finnerty JR, Henry JQ. The Radiata and the evolutionary origins of the bilaterian body plan. Mol Phylogenet Evol. 2002;24:358–365. doi: 10.1016/s1055-7903(02)00208-7. [DOI] [PubMed] [Google Scholar]
- 9.Pang K, Martindale MQ. Developmental expression of homeobox genes in the ctenophore Mnemiopsis leidyi. Dev Genes Evol. 2008;218:307–319. doi: 10.1007/s00427-008-0222-3. [DOI] [PubMed] [Google Scholar]
- 10.Anctil M. Ultrastructure of the Luminescent System of the Ctenophore Mnemiopsis-Leidyi. Cell Tissue Res. 1985;242:333–340. [Google Scholar]
- 11.Freeman G, Reynolds GT. The development of bioluminescence in the ctenophore Mnemiopsis leidyi. Dev Biol. 1973;31:61–100. doi: 10.1016/0012-1606(73)90321-7. [DOI] [PubMed] [Google Scholar]
- 12.Schnitzler CE, Pang K, Powers ML, Reitzel AM, Ryan JF, Simmons D, Tada T, Park M, Gupta J, Brooks SY. Genomic organization, evolution, and expression of photoprotein and opsin genes in Mnemiopsis leidyi: a new view of ctenophore photocytes. BMC Biology. 2012;10:107. doi: 10.1186/1741-7007-10-107. [DOI] [PMC free article] [PubMed] [Google Scholar]
- 13.Martindale MQ, Henry JQ. Reassessing embryogenesis in the Ctenophora: the inductive role of e1 micromeres in organizing ctene row formation in the ‘mosaic’ embryo, Mnemiopsis leidyi. Development. 1997;124:1999–2006. doi: 10.1242/dev.124.10.1999. [DOI] [PubMed] [Google Scholar]
- 14.Martindale MQ, Henry JQ. Intracellular fate mapping in a basal metazoan, the ctenophore Mnemiopsis leidyi, reveals the origins of mesoderm and the existence of indeterminate cell lineages. Dev Biol. 1999;214:243–257. doi: 10.1006/dbio.1999.9427. [DOI] [PubMed] [Google Scholar]
- 15.Reverberi G, Ortolani G. On the origin of the ciliated plates and mesoderm in the Ctenophore. Acta embryologiae et morphologiae experimentalis. 1963;6:175–199. [Google Scholar]
- 16.Pang K, Martindale MQ. Mnemiopsis leidyi Spawning and Embryo Collection. CSH Protoc. 2008;2008 doi: 10.1101/pdb.prot5085. pdb prot5085. [DOI] [PubMed] [Google Scholar]
- 17.Dunn CW, Hejnol A, Matus DQ, Pang K, Browne WE, Smith SA, Seaver E, Rouse GW, Obst M, Edgecombe GD, Sorensen MV, Haddock SH, Schmidt-Rhaesa A, Okusu A, Kristensen RM, Wheeler WC, Martindale MQ, Giribet G. Broad phylogenomic sampling improves resolution of the animal tree of life. Nature. 2008;452:745–749. doi: 10.1038/nature06614. [DOI] [PubMed] [Google Scholar]
- 18.Hejnol A, Obst M, Stamatakis A, Ott M, Rouse GW, Edgecombe GD, Martinez P, Baguna J, Bailly X, Jondelius U, Wiens M, Muller WE, Seaver E, Wheeler WC, Martindale MQ, Giribet G, Dunn CW. Assessing the root of bilaterian animals with scalable phylogenomic methods. Proc Biol Sci. 2009;276:4261–4270. doi: 10.1098/rspb.2009.0896. [DOI] [PMC free article] [PubMed] [Google Scholar]
- 19.Philippe H, Derelle R, Lopez P, Pick K, Borchiellini C, Boury-Esnault N, Vacelet J, Renard E, Houliston E, Queinnec E, Da Silva C, Wincker P, Le Guyader H, Leys S, Jackson DJ, Schreiber F, Erpenbeck D, Morgenstern B, Worheide G, Manuel M. Phylogenomics revives traditional views on deep animal relationships. Curr Biol. 2009;19:706–712. doi: 10.1016/j.cub.2009.02.052. [DOI] [PubMed] [Google Scholar]
- 20.Pick KS, Philippe H, Schreiber F, Erpenbeck D, Jackson DJ, Wrede P, Wiens M, Alie A, Morgenstern B, Manuel M, Worheide G. Improved phylogenomic taxon sampling noticeably affects non-bilaterian relationships. Mol Biol Evol. 2010 doi: 10.1093/molbev/msq089. [DOI] [PMC free article] [PubMed] [Google Scholar]
- 21.Schierwater B. My favorite animal, Trichoplax adhaerens. Bioessays. 2005;27:1294–1302. doi: 10.1002/bies.20320. [DOI] [PubMed] [Google Scholar]
- 22.Schierwater B, Eitel M, Jakob W, Osigus HJ, Hadrys H, Dellaporta SL, Kolokotronis SO, Desalle R. Concatenated analysis sheds light on early metazoan evolution and fuels a modern “urmetazoon” hypothesis. PLoS Biol. 2009;7:e20. doi: 10.1371/journal.pbio.1000020. [DOI] [PMC free article] [PubMed] [Google Scholar]
- 23.Nosenko T, Schreiber F, Adamska M, Adamski M, Eitel M, Hammel J, Maldonado M, Müller WEG, Nickel M, Schierwater B. Deep metazoan phylogeny: When different genes tell different stories. Molecular Phylogenetics and Evolution. 2013 doi: 10.1016/j.ympev.2013.01.010. [DOI] [PubMed] [Google Scholar]
- 24.Mullikin JC, Ning Z. The phusion assembler. Genome Res. 2003;13:81–90. doi: 10.1101/gr.731003. published online EpubJan. [DOI] [PMC free article] [PubMed] [Google Scholar]
- 25.Ryan JF. Baa. pl: A tool to evaluate de novo genome assemblies with RNA transcripts. 2013 arXiv preprint arXiv:1309.2087. [Google Scholar]
- 26.Gregory TR. TR Gregory. 2001. [Google Scholar]
- 27.Stamatakis A. RAxML-VI-HPC: maximum likelihood-based phylogenetic analyses with thousands of taxa and mixed models. Bioinformatics. 2006;22:2688–2690. doi: 10.1093/bioinformatics/btl446. [DOI] [PubMed] [Google Scholar]
- 28.Lartillot N, Lepage T, Blanquart S. PhyloBayes 3: a Bayesian software package for phylogenetic reconstruction and molecular dating. Bioinformatics. 2009;25:2286–2288. doi: 10.1093/bioinformatics/btp368. [DOI] [PubMed] [Google Scholar]
- 29.Kohn AB, Citarella MR, Kocot KM, Bobkova YV, Halanych KM, Moroz LL. Rapid evolution of the compact and unusual mitochondrial genome in the ctenophorePleurobrachia bachei. Molecular Phylogenetics and Evolution. 2012;63:203–207. doi: 10.1016/j.ympev.2011.12.009. [DOI] [PMC free article] [PubMed] [Google Scholar]
- 30.Pett W, Ryan JF, Pang K, Mullikin JC, Martindale MQ, Baxevanis AD, Lavrov DV. Extreme mitochondrial evolution in the ctenophore Mnemiopsis leidyi: Insight from mtDNA and the nuclear genome. Mitochondrial DNA. 2011;22:130–142. doi: 10.3109/19401736.2011.624611. [DOI] [PMC free article] [PubMed] [Google Scholar]
- 31.Li L, Stoeckert CJ, Roos DS. OrthoMCL: identification of ortholog groups for eukaryotic genomes. Genome research. 2003;13:2178–2189. doi: 10.1101/gr.1224503. [DOI] [PMC free article] [PubMed] [Google Scholar]
- 32.Liebeskind BJ, Hillis DM, Zakon HH. Evolution of sodium channels predates the origin of nervous systems in animals. Proceedings of the National Academy of Sciences. 2011;108:9154–9159. doi: 10.1073/pnas.1106363108. [DOI] [PMC free article] [PubMed] [Google Scholar]
- 33.Pang K, Ryan JF, Baxevanis AD, Martindale MQ. Evolution of the TGF-beta signaling pathway and its potential role in the ctenophore, Mnemiopsis leidyi. PLoS One. 2011;6:e24152. doi: 10.1371/journal.pone.0024152. [DOI] [PMC free article] [PubMed] [Google Scholar]
- 34.Pang K, Ryan JF, Mullikin JC, Baxevanis AD, Martindale MQ. Genomic insights into Wnt signaling in an early diverging metazoan, the ctenophore Mnemiopsis leidyi. Evodevo. 2010;1:10. doi: 10.1186/2041-9139-1-10. [DOI] [PMC free article] [PubMed] [Google Scholar]
- 35.Reitzel AM, Pang K, Ryan JF, Mullikin JC, Martindale MQ, Baxevanis AD, Tarrant AM. Nuclear receptors from the ctenophore Mnemiopsis leidyi lack a zinc-finger DNA-binding domain: lineage-specific loss or ancestral condition in the emergence of the nuclear receptor superfamily? Evodevo. 2011;2:3. doi: 10.1186/2041-9139-2-3. [DOI] [PMC free article] [PubMed] [Google Scholar]
- 36.Ryan JF, Pang K, Mullikin JC, Martindale MQ, Baxevanis AD. The homeodomain complement of the ctenophore Mnemiopsis leidyi suggests that Ctenophora and Porifera diverged prior to the ParaHoxozoa. Evodevo. 2010;1:9. doi: 10.1186/2041-9139-1-9. [DOI] [PMC free article] [PubMed] [Google Scholar]
- 37.Lehmann J, Stadler PF, Krauss V. Near intron pairs and the metazoan tree. Molecular Phylogenetics and Evolution. 2013 doi: 10.1016/j.ympev.2012.11.012. [DOI] [PubMed] [Google Scholar]
- 38.Pires-daSilva A, Sommer RJ. The evolution of signalling pathways in animal development. Nat Rev Genet. 2003;4:39–49. doi: 10.1038/nrg977. [DOI] [PubMed] [Google Scholar]
- 39.Sebe-Pedros A, Roger AJ, Lang FB, King N, Ruiz-Trillo I. Ancient origin of the integrin-mediated adhesion and signaling machinery. Proc Natl Acad Sci U S A. 2010;107:10142–10147. doi: 10.1073/pnas.1002257107. [DOI] [PMC free article] [PubMed] [Google Scholar]
- 40.King N, Carroll SB. A receptor tyrosine kinase from choanoflagellates: molecular insights into early animal evolution. Proc Natl Acad Sci U S A. 2001;98:15032–15037. doi: 10.1073/pnas.261477698. [DOI] [PMC free article] [PubMed] [Google Scholar]
- 41.Jager M, Chiori R, Alie A, Dayraud C, Queinnec E, Manuel M. New insights on ctenophore neural anatomy: immunofluorescence study in Pleurobrachia pileus (Muller, 1776) J Exp Zool B Mol Dev Evol. 2011;316B:171–187. doi: 10.1002/jez.b.21386. [DOI] [PubMed] [Google Scholar]
- 42.Harbison GR. On the classification and evolution of the Ctenophora. The origins and relationships of lower invertebrates. 1985:78–100. [Google Scholar]
- 43.Hay-Schmidt A. The evolution of the serotonergic nervous system. P Roy Soc Lond B Bio. 2000;267:1071–1079. doi: 10.1098/rspb.2000.1111. [DOI] [PMC free article] [PubMed] [Google Scholar]
- 44.Hernandez-Nicaise ML. The nervous system of ctenophores III. Ultrastructure of synapses. Journal of neurocytology. 1973;2:249–263. doi: 10.1007/BF01104029. [DOI] [PubMed] [Google Scholar]
- 45.Sakarya O, Armstrong KA, Adamska M, Adamski M, Wang IF, Tidor B, Degnan BM, Oakley TH, Kosik KS. A post-synaptic scaffold at the origin of the animal kingdom. PLoS One. 2007;2:e506. doi: 10.1371/journal.pone.0000506. [DOI] [PMC free article] [PubMed] [Google Scholar]
- 46.Simmons DK, Pang K, Martindale MQ. Lim homeobox genes in the Ctenophore Mnemiopsis leidyi: the evolution of neural cell type specification. Evodevo. 2012;3:2. doi: 10.1186/2041-9139-3-2. [DOI] [PMC free article] [PubMed] [Google Scholar]
- 47.Layden MJ, Meyer NP, Pang K, Seaver EC, Martindale MQ. Expression and phylogenetic analysis of the zic gene family in the evolution and development of metazoans. Evodevo. 2010;1:12. doi: 10.1186/2041-9139-1-12. [DOI] [PMC free article] [PubMed] [Google Scholar]
- 48.Farrar N, Riesgo A, Leys S. Society for Integrative and Comparative Biology 2013 Annual Meeting; San Francisco, CA. 2013. [Google Scholar]
- 49.Steinmetz PRH, Kraus JEM, Larroux C, Hammel JU, Amon-Hassenzahl A, Houliston E, Wörheide G, Nickel M, Degnan BM, Technau U. Independent evolution of striated muscles in cnidarians and bilaterians. Nature. 2012;487:231–234. doi: 10.1038/nature11180. [DOI] [PMC free article] [PubMed] [Google Scholar]
- 50.Trapnell C, Williams BA, Pertea G, Mortazavi A, Kwan G, van Baren MJ, Salzberg SL, Wold BJ, Pachter L. Transcript assembly and quantification by RNA-Seq reveals unannotated transcripts and isoform switching during cell differentiation. Nat Biotechnol. 2010;28:511–515. doi: 10.1038/nbt.1621. [DOI] [PMC free article] [PubMed] [Google Scholar]
- 51.Grabherr MG, Haas BJ, Yassour M, Levin JZ, Thompson DA, Amit I, Adiconis X, Fan L, Raychowdhury R, Zeng Q. Full-length transcriptome assembly from RNA-Seq data without a reference genome. Nature biotechnology. 2011;29:644–652. doi: 10.1038/nbt.1883. [DOI] [PMC free article] [PubMed] [Google Scholar]
- 52.Haas BJ, Salzberg SL, Zhu W, Pertea M, Allen JE, Orvis J, White O, Buell CR, Wortman JR. Automated eukaryotic gene structure annotation using EVidenceModeler and the Program to Assemble Spliced Alignments. Genome Biol. 2008;9:R7. doi: 10.1186/gb-2008-9-1-r7. [DOI] [PMC free article] [PubMed] [Google Scholar]
- 53.Shimodaira H, Hasegawa M. CONSEL: for assessing the confidence of phylogenetic tree selection. Bioinformatics. 2001;17:1246–1247. doi: 10.1093/bioinformatics/17.12.1246. [DOI] [PubMed] [Google Scholar]
Associated Data
This section collects any data citations, data availability statements, or supplementary materials included in this article.