Abstract
A compact and position-addressable blue ray scanning microscope (BSM) based on a commercially available Blu-ray disk pickup head (PUH) is developed for cell imaging with high resolution and low cost. The BSM comprises two objective lenses with numerical apertures (NAs) of 0.85 and 0.6 for focusing blue and red laser beams, respectively, on the sample slide. The blue and red laser beams are co-located adjacent to each other and move synchronously. A specially designed sample slide is used with a sample area and an address-patterned area for sample holding and address recognition, respectively. The blue laser beam is focused on the sample area and is used for fluorescent excitation and image capturing, whereas the red laser beam is focused on the address-patterned area and is used for address recognition and dynamic focusing. The address-patterned area is divided into 310 sectors. The cell image of each sector of the sampling area has a corresponding address pattern. Fluorescence images of monkey-derived kidney epithelial cells and fibroblast cells in which the F-actin is stained with fluorophore phalloidin CF 405 are measured by the BSM, with results comparable to those measured by a Leica TCS CP2 confocal microscope. The cell image of an area of interest can be easily tracked based on the coded address, and a large-area sample image can be accurately reconstructed from the sector images.
OCIS codes: (180.0180) Microscopy, (180.1790) Confocal microscopy, (180.2520) Fluorescence microscopy
1. Introduction
Fluorescence microscopy is commonly used in life sciences for microstructural observations of entire species at the molecular level [1, 2]. The spatial resolution and the ability to distinguish fine details of specimens are critical criteria in selecting a fluorescence microscope. The fluorescence cell images measured by traditional wide-field microscopes contain both the desired in-focus and undesired out-of-focus light. The high resolution achieved for images in the focal plane can be blurred by information from the out-of-focus light, which makes it difficult to detect cellular and sub-cellular structures. To overcome this problem, laser scanning point confocal microscopy (LSCM) is used to collect only information from the in-focus light and to reduce the out-of-focus noise, thereby increasing the signal-to-noise (S/N) ratio of the obtained fluorescence images [3].
Unfortunately, conventional LSCM equipment is cumbersome in size, expensive, and inconvenient for a number of potential applications, including in situ monitoring of cell growth dynamics in cell culture chambers [4]. Imaging of living cells is generally performed using a microscopy system after removal of the samples of interest from chambers after the desired period of culture. However, the use of LSCM for identifying the location of samples for the purpose of registration and dynamic tracing is generally difficult and time-consuming. Consequently, a compact and high-resolution microscope that can be embedded into a cell culture chamber and utilized for fluorescence image capturing with an accurate position-addressable function is urgently needed.
Several methods have been used to partition a specimen surface into labeled sub-surfaces for position recognition. One option is to use a compact and cost-effective fluorescence microscope for real-time two-dimensional fluorescence analysis on a chip with microbeads [5]. The system contains microfluidic channels and optical marks for the autofocus and channel-find algorithms. Although this system can provide a high resolution of 0.38 μm for a laser diode of 405 nm, it does not provide accurate or repeatable position data suitable for precise image registration. Another option is to use a two-dimensional grid of dots to form a phase reference on the sample holder, enabling subpixel resolution in the coordinate determination [6, 7]. However, the position reference pattern is located between the objective lens and tissue section plane. The tissue section and position section images must be acquired sequentially at two focus positions of the microscope with one objective lens. The transparency of the position section causes a reduction in the light budget, particularly in LSCM, which requires a minimization of photobleaching [8]. Moreover, the interface laid between the encoded pattern and tissue section causes additional fluorescence light and tissue section perturbation.
It has been reported that compact LSCM can be constructed based on compact disc (CD) technology [9]. CD-based LSCM can be used for fluorescence detection, but without the position recognition function, and cannot be used for cell image investigation. In this study, we develop a position-addressable blue ray scanning microscope (BSM) modified from a commercial optical pickup head (PUH) module of Blu-ray read-only memory (BD-ROM). The optical PUH module contains a dual objective lens of blue and red laser sources, which are used as light sources for cell fluorescence image capturing and position recognition, respectively. A specially designed glass sample slide is prepared with both a sample area and an address-patterned area for sample holding and address coding, respectively. The red laser beam (wavelength of 655 nm) of the BSM is focused by an objective lens with a numerical aperture (NA) of 0.6 on the address-coded patterns of the sample slide and is used for sample focusing and position tracking. The blue laser beam of 405 nm is focused through an objective lens with a NA of 0.85 on the cells located on the sample area to capture the cell fluorescence image. Because the image-capturing and position-recognizing beams are co-located adjacent to each other and move synchronously, the obtained cell image or the signal of each sampling area has an accurate corresponding address. Therefore, the same area of a temporal cell fluorescence image can be easily and accurately positioned by the coded pattern. Meanwhile, a cell image at an accurate cell position can be scanned multiple times to reduce the random noise and increase the S/N ratio. The system is compact and inexpensive and has the potential to be integrated with a flow cytometer or other biomedical instruments for cell image recognition and differentiation [10, 11].
2. Methods
2.1 BSM optical system
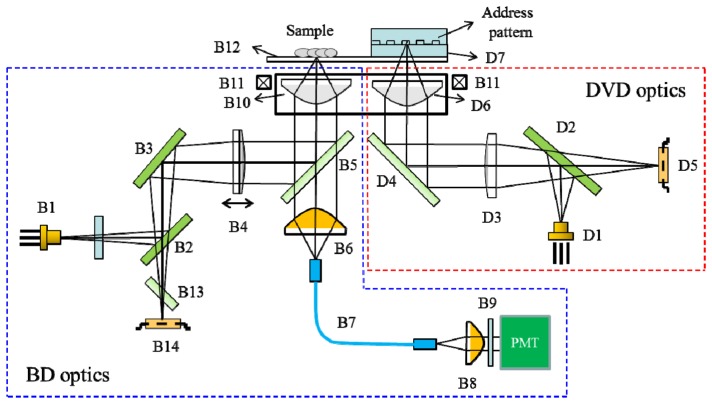
A schematic view of the optical structure of the BSM is illustrated in Fig. 1 , which is modified from a commercial BD-ROM (Sanyo SF-BD412) optical PUH module. This optical system includes two optical branches: the Blu-ray disk (BD) optics and digital versatile disk (DVD) optics. The BD and DVD optics are used for cell fluorescence image capturing and for sample focusing and position recognition, respectively. For the DVD optics, the red laser (D1) beam, with a wavelength of 655 nm, is used for autofocusing and for reading the push-pull (PP) signals of the address-coded patterns [9]. The address-coded pattern is an aluminum (Al)-coated land-groove structure and acts as a grating. The incident red laser beam is reflected by the land-groove structure and returns to the photo detector (D5). The PP signals obtained by D5 are then decoded to identify the address of the cell position. For the BD optics, the blue laser (B1) beam, with a wavelength of 405 nm, is focused by an objective lens (B10, NA 0.85) onto the sample fixed on the cover glass (B12). The sample is stained with fluorophore phalloidin CF 405, which absorbs the blue laser light and emits fluorescence light near 450 nm. The emitted fluorescence light is collected by the objective lens B10 and is transmitted through a long-pass dichroic beam splitter B5 (Semrock Di01-R405) with a cut-off wavelength of 408 nm. B5 is used to replace the reflection mirror of the BD-ROM optical PUH module. The parts under B5, including a 4.34-mm focal lens B6 (Thorlabs F230SMA-A), a 105-μm-diameter multimode optical fiber (B7, Thorlabs M15L01), a detector lens (B8), a narrow-band pass emission filter (B9, 450 +/− 5 nm, Edmund 65079), and a photomultiplier tube (PMT, Hamamatsu H10723-210), are added to measure the fluorescence light. Therefore, the blue laser beam is reflected by B5 and does not interfere with the fluorescence signal to be received by the PMT. The fluorescence signal passes through B5 and is then focused by B6 onto a multimode optical fiber B7, which acts as a pinhole [9]. Finally, the fluorescence signal passes through B8 and B9 and impinges on the PMT. The objective lenses of the BD (B10) and DVD (D6) optics are attached to the same lens holder (B11) with a gap of 4.5 mm, and B11 is equipped with a voice coil motor (VCM) to control the focusing and scanning of the laser beams. The working distance (WD) of the DVD objective lens is 1.25 mm, whereas that of the BD objective lens is 0.36 mm. Because the WD of the objective lens of the red laser beam is larger than that of the blue laser beam, the height of the address-patterned plane should be higher than that of the sample plane. Meanwhile, the sample area and address-coded area should be adjacent to each other, separated by a distance less than that between the blue and red laser beams. In this system, the distance between the blue and red laser beams is 4.5 mm. When the red laser beam is focused onto the address-coded pattern, the blue laser beam is simultaneously focused onto the cell sample. The fluorescence signal of the sample is then co-registered with the PP signals measured from the address-coded patterns. A two-dimensional fluorescence image of the sample can be obtained when the PUH scans over an area of the sample.
Fig. 1.
Schematic view of the optical structure of the BSM. For the DVD optics, light from a red laser diode (D1) is reflected by a beam splitter (D2) and collimated by a collimator lens (D3). The beam is then reflected by a fold mirror (D4), penetrates the objective lens (D6, NA 0.6), and is focused onto the Al-coated address pattern deposited on the protection layer (D7). The address signal is reflected from the patterned Al layer, transmitted through D2, and detected by the photodiode (D5). For the BD optics, light from a blue laser diode (B1) passes through a glass plate and is then successively reflected by beam splitters (B2 and B3). The laser beam is then collimated by the collimator lens (B4) and reflected by the dichroic mirror (B5). Finally, the beam penetrates the objective lens (B10, NA 0.85) and is focused onto the sample on the cover glass (B12). The blue laser beam reflected from the sample slide is collimated by collimator (B10) and reflected by B5 and B3, then passes through astigmatic plate (B13), and is finally focused onto the photo detector (B14). The emission fluorescence signal is collimated by B10, transmitted through B5, and coupled onto a multimode fiber (B7). The fluorescence signal then passes through B7 and is collimated by a collimator lens (B8); it is then transmitted through a narrow-band emission filter (B9) and impinges on the PMT.
2.2 Sample slide
A specially designed glass slide with dimensions of 76.2 × 25.4 × 1.1 mm (length × width × height, L × W × H) is used as a sample slide (Fig. 2 ). The sample slide contains eight wells, and each well contains one sample area and one address-coded area. The sample area and the address-coded area are 7.0 × 4.0 and 7.14 × 3.08 mm (L × W) in size, respectively. They are separated by a gap of 4.5 mm, which is equivalent to the distance between the blue and red laser beams. The address-coded area is divided into 310 sectors, with 10 sectors in the x-direction and 31 sectors in the y-direction. Every sector comprises one servo data area and two non-data areas; the servo data area is sandwiched between the two non-data areas. The microstructure of the non-data areas comprises a plurality of base-straight lands and grooves with an equal width of 0.38 μm, and that of the servo data area is designed as a binary code comprising a plurality of base-straight lands and grooves and data-straight grooves. The width of the data-straight groove is 0.76 μm. The boundary of each sector is confined by two data-straight grooves in the x-direction. The image specification of each sector is set to 800 × 600 pixels (SVGA format) in the x- and y-directions. Because the resolution of each pixel is controlled at 0.38 μm, the entire area of each sector is 304 × 228 μm (L × W).
Fig. 2.
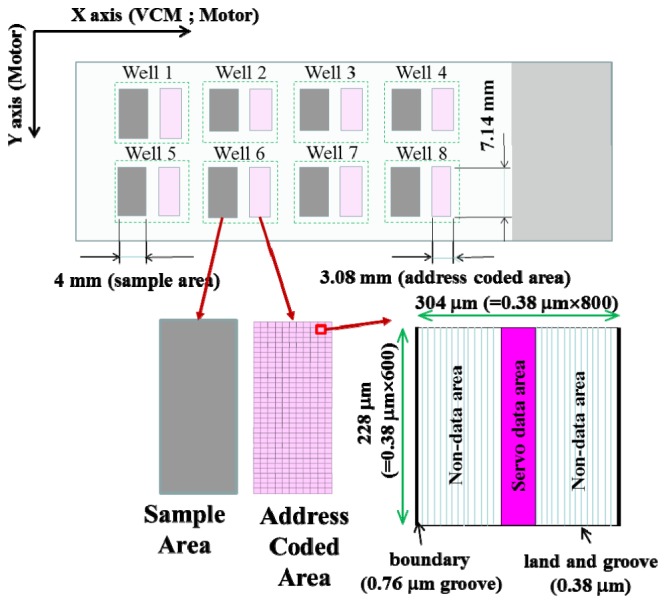
Layout of the sample slide.
Because there are 10 sectors in the x-direction and 31 sectors in the y-direction, the string of binary code of the servo data area comprises nine digital data points (Fig. 3 ). The first four digits are used to record the sector number (0-9) in the x-direction, and the last five digits are used to record the sector number (0-30) in the y-direction. The pattern of digital data “0” comprises three data-straight grooves, three base-straight grooves, and six base-straight lands, and that of digital data “1” comprises one data-straight groove, five base-straight grooves, and six base-straight lands. Therefore, the sector number can be expressed as (x, y), with x ranging from zero to nine and y ranging from zero to 30 for a total address-coded area of 310 sectors. For sector number (5, 10), the string of binary code of the servo data area is (010101010), with the corresponding microstructure shown in Fig. 3.
Fig. 3.
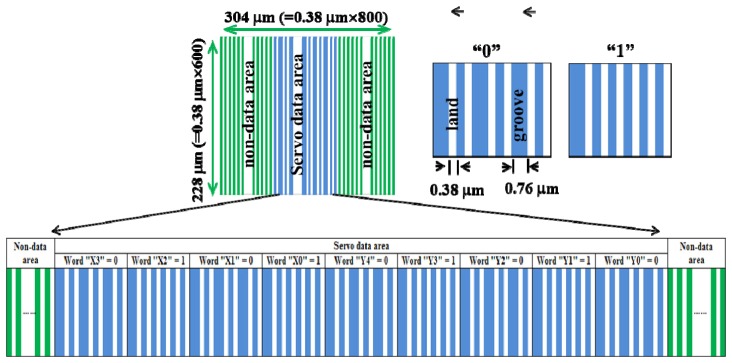
Microstructure of the servo code area of sector (5, 10).
2.3 Preparation and characterization of the address-coded pattern
The microstructure of the address-coded area was prepared by a 0.18-μm CMOS process. A 100-nm-thick layer of SiO2 was first deposited by sputtering on an 8” Si substrate, and then, a layer of positive photoresist (GKR5201) was spin-coated on top of the SiO2 layer. The photoresist was exposed to UV light using a metal mask with the microstructure of the address-coded area, and the exposed area was washed away by the developer solution, leaving windows of the bare underlying SiO2 layer. The pattern of the positive photoresist was then directly transferred to the underlying SiO2 layer by a chemical etching process using C2F6/C4F8/CO/Ar as the etchant gases. Finally, a 35-nm-thick sputter-coated Al layer was deposited on the address-patterned SiO2 layer deposited on the Si substrate to maximize the reflection signal.
The intensity of the reflection signal from the Al-coated address-coded area was measured by a built-in four-quadrant photodiode (A, B, C, D) of DVD optics (D5 in Fig. 1). The auto focusing of the red laser beam was controlled using the VCM to adjust the distance between the objective lens and the metallized address-coded pattern. The focus error signal (A + C)-(B + D) was zero when the focus point of the red laser beam was located on the reflecting surface [12, 13]. Meanwhile, the address tracking of the sector number (x, y) was monitored using the PP signal (A + B)-(C + D) of the address-coded area [12]. A swing frequency of 40 Hz for the VCM, with a displacement over 300 μm across the sector in the x-direction, was adopted in the address tracking. Because the sector number was encoded in the servo data area, the address was modulated on the PP signal when the VCM actuator swung across the servo data area (Fig. 4 ). From the simulated PP signal, a threshold intensity (yellow dashed line) was used to distinguish the data-straight groove and the base-straight groove. When the intensity is higher than the threshold value, a large signal is obtained from the data-straight groove. When the intensity is lower than the threshold value but higher than the base value (green solid line), a small signal is contributed from the base-straight groove. To ensure that the VCM actuator swings across the entire sector area, the two large signals contributing from the two boundaries of the sector shown in Fig. 2 were used as a landmark. It is confirmed that the PP signal of the sector is captured completely when the two large isolated signals appeared with the signals contributed from the servo data area positioned between them. The sector number of each sector can be accurately identified after decoding the PP signal of the servo data area.
Fig. 4.
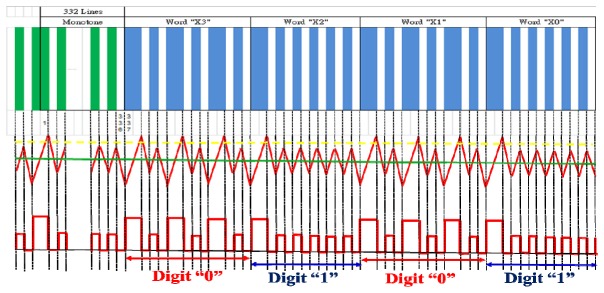
Simulated (middle) and decoded (bottom) PP signals of the servo data area (top) in part of the sector (x, y) at x = 5. The horizontal yellow dashed line and green solid line in the simulated PP signal (middle) are the threshold intensity and base intensity, respectively.
2.4 Timing control for image capturing
The timing control for image capturing and pixel arrangement is presented in Fig. 5 . When the red laser beam is focused on the top-center of the targeted sector, both the red and blue laser beams are triggered simultaneously to track the sector number and to capture the sample signal, respectively. According to the pattern of the servo data area, the sample signal is taken at the base value across the PP signal when the actuator swings across the sector. The number of the “sample signal” at “data enable” active high represents the length of the sector image, which corresponds to approximately 800 sample signals, depending on the patterns of the servo data areas. The number of “data enable” signals at “data valid” active high represents the width of the sector image, corresponding to 600 “data enable” signals. Because one “data enable” has approximately 800 “sample signals,” the total number of sample signals in one sector image is approximately 800 × 600 (L × W). Each sector image has its own sector number and can be accurately tracked according to the registered sector number.
Fig. 5.
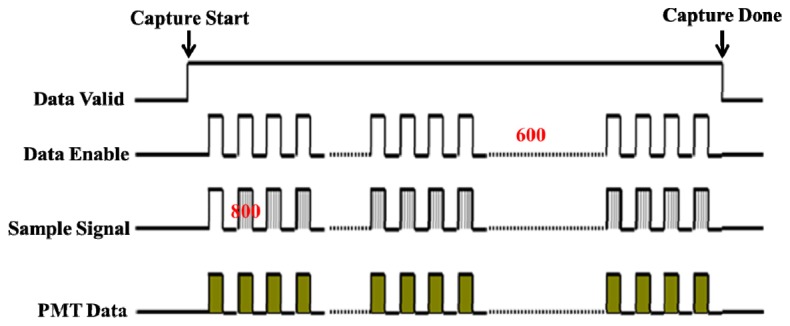
Timing control for image capturing and pixel arrangement.
The process control of the BSM system for sector tracking and sample image capturing is shown in Fig. 6 . The sector tracking is manipulated by the servo control module. After the targeted sector is identified, the timing control for image capturing and pixel arrangement is initiated. The PP signal of the sector is monitored by the servo control module, and the fluorescence signal of the sample is captured and registered by the PMT control module. The PMT control module includes an analog-to-digital converter (ADC, 12 bits), a field-programmable gate array (FPGA, ALTERA Cyclone IV), and a universal serial bus (USB) controller. The PMT control module works as a data collector and converter. The signal collected from the PMT sensor is latched and converted to digital data. Each data point latched by the ADC represents a single pixel of the sector image. After the data latch, the sector image is created by a pixel arrangement process according to the servo signals. Finally, the sector image is transferred to the host via a USB interface. The swing frequency of the actuator is 40 Hz along the x direction and the sampling signal is taken both on the forth and back. The equivalent data enabling frequency is 80 Hz in the y direction. Therefore, the total processing time for sector image capturing and displaying is approximately 7.5 s for the number of “data enable” signals of 600 pixels.
Fig. 6.
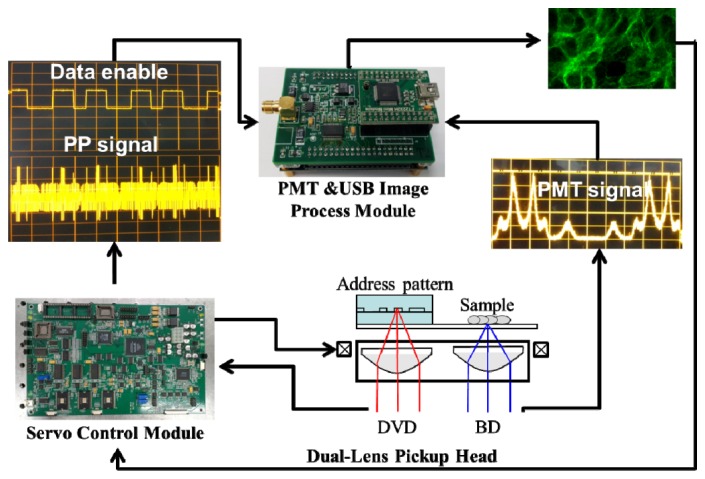
Process control of the BSM system for sector tracking and sample image capturing.
2.5. Cell sample preparation
Monkey-derived kidney epithelial (VERO) cells were plated in antibiotic-free Alpha Modifications Minimum Essential Medium in 5% phosphate-buffered saline (PBS). Fibroblast (FB, HS68) cells were seeded in Dulbecco's Modified Eagle Medium in 10% PBS medium. All cells were grown at 37°C in a 5% CO2–95% air atmosphere. Exponentially growing cells were trypsinized and counted using an ADAM-MC automatic cell counter (Cronus Technologies) following the trypan blue exclusion method.
VERO cell lines at a density of 7.45 × 10⁴/cm2 were seeded on 5 × 2-mm (for the BSM) and 75 × 25-mm (for LSCM) glass slides for morphological evaluation. FB cells were seeded at a density of 3.7 × 10⁴/cm2. The cells were fixed with freshly prepared 3.75% formaldehyde in dilute PBS buffer at 4°C for 15 min. The cells were permeabilized with 0.5% Triton X-100 in PBS for 10 min and then blocked with 3% bovine serum albumin in PBS for 30 min at room temperature. For BSM morphological evaluation, the F-actin of the cells was then stained with phalloidin CF 405 (50 U/mL) (Biotium, CA, USA). For observation by LSCM, the cell samples were stained with Alexa Fluor® 488 phalloidin (30 U/mL) (Molecular Probes, Oregon, USA). The coverslips were mounted on 75 × 25-mm glass slides with a drop of crystal/mount medium (Biomeda Co., Hayward, CA, USA) and on 5 × 2-mm glass sides with 1 μL of medium. All preparations were observed by the BSM, and some samples were also examined by a Leica TCS SP2 LSCM.
3. BSM performance
The BSM system is depicted in Fig. 7 . Figure 7(a) shows the main body of the BSM system with dimensions of 272 × 206 × 83 mm (L × W × H). The sample slide with eight wells is located on top of the optical PUH. Each well contains one sample area and one address-coded area. The displacements of the optical PUH in x and y directions are controlled by the stepping motors with submicron accuracy for each step. The servo control and PMT control modules are positioned under the bottom of the PUH. The photograph of the complete BSM system is shown in Fig. 7(b). Because of its compact size (300 × 284 × 175 mm, L × W × H) and affordable price, this system holds promise for fluorescence signal detection in life science applications.
Fig. 7.
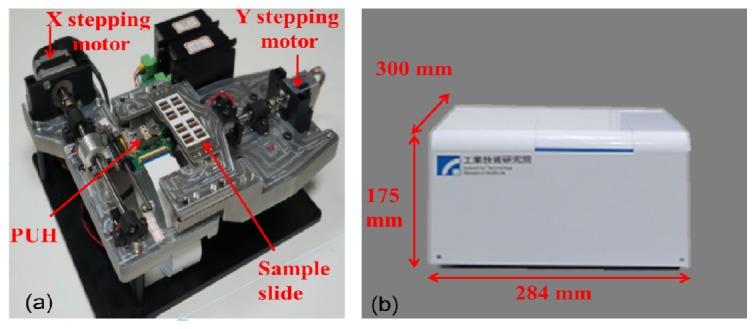
(a) Main body and (b) photograph of the BSM system.
3.1 Servo code pattern and corresponding PP signal
A cross-sectional image of the servo code pattern of the Al-coated SiO2/Si substrate is shown in Fig. 8(a) . The widths of the data-straight grooves, base-straight grooves, and base-straight areas are accurately controlled at 760, 380, and 380 nm, respectively. The depth of the groove is equal to the thickness of SiO2, namely, 100 nm. The formation of a submicron pattern on the SiO2/Si substrate was achieved using a 0.18-μm CMOS process, which is commercially available and cost effective. However, the Al-coated SiO2/Si substrate must be cut to the size of the address-coded area and attached to the sample slide. The preparation process is complex and labor intensive, which is acceptable for sample testing but unsuitable for mass production. For the mass production of sample slides, we propose the use of polycarbonate substrates instead of a glass chamber slide, which can be produced by plastic injection with accurate microstructural pattern control at low production costs.
Fig. 8.
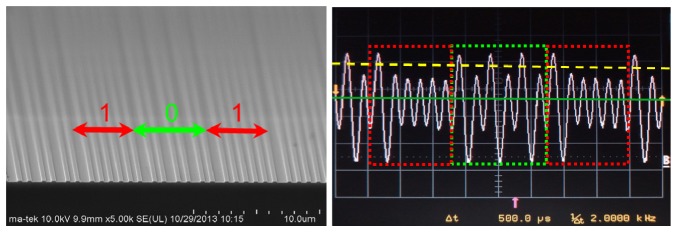
(a) SEM image of the cross-sectional microstructure of the servo code pattern (101) and (b) the corresponding PP signal.
The corresponding PP signal of the servo code pattern (showing in Fig. 8(a)) is presented in Fig. 8(b). Due to the optical diffraction effect of the grating structure, the maximum PP intensity is obtained at the data-straight groove, and the base-straight groove has a relatively low PP signal. We can choose a threshold intensity (yellow dashed line in Fig. 8(b)) higher than the intensity of the signal obtained from the base-straight groove and lower than that of the data-straight groove. Therefore, the pattern of the servo code area can be distinguished from the number of peaks intersecting the threshold intensity and the number of sample signals intersecting the base intensity (green solid line in Fig. 8(b)). The sector number (x, y) of the sector can be decoded from the pattern of the servo code area using the servo control module. The fluorescence cell image of the sector is then captured and recorded by the PMT module with the registered sector number.
3.2 Addressing and stitching of cell images
The cell image was taken using the following three steps (Fig. 9 ). Step 1: Before cell imaging, the red laser beam must be moved to the target sector (x, y) by the servo control module. The sector number can be identified from the PP signal of the address-coded patterns in the servo data area using the methodology described in Fig. 8. Step 2: After identifying the sector area of interest, the red laser beam must then be moved to the center of the sector, which can be identified from the symmetry of the PP signal from the two sector boundaries by swinging the red laser beam across the sector boundaries themselves. Step 3: Subsequently, the red laser beam is moved by a stepping motor along the y-direction to the top-center of the sector. When the red laser beam moves over the top boundary of the sector, the sector number changes from (x, y) to (x, y + 1) immediately and the laser beam is moved slightly back to the top-center of the targeted sector (x, y). After the red laser beam is located at the top-center of the targeted sector, the blue laser beam is turned on to begin scanning over the sample. Because the blue and red laser beams are co-located adjacent to each other and move synchronously, the cell image captured by swinging the blue laser beam across the sample area corresponds to the sector area scanned by swinging the red laser beam across the sector on the address coded area. Therefore, each sample image obtained using this methodology is characterized by a corresponding sector address.
Fig. 9.
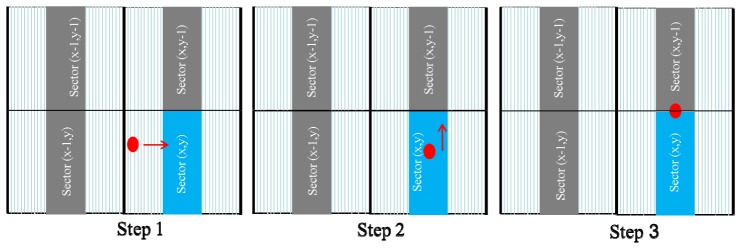
Schematic procedure for obtaining cell images.
Fluorescence VERO cell images located at different sectors, e.g., (4, 12), (4, 13), (5, 12), and (5, 13), were captured by the BSM, as shown in Fig. 10 . The control voltage of the PMT is 0.94 V, with a gain of 1.13 × 10⁶. The numbers of sample signals in the x direction were measured at every intersection point by intersecting the base intensity of the pp signal, which had a minimum spacing of 0.38 μm. Therefore, the resolution of the resulting image was 0.38 μm. The sector cell image can be easily tracked according to the sector number with excellent repeatability. A consistent image is obtained when the same sector area is measured several times as the sample slide is moved away from and back to the BSM system.
Fig. 10.
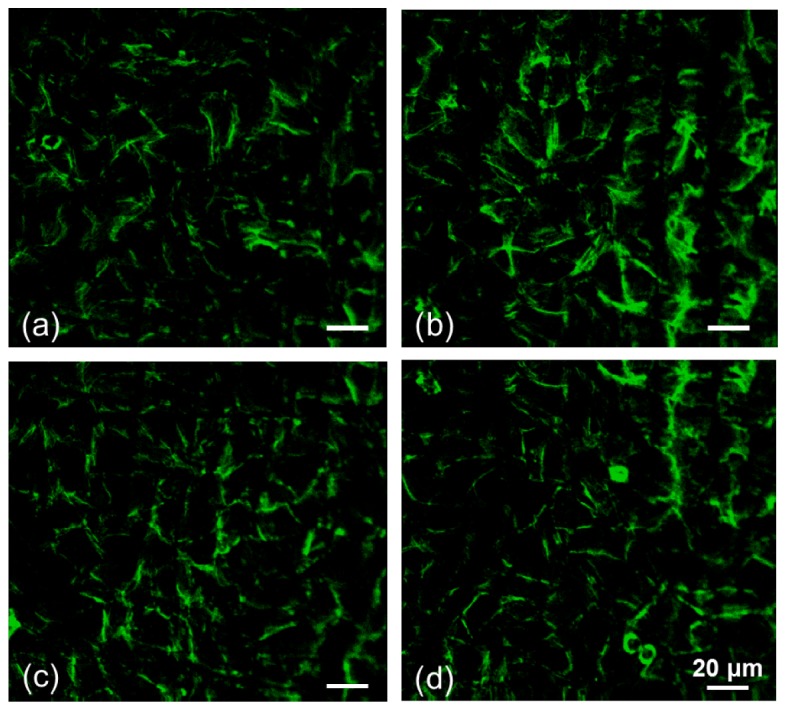
Fluorescence images of the F-actin of VERO cells stained with fluorophore phalloidin CF 405 and measured by the BSM at different sectors. The sector numbers are (a) (4, 12), (b) (5, 12), (c) (4, 13), and (d) (5, 13).
Because each sector has its own coded address pattern, the cell images of several sectors close to each other can be stitched together into a large image, which is important in life science studies when monitoring a large ROI covering several sectors. Figure 11(a) presents the tiled cell images of sectors (4, 12), (4, 13), (5, 12), and (5, 13) from Fig. 10. To ensure that all of the image areas of the ROI are captured without any missing data, an overlapping of the cell images along the y-direction was performed. However, the cell images along the x-direction were defined by the sector boundaries. The overlapping area of the cell images along the y-direction can be distinguished from the feature images in Figs. 10(b) and 10(d). The overlap area is 28.5 μm, which can be controlled by the moving speed of the stepping motor along the y-direction and the number of pixels acquired in the y-direction. With a swing frequency of 40 Hz for the laser beams, 80 pixels along the y-direction are taken in 1 s, and the total capturing time is 7.5 s for 600 pixels in one sector. The height of the image captured along the y-direction is determined by the stepping motor speed time of 7.5 s, which is set to cover the sector height of 228 μm. The overlap area can be easily identified, and the final stitched image of four sectors is shown in Fig. 11(b).
Fig. 11.
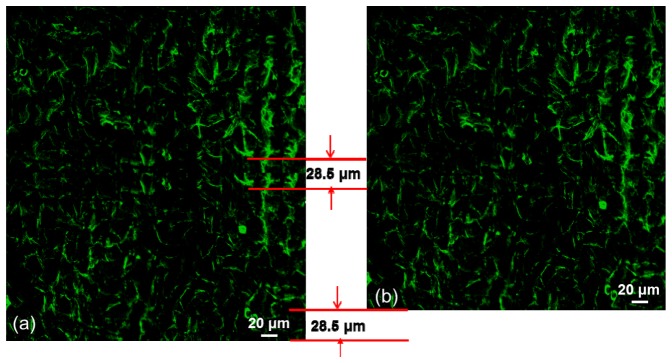
Stitched four-sector fluorescence images of the F-actin of VERO cells stained with fluorophore phalloidin CF 405 (a) before and (b) after deleting the overlap area.
3.3 Cell images measured by the BSM vs. LSCM
Figure 12(a) presents a fluorescence image of the F-actin of FB cells stained with the fluorophore phalloidin CF 405 and measured by the BSM. The control voltage of the PMT is 0.93 V, with a gain of 1.0 × 10⁶. The resolution of the image of the FB F-actin is approximately 0.38 μm. A fluorescence image of FB F-actin stained with Alexa Fluor® 488 phalloidin and measured by a Leica TCS SP2 LSCM (Leica LSCM) using an oil lens with a NA of 1.4 is included for comparison (Fig. 12(b)). The selected pinhole size of the Leica LSCM is 115 μm, which is close to that of the BSM (105 μm). In comparison, the resolution of the FB F-actin measured by the BSM is similar to that obtained by the Leica LSCM. However, the image contrast of the FB cells measured by the BSM is inferior to that measured by the Leica LSCM due to the smaller NA and poorer confocal effect. The point spread function of the BSM system with a NA of 0.85 is larger than that with a NA of 1.4 in the Leica LSCM, which has a poorer signal confinement, and the signal decays less rapidly away from the focus. Meanwhile, the opening of the optical fiber used as a pinhole is approximately located at the conjugate focal point of the image plane. Many signals coming from the larger focus spot are received by the fiber and result in a blurred image [13]. The image resolution and contrast of the BSM system can be improved if a high NA objective lens is used for the image capturing and if a small-diameter fiber is used. However, a decreased signal intensity would accompany the reduced fiber diameter [14]. The trade-off between the diameter of the signal-receiving fiber and the S/N ratio achieved by the PMT should be considered.
Fig. 12.
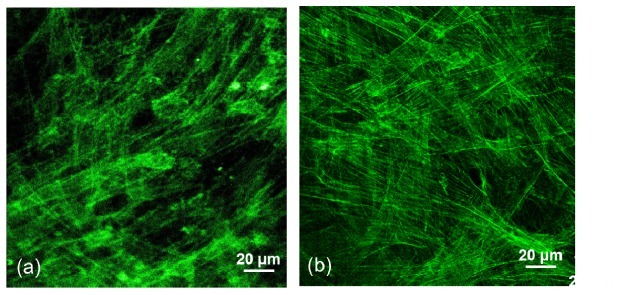
Fluorescence images of the F-actin of fibroblast cells (a) stained with fluorescent phalloidin CF 405 and measured by the BSM and (b) stained with Alexa Fluor® 488 phalloidin and measured by a Leica LSCM.
4. Summary
We have developed a position-addressable BSM system modified from a commercial optical PUH module of BD-ROM. The optical PUH contains a dual objective lens for blue and red laser beams, which are co-located adjacent to each other and move synchronously. By incorporating a specially designed glass sample slide, the red and blue laser beams of the optical PUH are focused on the address-patterned area and the sample area of the sample slide, which are used for position recognition and cell fluorescence image capturing, respectively. The obtained cell image or signal of each sector area has an accurate corresponding address. Therefore, the fluorescence image of any sector area can be arbitrarily and repeatedly selected and measured due to the coded address. Meanwhile, the cell image of a large ROI can be addressed and obtained by stitching several sector images together. The resolution of the fluorescence cell images measured by BSM is comparable to that of commercially available LSCM, although the image contrast is worse. The image contrast and section power of the BSM can be further improved by using an objective lens with a larger NA. The entire BSM system is inexpensive and highly portable due to the use of a compact and mass-marketed BD optical PUH module.
Acknowledgments
We thank the Industrial Technology Research Institute for financial aid under project codes B101W4B100, B101QV1221, C101W4200, and CJ51RAQ100. We are also grateful for assistance from members at the Biomedical Devices Research Laboratory in cell cultivation and preparation.
References and links
- 1.Weissleder R., Ntziachristos V., “Shedding light onto live molecular targets,” Nat. Med. 9(1), 123–128 (2003). 10.1038/nm0103-123 [DOI] [PubMed] [Google Scholar]
- 2.Y. L. Wang and D. L. Taylor, Fluorescence Microscopy of Living Cells in Culture (Academic Press, 1989) [Google Scholar]
- 3.Sheppard C. J. R., Wilson T., “Image formation in scanning microscopes with partially coherent source and detector,” Opt. Acta (Lond.) 25(4), 315–325 (1978). 10.1080/713819784 [DOI] [Google Scholar]
- 4.Delaney P. M., Harris M. R., King R. G., “Fiber-optic laser scanning confocal microscope suitable for fluorescence imaging,” Appl. Opt. 33(4), 573–577 (1994). 10.1364/AO.33.000573 [DOI] [PubMed] [Google Scholar]
- 5.L. I. Segerink, M. J. Koster, A. J. Sprenkels, I. Vermes, and A. V. D. Berg, “A cheap 2D fluorescence detection system for μm-sized beads on-chip,” Presented at 15th International Conference on Miniaturized System for Chemistry and Life Sciences, Seattle, Washington, USA, 2–6 October 2011. [Google Scholar]
- 6.Sandoz P., Zeggari R., Froelhy L., Pretet J. L., Mougin C., “Potition referencing in ooptical microscopy thanks to sample holders with out-of-focus excoded patterns,” J. Microsc. 255, 293–303 (2007). [DOI] [PubMed] [Google Scholar]
- 7.Galeano Z. J. A., Sandoz P., Gaiffe E., Launay S., Robert L., Jacquot M., Hirchaud F., Pretet J. L., Mougin C., “Position-referenced microscopy for live cell culturing monitoring,” Biomed. Opt. Express 2, 1307–1318 (2011). [DOI] [PMC free article] [PubMed] [Google Scholar]
- 8.Karpova T. S., Baumann C. T., He L., Wu X., Grammer A., Lipsky P., Hager G. L., McNally J. G., “Fluorescence resonance energy transfer from cyan to yellow fluorescent protein detected by acceptor photobleaching using confocal microscopy and a single laser,” J. Microsc. 209(1), 56–70 (2003). 10.1046/j.1365-2818.2003.01100.x [DOI] [PubMed] [Google Scholar]
- 9.Benschop J., van Rosmalen G., “Confocal compact scanning optical microscope based on compact disc technology,” Appl. Opt. 30(10), 1179–1184 (1991). 10.1364/AO.30.001179 [DOI] [PubMed] [Google Scholar]
- 10.Kostner S., Vellekoop M. J., “Cell analysis in a microfluidic cytometer applying a DVD pickup head,” Sens. Actuators B Chem. 132(2), 512–517 (2008). 10.1016/j.snb.2007.11.038 [DOI] [Google Scholar]
- 11.Y. Yim, S. Y. Lee, S. Kim, and J. Y. Park, “Multipurpose DVD pick-up scanner for analysis of microfluidics and micromechanical structures,” in Proceedings of IEEE Conference on Engineering in Medicine and Biology Society (Institute of Electrical and Electronics Engineers, Vancouver, 2008), pp. 2749–2751. 10.1109/IEMBS.2008.4649771 [DOI] [PubMed] [Google Scholar]
- 12.Lee Y. C., Chao S., Huang C. C., Cheng K. C., “A compact optical pickup head in blue wavelength with high horizontal stability for laser thermal lithography,” Opt. Express 21(20), 23556–23567 (2013). 10.1364/OE.21.023556 [DOI] [PubMed] [Google Scholar]
- 13.Fan K. C., Chu C. L., Mou J. I., “Development of a low-cost autofocusing probe for profile measurement,” Meas. Sci. Technol. 12(12), 2137–2146 (2001). 10.1088/0957-0233/12/12/315 [DOI] [Google Scholar]
- 14.De Luca G. M. R., Breedijk R. M. P., Brandt R. A. J., Zeelenberg C. H. C., de Jong B. E., Timmermans W., Azar L. N., Hoebe R. A., Stallinga S., Manders E. M. M., “Re-scan confocal microscopy: scanning twice for better resolution,” Biomed. Opt. Express 4(11), 2644–2656 (2013). 10.1364/BOE.4.002644 [DOI] [PMC free article] [PubMed] [Google Scholar]


