Abstract
This paper presents the use and characterization of an electrically focus tunable lens to perform axial scanning in a confocal microscope. Lateral and axial resolution are characterized over a >250 µm axial scan range. Confocal microscopy using optical axial scanning is demonstrated in epithelial tissue and compared to traditional stage scanning. By enabling rapid axial scanning, minimizing motion artifacts, and reducing mechanical complexity, this technique has potential to enhance in vivo three-dimensional imaging in confocal endomicroscopy.
OCIS codes: (170.0110) Imaging systems, (170.1790) Confocal microscopy, (170.3880) Medical and biological imaging, (170.3890) Medical optics instrumentation, (170.6900) Three-dimensional microscopy
1. Introduction
Various axial scanning mechanisms have been implemented for benchtop and endoscopic laser scanning imaging systems to obtain volumetric images of biological tissue [1]. These techniques can be divided into two categories. The first category requires moving the sample or the objective lens relative to the other using translational stages or hydraulic, pneumatic or mechanical scanners [2–4]. The other category does not require any mechanical movement and utilizes moving and shaping of focus and/or wavefront by exploiting chromatic aberrations [5, 6], using adaptive phase compensation techniques [7–10], or utilizing a variable focal length lens [11–13]. These “optical axial scanning” mechanisms can enable relatively faster axial scanning that is less susceptible to motion artifacts in smaller package endoscopes.
Confocal microscopy is an established technique that can provide high resolution, optically sectioned images of a sample by placing a pinhole at the conjugate image plane of the objective lens and allowing only the in-focus light to pass. Although focus tunable lenses have been implemented in nonlinear microscopes [12, 14], the use of these lenses for axial scanning in confocal microscopy is more complicated because of the collection pinhole, and therefore, both the illumination and the detection pathways are affected. Beyond nonlinear microscopy, focus tunable lenses have recently been used for three-dimensional optical tweezers [13], three-dimensional light-sheet microscopy with increased scanning speed [15], focus control in wide-field endoscopy [16], and zoom lens design with no moving parts [17].
Here, we present the use of a commercially available electrically focus tunable lens, wherein the focal length can be varied as a function of the supplied electrical signal, to achieve axial scanning in a reflectance confocal microscope (RCM). To the best of our knowledge, this is the first report of the use of a tunable focal length lens in confocal microscopy for imaging of biological tissue. We have characterized the optical properties of our RCM incorporating an electrically tunable lens (ETL) and quantified lateral and axial resolutions over the axial scan range of such a system. The performance was further demonstrated by imaging of fresh tissue biopsies from the human oral cavity ex vivo and normal skin tissue in vivo.
2. Experimental setup
The confocal microscope used in this paper is a modified version of the system described in detail previously [2]. An 811 nm continuous wave laser (DL808-120-0, Crystalaser, Reno, NV) is used for illumination. A linear polarizer and a half wave plate are used to control the laser power at the sample. The laser beam is raster scanned by two closely spaced scanning mirrors (CRS 8 KHz resonant scanner and 6215HM40 galvanometer scanner, Cambridge Technology, Bedford, MA). The two scanners are followed by a 2✕ beam expander (AC127-025-B-ML and AC127-050-B-ML, Thorlabs Inc., Newton, NJ) relaying the mid plane between the two mirrors onto the back focal plane of a microscope objective lens (CFI Apo 40XW NIR, Nikon). A quarter wave plate is placed before the objective lens which, along with a polarizing beam splitter in the detection path, reduces specular reflection from the optics. The detection arm consists of a lens (AC256-075-B-ML, Thorlabs Inc.) focusing light onto a 75 µm pinhole followed by another lens (AC256-030-B-ML, Thorlabs Inc.) relaying the in focus light onto a photomultiplier tube (H9305-03, Hamamatsu Corporation, Bridgewater, NJ). A digitizer is used for signal collection, digitization at 39.55 MHz and real-time corrected image formation at a frame rate of 7 Hz.
To achieve axial scanning, an ETL should ideally be placed at the back focal plane of the objective lens. However, the ultimate application of this system is to image the human oral mucosa in vivo, and therefore, the imaging arm of the microscope is being designed to incorporate a rigid and relatively thin probe using a miniature objective lens to facilitate access in the oral cavity. While the ETL employed in our system (EL-6-18, Optotune AG, Switzerland; 18 ✕ 19.3 ✕ 8.7 mm3) is one of the smallest tunable lenses commercially available, placing it adjacent to the objective lens would constrain the size of the probe. Therefore, in this study, the ETL was positioned as close as possible to the scanning mirror mount, near the image of the back focal plane of the objective lens, in order to provide a proof-of-concept for confocal endomicroscopes. Figure 1 (Media 1 (458.6KB, AVI) ) depicts the Zemax (Radiant Zemax, Redmond, WA) model of the illumination arm incorporating the Zemax model of the ETL, downloaded from the Optotune website (http://www.optotune.com/). Because the objective lens prescription data was unavailable, a simplified 5 mm focal length lens (L1) was used as the objective lens in the design. Zemax designs for L1, L2, and L3 were downloaded from the Zemax lens catalog.
Fig. 1.
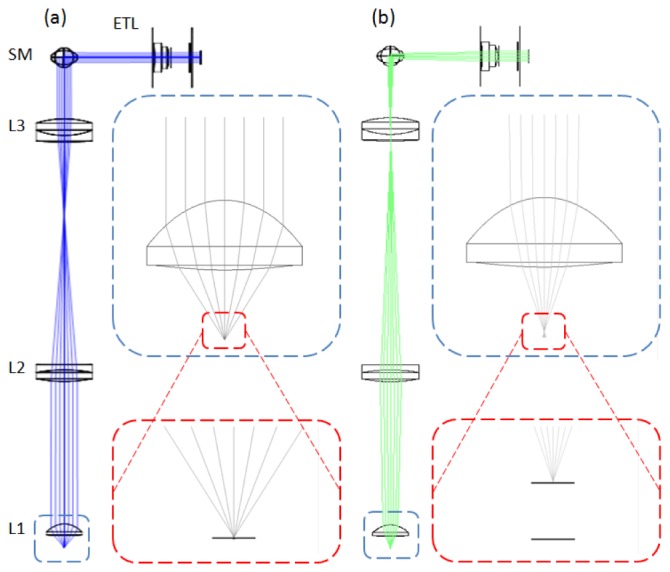
Zemax design showing the illumination arm of the confocal system (Media 1 (458.6KB, AVI) ) including the ETL positioned adjacent to the scanning mirrors (SM). With negative ETL focal lengths, the imaging planes lie further from the lens or deeper in the sample (a), and with positive ETL focal lengths, the imaging planes lie closer to the lens and sample surface (b). The insets show the change in the numerical aperture and focal position at the sample space as ETL changes focal length from (a) f = −127 mm to (b) f = + 44.3 mm. L1: Simplified objective lens, L2/L3: beam expander.
3. Results and discussion
The focal length, f, of the ETL can be tuned from f = −127 mm, increasing in magnitude through collimation (f = ∞), and decreasing to f = + 44.3 mm. The theoretical scan range in the sample space of the confocal microscope can be calculated using the combined effective focal length of the objective lens (f = 5 mm) and the ETL. Tuning the ETL from negative to positive focal lengths corresponds to an effective focal length scan range of 5.2 mm [Fig. 1(a)], through 5 mm (ETL f = ∞), to 4.5 mm [Fig. 1(b)]. Therefore, a full scan of the ETL corresponds to a theoretical axial scan range of ~700 µm in the sample space of the microscope.
To measure the axial scan range and to compare the axial ETL-scanned imaging capability with that of traditional stage scanning, an automated translation stage was used to move the sample. While controlling the current to the ETL in 25 mA increments, the stage was positioned to bring a planar reflective Ronchi ruling in focus, and the corresponding relative position of the stage was recorded. The resolution and image quality degrade significantly at high control current. This can be primarily attributed to inherent aberrations caused by the lens at very high control currents and very low positive focal lengths. Furthermore, the focus of the beam in the conjugate image plane between L2 and L3 scans within the lens L3 element at high current, as seen in Fig. 1(b). Therefore, the image quality was characterized over the practical current range of 0 to 150 mA to maintain acceptable image quality. This control current range corresponds to an axial scan range of 255 µm in sample space as shown in Fig. 2 . The relative focal or axial position as a function of control current can be fitted to a polynomial equation
| (1) |
with R2 = 0.9991, where i is the current in mA and z is the axial distance in µm away from the nominal focal position of the objective lens.
Fig. 2.
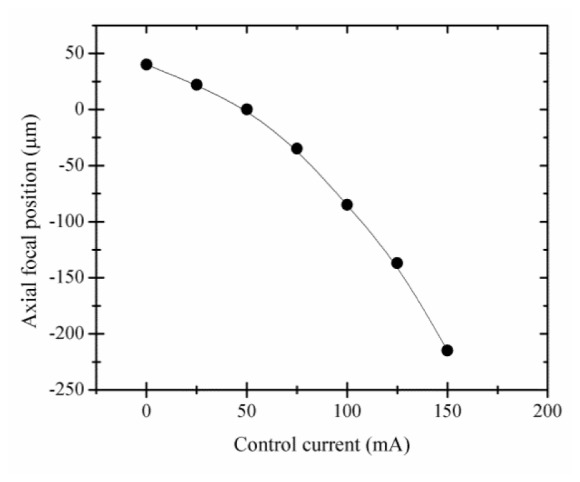
Measured axial position of the focal plane of the confocal microscope relative to the nominal focal position of the objective lens as a function of ETL control current. 50 mA of ETL current corresponds to no focusing power of the ETL (f = ∞) and the focus in sample space positioned at the working distance of the objective lens. Increasing axial position indicates increased depth in the sample. 150 mA ETL control current corresponds to an axial focal position above the nominal focal position by 215 µm. 0 mA ETL control current corresponds to an axial focal position below the nominal focal position by 40 µm.
The effect of the ETL scan on image magnification was characterized as a function of axial position of the object. Without the ETL or with the ETL focal length set to infinity, the total magnification of the microscope is 30 and the field of view is ~625 µm. The magnification varies from a factor of 1.03✕ at z = 40 µm to 0.87✕ at z = −215 µm, which is less than 20% change over the 255 µm scan range. The maximum change in system vignetting with ETL focal length change is measured to be 23%.
To characterize the image quality throughout the axial scan, the lateral and axial resolutions were measured at different focal positions spanning the axial scan range. Imaging a reflective positive high-resolution US Air Force test target immersed in water, the smallest elements in group 9 element 3, corresponding to line widths of 775 nm, are clearly visible over the entire 255 µm axial scan range. Using the intensity profile crossing the edge of a group 6 element 6, the full-width half-maximum (FWHM) lateral resolution was measured using the derivative of the edge-response function, which corresponds to the cross section of the point spread function [18]. The FWHM axial resolution was measured by translating a planar mirror immersed in water using the translation stage in 0.5-µm axial steps for each of the ETL fixed focal positions. The results are summarized in Fig. 3 , which shows both the theoretical and the experimentally measured lateral and axial resolution values along the 255 µm axial scan range. Without the ETL, the theoretical lateral and axial resolution of the microscope are 0.46 and 4.2 µm, respectively. As the focal depth decreases, shifting the focal position closer to the objective lens, lateral and, more significantly, axial resolution increase. This loss in image quality, also evident in the theoretical axial resolution plot in Fig. 3, can be attributed to reduced numerical aperture as the beam diameter entering the objective lens decreases, as illustrated in Fig. 1. In addition to more spherical aberrations at higher control current, the ETL becomes more sensitive to misalignment yielding coma. Furthermore, the vertical orientation of the ETL within the system results in intensified aberrations due to effects of gravity on the liquid lens. The resultant change in resolution across different imaging depths is in agreement with the features seen during imaging of oral epithelium and discussed below.
Fig. 3.
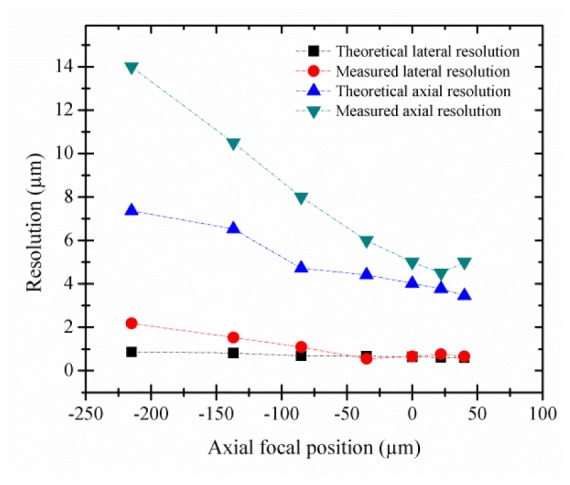
Theoretical and measured FWHM lateral and axial resolutions as a function of focal position.
To demonstrate the performance and application of the ETL in RCM, imaging was performed ex vivo on biopsy tissue from the human oral cavity clinically diagnosed as inflammatory gingival hyperplasia using ETL scanning and traditional stage scanning for comparison. To further demonstrate ETL scanning speed in vivo, imaging of healthy skin was performed on the lateral nail fold of a finger. The imaging protocols were reviewed and approved by the Institutional Review Boards at Texas A&M University (TAMU) and TAMU-Baylor College of Dentistry.
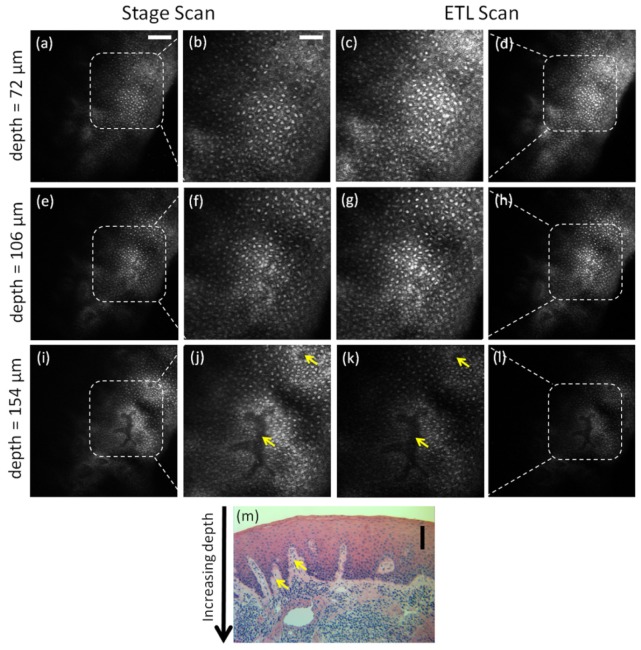
After tissue excision from the oral cavity, the biopsy tissue was transported from the clinic to the laboratory in phosphate buffered saline (PBS) solution on ice and was imaged within one hour of excision. Before imaging, the biopsy tissue was soaked in vinegar for one minute which can increase the contrast between the nuclei and the cytoplasm of the epithelial cells in RCM imaging [19]. Following imaging, the biopsy tissue was fixed, processed for histopathology, and diagnosed as inflammatory fibrous hyperplasia. For RCM imaging of the oral biopsy, the tissue was mounted using small tweezers and immersed in sterile PBS solution in a petri dish placed on the translation stage. The biopsy tissue was first imaged with stage scanning in axial steps of 2 µm, while the ETL control current was set to 50 mA (f = ∞). Subsequently, the translation stage was positioned so that the image plane was approximately 150 µm below the surface of the tissue. The same location in the biopsy tissue was then imaged using ETL axial scanning with a scan frequency of 0.1 Hz and axial scan range of 177 µm within the tissue. To directly compare RCM images of tissue acquired using ETL scanning to those acquired with stage scanning, images from corresponding depths within tissue were selected and compared. To improve contrast and visualization of subcellular features, all images and corresponding media were cropped and contrast-enhanced using ImageJ software (http://imagej.nih.gov/ij/, National Institutes of Health, Bethesda, MD).
Figure 4 (Media 2 (1.4MB, AVI) ) shows images and videos obtained with both stage scanning [Figs. 4(a), 4(b), 4(e), 4(f), 4(i), and 4(j)] and ETL scanning [Figs. 4(c), 4(d), 4(g), 4(h), 4(k), and 4(l)] at increasing depth below the surface of the oral biopsy tissue. In the images and videos, the epithelial nuclei can be seen as bright spots. In the superficial cell layers, the cell borders can be seen as relatively bright lines around the darker cytoplasm surrounding the nuclei. The dense chromatin in the cell nuclei, as characterized by hyperchromatism in the histology image, in addition to the aceto-whitening effect, favors the visualization of clear and bright nuclei in RCM images. As the axial scans approach greater depths in the tissue, it can be seen that the cytoplasm (darker area) shrinks and the nuclei become more closely spaced. This is characteristic of oral epithelial tissue wherein the cells show maturation from the deeper basal layers to the superficial layers of the epithelium, and therefore, the nuclear-to-cytoplasmic ratio and the nuclear density increase with depth in the epithelium. The top surface of the papillary region of the lamina propria between the rete ridges at the base of the epithelium can be seen as relatively darker areas in the deeper layers of the tissue (identified by arrows). Note that at any given time during the scan, the tissue does not completely fill the field of view. This is due to the specific location of the tissue being imaged not being completely flat relative to the image plane; the surface of the tissue in the top left of the field of view is above the surface in the center. The depths assigned to the confocal images shown in Fig. 4 were based on the tissue surface defined at the center of the image. In the corresponding histology image in Fig. 4(m) (cut vertically through the mucosa in comparison to the en face image orientation of RCM), the distribution of the darkly stained nuclei from the superficial layer to the base of the epithelium and the rete ridges distribution correspond well with RCM images.
Fig. 4.
Confocal images and video (Media 2 (1.4MB, AVI) ) from stage scan (a,b,e,f,i,j) and ETL scan (c,d,g,h,k,l) through oral mucosa ex vivo taken from 72 µm (a-d), 106 µm (e-h), and 154 µm (i-l) below the surface of the tissue, corresponding to axial focal positions of z = −143, −109, and −61 µm, respectively. Zoom in images (b,c,f,g,j,k) clearly show nuclei as bright spots surrounded by dark cytoplasmic media. Corresponding histology image is shown (m) cut vertically through the epithelium. Arrows in confocal and histology images point to papillary regions of connective tissue between rete ridges. Scale bars: 100 µm in (a) for (d,e,h,i,l), 25 µm in (b) for (c,f,g,j,k), and 100 µm in (m).
To demonstrate in vivo imaging using ETL scanning, the skin of the lateral nail fold was imaged on a normal volunteer’s finger. The finger was positioned on the stage for support to minimize motion, and ultrasound gel (refractive index of 1.3526) was used as an index-matching medium between the skin and the objective lens. RCM video was acquired with ETL axial scanning at 0.2 Hz using a triangular control signal and an axial scan range of 177 µm. Figure 5 (Media 3 (5.4MB, AVI) ) shows images and video of in vivo imaging of skin using ETL axial scanning. Media 3 (5.4MB, AVI) shows two cycles of scanning from the tissue surface to approximately 177 µm below the surface and back, demonstrating minimal motion artifact and repeatable axial scanning in tissue in vivo. Video in Media 3 (5.4MB, AVI) and the extracted frames in Fig. 5(a) at approximately 90 µm deep and Fig. 5(b) at approximately 160 µm deep in tissue demonstrate visualization of tissue structures in different layers of tissue.
Fig. 5.
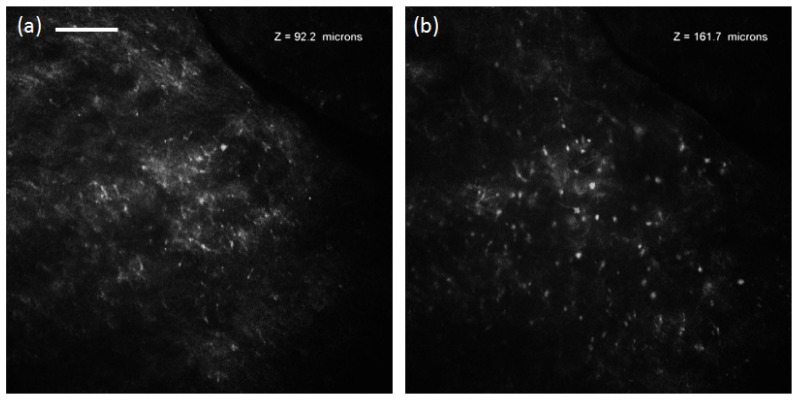
In vivo confocal video (Media 3 (5.4MB, AVI) ) acquired at 0.2 Hz ETL axial scan through 177 µm of normal skin, and images from approximately 92 µm (a) and 161 µm (b) below the surface of the tissue. Scale bar: 100 µm.
4. Conclusion
In summary, we have presented the use of an electrically tunable focus lens for axial scanning in confocal microscopy. The capability of such a system is demonstrated by imaging oral epithelial tissue ex vivo and skin tissue in vivo. We have characterized the lateral and axial resolution over a scan range of 255 µm. The effect of degradation of resolution near the surface of the sample can be visualized in the superficial layer of the oral epithelium [Figs. 4(b) and 4(c)]. Cell nuclei appear slightly more crowded in the ETL scanned image near the surface primarily due to worse axial resolution (~10 µm for ETL versus ~5 µm for stage scanning), and cell borders are slightly blurred likely due to worse axial and lateral resolution. This effect is less evident as the ETL scanned focal plane increases in depth and axial and lateral resolutions improve [Figs. 4(f), 4(g), 4(j), and 4(k)]. Degradation in resolution near the surface of tissue is preferable over worse resolution deeper in tissue because nuclei are typically less densely packed in the superficial layers and more crowded near the basement membrane. Furthermore, as the light passes through the epithelium, tissue scattering and wavefront distortion further degrade resolution at deeper depths. One advantage of ETL over other conventional axial scanning mechanisms is the ease of focal position control and speed at which focal position can be adjusted. Depending on the need of the application, the axial scanning can be set to scan slowly and continuously in depth, scan rapidly at speeds to avoid motion artifacts, or jump from discrete depth to depth to capture multiple frames at depths spaced further apart. Although we have demonstrated 0.2 Hz axial scanning in tissue in vivo with minimal motion artifacts (Fig. 5), much faster axial scanning speeds are possible and can be beneficial for some applications if used with a higher-frame-rate imaging system than the system reported here (7 frames/s). The response time of the Optotune EL-6-18 lens is less than 2 ms with a settling time less than 10 ms allowing a scan rate of 100 Hz or more. The integration of ETL scanning into an endoscopic probe has the potential to enable rapid axial scanning in a mechanically simple implementation that can greatly benefit confocal endomicroscopy for in vivo applications.
Acknowledgments
The authors would like to thank Research Assistant Lee Jordan from the Department of Diagnostic Sciences, Texas A&M Health Science Center - Baylor College of Dentistry for technical assistance and help with tissue acquisition. The authors would also like to thank Metrology Concepts for their evaluation of the ETL lens. This work was supported by the National Cancer Institute of the National Institutes of Health (R01 CA138653).
References and links
- 1.Jabbour J. M., Saldua M. A., Bixler J. N., Maitland K. C., “Confocal endomicroscopy: instrumentation and medical applications,” Ann. Biomed. Eng. 40(2), 378–397 (2012). 10.1007/s10439-011-0426-y [DOI] [PMC free article] [PubMed] [Google Scholar]
- 2.Jabbour J. M., Cheng S., Malik B. H., Cuenca R., Jo J. A., Wright J., Cheng Y. S., Maitland K. C., “Fluorescence lifetime imaging and reflectance confocal microscopy for multiscale imaging of oral precancer,” J. Biomed. Opt. 18(4), 046012 (2013). 10.1117/1.JBO.18.4.046012 [DOI] [PMC free article] [PubMed] [Google Scholar]
- 3.Tanbakuchi A. A., Rouse A. R., Udovich J. A., Hatch K. D., Gmitro A. F., “Clinical confocal microlaparoscope for real-time in vivo optical biopsies,” J. Biomed. Opt. 14(4), 044030 (2009). 10.1117/1.3207139 [DOI] [PMC free article] [PubMed] [Google Scholar]
- 4.Sung K. B., Liang C., Descour M., Collier T., Follen M., Richards-Kortum R., “Fiber-optic confocal reflectance microscope with miniature objective for in vivo imaging of human tissues,” IEEE Trans. Biomed. Eng. 49(10), 1168–1172 (2002). 10.1109/TBME.2002.803524 [DOI] [PubMed] [Google Scholar]
- 5.Olsovsky C., Shelton R., Carrasco-Zevallos O., Applegate B. E., Maitland K. C., “Chromatic confocal microscopy for multi-depth imaging of epithelial tissue,” Biomed. Opt. Express 4(5), 732–740 (2013). 10.1364/BOE.4.000732 [DOI] [PMC free article] [PubMed] [Google Scholar]
- 6.Lane P. M., Elliott R. P., MacAulay C. E., “Confocal microendoscopy with chromatic sectioning,” Proc. SPIE 4959, 23–26 (2003). 10.1117/12.485552 [DOI] [Google Scholar]
- 7.Thompson A. J., Paterson C., Neil M. A., Dunsby C., French P. M., “Adaptive phase compensation for ultracompact laser scanning endomicroscopy,” Opt. Lett. 36(9), 1707–1709 (2011). 10.1364/OL.36.001707 [DOI] [PubMed] [Google Scholar]
- 8.Botcherby E. J., Juskaitis R., Booth M. J., Wilson T., “Aberration-free optical refocusing in high numerical aperture microscopy,” Opt. Lett. 32(14), 2007–2009 (2007). 10.1364/OL.32.002007 [DOI] [PubMed] [Google Scholar]
- 9.Kumar S., Wilding D., Sikkel M. B., Lyon A. R., MacLeod K. T., Dunsby C., “High-speed 2D and 3D fluorescence microscopy of cardiac myocytes,” Opt. Express 19(15), 13839–13847 (2011). 10.1364/OE.19.013839 [DOI] [PubMed] [Google Scholar]
- 10.Wu Q., Guo S., Ma Y., Gao F., Yang C., Yang M., Yu X., Zhang X., Rupp R. A., Xu J., “Optical refocusing three-dimensional wide-field fluorescence lifetime imaging microscopy,” Opt. Express 20(2), 960–965 (2012). 10.1364/OE.20.000960 [DOI] [PubMed] [Google Scholar]
- 11.Yang L., Mac Raighne A., McCabe E. M., Dunbar L. A., Scharf T., “Confocal microscopy using variable-focal-length microlenses and an optical fiber bundle,” Appl. Opt. 44(28), 5928–5936 (2005). 10.1364/AO.44.005928 [DOI] [PubMed] [Google Scholar]
- 12.Grewe B. F., Voigt F. F., van ’t Hoff M., Helmchen F., “Fast two-layer two-photon imaging of neuronal cell populations using an electrically tunable lens,” Biomed. Opt. Express 2(7), 2035–2046 (2011). 10.1364/BOE.2.002035 [DOI] [PMC free article] [PubMed] [Google Scholar]
- 13.Optotune Application Note, “Optical focusing in microscopy with Optotune’s focus tunable lens EL-10-30”, (Optotune, 2013), http://www.optotune.com/images/products/Optotune application note EL-10-30 for microscopy.pdf
- 14.Lee K.-S., Vanderwall P., Rolland J. P., “Two-photon microscopy with dynamic focusing objective using a liquid lens,” Proc. SPIE 7569, 756923 (2010). 10.1117/12.842581 [DOI] [Google Scholar]
- 15.Fahrbach F. O., Voigt F. F., Schmid B., Helmchen F., Huisken J., “Rapid 3D light-sheet microscopy with a tunable lens,” Opt. Express 21(18), 21010–21026 (2013). 10.1364/OE.21.021010 [DOI] [PubMed] [Google Scholar]
- 16.Chen H. S., Lin Y. H., “An endoscopic system adopting a liquid crystal lens with an electrically tunable depth-of-field,” Opt. Express 21(15), 18079–18088 (2013). 10.1364/OE.21.018079 [DOI] [PubMed] [Google Scholar]
- 17.Savidis N., Peyman G., Peyghambarian N., Schwiegerling J., “Nonmechanical zoom system through pressure-controlled tunable fluidic lenses,” Appl. Opt. 52(12), 2858–2865 (2013). 10.1364/AO.52.002858 [DOI] [PubMed] [Google Scholar]
- 18.Ouzounov D. G., Rivera D. R., Webb W. W., Bentley J., Xu C., “Miniature varifocal objective lens for endomicroscopy,” Opt. Lett. 38(16), 3103–3106 (2013). 10.1364/OL.38.003103 [DOI] [PubMed] [Google Scholar]
- 19.Drezek R. A., Collier T., Brookner C. K., Malpica A., Lotan R., Richards-Kortum R. R., Follen M., “Laser scanning confocal microscopy of cervical tissue before and after application of acetic acid,” Am. J. Obstet. Gynecol. 182(5), 1135–1139 (2000). 10.1067/mob.2000.104844 [DOI] [PubMed] [Google Scholar]


