Abstract
We present experimental data and numerical modeling of a nonlinear phenomenon in active magnetic microbead rheology that appears to be common to entangled polymer solutions (EPS). Dynamic experiments in a modest range of magnetic forces show: 1. a short-lived high viscosity plateau, followed by 2. a bead acceleration phase with a sharp drop in apparent viscosity, and 3. a terminal steady state that we show resides on the shear-thinning slope of the steady-state flow curve from cone and plate data. This latter feature implies a new protocol to access the nonlinear steady-state flow curve for many biological EPS only available in microliter-scale volumes. We solve the moment-closure form of the Rolie-Poly kinetic model for EPS hydrodynamics, together with a decoupling approximation that obviates the need for a full 3D flow solver, and show that the model qualitatively reproduces the dynamic experimental sequence above. In this way, we explain the phenomenon in terms of entangled polymer physics, and show how the nonlinear event (acceleration and termination on the shear-thinning response curve) is tunable by the interplay between molecular-scale mechanisms (relaxation via reptation and chain retraction) and magnetic force controls. The experimental conditions mimic movement of cilia tips, bacteria, and sperm in mucus barriers, implying a physiological relevance of the phenomenon, and compelling further development of the fully coupled, 3D flow-microstructure model to achieve quantitative accuracy.
Introduction
Microrheology is a technique to determine the response functions of soft materials that are volume limited or heterogeneous at microscopic length scales. In active microrheology (AM), external forces are applied to probe particles to obtain linear and, in some cases (summarized below) nonlinear properties of the medium [1–3]. Early AM methods applied magnetic forces to beads attached directly to cells and interpreted the results through a linear viscoelasticity framework [4]. Later work interpreted the transient response of pulsed magnetic beads in entangled actin networks as an osmotic pressure effect that arises from the packing of actin filaments in front of the bead, the creation of an entropic restoring force, and subsequent diffusion of the actin bundles to relieve concentration gradients [5]. Recent experiments interpret nonlinear behavior for probes in colloidal suspensions as shear thinning [6, 7], rods in entangled λ-DNA solutions also as shear-thinning [8], and for rotating discs in collagen solutions as a yield stress [9].
In previous work we used our AM system to show steady-state shear thinning for magnetic nano-rods embedded in entangled λ-DNA solutions [8]. Here, we focus instead on the transient dynamics and asymptotic quasi-steady response of magnetically driven microspheres for a controlled constant force. The microscale nonlinear responses of these materials are largely unknown and the primary challenge rests in determining the unsteady Lagrangian flow field and the inhomogeneous stress distribution around the probe particle [1, 2, 12]. We report a fundamental experimental signature of nonlinearity, coupled with mathematical modeling that explains the experimental signature using principles of entangled polymers. We model the evolution of the medium compliance as a function of the molecular-scale entangled polymer parameters and the applied force. We thereby illustrate tunability of the nonlinear response (bead acceleration, convergence onto the shear thinning slope of the steady-state flow curve), as well as tunability of the timescales of the nonlinear phenomena relative to experimental observational times.
Most rheological inferences from AM experiments are based on the generalized Stokes-Einstein relation (GSER) which gives the diffusivity (D) of a particle of radius a in a medium with viscosity η, D = kBT/(6πaη)[2]. Once experimental conditions violate the assumptions that allow the GSER formulation, the expected agreement between microscopic and macroscopic measurements is lost. Squires and Mason [2] surveyed conditions under which the Stokes-Einstein relation may fail. For instance, the Einstein component breaks down when actuated probes drive the surrounding polymer system out of equilibrium [2]. Similarly, the Stokes component is violated when the system is heterogeneous at the length scales explored by the particle, the particle size is comparable to the characteristic length scales of the polymer network, or in the presence of particle-material chemical interactions [2]. In such instances, it is unclear how to interpret the experimental measurements in a rheologically meaningful way. In contrast, the sharp shift in bead velocity from our experimental data makes it clear that the moving bead drives the material out of equilibrium. The main challenge when interpreting these nonlinear data lies in understanding the non-equilibrium microstructure and how it affects particle mobility. To address this challenge we must explicitly compute the perturbed microstructure surrounding the particle. As noted above, various models have been developed for this purpose, e.g., in [5] a model for a clump of piled-up filaments in front of the bead is used to explain transient behavior. We propose instead to gain quantitative accuracy by numerical solution of the controlled magnetic force, the kinetic Rolie-Poly model for entangled polymer solutions, and the full 3D momentum balance for the flow field. We are not aware that such a code exists, and thus we make a decoupling approximation to finesse the flow computation, which is then used to evolve the bead motion and R-P microstructure evolution equation for the entangled polymer conformation tensor.
The constant magnetic force microbead experiments presented below reveal striking bead acceleration transients and non-Stokesian asymptotic velocities (i.e., they do not scale linearly with force) at modest forces (1-30 pN). We then provide a molecular-scale mechanistic explanation of the nonlinear behavior in both the transients and the asymptotic behavior. In this regard, our experimental-modeling protocol complements the study of individualistic λ-DNA molecular dynamics by Teixeira et al. [10] through the interrogation and predictive modeling of non-equilibrium entangled polymer hydrodynamics.
Several numerical and asymptotic methods have been proposed to analyze and model experiments for spheres in viscoelastic fluids falling under gravity in a confined cylinder; cf. [17–19, 27]. While these approaches capture experimental observations in a qualitative way, they still fail to give quantitative accuracy [19]. Recent numerical and perturbation schemes [26,28] provide clever alternative methods to approach this problem for specific constitutive models, but it remains to determine whether they give quantitative agreement with experiments.
For our experiments, we choose λ-DNA, guar, and Hyaluronic Acid (HA) solutions for their relevance in many driven-flow paradigms found in physiology. A significant amount of DNA is present in pathological mucus (sputum), a material the lung must eliminate to safeguard against infection [13]. Guar, often used as a thickening agent in foods, has had some success as a mucus simulant [14]. HA, found throughout the body, is especially instrumental in dissipating stresses in load-bearing joints. The physiological phenomena involving these biopolymer solutions comprise a wide range of forcing at transient shear rates, suggesting that non-equilibrium fluid dynamical phenomena play essential roles in human physiology.
Materials and Methods
Sample preparation
We prepared our λ-DNA solution (Invitrogen, Carlsbad, CA, 25250-028), at a concentration of 1.4 mg/mL by concentrating stock λ-DNA with centrifuge filters (Amicon Ultra UFC510024) that had a molecular weight cutoff of 100 kD. A λ-DNA solution at this concentration should be in the entanglement regime with an average of 20 entanglements per chain, a reptation time of 3.2 s, and a plateau modulus of 0.9 Pa. For the guar solution it was necessary to use centrifugation (15,000g for 10 minutes) to eliminate large aggregates of material left in the original powder. The guar, prepared at a concentration of 15 mg/mL, is also in the entanglement regime with an average of 50 entanglements per chain, a reptation time of 0.75 s, and a plateau modulus of 49 Pa. Lastly, the HA solution (Sigma-Aldrich 53747), prepared at 10 mg/mL, is in the semidilute regime, has a reptation time of 0.2 s and a plateau modulus of 46 Pa. The molecular weight for each solution we obtained from the manufacturer; contour length and number of entanglements per chain we calculated using persistence lengths obtained from the literature [29-31]; reptation time and entanglement modulus for each solution we found through fittings of CAP data to the Rolie-Poly model as described in the results section.
Microrheology experiments
We used our magnetic-tweezers system to probe the three biopolymer solutions, by embedding 1 μm diameter beads into these solutions and measuring creep response curves that lasted from 0.2 to 15 s as described previously [11]. Briefly, we place a small specimen volume (1-3 μL) inside the magnetics stage and apply a step current that generates a step force FM ranging from 1 to 1000 pN over small bead excursions X(t) (< 5 μm) with an 8.6 ms temporal resolution[11].
Cone and plate rheometry
To compare our microrheology measurements with classical macroscopic measurements, we employ a stress-controlled rheometer (AR-G2, TA Instruments, DE) with cone and plate geometry that had a 40 mm diameter and a cone angle of 1 degree. The instrument applied a constant shear rate (in feedback) and recorded the evolution of the shear stress, τxy, as a function of time. The steady state values are then used to create a flow curve of viscosity, η, versus shear rate, γ̇, where η = τxy/γ.
Mathematical Modeling
We model the transient motion of a spherical probe of radius a and mass m accelerating in a viscoelastic fluid under the influence of a constant applied magnetic force, FM. In this setup, a balance between the magnetic force and the drag force exerted by the fluid, FD, gives the instantaneous acceleration of the probe,
| (2) |
The drag force acting on the probe is obtained by integrating the normal traction over its surface,
| (3) |
where n^ is the inward-pointing unit normal vector, ηs is the viscosity of the solvent, v is the velocity field induced by the probe's displacement, and σ is the extra stress tensor arising from conformational changes of the entangled polymer molecules immersed in the solvent [15]. As we discuss below, we impose a flow decoupling approximation that allows us determine a closed-form expression at each time step for the velocity field external to the bead.
To close the system of equations (2-3), a constitutive equation for σ is required; here we use the Rolie-Poly model for entangled polymer solutions [16]. In this model, the evolution of the extra stress is given by,
| (4) |
Within this constitutive equation, two characteristic time scales govern the dynamics of the polymer network: the relaxation by chain orientation, described by the reptation time τd = 3Z3τe, and the relaxation by chain stretch given by τR = Z2τe [16]. Here, τe is the Rouse relaxation time of an entanglement segment and Z is the number of entanglement segments in a chain. In addition the parameter 0 ≤ β ≤ 1 captures the effects of convective constraint release. In this study, we fix β = 1, following [10, 16].
Once the velocity field around the bead is determined (Equation (5) below), Equations (2)-(4) constitute an integro-differential system of non-linear partial differential equations. The initial conditions at t = 0 assume that the polymer molecules are at equilibrium so that σ = I, and from the Stokes relation (Eqn.1) we impose an initial value for the velocity of the probe that assumes the bead begins with the Stokes response speed,
To impose the boundary conditions, we update the local conformational distribution of the polymer molecules at the bead surface to calculate the extra stress.
Our major modeling assumption is made to bypass a full solution of all hydrodynamic and stress fields in space and time. Specifically, we assume that the bead translational velocity at each time step, U (t), generates an instantaneous quasi-steady Stokes velocity field. The velocity field is thereby explicit; in spherical coordinates and assuming axisymmetric flow (νϕ = 0), this field is given by [20],
| (5) |
In this study we show that our approximate model is sufficient to capture the experimentally observed behavior while also computationally tractable, allowing us to explore a wide range of model parameters. Note that the standard linear viscoelastic protocol measures the steady state velocity, U∞, assumes that the only forces on the probe are due to viscous drag and magnetic forces, and uses Eqn. 1 to get the viscosity; our extension of this protocol models a non-uniform bead motion. Since U (t) is governed by the force balance at the surface, it results in a viscosity that evolves in time through shear thinning and thickening states. Our goal with the approximate model is to identify the underlying molecular basis for the conformational dynamics of the entangled polymer molecules that result in bead takeoff events and that emerge in the convergence to non-Stokesian quasi-steady velocities.
To find the state of the system (2-5) at t + Δt we proceed as follows (see Fig. 5): The bead velocity at time t, U (t), is used to evaluate the velocity gradient tensor, κ = (∇ν)T at the bead surface through Eqn. (5). We then update the extra stress by integrating Eqn. 4 using a semi-implicit finite difference scheme. This stress is then used to compute the new drag force on the sphere via Eqn. (3); with this new drag force we then update the velocity using Eqn. (2). In this way, Eqns. (2-5) constitute a closed 7-dimensional nonlinear dynamical system for U (t) and σ (t, a, θ), given a magnetic force, FM, and a bead diameter, a.
FIG. 5.
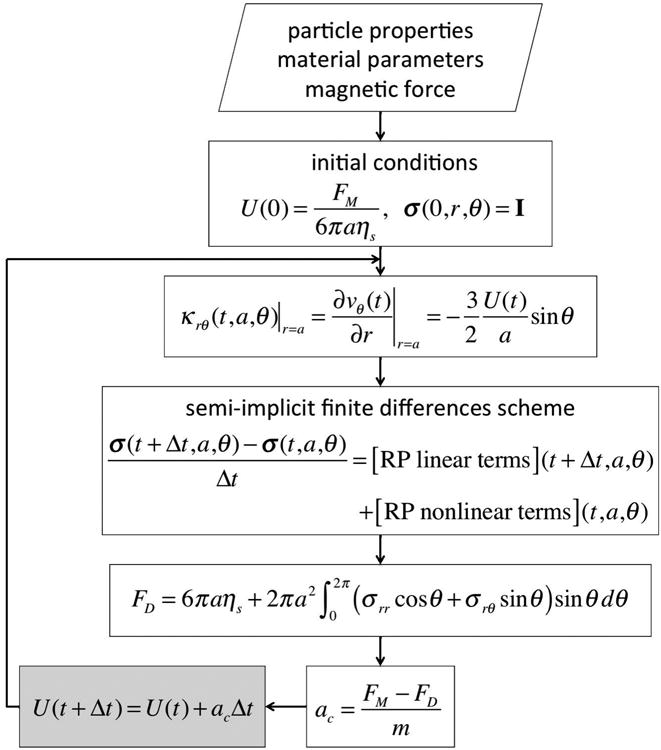
The model and flowchart used to solve the system of equations (2)-(5).
We note that, when the nonlinear stress terms in the Rolie-Poly equation (4) are small, the model reduces to the Upper Convected Maxwell (UCM) model,
| (6) |
To find the steady state solution to this model, we assume that the functional form of the stress is the same as in the linear viscoelastic case and introduce the following transformations,
| (7a) |
| (7b) |
Then the drag force is explicitly given by
| (8) |
The resulting system of differential equations is:
| (9a) |
| (9b) |
| (9c) |
The steady state solution of Eqns. 9 is likewise explicit:
| (10a) |
| (10b) |
| (10c) |
Analysis of the dynamical system (9) reveals that the steady state given by Eqns. (10a-c) is a unique stable attractor. Thus, in solutions to the UCM model, the asymptotic velocity is unique, given by Eqn. (10a). Moreover, this value has the same functional form, which is linear in the magnetic force, as the velocity obtained for a viscous fluid with an “effective” viscosity ηeff = ηs+2/3 ηp. When we combine FM and a with the measurement of U∞, and confirmed it scales linearly with FM, the standard linear active microbead rheological inference of ηeff follows. We now address breakdown of the linear scaling at a threshold value of FM.
Experimental Results and Observations
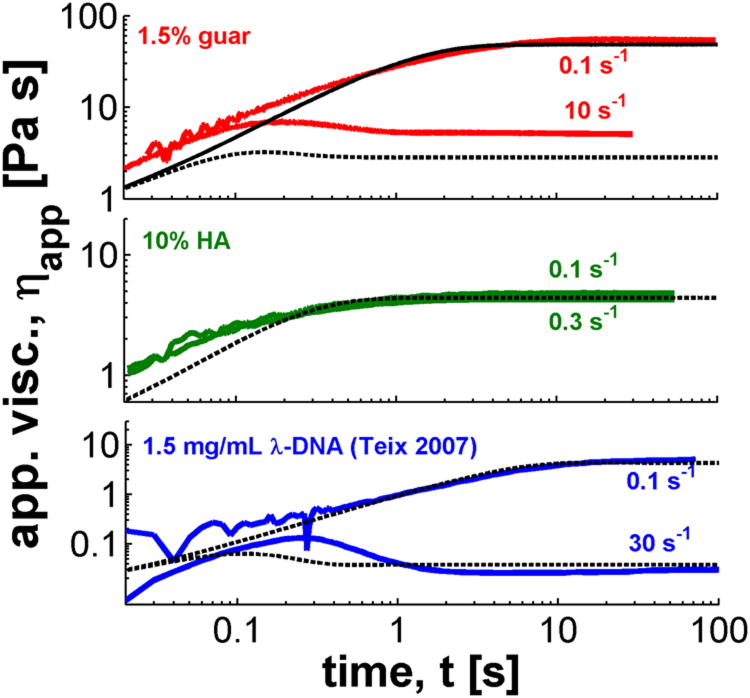
In Figure 1 we show the transient/dynamic response of our test materials to a step strain rate measurement on the CAP rheometer. All three solutions show a linear viscoelastic response at a shear rate γ̇ = 0.1 s−1, where the apparent viscosity is a monotonic function of time. A nonlinear response, detected by a viscosity overshoot, is observed at higher shear rates. The guar solution shows a viscosity overshoot at a shear rate of γ̇ = 10 s−1, and for the DNA data, extracted from Teixeira et al. [10], this occurs at γ̇ = 30 s−1. We note that both of these solutions are at concentrations much higher than their overlap concentration, c*. Conversely for the HA solution, which has a lower relative concentration, overshoots appear at much higher shear rates than the ones shown in the figure.
FIG. 1.
Apparent viscosity ηapp for cone-and-plate (CAP) data (colored curves) on 3 polymeric solutions, with fits to the Rolie-Poly model (black curves).
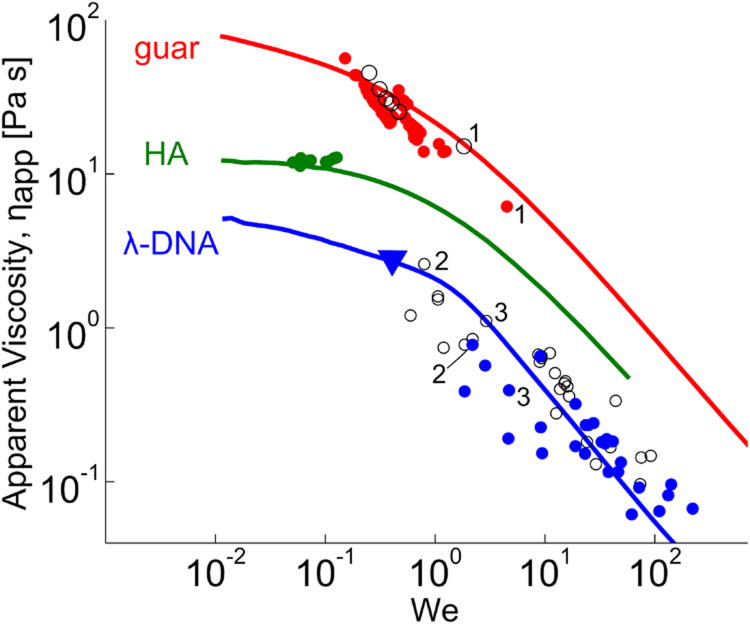
Fig. 2 shows, in solid lines, the steady state apparent viscosity against the Weissenberg number, We =γ̇ τd, where τd is the relaxation time (Table 1). These results show that all solutions investigated in this study exhibit shear thinning for We∼1. This in turn implies that larger dimensional shear rates are necessary to observe shear thinning in the HA data, consistent with Fig. 1. Namely, we expect DNA to shear thin, and hence show overshoots in plots of viscosity versus time, for shear rates γ̇∼1/3.2 = 0.31 s−1; for guar this is γ̇∼1/0.75 = 1.31 s−1; and for DNA γ̇∼1/0.2 = 5 S−1.
FIG. 2.
Measured ηapp of λ-DNA, guar, and HA solutions vs. γ̇ in CAP (solid lines) and in the magnetic tweezer system where open symbols correspond to measurements at U0 and closed symbols at U∞, each obtained from the appropriate regimes shown in detail in Fig. 4. Numerical labels indicate representative U0 and U∞ pairs.
Table I.
Molecular weight Mw, contour length Lc, concentration nc*, number of entanglements per chain Z, reptation time τd, and entanglement modulus Ge of each polymeric system.
| Mw [MDa] | Lc [μm] | nc* | Z | τd [s] | Ge [Pa] | |
|---|---|---|---|---|---|---|
| guar | 50 | 54 | 46 | 50 | 0.75 | 49 |
| HA | 1.6 | 0.5 | 1 | 1 | 0.2 | 46 |
| λ-DNA | 32 | 14.7 | 18 | 20 | 3.2 | 0.86 |
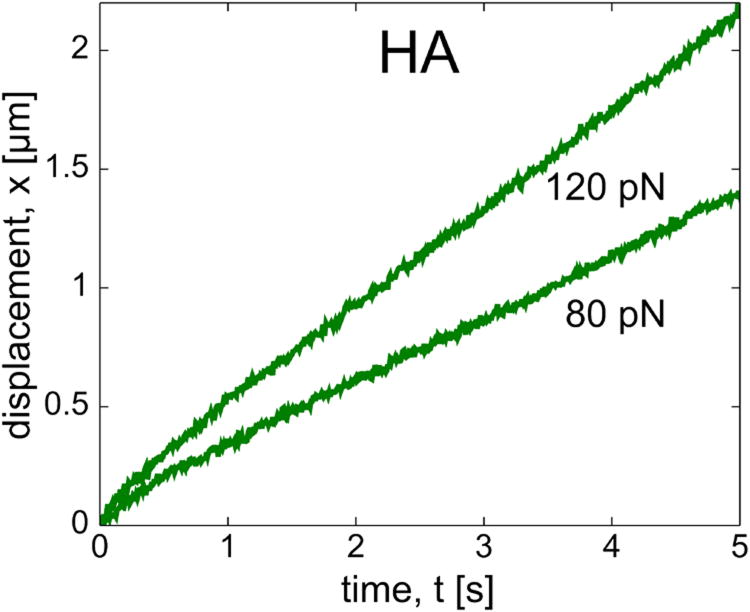
Fig. 3 shows bead displacement versus time for different applied magnetic forces in the HA solution. These microscale data indicate that HA shows a typical Stokes response, and this is true for all applied forces accessible with our experimental setup.
FIG. 3.
Bead displacements in HA showing the scaling of steady-state velocity consistent with linear rheological behavior and Stokes drag.
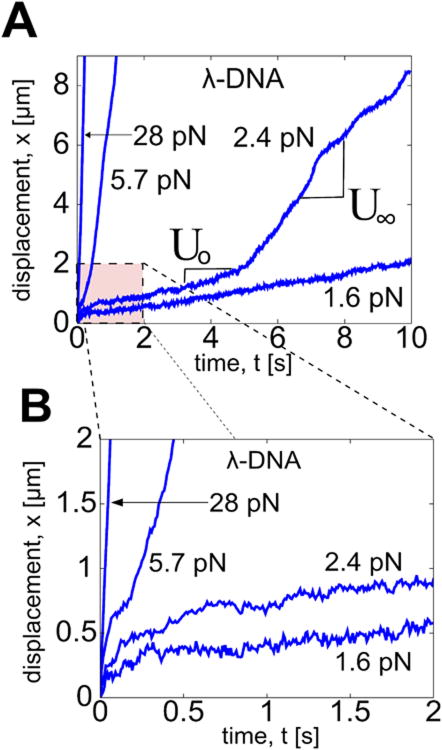
Figure 4 shows microscale measurements for DNA where we find the typical Stokes response below a force threshold FM = FT. Below FT, the bead dynamics quickly reaches a steady-state velocity (U∞). Above FT a remarkable dynamic transition sequence occurs: first an initial, apparently steady, velocity U0, followed by a bead acceleration phase and subsequent saturation to a terminal velocity U∞ that scales nonlinearly with the applied magnetic force FM. The ratio U0:U∞ in our experimental datasets ranges from 1:2 to 1:10. Guar data, not shown here, exhibit the same acceleration events as DNA. For both λ-DNA and guar, we distinguish linear from nonlinear asymptotic response when U∞ fails to scale linearly with FM. Importantly, the timescales of the initial Stokes response U0 and the acceleration phase are potentially below experimental resolution, easily leading one to misinterpret the asymptotic steady velocity, U∞, as a linear Stokes response and thereby report an erroneous Stokes viscosity. Therefore, the detection of the nonlinear threshold force FT is critical, and it follows by the force sweep protocol and scaling of bead displacement.
FIG. 4.
(A) Bead displacements in λ-DNA for constant applied forces. Note transition from U0 to U∞ in the 2.4 pN trajectory. (B) Zoom-in of early responses in (A) showing transition for the 5.7 pN trajectory.
The Stokes solution for a drag force FD on a bead of radius a moving at constant speed U provides the maximum shear rate at the bead surface, . From Stokes drag law,
we infer the apparent viscosity ηapp from both U0 and U∞. We plot these values of ηapp in Fig. 2 as discrete data points. Remarkably, ηapp(U0) and ηapp(U∞) lie, within experimental error, on the viscosity vs. shear rate curve from CAP experiments for all three biopolymer solutions. Further, for trajectories that show a bead acceleration event, the asymptotic data always lie on the shear thinning part of the curve. It is clear that for HA, the applied forces cannot generate sufficiently large shear rates to shear thin the solution, in accord with CAP measurements; thus all AM data for HA lie on the viscosity plateau at low shear rates as expected for a viscoelastic material in the linear response regime. Our magnetic bead system is unable to drive HA into the nonlinear regime.
Numerical Results and Discussion
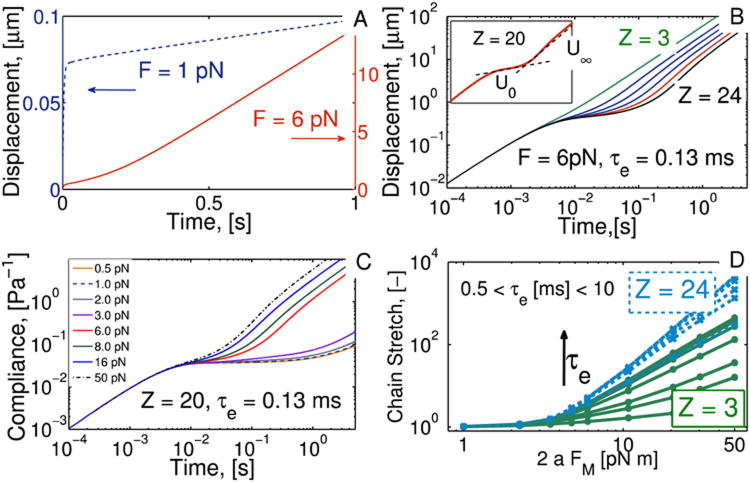
Solutions to the system of equations (2-5) show that, at short times, the bead displacement exhibits a linear Stokes response, i.e., a deceleration from the initial velocity (U(0) =FM/6πaηs). This deviation from the initial Stokes velocity comes from the change in the drag force, as a result of a non-zero viscoelastic stress in Eqn.(3). Such deceleration is independent of the viscoelastic parameters. This initial regime is shown in Figs. 6B-C at t < 10−2 s. Here, compliance is found by multiplying bead displacement (denoted X in the Figures) by 6πa/FM. After this Stokes regime, and depending on the applied force and model parameters, the bead velocity either plateaus to a single value or transitions between two states. We first analyze this transition in terms of the applied force by keeping the model parameters, τe and Z, constant.
FIG. 6.
Rolie-Poly model simulations. (A) Predicted displacement X for beads driven by low (blue-dashed) and high (red) FM, producing linear and non-linear responses, respectively. (B) Increasing Z invokes a nonlinear response. (C) Compliance (6πaX/FM) vs. force plots show that these curves do not overlap, indicating nonlinear material response. (D) Chain stretch, with tr(σ)/3 = 1 for chain configurations close to equilibrium.
As before, we define FT as the threshold value for the applied force that differentiates the two responses described above. When FM < FT the nonlinear corrections to the standard linear viscoelasticity are negligible, and the velocity scales linearly with the magnetic force, or equivalently, the compliance curves in Fig. 6C overlap at all times. In these conditions there is no bead takeoff event. As FM increases past the threshold value, the bead transitions from an apparent Stokes velocity, U0, through an acceleration phase followed by convergence to a terminal constant velocity, U∞. This terminal velocity does not scale linearly with FM, as seen by the shift in the high compliance curves in Fig. 6C. These results are consistent with the experimental data discussed previously.
Now we turn our attention to the dependence of bead displacement to model parameters. In order to establish the critical role played by entanglement dynamics, we take the limit τR →∞, which reduces the Rolie-Poly model to the UCM model. As determined above analytically, solutions of the UCM model do not exhibit bead acceleration events for any set of parameters. We conclude that the experimental phenomenon of interest here is not due to pure chain orientation dynamics. Instead, since the viscosity predicted by the UCM model increases monotonically in time, we focus our investigations on stretching and retraction dynamics and consider their effects on transient shear thickening and thinning events.
Within the Rolie-Poly model the normalized trace of the conformation tensor, tr(σ)/3, gives the end-to-end stretch of the average polymer chain. Therefore, within our analysis of chain stretching and retraction dynamics, we can use tr(σ)/3 as a metric to infer the foundation of nonlinear behavior and bead takeoff dynamics. Additionally, the nonlinear terms in Eqn. (4) vanish when tr(σ)/3∼l, which in turn implies that the chains are near equilibrium. Our numerical investigation of the model parameter space shows that bead takeoff events occur when tr(σ)/3 is O(10) or larger.
As a first step in understanding the role that chain stretching dynamics plays in the bead takeoff phenomena, we explore in Fig. 6D the steady state behavior of tr(σ)/3 as a function of FM, Z, and τe. When the number of entanglements is small (Z = 3 in the figure), chain stretching increases significantly with increasing entanglement relaxation time, τe. In this dilute regime chains cannot relax to their equilibrium configuration within time scales comparable to those of the applied deformation. Here the relaxation of individual entanglement segments plays a crucial role in the relaxation dynamics of the whole chain. Further increase in Z, with a constant force, results in an increase in chain stretching; however, in this case the dependence on τe is weaker. This arises because, for larger Z, the entangled network of chains dominates the relaxation dynamics, rather than the entanglement segments. This behavior of the chain stretching and the fact tr(σ)/3 is directly related to bead takeoff events, strongly suggests that the amount of deformation and the ability of the network to relax after the deformation play a major role in the bead takeoff dynamics.
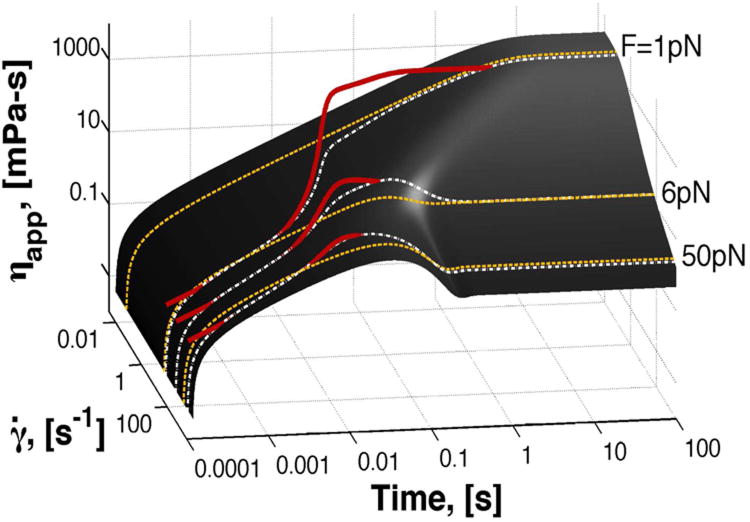
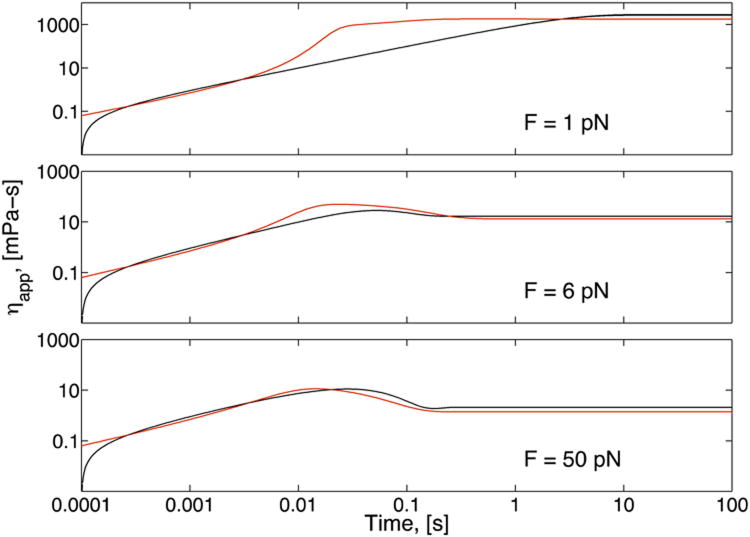
So far we have shown how significant steady state values of chain stretch signal a nonlinear microstructural effect due to relaxation mechanisms involved in the bead acceleration. Next, we focus on the analysis of the temporal evolution of stress around the bead to reveal the mechanisms and timescales involved in this departure from linear behavior. Fig. 7 depicts a surface plot generated by a family of constant-shear-rate solutions of Eqn. (4) using parameter values for λ-DNA given in Table 1. Bead trajectories at long times reproduce ηapp(U∞), consistent with experimental data on the steady state shear thinning curve in Fig. 2. The dashed yellow curves correspond to the traditional viscometric CAP measurements with a controlled, constant shear rate. Solutions of the system (2-5) give ηapp(t),=σrθ(t)/γ̇(t), corresponding to the solid red curves in Fig. 7 and their respective projections onto the surface are shown in white dashed curves. Here, the unsteady nature of the Lagrangian flow field around the bead is evident as the shear rate and viscosity change in time, transverse to lines of constant shear rate. Note that the viscosity overshoot experienced by the bead is larger in experiments where the force is constant (white), compared to those where the velocity is constant (yellow). Nonetheless, since the beads asymptotically approach a constant U∞, and thus a constant γ̇∞, the Rolie-Poly simulations of viscosity versus shear rate recover the CAP steady state shear-thinning curve.
FIG. 7.
Surface of apparent viscosity, ηapp, versus time, obtained from solutions of the Rolie-Poly model with imposed constant shear rate, γ ˙(t). Three examples of CAP experiments are shown in yellow curves, which correspond to experiments with constant shear rate. Red curves correspond to Rolie-Poly simulations of magnetic bead trajectories with their surface projections shown as white dashed lines. Recall that the initial condition for the bead trajectories (red lines) is U(0) = FM/6πaηs, in our simulations ηs = 0.005 Pa-s and a = 0.5 microns.
Thus, to observe bead takeoff, the bead trajectory must pass through a region of viscosity overshoot. Because the shear history on a bead can take any “trajectory” for a given set of parameters, we now illustrate tunability of the nonlinear behavior; i.e., we now prescribe conditions that induce the viscosity overshoot and, as a consequence, bead takeoff. For bead trajectories with a takeoff event, the duration of U0 depends on how soon the dynamic viscosity trajectory leaves the overshoot region. The time scale of this transition depends on the strength of the deformation, which is a function of FM, and on the surface shape, itself dictated by the polymer chain parameters, τe and Z. The formalism we have developed here using the Rolie-Poly model qualitatively illustrates the bead takeoff phenomena as the interplay between nonlinear relaxation dynamics of the polymer network and rate of deformation imposed by the pulling bead.
Conclusions
In summary, we present and then interpret experimental trajectories of magnetically driven microbeads in entangled polymer solutions with a tunable magnetic force transition from linear to nonlinear response. The modeling qualitatively reproduces the full dynamic sequence of linear and nonlinear bead experiments, with a tradeoff in quantitative accuracy based on a flow decoupling approximation that renders numerically tractable the bead dynamics and surrounding microstructure evolution.
The Rolie-Polie model for entangled polymer solutions is used to afford a microstructural interpretation of the nonlinear behavior.
Above a critical magnetic force, the bead distorts the surrounding entangled network from its equilibrium conformation and generates extra stresses stored by non-equilibrium network and chain conformations. These extra stresses, enhanced by the drag force on the bead, drive the bead out of the linear Stokes regime at non-constant speeds until conformational stresses equilibrate with the applied force, thus dictating the asymptotic bead velocity. The response of the entangled polymer network to the imposed deformation is an interplay between the rate of deformation imposed by the bead and the rate of retraction of the entanglement segments towards their equilibrium configuration. As the pulled bead translates through the entangled network, the imposed deformation extends and orients the flexible polymer chains in the network. The Rolie–Poly model, based on tube theory, states that the equilibration time of the chain contour length is much faster than the relaxation time of the chain orientation. When the force pulling the bead is small, the entangled network is being deformed at rates much slower than the stretch/retraction relaxation rates of the network, and the chains keep their equilibrium contour length under the applied deformation. A viscosity that is a monotonic function of time characterizes this behavior in CAP data, while a single asymptotic bead velocity is the signature in the pulled bead experiments. Conversely, when the rate of equilibration by contour length fluctuations is comparable to the deformation rate, the bead experiences significant microstructural changes characterized by viscosity overshoots in CAP data and a transition between two velocities in the microbead experiments. In this case, an initial accumulation of strains impedes the bead motion until network relaxation occurs. Finally, if the applied force is too large, the bead moves through the overshoot very quickly, giving the appearance of linear Stokes behavior when it is in fact a shear-thinned response. Since the time scale of the viscosity overshoots is related to the relaxation of chain stretching, this last scenario occurs when the deformation rates exceed the rate of relaxation by contour length fluctuations.
We want to emphasize that the qualitative behavior reported here is not unique to the Rolie-Poly model. Simulations with alternative nonlinear viscoelastic models, the Giesekus model for example, recapitulate the nonlinear phenomena illustrated in this work. We chose to use the Rolie-Poly model because its parameters have molecular and network significance for entangled polymer solutions, and we believe a fully resolved kinetic R-P, 3D flow, and bead motion model will yield quantitative accuracy.
The physiological relevance of this overshoot in the apparent viscosity becomes clear when we consider the Weissenberg number We = γ̇τd, where We > 1 describes the regime for shear thinning. We highlight three examples where objects move through mucus, characterized to have a reptation time τd∼40 s [22]. In the lung, 250 nm diameter cilia tips move with velocities of ∼200 μm/s, resulting in a We = O(106) [23]. Bacteria, with diameters of 1 μm, swim through mucus at velocities of ∼30 μm/s [24], giving We = O(106). The acrosome of sperm has a diameter of ∼5 μm and a velocity of 30 μm/s, we calculate a We = O(103) The flagella of sperm, with a diameter of 250 nm and a transverse velocity of 300μm/s experiences a We = O(106) [25]. We therefore suspect that the driven magnetic bead nonlinear dynamic phenomenon can yield insights into understanding hydrodynamic physiological phenomena, which include mucus clearance, infection, and fertility.
FIG. 8.
Simulated bead trajectories (red lines) projected upon planes of constant shear rate (black lines) in the surface shown in Fig. 7. This figure shows that the viscosity overshoot experienced by a bead pulled at a constant force is larger than the overshoot experienced by a bead pulled at a constant velocity.
Acknowledgments
We acknowledge research support from NHLBI(P41-EB002025), NIBIB(R01-HL077546), NSF DMS-0908423, DMR-1122483, DOE DE-SC0001914 and NSF DMS-1100281. We thank Gareth H. McKinley for helpful modeling suggestions.
References
- 1.Squires T. Langmuir. 2008;24:1147. doi: 10.1021/la7023692. [DOI] [PubMed] [Google Scholar]
- 2.Squires T, Mason T. Annu Rev Fluid Mech. 2010;42:413. [Google Scholar]
- 3.Sriram I, Furst E, DePuit R, Squires T. JOR. 2009;53:357. Meyer - furst. [Google Scholar]
- 4.Ziemann F, Radler J, Sackmann E. Biophys J. 1994;66:2210. doi: 10.1016/S0006-3495(94)81017-3. [DOI] [PMC free article] [PubMed] [Google Scholar]
- 5.Uhde J, Feneberg W, Ter-Oganessian N, Sackmann E, Boulbitch A. PRL. 2005;94:198102. doi: 10.1103/PhysRevLett.94.198102. [DOI] [PubMed] [Google Scholar]
- 6.Meyer A, Marshall A, Bush B, Furst E. JOR. 2006;50:77. [Google Scholar]
- 7.Rich J, Lammerding J, McKinley G, Doyle P. Soft Matter. 2011 [Google Scholar]
- 8.Cribb J, Meehan T, Shah S, Skinner K, Superfine R. Annals of Biomedical Eng. 2010;38:3311. doi: 10.1007/s10439-010-0084-5. [DOI] [PMC free article] [PubMed] [Google Scholar]
- 9.Wilking J, Mason T. PRE. 2008;77:055101. doi: 10.1103/PhysRevE.77.055101. [DOI] [PubMed] [Google Scholar]
- 10.Teixeira R, Dambal A, Richter D, Shaqfeh E, Chu S. Macromolecules. 2007;40:2461. [Google Scholar]
- 11.Fisher JK, Cribb J, Desai K, Vicci L, Wilde B, Keller K, Taylor R, Haase J, Bloom K, O'Brien E, Superfine R. Rev of Scientific Instruments. 2006;77:023702. doi: 10.1063/1.2166509. [DOI] [PMC free article] [PubMed] [Google Scholar]
- 12.Squires T, Brady J. Phys fluids. 2005;17:73101. [Google Scholar]
- 13.Rubin BK. Pediatric Respiratory Rev. 2006;7:S215. doi: 10.1016/j.prrv.2006.04.198. [DOI] [PubMed] [Google Scholar]
- 14.King M, Macklem P. J Appl Physiol. 1977;42:797. doi: 10.1152/jappl.1977.42.6.797. [DOI] [PubMed] [Google Scholar]
- 15.Bird R, Curtiss C, Armstrong R, Hassager O. Dynamics of Polymeric Liquids: Fluid mechanics (Wiley. 1987 [Google Scholar]
- 16.Likhtman A, Graham R, Non-Newt J. Fluid Mech. 2003;114:1. [Google Scholar]
- 17.Arigo M, Rajagopalan D, Shapley N, McKinley G. J Non-Newtonian Fluid Mech. 1995;60:225 257. [Google Scholar]
- 18.Rajagopalan D, Arigo M, Shapley N, McKinley G. J Non-Newtonian Fluid Mech. 1996;65:17. [Google Scholar]
- 19.Owens R, Phillips T. Computational Rheology. Imperial College Press; 2002. [Google Scholar]
- 20.Pozrikidis C. Intro to Theoretical and Comp Fluid Dynamics. Oxford Univ Press; 1997. pp. 222–311. [Google Scholar]
- 21.Milner S, McLeish T, Likhtman A. JOR. 2001;45:539. [Google Scholar]
- 22.Puchelle E, Zahm J, Quemada D, et al. Biorheology. 1987;24:557. doi: 10.3233/bir-1987-24606. [DOI] [PubMed] [Google Scholar]
- 23.Hill D, Swaminathan V, Estes A, Cribb J, O'Brien E, Davis C, Superfine R. Biophys J. 2010;98:57. doi: 10.1016/j.bpj.2009.09.048. [DOI] [PMC free article] [PubMed] [Google Scholar]
- 24.Celli J, Turner B, Afdhal N, Keates S, Ghiran I, Kelly C, Ewoldt R, McKinley G, So P, Erramilli S, et al. Proceedings of the National Academy of Sciences. 2009;106:14321. doi: 10.1073/pnas.0903438106. [DOI] [PMC free article] [PubMed] [Google Scholar]
- 25.Ishijima S, Oshio S, Mohri H. Gamete research. 1986;13:185197. [Google Scholar]
- 26.Lee, Young-Ju, Jinchao Xu Computer methods in applied mechanics and engineering. 2006;195:1180. doi: 10.1016/j.cma.2005.05.049. [DOI] [PMC free article] [PubMed] [Google Scholar]
- 27.McKinley, Gareth H. Steady and transient motion of spherical particles in viscoelastic liquids. Transport Processes in Bubble, Drops, and Particles. 2002:338–375. [Google Scholar]
- 28.Moore Matthew NJ, Shelley Michael J. A weak-coupling expansion for viscoelastic fluids applied to dynamic settling of a body. Journal of Non-Newtonian Fluid Mechanics. 2012 [Google Scholar]
- 29.Lu Y, Weers B, Stellwagen NC. DNA persistence length revisited. Biopolymers. 2002;61:261–275. doi: 10.1002/bip.10151. [DOI] [PubMed] [Google Scholar]
- 30.Morris G, Patel T, Picout D, Ross-Murphy S, Ortega A, Garcia de la Torre J, Harding S. Global hydrodynamic analysis of the molecular exibility of galactomannans. Carbohydrate Polymers. 2008;72(2):356–360. [Google Scholar]
- 31.Buhler E, Boue F. Chain persistence length and structure in hyaluronan solutions: ionic strength dependence for a model semirigid polyelectrolyte. Macromolecules. 2004;37(4):1600–1610. [Google Scholar]


