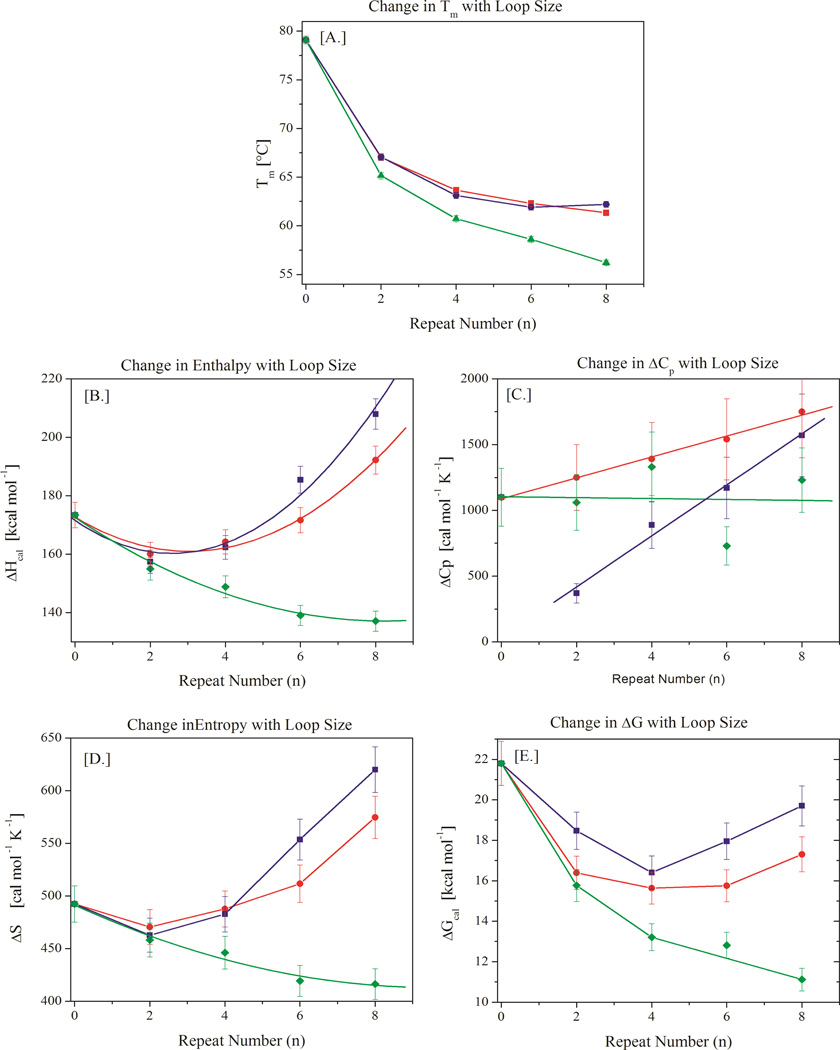
FIGURE 4.
A–E: Variation in thermal (Tm - panel A) and thermodynamic parameters (ΔH – panel B, ΔCp – panel C, ΔS - panel D, and ΔG – panel E) with increasing loop size for CAG repeat bulge loops (blue), CTG repeat bulge loops (red), and TTT repeat bulge loops (green). Note the monotonic decrease in Tm in panel A despite the presence of distinct minima in the thermodynamic state functions displayed in panels B, D, and E.

