Abstract
Objective
Our goal was to determine the economic value of azacitidine in Canada compared with conventional care regimens (ccrs), including best supportive care (bsc) and low- or standard-dose chemotherapy plus bsc in the treatment of higher-risk myelodysplastic syndromes (mdss) and acute myeloid leukemia (aml) with 20%–30% blasts.
Methods
The cost–utility model is a lifetime probabilistic Markov model with a 35-day cycle length consisting of 3 health states: mds; transformation to aml with more than 30% blasts; and death. A third-party public payer perspective was adopted. Overall survival was extrapolated beyond the time horizon of the aza-001 trial comparing azacitidine with ccr. Resource use was determined through a questionnaire completed by Canadian hematologists. Utility values were obtained from two studies in which EQ-5D health questionnaire values were mapped from the European Organization for Research and Treatment of Cancer qlq-C30 survey, and SF-6D scores were mapped from the Short Form 12, elicited from 191 and 43 patients in two different trials.
Results
In the base case, azacitidine had an incremental cost-effectiveness ratio (icer) of $86,182 (95% confidence limits: $69,920, $107,157) per quality-adjusted life year (qaly) gained relative to ccr. Comparing azacitidine with bsc, low-dose chemotherapy plus bsc, and standard-dose chemotherapy plus bsc, the icers were, respectively, $86,973, $84,829, and $2,152 per qaly gained. Results were most sensitive to the utility for azacitidine after 6 months of treatment and to overall survival.
Conclusions
The prolonged 9-month median overall survival with azacitidine relative to ccr fills a gap w hen treating patients with higher-risk mds and aml with 20%–30% blasts. The economic value of azacitidine is within the threshold of willingness-to-pay for third-party public payers for oncology treatments in Canada.
Keywords: Azacitidine, economic evaluation, myelodysplastic syndromes, acute myeloid leukemia
1. INTRODUCTION
Myelodysplastic syndromes (mdss) constitute a heterogeneous group of clonal hematologic disorders that are characterized by ineffective hematopoiesis, leading to one or more peripheral blood cytopenias and progressive bone marrow failure1. Annually, between 1000 and 1500 new mds cases are diagnosed in Canada, with an estimated 80% occurring in people more than 65 years of age2. Based on the International Prognostic Scoring System (ipss), which considers 3 factors (karyotype, bone marrow blast percentage, and number of cytopenias), approximately 30%3 of mds patients fall into the intermediate-2 or high-risk subgroups (grouped together clinically when referring to higher-risk mds). Since 2001, the ipss has classified bone marrow blasts between 21% and 30% as acute myeloid leukemia (aml)4,5. Compared with lower-risk (low-risk or intermediate-1) mds patients, those at higher risk experience shorter survival and more rapid transformation to aml3. Median overall survival after diagnosis is 5.7, 3.5, 1.2, and 0.4 years in the low, intermediate-1, intermediate-2, and high-risk ipss categories respectively3.
Currently available treatments—namely, best supportive care (bsc) alone or bsc plus chemotherapy—do not improve survival or reduce transformation to aml in mds patients1. Azacitidine is a first-in-class epigenetic therapy that was shown, in a multinational phase iii randomized clinical trial (aza-001), to improve overall survival. Patients treated with azacitidine had a statistically and clinically significant prolonged survival of 9.4 months (p = 0.0001) relative to patients treated with conventional care regimens, including bsc, low-dose chemotherapy, and standard-dose chemotherapy6. Approximately twice as many patients treated with azacitidine were alive after 2 years (51% vs. 26%, p < 0.0001), and time to aml transformation with more than 30% blasts (aml>30) was delayed by more than 6 months (p < 0.0001)6. Azacitidine-treated patients also had a reduced incidence of infections needing treatment with intravenous antimicrobials (p = 0.0032) and a reduced need for blood transfusions, with 45% of patients who were transfusion-dependent at enrollment no longer needing transfusions after a median of 21.1 months’ follow-up (p < 0.0001)6.
We performed an economic analysis to determine the incremental cost and quality-adjusted life years (qalys) associated with azacitidine compared with conventional care regimens (bsc alone, low-dose chemotherapy plus bsc, and standard-dose chemotherapy plus bsc) from a Canadian ministry of health perspective in patients with higher-risk mds and aml>30. This analysis is required to show the value of azacitidine for the treatment of those diseases in Canada and can be used to support reimbursement. The analysis took the perspective of the Canadian public health care system, using costs from 2012.
2. METHODS
2.1. Comparators
All three mainstays of the treatment available to higher-risk mds patients in Canada (bsc, low-dose chemotherapy, and standard-dose chemotherapy) were compared with azacitidine in aza-0016. In the trial design, treating physicians initially chose which of the three conventional care regimens would best suit the individual patient. The patients preselected for one of the three treatments were then randomized to receive either the preselected treatment or azacitidine. Primary study endpoints were presented for the overall population assigned to conventional care and individually for each of the preselected treatment arms. To accurately maintain the relative differences observed between patients preselected to comparators before randomization to azacitidine, the analysis stratified the patients treated with azacitidine according to their pre-randomization arm, so that like-for-like patient groups were compared. The overall results for azacitidine compared with conventional care were determined using the weighted average of the three individual comparative results.
2.2. Model Description
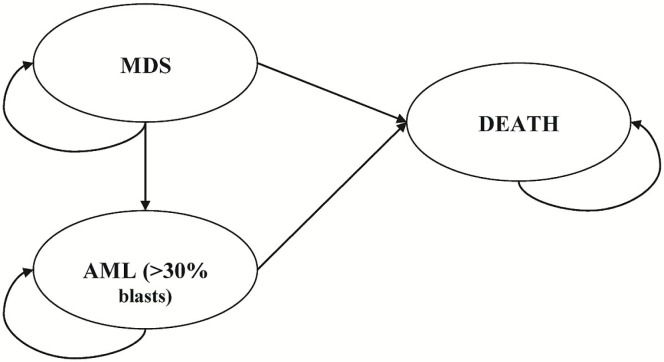
The lifetime Markov model used for our study (Figure 1) consisted of 3 health states: mds, transformation to aml>30, and death. The mds health state included on or off active treatment for higher-risk mds patients until they experienced disease progression to aml>30 or to death. The transformation to the aml health state comprised a follow-up period after patients progressed to the aml state, where they remained until transitioning to an absorbing death state. Hypothetical patients 70 years of age (69 years was the median age at enrolment into aza-001) entered the model in the mds state and could then remain in that state or progress to aml>30 or to death. The model was divided into 5-week (35-day) cycles, which mirrors the mean azacitidine treatment cycle duration in aza-0016. The model encompassed outcome measures for direct medical costs, health outcomes, and incremental cost-effectiveness from a Canadian public payer perspective. Costs (in 2012 Canadian dollars) and health outcomes were accumulated as appropriate throughout the model and discounted at 5% per annum.
FIGURE 1.
Schematic of the health economics model. mds = myelodysplastic syndrome; aml = acute myeloid leukemia.
Table i summarizes the key model parameters. The main assumptions for construction of the model are listed in the subsections that follow.
TABLE I.
Economic model inputs for efficacy and utilities
| Input parameter | Base value | Probability distribution [mean (sd)] | Source |
|---|---|---|---|
| Efficacy | Individual patient data from the aza-001 trial | ||
| Modeled median os (months)a | |||
| Preselected for bsc | |||
| Azacitidine | 25.52 | Normal | |
| bsc | 14.69 | Normal | |
| Preselected for ldc | |||
| Azacitidine | 25.48 | Normal | |
| ldc | 16.38 | Normal | |
| Preselected for sdc | |||
| Azacitidine | 21.98 | Normal | |
| sdc | 16.05 | Normal | |
| Transformation to aml (>30% blasts) | 37.7% | Fixed value | |
| Utilities | |||
| Azacitidine | Celgene utility study, calgb 9221 study Kornblith et al.7 | ||
| Day 0 | 0.67 | Beta: 0.67 (0.22) | |
| Day 50 | 0.70 | Beta; 0.70 (0.20) | |
| Day 106 | 0.74 | Beta; 0.74 (0.20) | |
| Day 182 | 0.80 | Beta; 0.80 (0.21) | |
| Day 183 onward | 0.80 | Assumption | Data after day 182 were not available, assumed to be the same as day 182 |
| Best supportive care | Celgene utility study, calgb 9221 study Kornblith et al.7 | ||
| Day 0 | 0.67 | Beta; 0.67 (0.22) | |
| Day 50 | 0.69 | Beta; 0.69 (0.20) | |
| Day 106 | 0.68 | Beta; 0.68 (0.22) | |
| Day 182 | 0.72 | Beta; 0.72 (0.22) | |
| Day 183 onward | 0.80 | Assumption | Data after day 182 were not available, assumed to be the same as day 182 |
| Low-dose chemotherapy | Celgene utility study; Sekeres et al.8 | ||
| Day 0 | 0.67 | Beta; 0.67 (0.08) | |
| Day 14 | 0.70 | Beta; 0.70 (0.09) | |
| Day 42 | 0.71 | Beta; 0.71(0.15) | |
| Day 70 | 0.72 | Beta; 0.72 (0.13) | |
| Day 98 | 0.70 | Beta; 0.70 (0.06) | |
| Day 182 | 0.85 | Beta; 0.85 (0.08) | |
| Day 365 | 0.67 | Beta; 0.67 (0.22) | |
| Day 366 onward | 0.67 | Assumption | Data after day 365 were not available, assumed to be the same as day 365 |
| Standard-dose chemotherapy | Celgene utility study, Sekeres et al.8 | ||
| Day 0 | 0.66 | Beta; 0.66 (0.13) | |
| Day 14 | 0.61 | Beta; 0.61 (0.10) | |
| Day 42 | 0.66 | Beta; 0.66 (0.10) | |
| Day 70 | 0.69 | Beta; 0.69 (0.12) | |
| Day 98 | 0.72 | Beta; 0.72 (0.16) | |
| Day 182 | 0.74 | Beta; 0.74 (0.18) | |
| Day 365 | 0.83 | Beta; 0.83 (0.10) | |
| Day 366 onward | 0.83 | Assumption | Data after day 365 were not available, assumed to be the same as day 365 |
| aml (>30% blasts) | 0.67 | Beta; 0.67 (0.22) | Assumption |
| Discount rate | |||
| For costs and outcomes | 5% | Fixed value |
Weibull extrapolation: converted from 5-week cycles.
sd = standard deviation; os = overall survival; bsc = best supportive care; ldc = low-dose chemotherapy; sdc = standard-dose chemotherapy; aml = acute myeloid leukemia; calgb = Cancer and Leukemia Group B.
2.3. Model Estimation
2.3.1. Efficacy
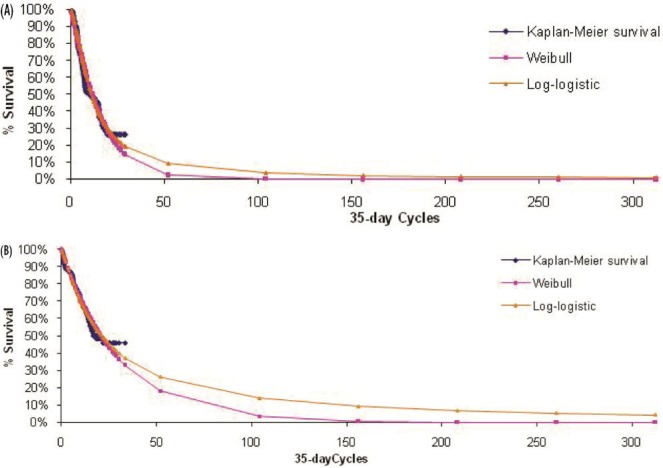
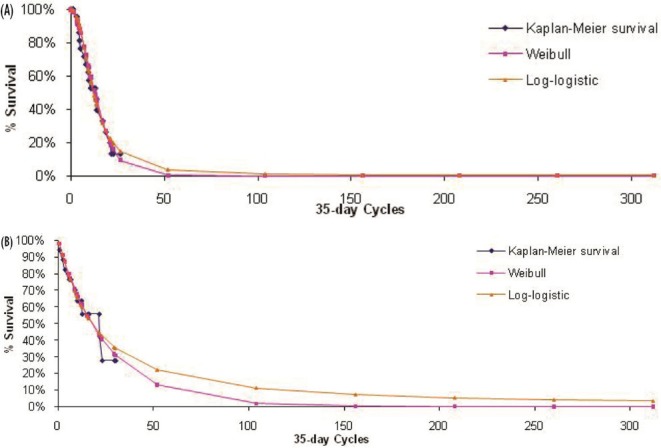
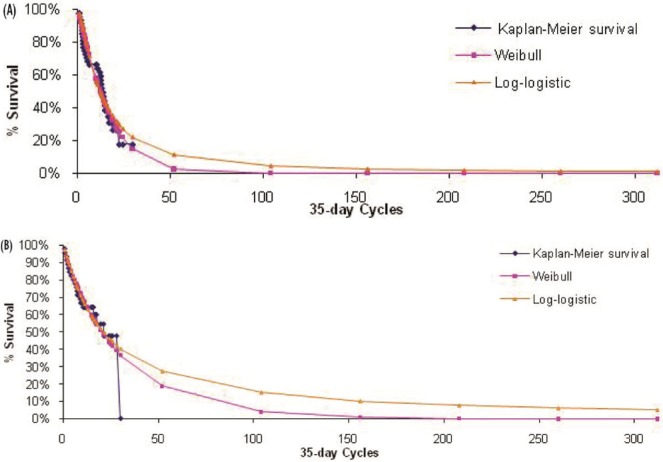
The primary outcome measure included in the model was overall survival, which was extrapolated beyond the 21-month time horizon (median follow-up) of aza-001 to lifetime for each comparator. The maximum likelihood parameter estimation was applied to construct either a Weibull or a log-logistic fit to the data for the survival curves (Figures 2–4). Weibull curves resulted in a more conservative estimate of survival for azacitidine and were selected as the best curve fit for all treatment arms in the base case. A sensitivity analysis was conducted with log-logistic curves, which represented a more optimistic survival scenario for azacitidine. The model incorporated mds-specific mortality and background age-adjusted all-cause mortality (1-year rates based on Canadian life tables9) to allow the rate of mortality to increase with age.
FIGURE 2.
Observed overall survival and fitted survival curves for patients (A) receiving best supportive care and (B) preselected for best supportive care but receiving azacitidine.
FIGURE 4.
Observed overall survival and fitted survival curves for patients (A) receiving standard-dose chemotherapy and (B) preselected for standard-dose chemotherapy and receiving azacitidine.
FIGURE 3.
Observed overall survival and fitted survival curves for patients (A) receiving low-dose chemotherapy and (B) preselected for low-dose chemotherapy and receiving azacitidine.
The aza-001 investigators reported that, across all treatment arms, 135 of 358 patients (37.7%) progressed to aml>30; the others were either censored or died in mds (Celgene Ltd. Data on file, 2007). This censoring lowered the confidence in the estimated time to aml transformation from the trial. The assumptions that follow were validated by the clinical experts:
Typically, patients spend a short period of time after aml transformation before dying.
There is no expectation concerning differences in the length of time from aml transformation to death or for health-related quality of life while in aml for azacitidine and any of the comparators.
Best supportive care is the typical treatment for patients after aml transformation.
We therefore assumed that 37.7% of patients were in the aml state for 1 cycle before dying, with the remainder dying in the mds state from mds or from other causes.
2.3.2. Blood Transfusions
The average number of platelet and red blood cell transfusions during three time periods (0–6 months, 7–12 months, and >13 months), determined from aza-001 on an intention-to-treat basis (Table ii), were incorporated for each comparator. The increased transfusion-independence benefits from therapies were assumed to carry over when patients halted treatment before progression to aml>30, so that the mean number of blood product units observed from the period beyond 12 months was applied to each treatment arm for all time points from 1 year to progression to aml>30 or to death. Upon progression to aml>30, the mean blood product transfusion units for the bsc arm during the mds health state was applied until death.
TABLE II.
Resource use and costs of blood product administration
| Blood product | Unit cost (2012 CA$) | Source |
Mean units of blood product per cycle8 by myelodysplastic syndrome treatment arm
|
|||
|---|---|---|---|---|---|---|
| aza | bsc | ldc | sdc | |||
| Packed red cells (mean for all times) | 338.77 | Amin et al.10 | 1.42 | 2.56 | 2.65 | 3.99 |
| 0–6 Months | 2.04 | 2.59 | 2.84 | 3.99 | ||
| 7–12 Months | 0.95 | 2.32 | 1.49 | na | ||
| ≥ 13 Months | 0.58 | 2.13 | 0.97 | na | ||
| Platelets (mean for all times) | 570.98 | mohltc11 | 1.12 | 0.63 | 1.87 | 4.63 |
| 0–6 Months | 1.83 | 0.81 | 2.09 | 4.63 | ||
| 7–12 Months | 0.46 | 0.30 | 1.30 | na | ||
| ≥ 13 Months | 0.13 | 0.29 | 0.45 | na | ||
|
| ||||||
| Mean cost of blood products per cycle (2012 CA$) | 1,120.56 | 1,226.97 | 1,965.48 | 3,995.34 | ||
aza = azacitidine; bsc = best supportive care; ldc = low-dose chemotherapy; sdc = standard-dose chemotherapy; na = not available; mohltc = (Ontario) Ministry of Health and Long-Term Care.
2.3.3. Treatment-Related Adverse Events
The economic model considered the grades 3 and 4 adverse events observed in aza-001 that incurred non-negligible treatment costs. Anemia and thrombocytopenia were excluded, because those events were assumed to already be included in the modelling of trial-observed blood and platelet transfusions.
The frequencies of adverse events recorded in the trial were subject to decay: higher during initial treatment and dissipating over time. In the base case, the time-dependent rates from patient-level trial data were applied while patients were on active treatment (azacitidine or low-dose chemotherapy). The same approach was not applicable for standard-dose chemotherapy, which was administered only in the first 3 cycles. Once patients were off treatment or had progressed to aml>30, the annualized rates for bsc were applied. It was assumed that adverse event rates could not drop below the annualized rates for bsc, which was designed to reflect the experience of patients in clinical practice. Two alternative scenarios were examined in the sensitivity analysis.
For each treatment-related adverse event incorporated into the model, information on the probability of receiving outpatient treatment or hospitalization because of the adverse event was collected from clinical experts. Pharmacologic interventions for adverse events were derived from the published general treatment guidelines from the Canadian Pharmacists Association12 and validated with clinical experts. Management costs were reported per event. Health effects were not applied to individual adverse events, because such effects were assumed to be captured by the quality-of-life measurements for each mds health state and so could lead to double-counting of utility decrements.
2.3.4. Resource Use and Costs
Table iii summarizes treatment costs per 35-day cycle. Health care resource use was derived from a Canadian clinical expert panel (n = 4) using a structured questionnaire. Health resources covered in the questionnaire included medications and administration, routine physician follow-up, and laboratory and monitoring tests. Only direct medical costs were considered; nonmedical direct costs and lost productivity were excluded. Patients were assumed to receive treatment for mds until the end of the treatment period, after which they were assumed to receive bsc until death. Unit costs from the Ministry of Health and Long-Term Care in Ontario (in 2012 Canadian dollars) were used to represent Canadian costs.
TABLE III.
Summary of per-cycle health care resource use on active treatment and after the active treatment phase
| Health care resource use |
Cost per cycle (2012 CA$)
|
|||
|---|---|---|---|---|
| aza | bsc | ldc | sdc | |
| Myelodysplastic syndrome on active treatment | ||||
| Premedication | 66.50 | na | 11.20 | 0.00a |
| Active treatment and administration | 6,177.75 | 153.44 | 494.34 | 20,847.40a |
| Immunosuppressive medications | 597.05 | 348.64 | 561.16 | 0.00a |
| Treatment monitoring | 162.66 | 58.16 | 162.66 | 0.00a |
| Physician follow-up | 129.38 | 129.38 | 129.38 | 788.50 |
| Blood product transfusion and administration | 1,120.56 | 1,226.97 | 1,965.48 | 0.00a |
| Treatment-related adverse eventsb | 247.39 | 333.45 | 287.99 | 0.00a |
| TOTAL COST | 8,253.89 | 1,916.60 | 3,324.22 | 21,635.90 |
| Myelodysplastic syndrome after active treatment (all patients assumed to be treated with bsc)c | ||||
| Immunosuppressive medication | 348.64 | 348.64 | 348.64 | 348.64 |
| bsc treatment administration | 153.44 | 153.44 | 153.44 | 153.44 |
| Routine tests (off active treatment) | 58.16 | 58.16 | 58.16 | 58.16 |
| Physician follow-up | 129.38 | 129.38 | 129.38 | 129.38 |
| Blood product transfusion and administration | 1,120.56 | 1,226.97 | 1,965.48 | 3,995.34 |
| Treatment-related adverse eventsb | 333.45 | 333.45 | 333.45 | 333.45 |
| TOTAL COST | 1,810.18 | 1,916.60 | 2,655.10 | 4,684.97 |
| Acute myeloid leukemia (≥30% blasts)d | ||||
| Immunosuppressive medication | 198.68 | 198.68 | 198.68 | 198.68 |
| bsc treatment administration | 153.44 | 153.44 | 153.44 | 153.44 |
| Routine tests (off active treatment) | 162.85 | 162.85 | 162.85 | 162.85 |
| Physician follow-up | 129.38 | 129.38 | 129.38 | 129.38 |
| Blood product transfusion and administration | 1,226.97 | 1,226.97 | 1,226.97 | 1,226.97 |
| Treatment-related adverse eventsb | 333.45 | 333.45 | 333.45 | 333.45 |
| TOTAL COST | 2,204.78 | 2,204.78 | 2,204.78 | 2,204.78 |
Assumed to be covered in hospitalization costs for inpatient stay associated with administration of standard-dose chemotherapy.
Estimates of adverse event costs were based on the annualized adverse event rates for each treatment arm from the clinical trial. The time-dependent rates used in the base case cannot be displayed here.
After treatment discontinuation, patients were assumed to be treated with best supportive care (bsc). The treatment pattern of bsc (except for blood products) was assumed for all treatment arms when patients were off treatment but still in myelodysplastic syndrome.
Treatment pattern of best supportive care (except for concurrent medication and routine tests) was assumed when patients progressed to acute myeloid leukemia.
aza = azacitidine; bsc = best supportive care; ldc = low-dose chemotherapy; sdc = standard-dose chemotherapy; na = not available.
Azacitidine is expected to be administered by an outpatient oncology clinic nurse from a cancer treatment centre or a hospital outpatient infusion clinic. For 1 treatment cycle of azacitidine, the total cost per patient was estimated to be $5,891 based on the unit price of $628 per vial provided by the manufacturer, the average administered dose of 1.34 vials observed from aza-001 (Celgene Ltd. Data on file, 2007), and 7 doses per treatment cycle per the licensed indication13. Wastage was considered in the sensitivity analysis. For other comparators, it was assumed that bsc was received entirely outside of hospital in outpatient medical or transfusion clinics, that low-dose chemotherapy was administered 50% by an outpatient clinic nurse and 50% by a homecare nurse, and that standard-dose chemotherapy was given in hospital only.
2.3.5. Health-Related Quality of Life
Utility values at various time points were required for mds managed using different treatments (azacitidine, bsc, low-dose chemotherapy, or standard-dose chemotherapy) and for aml>30. Those values were obtained from two independent studies. For mds patients treated with azacitidine or bsc, we used individual patient-level data from the Cancer and Leukemia Group B (calgb) 9221 trial, in which scores on the European Organization for Research and Treatment of Cancer (eortc) qlq-C30 were recorded at four assessment points on days 0, 50, 106, and 182. Only mds patients treated with either azacitidine or bsc were selected, and the associated eortc qlq-C30 scores were collected7 and converted to EQ-5D scores using a mapping algorithm described in McKenzie and van der Pol14. The utility analysis results show that, compared with patients receiving bsc, patients treated with azacitidine had a better quality of life, and the difference increased with increasing length of treatment. The utility scores seen at day 182 were assumed to remain constant for the remainder of the patient’s time in the mds health state.
The calgb 9221 dataset did not include information on patients treated with chemotherapy, and so for the low-dose chemotherapy and standard-dose chemotherapy comparators, patient-level Short Form 12 data from Sekeres et al.8 for aml and mds patients treated with low- or standard-dose chemotherapy were converted to SF-6D utility scores using an algorithm by Brazier and Roberts15 that weights the domain scores. The utility scores were available for days 0, 14, 42, 70, 98, 182, and 365, and it was assumed that the utility scores at day 365 remained constant for the rest of the mds health state.
Because no utility values had been reported for patients with aml>30, it was assumed (and verified with clinical experts) that the utility value of this health state would be the same as that of baseline mds treated with azacitidine or bsc.
2.4. Analysis
Uncertainty in model parameters was characterized through probability distributions16. Monte Carlo simulation with 1000 iterations was used to include parameter uncertainty in the results16. The uncertainties were expressed graphically through cost-effectiveness acceptability curves that showed the probability that azacitidine is cost-effective (y axis) compared with the alternatives for a range of cost-effectiveness thresholds (x axis)17. That analysis involved translating all outcomes into monetary values. The net benefit statistic for each of the 1000 simulations was calculated based on the willingness to pay of various decision-makers. A positive net benefit indicates that the strategy is cost-effective for a given willingness to pay18.
To examine the effects of parameter uncertainty in the model, we performed a number of scenario analyses examining the effect of various assumptions in the model and one-way sensitivity analyses varying each parameter, with results presented in tornado diagrams.
3. RESULTS
3.1. Base-Case Analysis
Table iv presents the probabilistic base-case results. The incremental cost-effectiveness ratios (icers) per qaly gained was $86,973, $84,829, and $2,152 for azacitidine compared with bsc, with low-dose chemotherapy plus bsc, and with standard-dose chemotherapy plus bsc respectively. The incremental costs per life-year gained were approximately 10%–20% more economically attractive (except for azacitidine compared with standard-dose chemotherapy).
TABLE IV.
Summary of base-case probabilistic results
| Treatment option | Mean cycles in mds on treatment (n) | Total costs (2012 CA$) |
Total
|
Incremental
|
Cost per ly gained by azacitidine [CA$/ly (95% ci)] | Incremental cost per qaly gained by azacitidine [CA$/qaly (95% ci)] | |||
|---|---|---|---|---|---|---|---|---|---|
| lys | qalys | Costs incurred by azacitidine (2012 CA$) | lys gained by azacitidine | qalys gained by azacitidine | |||||
| ccrs combineda | |||||||||
| Azacitidine | na | 112,354 | 2.51 | 1.96 | |||||
| ccrs | na | 35,908 | 1.50 | 1.06 | 76,446 | 1.01 | 0.90 | 75,871 (71,416 to 80,767) | 86,182 (69,920 to 107,157) |
| Specific ccrs | |||||||||
| Preselected for bsc | |||||||||
| Azacitidine | 10.59 | 111,414 | 2.50 | 1.95 | 77,897 | 1.02 | 0.91 | 76,567 (71,675 to 81,550) | 86,973 (70,076 to 110,051) |
| bsc | 15.58 | 33,517 | 1.48 | 1.05 | |||||
| Preselected for ldc | |||||||||
| Azacitidine | 10.95 | 114,368 | 2.53 | 1.98 | 73,336 | 0.99 | 0.88 | 74,514 (67,083 to 82,932) | 84,829 (66,863 to 108,691) |
| ldc | 6.08 | 41,032 | 1.55 | 1.10 | |||||
| Preselected for sdc | |||||||||
| Azacitidine | 10.91 | 110,337 | 2.23 | 1.74 | 1,850 | 0.87 | 0.71 | 2,636 (Dominant, 25,819) | 2,152 (Dominant, 19,869) |
| sdc | 2.22 | 108,486 | 1.36 | 1.03 | |||||
The weights of 68% for bsc and 32% for low-dose chemotherapy from the aza-001 trial were applied to calculate the results of comparing the combined conventional care regimens to azacitidine. Standard-dose chemotherapy was excluded from the combination as the base-case results showed it was a cost-ineffective comparator relative to low-dose chemotherapy.
mds = myelodysplastic syndrome; ly = life year; qaly = quality-adjusted life year; ci = confidence interval; ccrs = conventional care regimens; bsc = best supportive care; ldc = low-dose chemotherapy; sdc = standard-dose chemotherapy.
In the aza-001 trial6, determination of which of the three conventional treatments would be useful to a particular patient was based on the best clinical judgement of the investigators, which means that the three conventional care regimens were not necessarily mutually exclusive. Because standard-dose chemotherapy is economically dominated in the base-case results by low-dose chemotherapy (that is, it has higher costs, but worse outcomes), standard-dose chemotherapy was considered to be a cost-ineffective comparator. For further comparisons, standard-dose chemotherapy was therefore excluded from combined conventional care. When the results of bsc and low-dose chemotherapy were combined, applying the weights of 68% and 32% from the aza-001 trial6, azacitidine provided a mean incremental overall survival of 1.01 years and a qaly of 0.90 years. The icer for azacitidine compared with conventional care was $86,182 per qaly gained (95% confidence limits: $69,920, $107,157).
The incremental costs of azacitidine compared with bsc and low-dose chemotherapy were driven mostly by the acquisition cost of azacitidine; the incremental cost of azacitidine compared with standard-dose chemotherapy was smaller because of the high inpatient cost associated with the administration of chemotherapy. The higher costs with azacitidine, relative to the conventional care regimens, were offset by the lower use of blood products among patients receiving azacitidine (observed in the aza-001 trial).
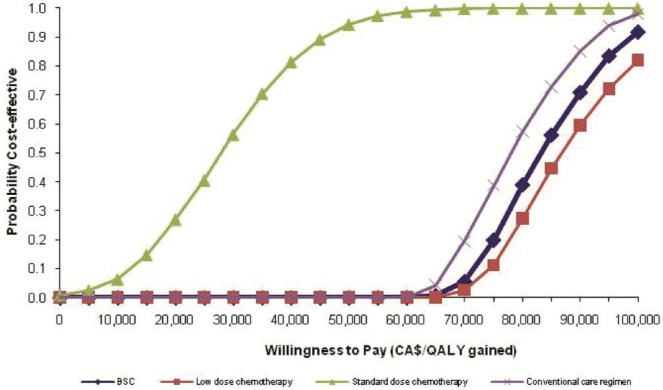
Figure 5 shows cost-effectiveness acceptability curves constructed from the probabilistic analysis based on 1000 Monte Carlo simulations. At a willingness-to-pay threshold of $80,000, the likelihood that azacitidine is cost-effective relative to the conventional care regimens—bsc combined with low-dose chemotherapy, bsc, low-dose chemotherapy, and standard-dose chemotherapy—was 33.1%, 30.6%, 38.2%, and 100.0% respectively. Those probabilities increased to 88.7%, 86.4%, 88.60%, and 100.0% if the willingness-to-pay threshold rose to $100,000.
FIGURE 5.
Cost-effectiveness acceptability curves showing the probability that azacitidine is cost-effective relative to each of the comparators (pairwise comparison). qaly = quality-adjusted life years; bsc = best supportive care.
3.2. Sensitivity Analyses
Table v reports findings from the sensitivity analyses. Ranges for the sensitivity analyses include the 95% confidence limits for the clinical and utility value parameters. Heterogeneity in resource use was represented by estimating a random number between the smallest and largest numbers obtained in the clinical survey (rather than using a value from a single clinician). Unit costs were assumed to be scalar values with no variability considered.
TABLE V.
Results of sensitivity analyses for key model assumption and parameter estimates
| Scenario | Change in assumption or parameter estimate | icer for azacitidine versus ccrsa (mean: $/qaly) |
|---|---|---|
| Base-case result | 86,182 | |
| A | Log-logistic curve fit for extrapolation of overall survival | 82,647 |
| B | Application of adverse event rates: annualized treatment-specific rates for patients on active treatment and annualized bsc rate for patients off active treatment | 87,011 |
| C | Application of adverse event rates: annualized treatment-specific rates for patients throughout the mds | 90,116b |
| D | Utility value for aml with >30% blasts (range: 0.1–1.0)c | |
| 0.1 | 86,314 | |
| 0.5 | 86,613 | |
| 1.0 | 86,126 | |
| E | Fixing utility scores for azacitidine and bsc at different longitudinal time points (from day 0, day 50, and day 106) | |
| From day 0 | 119,077 | |
| From day 50 | 108,769 | |
| From day 106 | 96,495 | |
| F | Adjusted azacitidine and bsc utility values | 88,439 |
| G | Wastage of azacitidine is consideredd | 103,258 |
All sensitivity analysis results showed that standard-dose chemotherapy was a cost-ineffective comparator relative to low-dose chemotherapy (ldc), and it was therefore excluded from the combined conventional care regimens. The weights of 68% for best supportive care and 32% for ldc from the aza-001 trial were applied to calculate the results of comparing the combined conventional care regimens to azacitidine.
In this scenario, standard-dose chemotherapy was dominated when compared with azacitidine.
Results for only some of the utility values tested are reported.
The average of 1.67 vials per injection was applied by assuming that half the wastage [(2 – 1.34) / 2] was lost, and the other half was made up through system efficiencies and new stability data19.
icer = incremental cost-effectiveness ratio; ccrs = conventional care regimens; qaly = quality-adjusted life year; bsc = best supportive care; mds = myelodysplastic syndrome; aml = acute myeloid leukemia.
In all the scenarios analyzed, the icer of azacitidine compared with conventional care (bsc combined with low-dose chemotherapy) was between $82,000 and $120,000 per qaly gained. When log-logistic distributions were used to extrapolate long-term survival, a 4% lower icer was generated. The icer increased by 1% and 5% when the two alternative scenarios incorporating adverse event rates were considered. Varying the utility score for the aml health state from 0.1 to 1.0 had a minimal effect on the icer because patients in the model spent a small amount of time in the aml health state before death. In the base case, the utility scores for azacitidine and bsc were determined using longitudinal data from an independent study, with the last recorded utility value acting as the constant mds utility beyond the end of the utility data. However, values recorded at later time points were based on small numbers of patients. The sensitivity analysis that fixed the utility scores at earlier time points to remove the potential effect of small patient numbers demonstrated that earlier fixing of the utility scores (that is, use of lower utilities), increased the icers by 12%–38%.
The utility values for patients in the azacitidine and bsc arms were mapped from eortc qlq-C30 scores obtained from calgb 9221. The patients in calgb 9221 were slightly younger and healthier at baseline than those in aza-001. The former group also included mds patients with lower-risk ipss scores. A regression analysis was performed to adjust the mapped utility values to account for differences in those baseline characteristics. The icers generated with adjusted utility values were 3% higher than those in the base-case results. In examining the impact of azacitidine wastage, the average vials per injection were increased from 1.34 to 1.67 by assuming that half the wastage (that is, the difference between 2 and 1.34 vials) was lost. The icer then increased to $103,258 per qaly gained.
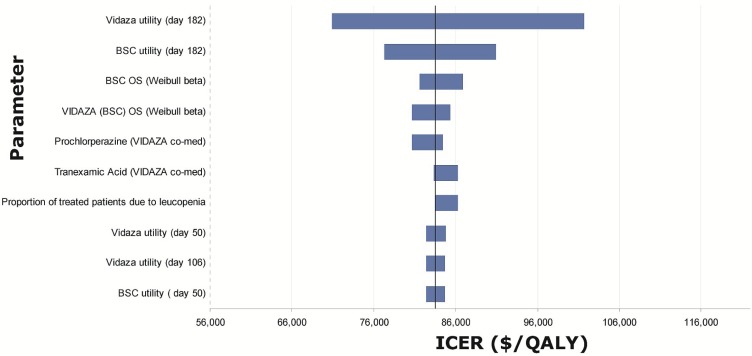
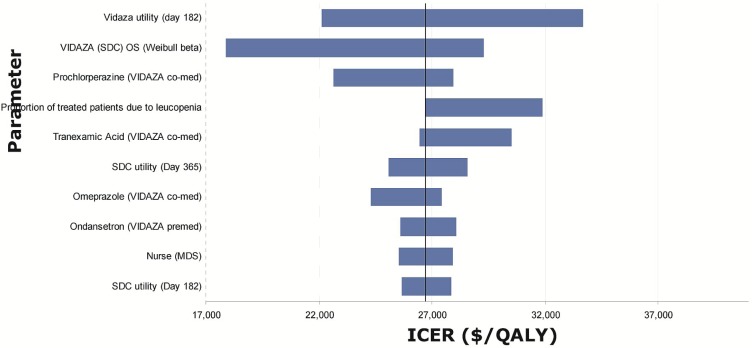
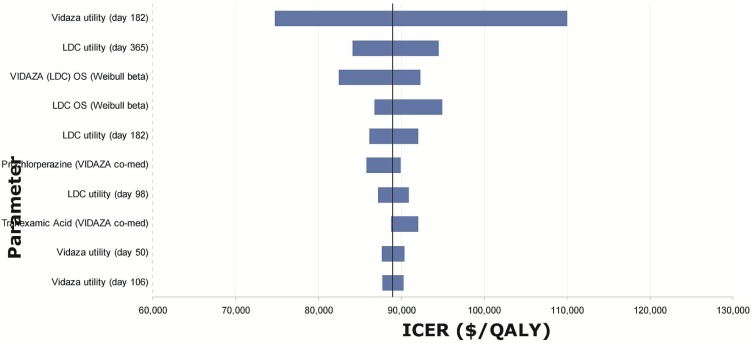
Tornado diagrams were created based on one-way sensitivity analyses performed by applying the upper and lower boundary given by the distribution around each of the parameters in the model (Figures 6–8). The most influential parameters were
estimates of utility values, especially those at the last time point available from the datasets (day 182 for azacitidine and bsc, day 365 for low- and standard-dose chemotherapy), which were then applied for the rest of the mds health state.
the Weibull shape and scale parameters used to estimate overall survival.
the inpatient cost for patients receiving standard-dose chemotherapy.
FIGURE 6.
Tornado diagram for model parameters with the largest impact on the incremental cost-effectiveness ratios (icers) for azacitidine (Vidaza: Celgene Corporation, Summit, NJ, U.S.A.) versus best supportive care (bsc). os = overall survival; qaly = quality-adjusted life year.
FIGURE 8.
Tornado diagram for model parameters with the largest impact on the incremental cost-effectiveness ratios (icers) for azacitidine (Vidaza: Celgene Corporation, Summit, NJ, U.S.A.) versus standard-dose chemotherapy (sdc). os = overall survival; qaly = quality-adjusted life years.
FIGURE 7.
Tornado diagram for model parameters with the largest impact on the incremental cost-effectiveness ratios (icers) for azacitidine (Vidaza: Celgene Corporation, Summit, NJ, U.S.A.) versus low-dose chemotherapy (ldc). os = overall survival; qaly = quality-adjusted life years.
4. DISCUSSION
The present analysis is the first economic evaluation of treatments for higher-risk mds in Canada. We sought to determine the economic value of azacitidine in the treatment of higher-risk mds. When compared separately with bsc, low-dose chemotherapy, and standard-dose chemotherapy, the mean icers for azacitidine were, respectively, $86,973, $84,829, and $2,152 per qaly gained. The results of our analysis demonstrate that the economic value for treatment of higher-risk mds patients with azacitidine is within the range of currently reimbursed oncology medicines in Canada.
The study by Gidwani et al.20 evaluated the cost-effectiveness of azacitidine compared with decitabine in mds over a 2-year time horizon from a U.S. payer perspective. The study concluded that azacitidine dominated decitabine by providing greater clinical benefit at a lower cost, and the results were robust in most of the sensitivity analyses conducted. Another U.S. study by Pan et al.21 compared decitabine with bsc and found that decitabine was cost-effective compared with bsc, with an icer of $5,277 per qaly gained.
A key strength of the present analysis is the use of the aza-001 trial data. Because that trial had no cross-over, the statistically significant overall survival advantage (9.4 months6) for azacitidine compared with the alternatives is a clinically significant increase. The comparators used in the clinical trial closely reflect the standard-of-treatment options available to higher-risk mds patients in Canada, thus providing robust clinical evidence of efficacy for “real-world” treatment options.
Several limitations warrant comment.
First, using patient-level data from aza-001, extrapolation of the long-term survival of study patients beyond the 21-month median duration of the trial was required and was done using survival modelling techniques. Although the most conservative assumption would be to have any incremental benefit of azacitidine drop immediately to zero at 21 months, the separation between the azacitidine and conventional arms remained constant out to 35 months (albeit with small numbers of subjects). The approach adopted here is the same as that adopted in the published U.S. economic analysis in mds21. In the extrapolation of survival curves, Weibull and log-logistic distributions were both considered, but a Weibull fit was determined to be a more appropriate choice for the analysis. The Weibull fit produced parameters—notably those for survival—that had greater validity and parameter estimates that more closely matched the trial-reported data. Moreover, the Weibull distribution was more conservative, in that the projected gains in survival were less favourable for azacitidine. Until longer-term follow-up data are available, modelling will be the only means available to estimate long-term efficacy22.
Second, the utility data available for mds and aml were limited. Because data from aza-001 were not available, utility values for the treatment arms were determined using alternative means. Several limitations accompany the incorporation of data from other sources. The associated scenario analyses indicated that, except for the assumption about the longitudinal time points at which to fix the utility scores for azacitidine and bsc, other assumptions had a negligible effect in the interpretations. Given the available data, an explicit and defensible approach was taken. A recent Canadian utility study that prospectively assessed quality of life in mds patients registered at a tertiary-care hospital mds program reported EQ-5D scores of 0.85 for transfusion-independent patients and 0.73 for transfusion-dependent patients23. However, the health states in the current model were not characterized by transfusion dependence. A further analysis with the new utility data could be performed by revising the model structure, which might merit a better interpretation of the effects of transfusion dependence on quality of life associated with various drug therapies.
Third, because of significant censoring of the aza-001 data, there were difficulties in measuring the timing of disease progression to aml>30. Based on clinical input, the aml>30 health state was simplified to 1 cycle with bsc-type treatment before death. Because treatment for aml>30 was the same as that for mds (that is, bsc) and because the utility value for aml>30 was assumed to be similar to that for bsc, the timing to aml transformation from mds had a minimal effect on the results.
Fourth, resource utilization information was collected using a survey of clinicians because no such data were available from the clinical trial.
Fifth, wastage of a portion of each vial of azacitidine because of standard dosing could happen in practice. A recent Canadian study by Walker et al.19 concluded that azacitidine is not as sensitive to storage container (glass vial or polypropylene syringe) as to temperature, and that reconstitution with cold sterile water reduced degradation. Moreover, at high confidence (97.5%), more than 90% of the initial azacitidine concentration was found to be retained when the product was stored below −20°C for 4 days or less, which could considerably reduce wastage and the associated cost19.
5. CONCLUSIONS
Patients with higher-risk mds who are ineligible for stem-cell transplantation face a short life expectancy and substantial negative effects on quality of life because of high disease-related morbidities. Azacitidine, which has been shown to be the first and only treatment for higher-risk mds has a proven survival advantage of 9.4 months compared with current conventional care and represents an important step forward in the treatment of higher-risk mds. The economic value of azacitidine is within the willingness-to-pay thresholds of third-party public payers for oncology treatments in Canada.
6. ACKNOWLEDGMENTS
We acknowledge valuable input from Dr. Michelle Geddes (hematologist, Clinical Assistant Professor, departments of Medicine and Oncology, University of Calgary), Dr. Thomas J. Nevill (hematologist, Associate Member, Terry Fox Laboratory, BC Cancer Agency), and Dr. Harold J. Olney (hematologist, Clinical Assistant Professor, Department of Medicine, University of Montreal).
7. CONFLICT OF INTEREST DISCLOSURES
Funding for this study was provided by Celgene Inc.
8. REFERENCES
- 1.Buckstein R, Wells R. Myelodysplastic Syndromes (MDS) Toronto, ON: Sunnybrook Health Sciences Centre; 2008. [Available online at: http://sunnybrook.ca/uploads/Myelodysplastic_Syndromes.pdf; cited December 3, 2013] [Google Scholar]
- 2.Germing U, Strupp C, Kundgen A, et al. No increase in age-specific incidence of myelodysplastic syndromes. Haematologica. 2004;89:905–10. [PubMed] [Google Scholar]
- 3.Greenberg P, Cox C, LeBeau MM, et al. International scoring system for evaluating prognosis in myelodysplastic syndromes. Blood. 1997;89:2079–88. [PubMed] [Google Scholar]
- 4.Komrokji RS, Bennett JM. The clinical implications of the World Health Organization’s classification of myelodysplastic syndromes. Curr Hematol Rep. 2005;4:175–81. [PubMed] [Google Scholar]
- 5.Brunning R, Bennett J, Flandrin G. Myelodysplastic syndromes. In: Jaffe ES, Harris NL, Stein H, Vardiman JW, editors. Pathology and Genetics of Tumours of Haematopoietic and Lymphoid Tissues. Lyon, France: IARC Press; 2001. Series: World Health Organization Classification of Tumours. Ver. 3. [Google Scholar]
- 6.Fenaux P, Mufti GJ, Hellstrom–Lindberg E, et al. Efficacy of azacitidine compared with that of conventional care regimens in the treatment of higher-risk myelodysplastic syndromes: a randomised, open-label, phase iii study. Lancet Oncol. 2009;10:223–32. doi: 10.1016/S1470-2045(09)70003-8. [DOI] [PMC free article] [PubMed] [Google Scholar]
- 7.Kornblith AB, Herndon JE, 2nd, Silverman LR, et al. Impact of azacytidine on the quality of life of patients with myelodysplastic syndrome treated in a randomized phase iii trial: a Cancer and Leukemia Group B study. J Clin Oncol. 2002;20:2441–52. doi: 10.1200/JCO.2002.04.044. [DOI] [PubMed] [Google Scholar]
- 8.Sekeres MA, Stone RM, Zahrieh D, et al. Decision-making and quality of life in older adults with acute myeloid leukemia or advanced myelodysplastic syndrome. Leukemia. 2004;18:809–16. doi: 10.1038/sj.leu.2403289. [DOI] [PubMed] [Google Scholar]
- 9.Statistics Canada . Life Tables, Canada, Provinces and Territories (2000–2002) Ottawa, ON: Statistics Canada; 2000. [Available at: http://publications.gc.ca/Collection/Statcan/84-537-X/84-537-XIE.html; cited December 5, 2013] [Google Scholar]
- 10.Amin M, Fergusson D, Wilson K, et al. The societal unit cost of allogenic red blood cells and red blood cell transfusion in Canada. Transfusion. 2004;44:1479–86. doi: 10.1111/j.1537-2995.2004.04065.x. [DOI] [PubMed] [Google Scholar]
- 11.Ontario Ministry of Health and Long-Term Care (mohltc) Ontario Case Costing Initiative [Cost Analysis (CAT) Tool, Web resource] Toronto, ON: MOHLTC; 2008. [Available at: http://www.occp.com/mainPage.htm; cited December 5, 2013] [Google Scholar]
- 12.Grey J, editor. Therapeutic Choices. 3rd ed. Ottawa, ON: Canadian Pharmacists Association; 2000. [Google Scholar]
- 13.Celgene Inc . Vidaza: Azacitidine for Injection, 100 mg Azacitidine per Vial. Mississauga, ON: Celgene Inc; 2012. [product monograph] [Google Scholar]
- 14.McKenzie L, van der Pol M. Mapping the eortc qlq C-30 onto the EQ-5D instrument: the potential to estimate qalys without generic preference data. Value Health. 2009;12:167–71. doi: 10.1111/j.1524-4733.2008.00405.x. [DOI] [PubMed] [Google Scholar]
- 15.Brazier JE, Roberts J. The estimation of a preference-based measure of health from the SF-12. Med Care. 2004;42:851–9. doi: 10.1097/01.mlr.0000135827.18610.0d. [DOI] [PubMed] [Google Scholar]
- 16.Briggs A, Claxton K, Sculpher M, editors. Decision Modelling for Health Economic Evaluation. New York, NY: Oxford University Press; 2006. [Google Scholar]
- 17.Stinnett AA, Mullahy J. Net health benefits: a new framework for the analysis of uncertainty in cost-effectiveness analysis. Med Decis Making. 1998;18(suppl):S68–80. doi: 10.1177/0272989X9801800209. [DOI] [PubMed] [Google Scholar]
- 18.Fenwick E, Byford S. A guide to cost-effectiveness acceptability curves. Br J Psychiatry. 2005;187:106–8. doi: 10.1192/bjp.187.2.106. [DOI] [PubMed] [Google Scholar]
- 19.Walker SE, Charbonneau LF, Law S, Earle C. Stability of azacitidine in sterile water for injection. Can J Hosp Pharm. 2012;65:352–9. doi: 10.4212/cjhp.v65i5.1172. [DOI] [PMC free article] [PubMed] [Google Scholar]
- 20.Gidwani R, Khan ZM, Fenaux P, Beach CL, Pashos CL. A cost-effectiveness analysis of using azacitidine vs. decitabine in treating patients with myelodysplastic syndromes. J Med Econ. 2012;15:145–54. doi: 10.3111/13696998.2011.631067. [DOI] [PubMed] [Google Scholar]
- 21.Pan F, Peng S, Fleurence R, Linnehan JE, Knopf K, Kim E. Economic analysis of decitabine versus best supportive care in the treatment of intermediate- and high-risk myelodysplastic syndromes from a US payer perspective. Clin Ther. 2010;32:2444–56. doi: 10.1016/j.clinthera.2010.12.003. [DOI] [PubMed] [Google Scholar]
- 22.O’Brien B. Economic evaluation of pharmaceuticals. Frankenstein’s monster or vampire of trials? Med Care. 1996;34(suppl):DS99–108. [PubMed] [Google Scholar]
- 23.Buckstein R, Alibhai S, Lam A, et al. Transfusion dependence and low hemoglobin have the greatest impact on quality of life (qol) in mds patients—a tertiary care cross sectional and longitudinal study [abstract 2500] Blood. 2009;114 [Google Scholar]


