

Abstract
Pressure-volume loops describe dynamic ventricular performance, relevant to patients with and at risk of pulmonary hypertension. We used conductance catheter-derived pressure-volume loops to measure right ventricular (RV) mechanics in patients with chronic thromboembolic pulmonary arterial obstruction at different stages of pathological adaptation. Resting conductance catheterization was performed in 24 patients: 10 with chronic thromboembolic pulmonary hypertension (CTEPH), 7 with chronic thromboembolic disease without pulmonary hypertension (CTED), and 7 controls. To assess the validity of conductance measurements, RV volumes were compared in a subset of 8 patients with contemporaneous cardiac magnetic resonance (CMR). Control, CTED, and CTEPH groups showed different pressure-volume loop morphology, most notable during systolic ejection. Prolonged diastolic relaxation was seen in patients with CTED and CTEPH [tau = 56.2 ± 6.7 (controls) vs. 69.7 ± 10.0 (CTED) vs. 67.9 ± 6.2 ms (CTEPH), P = 0.02]. Control and CTED groups had lower afterload (Ea) and contractility (Ees) compared with the CTEPH group (Ea = 0.30 ± 0.10 vs. 0.52 ± 0.24 vs. 1.92 ± 0.70 mmHg/ml, respectively, P < 0.001) (Ees = 0.44 ± 0.20 vs. 0.59 ± 0.15 vs. 1.13 ± 0.43 mmHg/ml, P < 0.01) with more efficient ventriculoarterial coupling (Ees/Ea = 1.46 ± 0.30 vs. 1.27 ± 0.36 vs. 0.60 ± 0.18, respectively, P < 0.001). Stroke volume assessed by CMR and conductance showed closest agreement (mean bias +9 ml, 95% CI −1 to +19 ml) compared with end-diastolic volume (+48 ml, −16 to 111 ml) and end-systolic volume (+37 ml, −21 to 94 ml). RV conductance catheterization detects novel alteration in pressure-volume loop morphology and delayed RV relaxation in CTED, which distinguish this group from controls. The observed agreement in stroke volume assessed by CMR and conductance suggests RV mechanics are usefully measured by conductance catheter in chronic thromboembolic obstruction.
Keywords: pulmonary hypertension, diastolic dysfunction, right ventricle, chronic thromboembolism
right ventricular (RV) function remains the single most important determinant of patient outcomes in pulmonary hypertension (PH) with description of changes in RV volume related to time and pressure arguably the most fundamental method of assessment (9). The conductance catheter offers simultaneous acquisition of pressure and volume on a beat to beat basis (1, 2, 20, 30) and integrates load-independent indexes of forward flow with measurement of afterload, a technique widely employed in RV animal models (6, 13, 23, 24, 28, 31, 36). Ventricular end-systolic (Ees) and effective arterial (Ea) elastance may be derived from RV pressure-volume loops, and a small number of clinical studies have suggested predominant homeometric (systolic) RV adaptation in response to high afterload (14, 22, 32, 35). In PH, reduced ventriculoarterial coupling efficiency (Ees/Ea) has also been estimated noninvasively using cardiac magnetic resonance (CMR) (26). The assessment of adaptive ventricular responses relies on accurate determination of cardiac volume, and the use of a conductance catheter in the RV, which has a crescentic internal geometry, challenges assumptions fundamental to volume measurement using conductance theory (11). However, relative change (stroke volume) can be accurately determined along with parameters of RV systolic and diastolic performance (10, 15).
Chronic thromboembolic pulmonary hypertension (CTEPH) is characterized by elevated mean pulmonary artery pressure (mPAP) due to endothelialized thrombotic obstructions of the pulmonary vascular bed that persist despite anticoagulation. However, a proportion of patients presenting with chronic thromboembolic obstructions suffer symptomatic limitation despite a mPAP below the diagnostic cut-off for PH at rest (mPAP < 25 mmHg). These patients are labeled as having chronic thromboembolic disease (CTED) and frequently present with preserved resting RV contractility and near-normal cardiac chamber morphology. Routine right heart catheterization conducted at rest yields limited insight into symptom origins in this disease which may originate in part from early RV dysfunction and impaired RV adaptation on exercise (8, 17). We hypothesized that conductance catheter-derived pressure-volume loops could expose different resting RV mechanics in patients with CTED, specifically arising from subclinical RV dysfunction due to “latent” elevation in RV afterload, not incorporated within routine hemodynamics discerned from fluid-filled catheters (29). To reassess the accuracy of RV volumes measured by the conductance catheter, we compared conductance catheter-derived volumes in a subset of patients with contemporaneous CMR, widely considered to be the current gold-standard method for determination of RV volume.
MATERIALS AND METHODS
Study population.
Twenty-four patients referred to our Pulmonary Vascular Disease Unit were recruited over 15 mo for the conductance catheter study. In total, 17 patients with exertional breathlessness and chronic thromboembolic obstruction of the pulmonary artery underwent conductance catheterization, 10 of whom fulfilled diagnostic criteria for CTEPH (27). The remaining 7 had a resting mPAP < 25 mmHg despite substantial thrombotic burden (Fig. 1). These patients were labeled as having chronic thromboembolic disease (CTED), all of whom had sufficient burden of thromboembolic obstruction to justify invasive hemodynamic assessment as judged by their responsible clinician. A further 7 patients who were undergoing closure of a patent foramen ovale (PFO) for prior occurrence of minor neurological deficit were used as controls. These patients had an otherwise structurally normal heart. Eight patients with either CTEPH or CTED were entered into a substudy comparing RV volumes measured by conductance catheter and CMR performed immediately prior. No control patients underwent CMR. In CTED and CTEPH groups, to exclude RV functional effects beyond those attributable to thromboembolic obstruction, patients clinically limited by other factors were excluded. This was determined on the basis of the following criteria: forced expiratory volume in 1 s (FEV1) < 70% predicted, FEV1/forced vital capacity (FVC) ratio < 70%, suspected intracardiac shunt, body mass index (BMI) > 30 kg/m2, history of angina, and evidence of LV systolic or diastolic dysfunction on screening echocardiogram.
Fig. 1.

Cardiac magnetic resonance (CMR) images in chronic thromboembolic disease without pulmonary hypertension (CTED) and chronic thromboembolic pulmonary hypertension (CTEPH). A: four-chamber still images from a gradient echo sequence in a patient with CTED (left) and CTEPH (right). The lefthand image displays a normal-sized right ventricle (RV) compared with the righthand image showing dilated right heart chambers, right ventricular hypertrophy, and septal straightening. B: maximum intensity projection images from a MR pulmonary angiogram from the same patients with CTED and CTEPH. Lefthand image shows proximal occlusion of left lower lobe and segmental middle lobe disease on the right. Righthand image shows proximal web in right upper lobe, complex web in right lower lobe, and complex web in proximal left lower lobe with attenuated anterior segment (block arrow).
Patients with suspected CTEPH and CTED were all in World Health Organization (WHO) Functional Class II/III. Patients undergoing closure of PFO were all assessed as WHO Class I. Prior to right heart catheterization, routine blood tests including serum NH2-terminal pro-brain natriuretic peptide (NT-proBNP) were drawn, and a 6-min walk distance (6MWD) was performed in all study participants. All were in sinus rhythm. The study was approved by the local research ethics committee (Cambridge South REC: 12/EE/0085), and the protocol complied with the guidelines of the amended Declaration of Helsinki. All participants gave fully informed written consent.
Cardiac catheterization.
Conductance catheterization of the RV was undertaken immediately following routine Swan-Ganz catheterization (7 Fr) via a femoral or jugular approach. Thermodilution was used to calculate cardiac output. All study participants were nonsedated, and no hemodynamically altering medications were given during any procedure. Prior to placement of the conductance catheter, blood resistivity was determined by rho cuvette. A 6-Fr eight-electrode conductance catheter (Millar Instruments; Houston, TX) was inserted through the vascular sheath, then advanced under fluoroscopic guidance across the tricuspid valve toward the RV apex. Catheters were placed along the longitudinal axis of the ventricle to optimize the pressure-volume signal. Correct placement was confirmed fluoroscopically and by monitoring segmental volume phase relationships and counterclockwise pressure-volume loop genesis. Catheter calibration was performed according to the technique described by Baan et al. (1). Parallel conductance volume (Vc) was measured using the hypertonic saline injection technique through a side-channel port. At least two measurements of Vc were made using 5 ml 10% hypertonic NaCl and the results averaged. The coefficient α was calculated as the ratio between conductance catheter-derived cardiac output and the reference cardiac output calculated by thermodilution from Swan-Ganz. Pressure-volume recordings were acquired at end-expiration during breath hold, and only steady-state measurements were analyzed. The proximal end of the conductance catheter was connected to an MPVS Ultra signal-conditioning unit (Millar Instruments), and Labchart 7 Pro was used to calibrate the conductance signal through a Powerlab 16/30 A-D converter (AD Instruments). Control subjects were given a general anesthetic following the conductance catheter study to complete routine closure of the PFO according to local protocols.
Conductance catheter measurements.
Principles of the conductance technique are described in detail elsewhere (37). Conductance catheter data were analyzed off line by two reviewers blinded to the diagnostic group and results averaged. Conductance signals were calculated from single-field excitation. Systolic function was assessed by RV stroke work index (RVSWI), maximum rate of isovolumic pressure increase (dP/dtmax), and Ees. Diastolic function was assessed by maximum rate of isovolumic pressure decline (dP/dtmin) and tau (τ), the time constant of isovolumic relaxation. Tau (τ) represents the time constant of isovolumic pressure decay and is measured during active myocardial relaxation and is calculated as a parameter in an exponential fit to the pressure channel data (Weiss' method), using the following equation: P(t)= A·exp(−t/τ), where t is time and A is the fitted parameter. Compliance was calculated using the pulse pressure method: conductance-derived stroke volume/pulmonary artery pulse pressure. Single beat estimation of Ees was carried out in all study participants using a Matlab sinusoidal curve fit algorithm written to estimate theoretical maximum isovolumic pressure from dP/dtmax and dP/dtmin during ventricular ejection (Fig. 2) (6). Ees was taken as the gradient from theoretical maximal isovolumic pressure (Pmax) to the end-systolic point. Ea was taken as the gradient from the end-systolic to end-diastolic points of the pressure-volume loop. In all cases end-systole was defined as maximum pressure/volume toward end-ventricular ejection. Pulmonary valve opening was taken at the onset of ventricular ejection following isovolumic contraction.
Fig. 2.
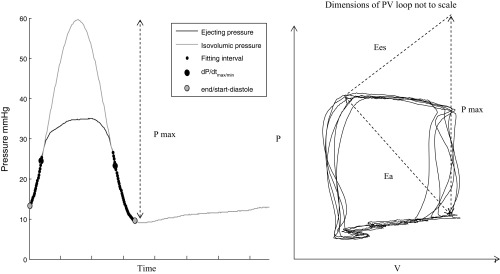
Single beat estimation of ventricular end-systolic elastance (Ees) using isovolumic maximum pressure. Ees is a gradient extrapolated from theoretical maximum pressure to end-systole. Pmax is derived from the amplitude of the sinusoid (left). Effective pulmonary arterial elastance (Ea) is the gradient between end systole and end diastole.
CMR protocol.
All patients approached for CMR and conductance studies completed both procedures, and no patients were withdrawn. Patients were brought directly from the CMR suite to the catheter laboratory to optimize matching of heart rate and preload status. CMR imaging was performed on a 1.5-T system (MAGNETOM Avanto, Siemens Healthcare, Erlangen, Germany). Images were acquired using a phased-array torso coil with retrospective cardiac gating achieved with a vector-ECG system. After initial localizer sequences, standard steady-state free-precession (SSFP) technique was used to obtain a contiguous stack of 14–18 transverse slices (dependent on the size of the heart) covering the RV from the base to apex during breath-holds at end-expiration. We used the following scan parameters: slice thickness 8 mm with 2-mm slice gap, scan matrix = 200 × 240, flip angle α = 68°, repetition time (TR) 42.6 ms with 15 segments giving effective TR of 2.84 ms and echo time (TE) of 1.2 ms (iPAT factor 2). The CMRs were stored on a Cambridge Computed Imaging (CCI, Cambridge, UK) picture archive and communication system (PACS) for subsequent recall and analysis. Measurement of ventricular volumes was performed using a certified software package (Q mass MR 7.5, Medis Medical Imaging system, The Netherlands). Endocardial contours were drawn manually for the RV at end-systole and end-diastole in each data set as defined by the smallest and largest endocardial areas. The method of disk summation was then employed to provide volumetric data for the RV in the axial and short-axis plane. The moderator band and large trabeculae were included in the myocardial volume area with time-varying volumes computed at end-systole and end-diastole.
Statistical analysis.
Stata software (version 12; Stata, College Station, TX) was used for statistical analysis. Conductance data were calculated as the mean values of at least five cardiac cycles. Continuous data are presented as means ± SD. Comparison between conductance and CMR volumes was assessed by Bland-Altman plots. Prior to group comparison, distribution normality of hemodynamic and conductance parameters was satisfied by the Kolmogorov-Smirnov test. Conductance data were analyzed by patient group using repeated-measures analysis of variance (ANOVA). When the F ratio of the ANOVA reached a critical P value < 0.05, modified t-tests (Schéffè) were used to compare between groups. To estimate required group sizes, a minimum clinically important intergroup difference in tau of 10 ms (SD 8 ms) was used which, at outset, required 11 subjects in each group (α = 0.05, β = 0.20) (19).
RESULTS
Intergroup demographics and hemodynamics.
Patient demographics and clinical characteristics were well matched between groups and are shown in Table 1. Exercise capacity assessed by 6MWD was reduced in CTEPH and CTED groups but not in controls. 6MWD showed no relation to mPAP (r = −0.03, P = 0.97) although mPAP and serum NT-proBNP were strongly related (r = 0.72, P < 0.001). Oxygen saturations across right heart chambers and atrial pressures at right heart catheterization confirmed no interatrial shunting was present in patients with PFOs prior to the conductance study and closure of the PFO. Statistically significant differences were observed between the CTEPH group and the CTED and control groups for mPAP, RV end-diastolic pressure (RVEDP), and pulmonary vascular resistance (PVR) (Table 1). However, CTED and control groups were indistinguishable by routine right heart catheterization data.
Table 1.
Demographic and hemodynamic data from right heart catheterization prior to conductance study
| Controls (n =7) | CTED (n =7) | CTEPH (n =10) | |
|---|---|---|---|
| Age, yr | 48 ± 10 | 51 ± 16 | 50 ± 12 |
| Sex | 3F:4M | 4F:3M | 4F:6M |
| BMI, kg/m2 | 24.3 ± 1.3 | 26.2 ± 1.9 | 26.9 ± 2.9 |
| WHO Class I/II/III | 7/0/0 | 0/7/0 | 0/7/3 |
| 6MWD, m | 556 ± 98 | 411 ± 62* | 393 ± 121* |
| Hb, g/dl | 14.0 ± 0.9 | 14.0 ± 1.4 | 14.8 ± 0.6 |
| Cr Cl, ml/min | 91 ± 13 | 102 ± 37 | 99 ± 18 |
| NT proBNP, pg/ml | 21 ± 17 | 57 ± 23 | 679 ± 1105 |
| Concomitant disease | |||
| Systemic hypertension | 1 (17%) | 1 (13%) | 2 (20%) |
| Diabetes | |||
| Ex-smoker | 2 (33%) | 1 (13%) | 2 (20%) |
| RHC hemodynamics | |||
| RA mean | 5 ± 2 | 5 ± 2 | 7 ± 2 |
| RV EDP | 5 ± 2 | 5 ± 3 | 8 ± 2*† |
| mPAP | 15 ± 3 | 17 ± 5 | 43 ± 10*† |
| PCWP/LAP | 7 ± 2 | 7 ± 3 | 8 ± 3 |
| SvO2, % | 76 ± 3 | 75 ± 4 | 72 ± 6 |
| CI, l·min−1·m−2 | 3.2 ± 0.5 | 2.9 ± 0.3 | 2.5 ± 0.3* |
| SV (td), ml | 87 ± 6 | 80 ± 6 | 74 ± 5 |
| PVR, dyn·s−1·cm−5 | 110 ± 43 | 124 ± 39 | 547 ± 242*† |
Values are means ± SD. All pressures are in mmHg. CTED, chronic thromboembolic disease without pulmonary hypertension; CTEPH, chronic thromboembolic pulmonary hypertension. BMI, body mass index; WHO, World Health Organization; 6MWD, 6-min walk distance; Cr Cl, creatinine clearance; NT-pro-BNP, NH2-terminal pro-brain natriuretic peptide; mPAP, mean pulmonary artery pressure; PVR, pulmonary vascular resistance; CI, cardiac index; SV, stroke volume; EDP, end-diastolic pressure; RV, right ventricle; RA, right atrium; SvO2, mixed venous oxygen saturation; PCWP, pulmonary capillary wedge pressure; LAP, left atrial pressure; td, thermodilution; RHC, right heart catheter.
P < 0.05 compared with controls.
P < 0.05 compared with CTED.
Conductance catheter study of CTED, CTEPH, and control patients.
Typical morphologies of RV pressure-volume loops by group are shown in Fig. 3. Control patients displayed triangular loops with poor distinction of the end-systolic point compared with patients with CTED and CTEPH (Fig. 3). During systolic ejection from pulmonary valve (PV) opening to end-systole, the pressure differential (δP) during systolic ejection from pulmonary valve (PV) opening to end systole (ES) discriminated controls and CTED groups [mean δP = −6.3 ± 3.0 (controls), 3.2 ± 3.5 (CTED), and 20.4 ± 18.4 (CTEPH) mmHg, respectively; controls vs. CTED, P = 0.03]. δP significantly correlated with mPAP (r = 0.61, P < 0.01), PVR (r = 0.63, P < 0.01), serum NT-proBNP (r = 0.70, P < 0.001), and pulmonary artery compliance (r = −0.55, P = 0.01).
Fig. 3.

Typical pressure-volume loops generated by conductance catheter in the RV during end-expiratory breathhold. Control patients (left) demonstrate triangular RV loop morphology compared with CTED (middle) and CTEPH (right) groups. Pressure differential (δP) during systolic ejection from pulmonary valve (PV) opening to end systole (ES) discriminates disease groups. PV, pulmonary valve; ES, end-systole. Absolute volumes in CTEPH patient (right hand image) unrepresentative, therefore not shown (see discussion).
Numerical conductance data are displayed in Table 2. RV diastolic parameters showed that tau was significantly prolonged in patients with CTED and CTEPH compared with controls (P = 0.02). Absolute dP/dtmin was highest in patients with CTEPH. dP/dtmin showed strong correlation with serum NT-proBNP (r = −0.61, P < 0.01). In the CTEPH group, systolic contractility was higher as defined by RVSWI, dP/dtmax, and Ees. Higher Ees was linearly related to elevated Ea (R2 = 0.73, P < 0.001) and inversely correlated to pulmonary artery (PA) compliance (r = −0.58, P = 0.01) and 6MWD (r = −0.47, P = 0.03). VA coupling index (Ees/Ea) was lowest in patients with CTEPH and showed a strong inverse relationship to mPAP and PVR (r = 0.75, P < 0.001). Ees/Ea also showed modest but significant correlation with serum NT-proBNP (r = −0.54, P = 0.01). The coefficient of variation for estimated Pmax in each patient that was used to determine Ees lay within a 10% limit.
Table 2.
Conductance catheter data by patient group
| Conductance Parameter | Controls (n = 7) | CTED (n = 7) | CTEPH (n = 10) |
|---|---|---|---|
| Hemodynamic indexes | |||
| RV pressure (sys), mmHg | 31.0 ± 5.6 | 35.4 ± 3.4 | 77.2 ± 11.8*† |
| RV pressure (edp), mmHg | 4.8 ± 1.4 | 5.0 ± 1.3 | 7.6 ± 1.6*† |
| Pmax (estimated using sb model) | 43.1 ± 10.4 | 52.9 ± 6.7 | 98.6 ± 19.6*† |
| Heart rate, beats/min | 71.4 ± 11.7 | 72.2 ± 8.6 | 72.0 ± 11.0 |
| Volumes | |||
| End-systolic volume, ml | (80 ± 41) | (55 ± 43) | (60 ± 30) |
| End-diastolic volume, ml | (165 ± 39) | (127 ± 55) | (143 ± 38) |
| Stroke volume, ml | 83 ± 20 | 74 ± 21 | 69 ± 17 |
| Systolic indexes | |||
| RVSWI, mmHg·ml·m−2 | 603 ± 179 | 653 ± 209 | 1114 ± 402*† |
| dP/dtmax, mmHg/s | 394 ± 52 | 423 ± 124 | 638 ± 235*† |
| Ees, mmHg/ml | 0.44 ± 0.20 | 0.59 ± 0.15 | 1.13 ± 0.43*† |
| Diastolic indexes | |||
| dP/dtmin, mmHg/s | −265 ± 40 | −435 ± 79 | −733 ± 143*† |
| Tau, ms | 56.2 ± 6.7 | 69.7 ± 10.0* | 67.9 ± 6.2 |
| Pulmonary arterial afterload | |||
| Ea, mmHg/ml | 0.30 ± 0.10 | 0.52 ± 0.24 | 1.92 ± 0.70*† |
| PA compliance, ml/mmHg | 5.7 ± 1.5 | 4.7 ± 1.6 | 1.76 ± 1.05*† |
| Ventriculoarterial coupling | |||
| Ees/Ea | 1.46 ± 0.30 | 1.27 ± 0.36 | 0.60 ± 0.18*† |
Values are means ± SD. Pmax, estimated maximum isovolumic pressure; RVSWI, RV stroke work index; Ees, ventricular end-systolic elastance; Ea, effective pulmonary arterial elastance; dP/dtmax, maximum rate of isovolumic pressure increase; dP/dtmin, maximum rate of isovolumic pressure decline; tau, the time constant of isovolumic relaxation; sys, systolic; edp, end-diastolic pressure; sb, single beat.
P < 0.05 compared with controls;
P < 0.05 compared with CTED. Values in parentheses subject to inaccuracy (see discussion).
Conductance and CMR subgroup analysis.
RV volumes for individual patients undergoing both CMR and conductance are shown in Table 3. CMR volumes from axial and short axis planes showed strong correlation for end-diastolic (r = 0.98), end-systolic (r = 0.97), and stroke volume (r = 0.96). Mean heart rates during CMR and conductance catheterization were not significantly different: 73.2 vs. 75.4 beats/min, respectively (P = 0.75). Stroke volume between CMR and conductance catheter showed a mean difference of +9 ml (95% CI −1 to 19 ml) (Fig. 4, top), indicating that conductance stroke volume was smaller than CMR stroke volume. Larger biases of +48 ml (95% CI −16 to 111 ml) for end-diastolic volume and +37 ml (95% CI −21 to 94 ml) for end-systolic volumes were observed (Fig. 4, middle and bottom). Markedly lower end-diastolic and end-systolic volumes were observed in CTED and CTEPH groups compared with controls. In one patient (ID 8), significant overestimation of Vc resulted in a negative absolute end-systolic volume although stroke volume was still determinable. Mean Vc and α across our eight patient subset was 86 ± 14 ml and 0.35 ± 0.08, respectively.
Table 3.
Patient diagnosis, hemodynamics, and RV volumes by CMR (axial plane) and conductance catheter
| Hemodynamics |
RV Volumes, ml |
|||||||||||||||
|---|---|---|---|---|---|---|---|---|---|---|---|---|---|---|---|---|
| ID | Sex | Age, yr | Diagnosis | RA mean | RV EDP | mPAP | PCWP | SvO2, % | CI, l·min−1·m−2 | PVR, dyn·s−1·cm−5 | EDV CMR | EDV C | ESV CMR | ESV C | SV CMR | SV C |
| 1 | M | 28 | CTEPH | 6 | 7 | 32 | 8 | 71.7 | 2.2 | 419 | 208 | 123 | 101 | 24 | 107 | 99 |
| 2 | F | 64 | CTEPH | 12 | 12 | 46 | 9 | 58.9 | 1.8 | 928 | 285 | 283 | 219 | 242 | 66 | 42 |
| 3 | M | 34 | CTEPH | 6 | 8 | 41 | 6 | 73.6 | 2.6 | 622 | 274 | 106 | 189 | 50 | 85 | 56 |
| 4 | F | 48 | CTEPH | 6 | 6 | 51 | 12 | 71.8 | 2.5 | 700 | 150 | 135 | 78 | 75 | 72 | 61 |
| 5 | F | 52 | CTEPH | 4 | 5 | 44 | 6 | 76.3 | 2.6 | 661 | 146 | 171 | 101 | 117 | 45 | 53 |
| 6 | M | 57 | CTED | 5 | 4 | 15 | 7 | 78.0 | 2.3 | 157 | 189 | 101 | 105 | 23 | 84 | 78 |
| 7 | F | 69 | CTED | 5 | 6 | 16 | 10 | 72.9 | 2.5 | 133 | 88 | 87 | 31 | 36 | 57 | 52 |
| 8 | M | 42 | CTEPH | 9 | 11 | 27 | 10 | 74.5 | 2.9 | 289 | 148 | 60 | 88 | 88 | ||
| Means ± SD | 186 ± 68 | 144 ± 67 | 111 ± 63 | 81 ± 78 | 76 ± 20 | 66 ± 20 | ||||||||||
All pressures are in mmHg. CMR, cardiac magnetic resonance; C, conductance catheter.
Fig. 4.

Bland-Altman plots of CMR RV volume measurements vs. conductance (C) measurements. Top, stroke volume; middle, end-diastolic volume; bottom, end-systolic volume. Dark solid line indicates bias; dashed lines indicate 95% confidence interval. Conductance underestimated EDV and ESV compared with CMR whereas stroke volume showed better agreement.
DISCUSSION
Our results yield novel insight into the RV's dynamic performance in response to chronic pulmonary thromboembolic obstruction. Changes in pressure-volume loop morphology in CTED, most notable during systolic ejection, result from elevated RV afterload that develops exclusive of hemodynamic definition of PH. In addition, the RV relaxes more slowly in patients with CTED and CTEPH as defined by tau. Discrimination in RV diastolic performance between CTED and controls potentially signifies diastolic maladaptation in the RV, which in tandem with decreased pulmonary artery compliance may contribute to symptom origins in this condition. Our data for the first time describe homeometric RV adaptation in response to high afterload in CTEPH. This reaffirms the association between elevated RV hemodynamics and reduced ventriculoarterial coupling efficiency found in previous clinical PH studies (22, 26, 32).
Intergroup conductance study.
Conductance catheterization showed “left ventricularization” in pressure-volume loop morphology in CTED and CTEPH compared with controls; patients with CTED continue to develop RV pressure during systolic ejection similar to CTEPH where increased resistance and lower arterial compliance is exposed to the RV early after pulmonary valve opening. By contrast, control subjects show rapid dissipation in pressure during systole with ejection into a more compliant pulmonary circulation. This may be explained by abnormal afterload elevation in CTEPH and to a lesser extent in CTED (3). Ea represents a conglomerate of afterload incorporating the combined effects of resistance, compliance, and backward wave reflection from branch points in the pulmonary circulation. Ea did not statistically differ between CTED and controls, which may in part be due to small numbers in each group and its wide standard deviation. However, the trend toward higher Ees in CTED suggests early systolic adaptation in response to higher afterload. We quantified RV performance during systolic ejection using δP, which is a function of Ea, and demonstrated a relationship to disease severity across all patients (NT-proBNP). δP significantly correlated with PVR and pulmonary artery compliance, which reinforces its association with RV afterload in our patient cohort.
In CTEPH, slower RV relaxation measured by tau can be attributed to chronic elevation in RV afterload and lower arterial compliance. The RV in CTEPH is stiff, which is in keeping with steepening of the end-diastolic pressure-volume relationship in experimental models of heart failure and following pulmonary artery banding (12, 23). Notably, tau was also prolonged in the CTED group. This is unlikely to be entirely explained by RV afterload given broadly similar Ea values in CTED and controls. RV diastolic function may be functionally subclassified by either a decrease in passive myocardial diastolic compliance or impairment in active RV relaxation. These phases are interrelated, and normal diastolic function is dependent on both (31). Given statistically similar values for Ea and pulmonary artery compliance between control and CTED groups, we speculate that our CTED group harbor intrinsic RV diastolic dysfunction in addition to “latent” elevation in afterload suggested by δP. This is further supported by borderline elevation in absolute dP/dtmin in CTED compared with controls, groups that were well matched by preload. The markedly elevated absolute dP/dtmin in CTEPH, suggesting more rapid dissipation in RV pressure at onset of diastole, is likely attributable to elevated preload (RVEDP) in this group, as dP/dtmin is known to be load dependent (23).
RV volume physiological analysis.
Our data suggest poor determination of absolute end-diastolic and end-systolic volume using a conductance catheter in the human RV, but more accurate determination of stroke volume was achieved. Previously, considerable attention has been placed on the accuracy of conductance-derived RV volumes due to increased myocardial trabeculation and its crescentic short-axis shape. Both of these factors can disrupt the uniformity of the conductance field. The observed underestimation of end-diastolic and end-systolic volumes may be attributable to Vc calculation, which appeared overestimated in our patient subset. This results in inappropriate leftward displacement of the pressure-volume loop along the volume axis, resulting in underestimation of absolute volumes. However, stroke volume remains relatively unaffected by Vc.
Higher absolute volumes in control subjects may have arisen from volume variation due to catheter position using either the jugular or femoral approach. Catheter insertion from an internal jugular approach results in closer catheter apposition to the RV free wall compared with a femoral approach where the catheter can lie more central to the RV long axis (Fig. 5). Out of clinical necessity, control patients were exclusively studied via a femoral approach compared with only one patient in CTED and CTEPH groups. Dual jugular and femoral approaches have not been previously reported in humans, and we speculate that a more centrally placed catheter may offer improved interrogation of the RV outflow tract, resulting in improved “capture” of the RV geometry (7, 21). Although not tested in our setting, it has also been suggested dual-field excitation catheters improve the electric field uniformity (11), but, to our knowledge, this has not been substantiated in the human RV.
Fig. 5.

Jugular insertion (left) results in closer apposition of the conductance catheter to the RV free wall compared with use of the femoral approach (right).
Mechanisms of impaired diastolic relaxation.
One possible origin of diastolic impairment in CTED and CTEPH may be RV ischemia. Akin to the ischemic cascade in the LV, RV diastolic impairment may be induced by right coronary artery occlusion and so may be driven by a myocardial oxygen supply-demand imbalance (4). In support of our findings, isolated RV diastolic dysfunction has been purported in a connective tissue disease population with normal resting hemodynamics through stress-induced effects on subendocardial fibers (16). Animal models of early RV dysfunction have also been associated with metabolic remodeling in the RV myocardium where myocardial genetic profiling points to abnormal energy substrate use that is partly independent of chronic pressure overload (18). Very recently, increased collagen and stiffening of RV cardiomyocyte sarcomeres have been implicated in diastolic dysfunction in the human RV in PH (25). Future investigations detailing RV functional assessment with tissue gene expression and metabolomics may perhaps offer clearer explanation of our findings.
Clinical implications.
Currently the natural history of CTED is poorly defined and it is unproven that patients with CTED deteriorate over time. However, a predisposition to RV diastolic dysfunction observed in our study offers novel insight into the clinical trajectory of patients with chronic thromboembolic obstruction who may be at risk of deterioration. A normal/near normal resting hemodynamic profile fails to account for symptom limitation in this condition suggesting hemodynamic abnormalities may only manifest on exercise. This has to date been investigated in a similar patient population who demonstrate reduced exercise pulmonary arterial compliance following pulmonary endarterectomy despite normalization of PVR (5). Pulmonary endarterectomy is an established treatment for CTEPH and almost universally leads to reverse remodeling of the RV. However, this is often incomplete suggesting additional mechanisms of RV dysfunction beyond an increase in afterload may be contributory. Our data suggest a predisposition to primary diastolic RV dysfunction in CTED, and we speculate that patients with CTED may derive uncertain benefit from pulmonary endarterectomy, which is currently offered for symptomatic benefit (34).
Limitations.
Our study population derives from a pool of highly selected individuals referred to a tertiary center for invasive hemodynamic investigation. Therefore, although the dataset is small and carries risk of Type II error, groups were necessarily selected to minimize confounding effects on RV mechanics from conditions such as COPD, LV dysfunction, and obesity. Caution should nevertheless be exercised in extrapolating our results to a “real-world” population with CTED in whom comorbidities may be prevalent. Second, RV volume determination using a conductance catheter is challenging with potential error arising from a nonuniform electric field due to fall off in equipotential planes at the extremes of the ventricular boundary. However, our study attempts to address the accuracy of conductance RV volumes in humans using temporal comparison with the most up to date gold-standard method, CMR. In doing so, we have shown acceptable agreement between conductance and CMR techniques for stroke volume determination, suggesting conclusions drawn from pressure-volume loop dimensions are robust.
Simultaneous right and left ventricular hemodynamic and volume indexes were not measured during conductance meaning we cannot comment on ventricular interdependence. However, no patients in our study had echocardiographic evidence of LV systolic or diastolic dysfunction and all had normal pulmonary capillary wedge pressures making a LV contribution to our diastolic findings unlikely. We employed a single beat methodology to derive an estimated Pmax, which relies on mathematical assumptions derived from a large mammal model. To date, this method remains unvalidated in the RV of patients with PH although with use of a Valsalva maneuver to alter cardiac load, Ees has recently been generated by a family of loops (32). Last, our protocol did not enable wave reflection measurement, which may have been contributory to our observations on RV afterload.
Conclusions.
Comprehensive RV assessment by conductance catheterization detects novel alteration of pressure-volume loop morphology and delayed RV relaxation in patients with CTED. However, when referenced to CMR, our method provides suboptimal determination of absolute RV volume. Abnormal resting RV mechanics demonstrated by conductance signify functional adaptation in the RV in thromboembolic obstruction, which warrants further evaluation in future studies to establish downstream clinical effects.
GRANTS
This research was supported by the National Institute for Health Research (NIHR) Cambridge Biomedical Research Centre and Papworth Hospital Research Fund.
DISCLOSURES
J. Pepke-Zaba has received reimbursements of travel expenses to congresses and speaker fees from Actelion, Pfizer, Glaxo, Bayer, LungRX, and United Therapeutics, has participated to advisory boards for Actelion, Bayer, Pfizer, GSK, and United Therapeutics, and has received funds for research from Actelion and Pfizer.
AUTHOR CONTRIBUTIONS
Author contributions: C.M., D.T., R.V.M.R., N.W.M., and J.P.-Z. conception and design of research; C.M., P.A.W., S.P.H., A.N.P., and D.G. analyzed data; C.M. and D.G. prepared figures; C.M., S.P.H., D.T., and R.V.M.R. drafted manuscript; C.M., S.P.H., R.G.A., A.N.P., D.G., D.T., R.V.M.R., N.W.M., L.M.S., and J.P.-Z. edited and revised manuscript; C.M., P.A.W., S.P.H., R.G.A., A.N.P., D.G., D.T., R.V.M.R., N.W.M., L.M.S., and J.P.-Z. approved final version of manuscript; P.A.W., S.P.H., R.G.A., and L.M.S. performed experiments; S.P.H., R.G.A., and J.P.-Z. interpreted results of experiments.
ACKNOWLEDGMENTS
We acknowledge the assistance of all the catheter laboratory staff at Papworth Hospital and thank our patients for participating in this study. We also thank Professor Anton Vonk Noordegraaf and his research group for their assistance with the design and implementation of the single beat methodology. No other persons have made substantial contribution to the manuscript.
REFERENCES
- 1.Baan J, Jong TT, Kerkhof PL, Moene RJ, van Dijk AD, van der Velde ET, Koops J. Continuous stroke volume and cardiac output from intra-ventricular dimensions obtained with impedance catheter. Cardiovasc Res 15: 328–334, 1981 [DOI] [PubMed] [Google Scholar]
- 2.Baan J, van der Velde ET, de Bruin HG, Smeenk GJ, Koops J, van Dijk AD, Temmerman D, Senden J, Buis B. Continuous measurement of left ventricular volume in animals and humans by conductance catheter. Circulation 70: 812–823, 1984 [DOI] [PubMed] [Google Scholar]
- 3.Bishop A, White P, Chaturvedi R, Brookes C, Redington A, Oldershaw P. Resting right ventricular function in patients with coronary artery disease: pressure volume analysis using conductance catheters. Int J Cardiol 58: 223–228, 1997 [DOI] [PubMed] [Google Scholar]
- 4.Bishop A, White P, Groves P, Chaturvedi R, Brookes C, Redington A, Oldershaw P. Right ventricular dysfunction during coronary artery occlusion: pressure-volume analysis using conductance catheters during coronary angioplasty. Heart 78: 480–487, 1997 [DOI] [PMC free article] [PubMed] [Google Scholar]
- 5.Bonderman D, Martischnig AM, Vonbank K, Nikfardjam M, Meyer B, Heinz G, Klepetko W, Naeije R, Lang IM. Right ventricular load at exercise is a cause of persistent exercise limitation in patients with normal resting pulmonary vascular resistance after pulmonary endarterectomy. Chest 139: 122–127, 2011 [DOI] [PubMed] [Google Scholar]
- 6.Brimioulle S, Wauthy P, Ewalenko P, Rondelet B, Vermeulen F, Kerbaul F, Naeije R. Single-beat estimation of right ventricular end-systolic pressure-volume relationship. Am J Physiol Heart Circ Physiol 284: H1625–H1630, 2003 [DOI] [PubMed] [Google Scholar]
- 7.Brookes CI, White PA, Bishop AJ, Oldershaw PJ, Redington AN, Moat NE. Validation of a new intraoperative technique to evaluate load-independent indices of right ventricular performance in patients undergoing cardiac operations. J Thorac Cardiovasc Surg 116: 468–476, 1998 [DOI] [PubMed] [Google Scholar]
- 8.Castelain V, Herve P, Lecarpentier Y, Duroux P, Simonneau G, Chemla D. Pulmonary artery pulse pressure and wave reflection in chronic pulmonary thromboembolism and primary pulmonary hypertension. J Am Coll Cardiol 37: 1085–1092, 2001 [DOI] [PubMed] [Google Scholar]
- 9.Champion HC, Michelakis ED, Hassoun PM. Comprehensive invasive and noninvasive approach to the right ventricle-pulmonary circulation unit: state of the art and clinical and research implications. Circulation 120: 992–1007, 2009 [DOI] [PubMed] [Google Scholar]
- 10.Chaturvedi RR, Kilner PJ, White PA, Bishop A, Szwarc R, Redington AN. Increased airway pressure and simulated branch pulmonary artery stenosis increase pulmonary regurgitation after repair of tetralogy of Fallot. Real-time analysis with a conductance catheter technique. Circulation 95: 643–649, 1997 [DOI] [PubMed] [Google Scholar]
- 11.Danton MH, Greil GF, Byrne JG, Hsin M, Cohn L, Maier SE. Right ventricular volume measurement by conductance catheter. Am J Physiol Heart Circ Physiol 285: H1774–H1785, 2003 [DOI] [PubMed] [Google Scholar]
- 12.de Man FS, Handoko ML, van Ballegoij JJ, Schalij I, Bogaards SJ, Postmus PE, van der Velden J, Westerhof N, Paulus WJ, Vonk-Noordegraaf A. Bisoprolol delays progression towards right heart failure in experimental pulmonary hypertension. Circ Heart Fail 5: 97–105, 2012 [DOI] [PubMed] [Google Scholar]
- 13.Dell'Italia LJ, Walsh RA. Application of a time varying elastance model to right ventricular performance in man. Cardiovasc Res 22: 864–874, 1988 [DOI] [PubMed] [Google Scholar]
- 14.Dell'Italia LJ, Walsh RA. Right ventricular diastolic pressure-volume relations and regional dimensions during acute alterations in loading conditions. Circulation 77: 1276–1282, 1988 [DOI] [PubMed] [Google Scholar]
- 15.Derrick GP, Narang I, White PA, Kelleher A, Bush A, Penny DJ, Redington AN. Failure of stroke volume augmentation during exercise and dobutamine stress is unrelated to load-independent indexes of right ventricular performance after the Mustard operation. Circulation 102: III154–III159, 2000 [DOI] [PubMed] [Google Scholar]
- 16.Faludi R, Komocsi A, Bozo J, Kumanovics G, Czirjak L, Papp L, Simor T. Isolated diastolic dysfunction of right ventricle: stress-induced pulmonary hypertension. Eur Respir J 31: 475–476, 2008 [DOI] [PubMed] [Google Scholar]
- 17.Gan CT, Holverda S, Marcus JT, Paulus WJ, Marques KM, Bronzwaer JG, Twisk JW, Boonstra A, Postmus PE, Vonk-Noordegraaf A. Right ventricular diastolic dysfunction and the acute effects of sildenafil in pulmonary hypertension patients. Chest 132: 11–17, 2007 [DOI] [PubMed] [Google Scholar]
- 18.Gomez-Arroyo J, Mizuno S, Szczepanek K, Van Tassell B, Natarajan R, dos Remedios CG, Drake JI, Farkas L, Kraskauskas D, Wijesinghe DS, Chalfant CE, Bigbee J, Abbate A, Lesnefsky EJ, Bogaard HJ, Voelkel NF. Metabolic gene remodeling and mitochondrial dysfunction in failing right ventricular hypertrophy secondary to pulmonary arterial hypertension. Circ Heart Fail 6: 136–144, 2013 [DOI] [PMC free article] [PubMed] [Google Scholar]
- 19.Hoole SP, Heck PM, White PA, Read PA, Khan SN, West NE, O'Sullivan M, Dutka DP. Stunning and cumulative left ventricular dysfunction occurs late after coronary balloon occlusion in humans insights from simultaneous coronary and left ventricular hemodynamic assessment. JACC Cardiovasc Interventions 3: 412–418, 2010 [DOI] [PubMed] [Google Scholar]
- 20.Kass DA, Yamazaki T, Burkhoff D, Maughan WL, Sagawa K. Determination of left ventricular end-systolic pressure-volume relationships by the conductance (volume) catheter technique. Circulation 73: 586–595, 1986 [DOI] [PubMed] [Google Scholar]
- 21.Kornet L, Schreuder JJ, van der Velde ET, Baan J, Jansen JR. A new approach to determine parallel conductance for left ventricular volume measurements. Cardiovasc Res 48: 455–463, 2000 [DOI] [PubMed] [Google Scholar]
- 22.Kuehne T, Yilmaz S, Steendijk P, Moore P, Groenink M, Saaed M, Weber O, Higgins CB, Ewert P, Fleck E, Nagel E, Schulze-Neick I, Lange P. Magnetic resonance imaging analysis of right ventricular pressure-volume loops: in vivo validation and clinical application in patients with pulmonary hypertension. Circulation 110: 2010–2016, 2004 [DOI] [PubMed] [Google Scholar]
- 23.Leeuwenburgh BP, Steendijk P, Helbing WA, Baan J. Indexes of diastolic RV function: load dependence and changes after chronic RV pressure overload in lambs. Am J Physiol Heart Circ Physiol 282: H1350–H1358, 2002 [DOI] [PubMed] [Google Scholar]
- 24.Pagnamenta A, Dewachter C, McEntee K, Fesler P, Brimioulle S, Naeije R. Early right ventriculo-arterial uncoupling in borderline pulmonary hypertension on experimental heart failure. J Appl Physiol 109: 1080–1085, 2010 [DOI] [PubMed] [Google Scholar]
- 25.Rain S, Handoko ML, Trip P, Gan TJ, Westerhof N, Stienen G, Paulus WJ, Ottenheijm C, Marcus JT, Dorfmuller P, Guignabert C, Humbert M, Macdonald P, Dos Remedios C, Postmus PE, Saripalli C, Hidalgo CG, Granzier HL, Vonk-Noordegraaf A, van der Velden J, de Man FS. Right ventricular diastolic impairment in patients with pulmonary arterial hypertension. Circulation 128: 2016–2025, 2013 [DOI] [PubMed] [Google Scholar]
- 26.Sanz J, Garcia-Alvarez A, Fernandez-Friera L, Nair A, Mirelis JG, Sawit ST, Pinney S, Fuster V. Right ventriculo-arterial coupling in pulmonary hypertension: a magnetic resonance study. Heart 98: 238–243, 2012 [DOI] [PubMed] [Google Scholar]
- 27.Simonneau G, Robbins IM, Beghetti M, Channick RN, Delcroix M, Denton CP, Elliott CG, Gaine SP, Gladwin MT, Jing ZC, Krowka MJ, Langleben D, Nakanishi N, Souza R. Updated clinical classification of pulmonary hypertension. J Am Coll Cardiol 54: S43–S54, 2009 [DOI] [PubMed] [Google Scholar]
- 28.Solda PL, Pantaleo P, Perlini S, Calciati A, Finardi G, Pinsky MR, Bernardi L. Continuous monitoring of right ventricular volume changes using a conductance catheter in the rabbit. J Appl Physiol 73: 1770–1775, 1992 [DOI] [PubMed] [Google Scholar]
- 29.Suga H. Cardiac mechanics and energetics—from Emax to PVA. Front Med Biol Eng 2: 3–22, 1990 [PubMed] [Google Scholar]
- 30.Suga H, Sagawa K, Shoukas AA. Load independence of the instantaneous pressure-volume ratio of the canine left ventricle and effects of epinephrine and heart rate on the ratio. Circ Res 32: 314–322, 1973 [DOI] [PubMed] [Google Scholar]
- 31.Tabima DM, Hacker TA, Chesler NC. Measuring right ventricular function in the normal and hypertensive mouse hearts using admittance-derived pressure-volume loops. Am J Physiol Heart Circ Physiol 299: H2069–H2075, 2010 [DOI] [PMC free article] [PubMed] [Google Scholar]
- 32.Tedford RJ, Mudd JO, Girgis RE, Mathai SC, Zaiman AL, Housten-Harris T, Boyce D, Kelemen BW, Bacher AC, Shah AA, Hummers LK, Wigley FM, Russell SD, Saggar R, Saggar R, Maughan WL, Hassoun PM, Kass DA. Right ventricular dysfunction in systemic sclerosis-associated pulmonary arterial hypertension. Circ Heart Fail 6: 953–963, 2013 [DOI] [PMC free article] [PubMed] [Google Scholar]
- 34.van der Plas MN, Reesink HJ, Roos CM, van Steenwijk RP, Kloek JJ, Bresser P. Pulmonary endarterectomy improves dyspnea by the relief of dead space ventilation. Annals Thoracic Surg 89: 347–352, 2010 [DOI] [PubMed] [Google Scholar]
- 35.Wauthy P, Naeije R, Brimioulle S. Left and right ventriculo-arterial coupling in a patient with congenitally corrected transposition. Cardiol Young 15: 647–649, 2005 [DOI] [PubMed] [Google Scholar]
- 36.Wauthy P, Pagnamenta A, Vassalli F, Naeije R, Brimioulle S. Right ventricular adaptation to pulmonary hypertension: an interspecies comparison. Am J Physiol Heart Circ Physiol 286: H1441–H1447, 2004 [DOI] [PubMed] [Google Scholar]
- 37.White Pa, Redington AN. Right ventricular volume measurement: can conductance do it better? Physiol Measurement 21: R23–R41, 2000 [DOI] [PubMed] [Google Scholar]