

Abstract
Release of acetylcholine (ACh) in neocortex is important for learning, memory and attention tasks. The primary source of ACh in neocortex is axons ascending from the basal forebrain. Release of ACh from these axons evokes changes in the cortical local field potential (LFP), including a decline in low-frequency spectral power that is often referred to as desynchronization of the LFP and is thought to result from the activation of muscarinic ACh receptors. Using channelrhodopsin-2, we selectively stimulated the axons of only cholinergic basal forebrain neurons in primary somatosensory cortex of the urethane-anesthetized mouse while monitoring the LFP. Cholinergic stimulation caused desynchronization and two brief increases in higher-frequency power at stimulus onset and offset. Desynchronization (1–6 Hz) was localized, extending ≤ 1 mm from the edge of stimulation, and consisted of both nicotinic and muscarinic receptor-mediated components that were inhibited by mecamylamine and atropine, respectively. Hence we have identified a nicotinic receptor-mediated component to desynchronization. The increase in higher-frequency power (>10 Hz) at stimulus onset was also mediated by activation of nicotinic and muscarinic receptors. However, the increase in higher-frequency power (10–20 Hz) at stimulus offset was evoked by activation of muscarinic receptors and inhibited by activation of nicotinic receptors. We conclude that the activation of nicotinic and muscarinic ACh receptors in neocortex exerts several effects that are reflected in distinct frequency bands of the cortical LFP in urethane-anesthetized mice.
Keywords: nucleus basalis, basal forebrain, desynchronization, delta band, alpha band
neocortex contains a high density of cholinergic axons (Eckenstein et al. 1988; Lysakowski et al. 1989; Umbriaco et al. 1994). Acetylcholine (ACh), released by these axons, shapes neocortical function during many processes, including arousal, attention, learning, memory, and sensory perception (Herrero et al. 2008; Kilgard 2003; Parikh and Sarter 2008; Ramanathan et al. 2009; Winkler et al. 1995). The effects of ACh are often evident in extracellular field potential measurements from neocortex, including the electroencephalogram, electrocorticogram and the local field potential (LFP), during sleep-wake transitions for example. During slow-wave sleep the field potential is dominated by activity toward the lower end of the frequency spectrum (<5 Hz) and upon a transition to rapid eye movement (REM) sleep or upon waking, low-frequency activity declines, and there is an increase in higher-frequency activity (Buzsaki et al. 1988b; Cape et al. 2000; Lee et al. 2004, 2005; Steriade 1993; Steriade et al. 1993a, 2001). These changes are visually apparent as the loss of the slow waves from the field potential upon cortical activation, a phenomenon known as desynchronization.
The extracellular ACh concentration in neocortex changes during these transitions, with increased release of ACh in neocortex being linked to desynchronization of the field potential (Celesia and Jasper 1966; Parikh et al. 2007; Pepeu and Giovannini 2004). Furthermore, pharmacological antagonism of ACh receptors suppresses desynchronization (Bakin and Weinberger 1996; Berg et al. 2005; Buzsaki et al. 1988b; Celesia and Jasper 1966; Kanai and Szerb 1965; Metherate et al. 1992; Steriade et al. 1993a; Stewart et al. 1984), indicating a causal link between cortical ACh release and changes in cortical activity.
Cholinergic drive to neocortex is provided almost exclusively by neurons in the basal forebrain complex, principally in nucleus basalis (Lehmann et al. 1980; Mesulam et al. 1983; Rye et al. 1984; Wainer and Mesulam 1990). The activity of cholinergic basal forebrain neurons increases during desynchronization of the cortical field potential. For example, during the sleep-wake cycle, cholinergic basal forebrain neurons are more active during REM sleep and during waking than during slow-wave sleep or deep anesthesia (Buzsaki et al. 1988b; Détári and Vanderwolf 1987; Duque et al. 2000; Lee et al. 2004, 2005; Manns et al. 2000). Furthermore, desynchronization is evoked upon stimulation of the basal forebrain (Bakin and Weinberger 1996; Berg et al. 2005; Casamenti et al. 1986; Goard and Dan 2009; Metherate et al. 1992) and by selective stimulation of basal forebrain cholinergic neurons (Cape et al. 2000), and basal forebrain lesions inhibit desynchronization (Buzsaki et al. 1988b; Riekkinen et al. 1993; Steriade et al. 1993a; Stewart et al. 1984; Wenk et al. 1994). These studies indicate that cholinergic neurons in the basal forebrain are responsible for the changes in cortical ACh concentration and ACh-evoked desynchronization.
Muscarinic ACh receptors (mAChRs) play a central role in desynchronization. mAChR antagonists, applied systemically or locally to neocortex, inhibit spontaneous desynchronization in quietly awake animals (Buzsaki et al. 1988b; Wikler 1952), and desynchronization evoked by stimulation of nucleus basalis (Bakin and Weinberger 1996; Berg et al. 2005; Metherate et al. 1992). However, it is unlikely that mAChRs are solely responsible for desynchronization. Several authors have reported incomplete inhibition of desynchronization by mAChR antagonists and suggested that other mechanisms may play a role (Berg et al. 2005; Metherate et al. 1992), and there are several additional mechanisms by which basal forebrain neurons might evoke desynchronization. Firstly, ACh is likely to activate nicotinic ACh receptors (nAChRs). ACh can excite cortical pyramidal neurons and interneurons via nAChRs (Alkondon et al. 2000; Chu et al. 2000; Guillem et al. 2011; Kassam et al. 2008; Poorthuis et al. 2013; Roerig et al. 1997; Zolles et al. 2009; Xiang et al. 1998), and nicotine can evoke desynchronization (Armitage et al. 1969; Knapp and Domino 1962; Riekkinen et al. 1993; Yamamoto and Domino 1965), but the effects of nAChR antagonists on desynchronization evoked by stimulation of nucleus basalis are unknown (although nAChR antagonists have been reported to exert no effect on desynchronization evoked by indirect activation of cholinergic basal forebrain neurons; Steriade et al. 1993a). Secondly, there are several potential sources of other transmitters that might be activated by electrical stimulation of nucleus basalis: 1) cholinergic neurons, which may co-release various transmitters, including glutamate (Bennett-Clarke et al. 1980; Ljungdahl et al. 1978; Manns et al. 2001); 2) noncholinergic neurons, primarily GABAergic and perhaps glutamatergic neurons, that project from basal forebrain to neocortex (Fisher et al. 1988; Henny and Jones 2008; Manns et al. 2003); 3) indirect pathways, such as via thalamus (basal forebrain-thalamus-cortex or basal forebrain-reticular formation-thalamus-cortex; Conrad and Pfaff 1976; Steriade et al. 1993a); 4) neurons outside the basal forebrain whose axons traverse the basal forebrain (e.g., hypothalamic neurons; Cullinan and Záborszky 1991); and 5) neurons in regions surrounding the basal forebrain, which may be activated by a stimulating electrode positioned in nucleus basalis. In short, it is unclear which mechanisms, in addition to mAChRs, play a role in desynchronization, or in the changes in higher-frequency components of the cortical field potential.
Here we investigate the relative contributions of nAChR and mAChR activation to changes in the neocortical LFP, using optogenetics to stimulate cholinergic neurons selectively. We find that both mAChRs and nAChRs contribute to desynchronization and also to changes in higher-frequency components of the LFP at stimulus onset and offset. Furthermore, we investigate the spatial spread of the effects of ACh on the LFP, finding that desynchronization is localized to the stimulated region of cortex.
METHODS
Stereotaxic injection of virus.
All experimental procedures were conducted in accordance with a protocol approved by the Northwestern University Institutional Animal Care and Use Committee.
Channelrhodopsin-2 (ChR2) was expressed selectively in cholinergic nucleus basalis neurons using the Cre-lox system, as described previously (Fig. 1A; Kalmbach et al. 2012). Briefly, we injected adeno-associated virus [rAAV5.EF1a-DIO-hChR2(H134R)eYFP; Virus Vector Core, University of North Carolina] into mice expressing Cre-recombinase on a choline-acetyltransferase (ChAT) promoter [Tg(ChAT-Cre)60Gsat mice, GENSAT]. Four hundred nanoliters of virus were injected into mice at postnatal day 21, using stereotaxic coordinates (0.3 mm anterior, 1.7 mm lateral, 4.5 mm ventral). Infection caused expression of a ChR2-yellow florescent fusion protein containing the H134R variant of ChR2 (Nagel et al. 2005) in cholinergic neurons in basal forebrain, which contain Cre-recombinase (Kalmbach et al. 2012).
Fig. 1.

Optogenetic stimulation of cholinergic axons in neocortex. A: schematic illustration of a coronal section through the mouse brain, with the approximate position of nucleus basalis and the projection tract to cortex marked in green. Our approach utilizes cholinergic neurons expressing channelrhodopsin-2 (ChR2)-yellow florescent fusion protein (YFP), which are therefore fluorescent and depolarized by blue light. B: schematic illustration of the recording and stimulation arrangement. A cranial window was cut in the bone (gray) above neocortex, enabling stimulation of cholinergic axons in neocortex (green) with blue light from an optical fiber mounted just above the cortical surface. A glass recording pipette inserted into cortex via the same craniotomy was used to monitor the local field potential (LFP). C: an image of ChR2-YFP-labeled axons in neocortex. The image is a maximum intensity projection of a stack acquired through the cranial window during an experiment. D: ChR2-YFP (green) and anti-choline-acetyltransferase (ChAT) (red) labeling in nucleus basalis in a ChAT-ChR2(Ai32) mouse. CP, caudate putamen; LV, lateral ventricle.
In some experiments, we instead used ChAT-ChR2(Ai32) mice, which were the product of lines B6;129S6-Chattm1(cre)Lowl/J (ChAT-Cre; Jax 006410) and 129S-Gt(ROSA)26Sortm32(CAG-COP4*H134R/EYFP)Hze/J (Ai32, Jax 012569; Madisen et al. 2012). ChAT-Cre+ mice were crossed with ChR2+/+ mice to yield Cre+ ChR2+/− offspring. These offspring were crossed to generate Cre+ ChR2+/+ mice, which were used for experiments. Results from ChAT-ChR2(Ai32) mice were similar to those from viral infections, and results from these two approaches were pooled.
Preparation.
Three to four weeks following virus injection, mice were anesthetized with isoflurane (2.5%, inhaled) and subsequently with urethane (1 g/kg ip). Anesthesia was deep enough to eliminate toe pinch withdrawal responses, palpebral reflex, and vibrissal movements. Core body temperature was maintained at 38°C with a rectal probe and heating pad. A small steel plate was attached to the skull with dental acrylic, and a craniotomy performed over the vibrissal field of somatosensory cortex (2 × 2 mm window, centered 1.5 mm posterior and 3 mm lateral to bregma). The cranial window was covered with a thin layer of agarose (1.5% wt/vol) in (in mM) 1.35 NaCl2, 5.4 KCl, 1 MgCl2, 1.8 CaCl2, 5 HEPES, pH 7.4. The mouse's eyes were covered with electrical tape to prevent visual stimulation. Surgical procedures were performed under red light to prevent ChR2 activation.
LFPs were recorded with glass pipettes (impedance <1 MΩ when filled with the above solution) and an Axopatch 200 amplifier (Molecular Devices, Sunnyvale, CA). LFPs were low-pass filtered at 100 Hz with a four-pole RC filter (Krone-Hite, model 3202) and acquired at 20 kHz with a National Instruments board and LabView software (National Instruments, Austin, TX). In some experiments, Texas Red Dextran (1% wt/vol; 10 kDa; Invitrogen) was included in the recording pipette to mark the location of the recording.
ACh release was evoked by illumination of the surface of primary somatosensory (S1) neocortex using a 473-nm laser (Optotronics model VA-I-100–473) directed via an optical fiber (550 μm core diameter; Thorlabs, Newton, NJ) positioned ∼3 mm from cortical surface, which illuminated an elliptical region of ∼1 × 2 mm. The laser delivered a train of fifty 10-ms pulses of light at 20 Hz.
In a few experiments, desynchronization was evoked electrically as described previously (Kalmbach et al. 2012). Seventy-five 0.1-ms, 100- to 300-μA stimuli were delivered at 75 Hz using a stimulus isolator (WTI A365, World Precision Instruments, Sarasota, FL), through a bipolar tungsten electrode with tip separation of 0.5–1 mm (made from two monoploar electrodes, TM31A10, World Precision Instruments). Electrodes were placed using stereotaxic coordinates: 0.2 mm posterior, 1.7 mm lateral, and 4.5 mm below bregma.
For multiple simultaneous LFP recordings, the S1 electrode was placed in the medio-rostral corner of the craniotomy. Other recordings were from wires placed on the cortical surface below small holes drilled above primary motor (M1; 1.5 mm anterior, 1.75 mm lateral), somatosensory (S1; 1 mm posterior, 2 mm lateral), auditory (A1; 2.5 mm posterior, 4.4 mm lateral) and visual (V1; 4 mm posterior, 2.5 mm lateral) cortexes. Recordings were made with stainless steel wires (0.002-in. diameter steel core, 0.0045-in. diameter with PFA coating, A-M systems, Sequim, WA), an HS 16 preamplifier and a Lynx-8 amplifier (Neuralynx, Bozeman, MT). LFP signals were sampled at 2 kHz, amplified ×500–2000 and digitally band-pass filtered at 1–250 Hz.
Analysis of LFPs.
Analysis of LFP traces was performed using software custom-written in Igor (Wavemetrics, Lake Oswego, OR) and MATLAB (Mathworks, Natick, MA). Recorded signals were down-sampled to 1 kHz, and frequency components of the traces were then extracted by multitaper spectral analysis using the Chronux toolbox (Mitra and Bokil 2008; http://chronux.org).
To measure desynchronization, we calculated the frequency components in 2-s-long windows that overlapped by 0.2 s. Normalized power in the 1- to 6-Hz band was calculated by dividing 1- to 6-Hz power by the mean 1- to 6-Hz power 2–8 s before the stimulus. Experiments were accepted for further analysis only if desynchronization was stable. To check for stability, we fit a straight line to the relationship between normalized response and time, discarding experiments with a slope of >0.4% per minute (>12% change in desynchronization over 30 min). For each animal we determined whether there was desynchronization by comparing, for multiple trials, the mean 1- to 6-Hz power 0.6–2.6 s after stimulus onset with the mean power 2 s before the stimulus, using a paired t-test with a P < 0.05 criterion.
To quantify changes in higher frequency power, we calculated frequency components in 1-s-long windows that overlapped by 0.1 s. The 10- to 20-Hz band was normalized to mean 10- to 20-Hz power 2–8 s prior to the stimulus. The timing of onset and offset responses in the 10- to 20-Hz band differed between animals, as reported previously (Linkenkaer-Hansen et al. 2004). Hence to measure 10- to 20-Hz responses at stimulus onset and offset, for each animal we first examined the mean normalized 10- to 20-Hz power band from multiple trials to determine the timing of the maximum power 0–1 s after the start of the stimulus (onset response) and 0–4 s after the end of the stimulus (offset response). We then calculated the mean power centered on the peak, averaging over 5 and 11 consecutive windows for onset and offset responses. For each animal we determined whether there was a change in onset or offset 10- to 20-Hz power by comparing, for multiple trials, the peak power with the maximum power in a similarly-sized window in the prestimulus period, using a paired t-test with a P < 0.05 criterion.
Pharmacology.
Drugs were applied systemically by injection into the retro-orbital sinus, from where they readily entered the bloodstream (Yardeni et al. 2011). Unlike application to the cortical surface, retro-orbital injection provides rapid delivery of drug to all layers of neocortex. Two and one-half to five microliters of drug solution per gram of body weight were administered, resulting in final doses of 5–10 mg/kg mecamylamine and 3.3–6.6 mg/kg atropine (both from Sigma-Aldrich, St. Louis MO). Assuming a blood volume of 1.4 ml, these doses would result in blood concentrations of ∼500 μM of mecamylamine and ∼250 μM atropine.
To determine whether mecamylamine and atropine significantly altered power ratios across multiple trials in a single mouse, we performed a one-way ANOVA and post hoc unpaired t-tests, with P < 0.05 criterion. To compare drug effects across the population of mice, we calculated a mean power ratio for each drug condition for each mouse and performed a one-way Kruskal-Wallis and post-hoc Kolmogorov-Smirnov tests, with P < 0.05 criterion.
RESULTS
We studied the effects of ACh on ongoing network activity in urethane-anesthetized mice. As expected, all mice displayed the cortical slow oscillation, characterized by irregular deflections in the LFP at ∼0.5–2 Hz (Fig. 2A; Clement et al. 2008; Steriade et al. 1993b). To evoke release of ACh from cholinergic axons in neocortex, we expressed ChR2 in cholinergic neurons in nucleus basalis and illuminated the surface of neocortex with blue light (Figs. 1 and 2A; Kalmbach et al. 2012).
Fig. 2.

Differential modulation of high- and low-frequency power by acetylcholine (ACh) release. A: example of a LFP recording. Bars and shaded area indicate illumination of the cortical surface with fifty 10-ms light pulses at 20 Hz, starting at 10 s. B: spectrogram showing average power over 45 trials for the mouse in A. C: corresponding normalized spectrogram, indicating changes in power at each frequency. D–F: equivalent plots for a mouse with no expression of ChR2.
To visualize the different frequency components of the LFP, we displayed the LFP as a spectrogram. Most of the power in the LFP is below ∼6 Hz (Fig. 2B). To illustrate ACh-evoked changes in different frequency bands, we normalized the power at each frequency to that during the prestimulus period (Fig. 2C). The normalized power spectrogram reveals that the decrease in power following the stimulus occurs across a broad range of frequencies up to 50 Hz, with a particularly pronounced decrease at low frequencies, below ∼10 Hz (Fig. 2C; dark blue regions). In addition, there are two brief increases in power in higher frequency bands: one at the onset of illumination, extending from ∼10 to 50 Hz, and another following the termination or offset of illumination, in a narrower frequency band between 10 and 20 Hz (Fig. 2C; regions in yellow and red). These effects of illumination were absent from mice lacking ChR2 expression (Fig. 2, D–F; although there were small changes in power in a couple of ChR2− mice, described below), indicating that the effects of surface illumination on the cortical LFP resulted from stimulation of cholinergic axons from nucleus basalis.
Quantification of desynchronization.
To quantify desynchronization, we calculated a power ratio, dividing low-frequency (1–6 Hz) power after stimulation with that before the stimulus. Hence we represented desynchronization as a decline in power on a scale of 1 (no desynchronization) to 0 (elimination of 1- to 6-Hz power).
The effects of ACh are transient. Thus accurate quantification requires the calculation of power in brief time windows, lasting no more than several seconds. Nyquist-Shannon sampling theorem limits the lowest frequency that can be measured to twice the reciprocal of the length of the time window (Shannon 1949). It is not possible, therefore, to calculate power across the frequency range of the cortical slow oscillation (0.5–2 Hz) with windows shorter than 4 s. Consequently, shorter temporal windows offer higher temporal resolution while excluding the low-frequency components which contain most of the power and include the periodicity of the cortical slow oscillation.
We began by determining the most appropriate window length with which to measure desynchronization in our recordings, seeking the window length that reported the largest desynchronization with the least noise. We calculated the power ratio at low frequencies (≤6 Hz) as a function of time, using window lengths from 0.375 to 5 s (Fig. 3, B and C). The decline in power ratio upon stimulation was greatest for windows 1–2 s long (Fig. 3, D and F), but trial-to-trial variability also increased with decreasing window length (Fig. 3E). Hence despite excluding power below 1 Hz, 2-s windows offer the best signal-to-noise ratio for the detection of desynchronization in our LFP recordings. Therefore we analyzed power in the 1- to 6-Hz band using 2-s windows.
Fig. 3.

Analysis of low-frequency power. A: example of a LFP recording. Bars and gray shaded areas indicate illumination of the cortical surface with fifty 10-ms light pulses at 20 Hz, starting at 10 s. B: power ratio for the recording in A, calculated using different window lengths. Power was normalized to that 2–10 s before stimulus onset. For each plot, y-axis represents normalized power; solid horizontal line is at 0; dashed horizontal line at 1. Time scale aligned to A. Bandwidths: 0.375-s window, 5.86 Hz; 0.5-s window, 3.9–5.86 Hz; 1-s window, 1.95–5.86 Hz; 2-s window, 0.9766–5.86 Hz; 5-s window, 0.4883–5.86 Hz. C: mean power ratio from 45 trials, for the mouse in A–C, calculated using different window lengths. Shading denotes ±SE. D: comparison of power ratio for different window lengths, for 45 trials from the same mouse as A–D. E: comparison of trial-to-trial variability (SE of normalized power) for different window lengths, for 45 trials from the same mouse as A–E. F: power ratio as a function of window length. Each point represents means ± SE of 45 trials in each of 9 mice.
To determine whether ACh evoked a desynchronization, in each mouse we compared the mean 1- to 6-Hz power 0.6–2.6 s after stimulus onset with the mean power 2–10 s before the stimulus, using a paired t-test with a P < 0.05 criterion. Desynchronization was observed in 57 of 74 ChR2-expressing (ChR2+) mice, but only 2 of 17 uninjected (ChR2−) mice (Fig. 4A). The mean power ratio across all ChR2+ mice, including those without desynchronization, was 0.63 ± 0.03 (Fig. 4B).
Fig. 4.

Optogenetic stimulation of cholinergic axons evokes reproducible desynchonization. A: percentage of virally injected (ChR2+, 57 of 74 mice) and uninjected control (ChR2−, 2 of 17) mice displaying significant desynchronization. B: mean ± SE power ratio for all ChR2+ and ChR2− mice tested, including those without significant desynchronization, 74 and 17 mice, respectively. *Significant difference. C: example of desynchronization that was stable for 40 min. Each point represents a single trial. Dashed line is linear fit through the data points, with a slope of −0.02%/min.
In ChR2-expressing mice that displayed desynchronization, the power ratio varied from trial to trial, but was stable for tens of minutes in many recordings (Fig. 4A). We assessed stability using a linear fit (Fig. 4C) and accepted for further analysis only recordings in which the power ratio was stable, discarding recordings in which the power ratio changed by more than 0.4%/min.
Pharmacology of optogenetically evoked desynchronization.
We determined whether nAChRs and mAChRs are both necessary for desynchronization using the selective nAChR and mAChR antagonists mecamylamine and atropine. Application of mecamylamine, of atropine and of saline (the vehicle) altered the power of the LFP before stimulation (prestimulus power) in some mice, but only mecamylamine had consistent effects across the population of mice studied. We studied the effects of these drugs across the spectral range up to 50 Hz. To examine effects on different spectral components, we binned the data into four bands: 1–6, 6–10, 10–20 and 20–50 Hz. In most mice, mecamylamine reduced prestimulus power in multiple power bands (Fig. 5, A and B). In the 1- to 6-Hz band, mecamylamine reduced power in four of five mice (P < 0.05, paired t-test) to 68 ± 12% of the 1- to 6-Hz power before mecamylamine application. Although atropine also altered prestimulus power in some mice (Fig. 5, A and B), atropine increased and decreased power apparently at random, and no consistent effect of atropine was observed in the population of mice in any of the four power bands. Saline altered prestimulus power in few mice (Fig. 5, A and B), but the effects of saline injections, when significant, included increases and decreases in power and no mean effect in any power band.
Fig. 5.

Effects of mecamylamine and atropine on prestimulus power. A: mean effects of mecamylamine, atropine and saline on prestimulus power spectral density analyzed in four bands (1–6, 6–10, 10–20, 20–50 Hz). In each mouse, power in each band was normalized to the predrug condition. Data points denote the mean ± SE of normalized power across the population of mice, with numbers above the data points indicating the number of mice in which power changed significantly (P < 0.05, paired t-test). Total numbers of mice were 5 for mecamylamine, 5 for atropine and 6 for saline. *Significant changes across the population of mice. B: power spectra illustrating the effects of mecamylamine, atropine and saline injections on the LFP power in the absence of stimulation. Each spectrum is the mean of the population of mice, with shading illustrating the SD. The mean power spectrum from each mouse was normalized to the peak power before drug application.
In most mice, mecamylamine inhibited desynchronization, increasing the 1- to 6-Hz power ratio. In the representative example shown in Fig. 6, A and B, mecamylamine increased the 1- to 6-Hz power ratio from 0.27 ± 0.02 to 0.58 ± 0.09 (P < 0.01, t-test). Some residual desynchronization persisted in mecamylamine (P < 0.01, paired t-test), and this residual desynchronization was eliminated by subsequent application of atropine (Fig. 6, A and B, P > 0.05, paired t-test). These results were replicated across the population of mice examined: mecamylamine inhibited desynchronization in five of seven mice (Fig. 7, A and B, P > 0.05, paired t-test); residual desynchronization was observed in four of seven mice, typically in those mice in which the initial desynchronization was greatest (Fig. 7, A and B), and subsequent application of atropine eliminated the residual desynchronization (Fig. 6, A and B; Fig. 7, A and B; 3 of 3 mice).
Fig. 6.
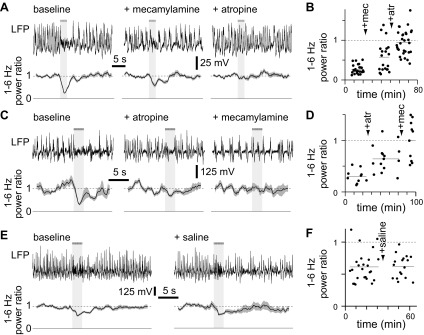
Examples of the effects of mecamylamine and atropine on desynchronization. A: example LFPs (single trials) from a mouse under control conditions, after application of mecamylamine and subsequently atropine. Below, mean (line) ± SE (shaded area) power ratio for each condition (25, 20 and 30 trials, respectively) is given. Solid and dashed lines indicate power ratios of 0 and 1, respectively. The horizontal bar and light gray shading represent the stimulus, which consisted of fifty 10-ms illuminations at 20 Hz. B: power ratio through time for the experiment shown in A, lasting ∼80 min. Each point represents a single trial. The timing of application of mecamylamine and atropine is indicated. The dashed line indicates a power ratio of 1, and shorter horizontal lines indicate the mean power ratio in each condition. C and D: example of an experiment, displayed as in A and B, in which the order of drug application was reversed. There were 10, 15 and 15 trails in control condition, atropine and mecamylamine, respectively. E and F: example of an experiment in which only the vehicle (saline) was applied. Again, results are displayed as in A and B. There were 26 and 16 trials before and after saline application, respectively.
Fig. 7.

Summary of the effects of mecamylamine and atropine on desynchronization. A: mean ± SE power ratio for experiments in which mecamylamine was administered before atropine; n = 7, 7 and 6 mice, respectively. In A and all subsequent panels, solid symbols denote significant desynchronization, open symbols denote conditions in which there was no significant desynchronization, and asterisks indicate changes in power ratio (paired t-test, P < 0.05). B: mean power ratios for each mouse in which mecamylamine was administered before atropine. Lines join points derived from a single mouse. C and D: mean ± SE power ratio for experiments in which atropine was administered before mecamylamine; n = 5, 5 and 4 mice, respectively. E and F: mean ± SE power ratio for experiments in which saline was applied; n = 7 mice.
A similar pattern was observed when atropine was applied before mecamylamine (Fig. 6, C and D; Fig. 7, C and D): atropine reduced desynchronization (5 of 5 mice, P < 0.05, paired t-test). Residual desynchronization was observed in atropine in mice in which desynchronization was pronounced before atropine application (2 of 5 mice). Subsequent application of mecamylamine eliminated the remaining desynchronization. Application of saline (the vehicle for both mecamylamine and atropine) failed to influence desynchronization (Fig. 6, E and F; Fig. 7, E and F; 7 of 7 ChR2-expressing mice displaying desynchronization under control conditions and following saline application, P > 0.05, paired t-test).
We conclude that ACh can evoke desynchronization of the cortical LFP by actions at both mAChRs and nAChRs. Our results provide no evidence that other transmitters, which may be co-released with ACh, are involved since desynchronization was invariably eliminated by a combination of mAChR and nAChR antagonists. In mice where ACh evoked strong desynchronization, neither atropine nor mecamylamine, applied alone, eliminated desynchronization, indicating that both receptor classes are necessary for maximal cholinergic desynchronization. In mice where desynchronization was initially weak, atropine or mecamylamine, applied alone, both appeared sufficient to eliminate desynchronization, but it is possible that weak residual desynchronization in these experiments was below the detection limits in these experiments.
Comparison with desynchronization evoked by electrical stimulation of nucleus basalis.
In previous studies, cortical ACh release and desynchronization were evoked by electrical stimulation of nucleus basalis. A role for nAChRs or for noncholinergic mechanisms was rarely tested in these studies, but there is extensive pharmacological evidence supporting a role for cortical muscarinic receptors in desynchronization (Bakin and Weinberger 1996; Berg et al. 2005; Buzsaki et al. 1988b; Kanai and Szerb 1965; Metherate et al. 1992; Steriade et al. 1993a). We hypothesized that, by analogy with our optogenetics experiments, electrically-evoked desynchronization would be sensitive to both mecamylamine and atropine, and that a combination of these two ACh receptor antagonists would eliminate desynchronization evoked by electrical stimulation of nucleus basalis.
We placed stimulating electrodes in nucleus basalis and evoked desynchronization with brief trains of electrical stimuli (75 stimuli at 100 Hz). Mecamylamine had no effect on electrically-evoked desynchronization (Fig. 8). Atropine inhibited, but did not eliminate, desynchronization (Fig. 8). We conclude that release of ACh in cortex by optogenetic stimulation of cortical cholinergic axons and by electrical stimulation of nucleus basalis evoke desynchronization by different, but overlapping mechanisms. Both mechanisms involve mAChR activation; optogenetic stimulation requires nAChRs, but electrical stimulation does not. The effect of electrical stimulation is only partially inhibited by ACh receptor antagonists, suggesting that electrical stimulation evokes an additional mechanism, perhaps another transmitter, whereas optogenetic stimulation fails to evoke this additional noncholinergic mechanism.
Fig. 8.
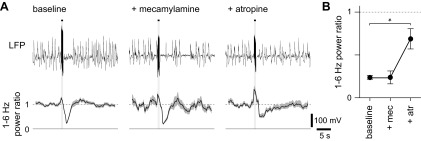
Desynchronization evoked by electrical stimulation of nucleus basalis. A: example LFPs (single trials) from a mouse under control conditions, after application of mecamylamine and subsequently atropine. Below, mean (line) ± SE (shaded area) power ratio for each condition (25, 20 and 30 trials, respectively). Solid and dashed lines indicate power ratios of 0 and 1, respectively. The horizontal bar and light gray shading represent the stimulus, which consisted of seventy-five 0.1-ms electrical pulses at 75 Hz, delivered to nucleus basalis. B: mean ± SE power ratio for electrical stimulation experiments; n = 4, 4 and 3 mice, respectively. Solid symbols denote significant desynchronization, and the asterisk highlights the change in power ratio after atropine application (paired t-test, P < 0.05).
Localization of desynchronization.
Cholinergic projections from basal forebrain innervate the entire cortical mantle (Eckenstein et al. 1988; Johnston et al. 1981; Lehmann et al. 1980), and electrical stimulation of nucleus basalis might therefore be expected to evoke widespread cortical desynchronization. However, each individual axon innervates a column cortex of diameter ∼1–1.5 mm (Price and Stern 1983), and the extracellular concentrations of ACh in different cortical areas can rise and fall independently in awake animals (Parikh et al. 2007). Hence localized release of ACh might desynchronize the LFP only in the vicinity of the released ACh. Alternatively, localized ACh release might evoke widespread desynchronization, if desynchronization spreads through cortico-cortical connections for example. We therefore sought to determine whether localized stimulation of cholinergic axons evokes localized or global desynchronization of the LFP.
We measured LFPs from four cortical areas simultaneously: primary somatosensory, primary auditory, primary visual and primary motor areas (S1, A1, V1 and M1, respectively). As before, we evoked release by localized illumination of S1, between the S1 and A1 recording sites (Fig. 9A). Desynchronization was strongest at the S1 recording site, near the edge of illumination, weaker in A1, ∼1 mm from the edge of illumination, and absent in V1 and M1, 1.5–2.5 mm from the edge of illumination (Fig. 9, B and C), indicating that depolarization of cholinergic axons via ChR2 evokes localized ACh release and drives desynchronization of the local cortical network, but fails to desynchronize the cortical LFP greater than ∼1 mm from the illuminated region.
Fig. 9.
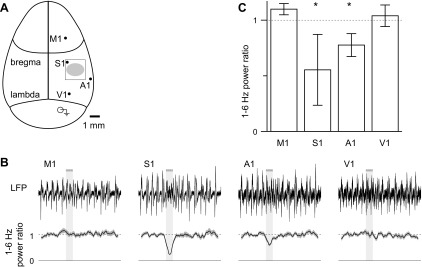
Localized stimulation evokes localized, not global, desynchronization. A: schematic representation of top view of the mouse skull, drawn approximately to scale and illustrating the major suture lines; the locations of electrodes used to measure LFPs simultaneously from primary motor, somatosensory, auditory and visual cortex; the craniotomy over S1 (open rectangle); and the region illuminated with blue light (filled ellipse). B: example LFPs from all four regions. Below, mean (line) ± SE (shaded area) power ratio, 27 trials. Solid and dashed lines indicate power ratios of 0 and 1, respectively. The horizontal bar and light gray shading represent the stimulus, which consisted of fifty 10-ms illuminations at 20 Hz. C: mean ± SE power ratio at each site; n = 3 mice. *Significant desynchronization (paired t-test, P < 0.05).
Effects of ACh in the 10- to 20-Hz band.
At high frequencies (above ∼10 Hz), ACh evoked two brief increases in power: one at stimulus onset, which extended across a broad range of frequencies from ∼10 to 50 Hz and quickly returned to baseline, and a second several seconds later. In our experiments, this second high-frequency response occurred across a narrower range of frequencies, from ∼10 to 15 Hz, and occurred shortly after the end of stimulation (Fig. 2, A–C, Fig. 10, A–C), and we will therefore refer to this second increase in high-frequency power as an offset response.
Fig. 10.

Example of high-frequency responses to optogenetic stimulation of cholinergic axons. A: example LFP from a ChR2+ mouse. Bar and light gray shading indicate illumination of the cortical surface with fifty 10-ms light pulses at 20 Hz, starting at 10 s. B: 10- to 20-Hz power ratio for the trial in A. C: mean power ratio from 45 trials. Shading denotes SE. D–F: results from an uninfected mouse, displayed in a similar manner to A–D. G: bar chart, illustrating the percentage of ChR2+ and ChR2− mice that displayed a significant increase in 10- to 20-Hz power at the onset of illumination. H: mean ± SE amplitude of the change in 10- to 20-Hz power at response onset, in ChR2+ and in ChR2− mice which displayed a significant change in 10- to 20-Hz power at response onset. Power ratio of 1 (dashed line) would indicate no change in 10- to 20-Hz power with illumination. I and J: percentage of ChR2+ and ChR2− mice that displayed a significant increase in 10- to 20-Hz power at the offset of illumination.
Changes in 10- to 20-Hz power were not observed in every mouse: onset and offset responses were observed in 44 and 38, respectively, of 74 ChR2+ mice (Fig. 10, G and I). These responses could occur independently: 19 mice displayed an onset but no offset response, and 13 mice displayed only an offset response, suggesting that onset and offset responses probably result from two separate mechanisms, rather than being two temporally resolved elements of a single process.
Onset and offset responses were rare in ChR2− mice, occurring in 2 and 0, respectively, of 17 ChR2− mice (Fig. 10, G and I). Furthermore, in mice with an onset response, it was small: the mean change in 10- to 20-Hz power in ChR2− mice with a significant onset response was 30% of that in ChR2+ mice (Fig. 10, F and H). Hence illumination of the cortical surface can evoke weak ChR2-independent changes in 10- to 20-Hz power at stimulus onset, but the changes in 10- to 20-Hz power at stimulus onset and offset were primarily the result of the stimulation of ChR2-expressing axons.
To quantify changes in high-frequency power, we calculated a 10- to 20-Hz power ratio. Spectral analysis requires the calculation of power in time windows (see Quantification of desynchronization section, above), which inevitably results in temporal “smearing.” For 10- to 20-Hz analysis, we used 1-s-long windows and would therefore expect the 10- to 20-Hz power ratio to begin to change ∼0.5 s before the underlying physiological response (Fig. 11C). To obtain more accurate temporal information, we calculated the mean LFP by averaging multiple trials. The mean LFP displayed a prominent peak corresponding to the 10- to 20-Hz onset response (Fig. 11D). (In contrast, the offset response was not obvious in the mean LFP, probably because the offset response varied in time relative to stimulus end.) In the mean LFP, the onset response began after the start of stimulation, with a latency of 82 ± 23 ms (start of stimulation to 10% of peak; 9 mice). The peak of the mean LFP occurred 224 ± 20 ms after the start of stimulation, and width at half maximum was 164 ± 25 ms.
Fig. 11.

Mean and variance of the LFP. A: examples of LFP recordings. Bars and gray shaded areas indicate illumination of the cortical surface with fifty 10-ms light pulses at 20 Hz, starting at 10 s. High-frequency components are visible in many traces, with the offset responses (horizontal bracket) displaying variable timing with respect to the stimulus. B and C: 1- to 6-Hz and 10- to 20-Hz power ratios for a single trial, calculated using 2-s and 1-s windows, respectively. D and E: mean and variance of the LFP for 45 trials in the same mouse. To the right, the LFP, power ratios, mean and variance are shown on an expanded time scale.
We compared the relative timing of the onset response and desynchronization using the mean and variance of the LFP (Fig. 11, D and E). Cortical slow waves are the most prominent deflections in the LFP, and the variance is therefore primarily a measure of slow-wave activity. The variance of the LFP may therefore be used as a measure of desynchronization and offers more temporal information than 1- to 6-Hz power (compare Fig. 11, B and E). In our experiments, the variance of the LFP commonly declined within 0.5 s of the start of stimulation, indicating that desynchronization begins almost immediately (Fig. 11, D and E).
Pharmacology of responses in 10- to 20-Hz band.
To investigate the roles of AChRs in the onset and offset responses, we applied mecamylamine and atropine to block nAChRs and mAChRs, respectively. Mecamylamine eliminated the increase in 10- to 20-Hz power ratio at stimulus onset (Fig. 12A, Fig. 13, A and B; 3 of 3 mice; P < 0.05, t-test). In contrast, the increase in 10- to 20-Hz power ratio at stimulus offset was greatly enhanced by mecamylamine (Fig. 12A): a significant increase in 10- to 20-Hz power ratio at stimulus offset was observed in one of seven mice under control conditions and in four of the seven mice after addition of mecamylamine (Fig. 13B; P < 0.05, t-test). Across the whole population, mecamylamine enhanced the amplitude of the increase in 10- to 20-Hz power ratio at stimulus offset from 1.45 ± 0.09 to 2.67 ± 0.57 (Fig. 13B; 7 mice). Subsequent addition of atropine eliminated the increase in 10- to 20-Hz power ratio at stimulus offset in all four mice with an offset response in mecamylamine (Fig. 13B).
Fig. 12.

Examples of the effects of mecamylamine and atropine on high-frequency power. A: normalized power spectra from a mouse under control conditions, after application of mecamylamine and subsequently atropine. Below, mean (line) ± SE (shaded area) 10- to 20-Hz power ratio for each condition; 20, 25 and 25 trials, respectively. Solid and dashed lines indicate power ratios of 0 and 1, respectively. The horizontal bar and light gray shading represent the stimulus, which consisted of fifty 10-ms illuminations at 20 Hz. B: mean ± SE 10- to 20-Hz power ratio for an animal in which atropine was applied before mecamylamine; 50, 40 and 40 trials, respectively. C: mean ± SE 10- to 20-Hz power ratio for an animal in which saline was applied; 50 and 75 trials before and after saline, respectively.
Fig. 13.

Summary of the effects of mecamylamine and atropine on high-frequency power. A and B: mean ± SE 10- to 20-Hz power ratio at stimulus onset (A) and offset (B) for experiments in which mecamylamine was applied before atropine; 7, 7 and 6 mice, respectively. C and D: equivalent results for mice in which atropine was applied before mecamylamine; 5, 5 and 4 mice, respectively. E and F: results for mice in which saline was applied; 7 mice. In all panels, solid symbols denote significant desynchronization; open symbols denote conditions in which there was no significant desynchronization. *Changes in power ratio (P < 0.05).
Atropine, applied before mecamylamine, eliminated the increases in 10- to 20-Hz power ratio at both stimulus onset and offset (Fig. 12B; Fig. 13, C and D; onset 3 of 3 mice, P < 0.05; offset 2 of 2 mice, P < 0.05), and subsequent application of mecamylamine had no effect (Fig. 12B, Fig. 13, C and D). Application of saline had no effect on the 10- to 20-Hz power ratio (Fig. 12C, Fig. 13, E and F).
Our experiments indicate that mAChR activation is essential for both stimulus onset- and offset-related increases in 10- to 20-Hz power, and that nAChRs play different roles in shaping 10- to 20-Hz power at stimulus onset and offset: nAChRs support the increase in high-frequency power at stimulus onset, but inhibit the increase in high-frequency power at stimulus offset.
DISCUSSION
We have found that selective stimulation of cholinergic axons, using ChR2, evokes desynchronization of the cortical LFP and also brief increases in higher-frequency power time-locked to stimulus onset and offset. These changes in the LFP are mediated by nicotinic and mAChRs. Both receptor types contribute to desynchronization and to the increase in high-frequency power at stimulus onset. In contrast, nAChRs and mAChRs have opposing effects at stimulus offset, with mAChR activation being necessary for, and nAChR activation suppressing the increase in higher-frequency power. Furthermore, we found that localized stimulation of cholinergic axons results in localized desynchronization, indicating that ACh can have localized effects on neocortical networks.
Role of nAChRs in desynchronization.
Our results provide direct evidence that cortical ACh release from basal forebrain axons can evoke desynchronization by acting at nAChRs. Early evidence that nAChR activation could evoke desynchronization was derived from the systemic application of nicotine, but systemic nicotine probably evokes desynchronization primarily via a site in the brain stem, which, in turn, excites cholinergic neurons in the basal forebrain (Armitage et al. 1969; Knapp and Domino 1962; Riekkinen et al. 1993; Yamamoto and Domino 1965). Surprisingly, the effects of nAChR antagonists on desynchronization evoked by stimulation of nucleus basalis do not appear to have been tested previously. Hence the role of nAChRs in desynchronization evoked by the basal forebrain was uncertain.
To separate the effects of ACh into nAChR- and mAChR-mediated components, we used pharmacology, applying mecamylamine and atropine systemically. Possible off-target effects of these drugs complicate interpretation of these experiments. Off-target effects include actions outside the brain and actions at other receptors within the brain. Although mecamylamine and atropine exhibit considerable selectivity for nAChRs and mAChRs, respectively, there are reports of actions at other receptor types when applied at high concentrations. For example, mecamylamine can inhibit NMDA receptors (Papke et al. 2001), and atropine may act at adrenergic receptors (Abraham et al. 1981). To minimize off-target effects and to facilitate comparison with previous studies, we used concentrations of these drugs that have previously been employed to study cholinergic effects in neocortex (Bakin and Weinberger 1996; Janiesch et al. 2011; Kuo et al. 2009; Metherate and Ashe 1993). As a result, off-target effects of mecamylamine and atropine appear unlikely. For example, mecamylamine acts at NMDA receptors with an IC50 of ∼100 μM. Although the blood concentration of mecamylamine in our experiments is higher, probably ∼500 μM, only a small fraction of this mecamylamine is likely to cross the blood-brain barrier, resulting in a lower extracellular concentration in the brain. Hence the most reasonable interpretation of the effects of mecamylamine and atropine are that they reflect the effects of ACh on the cortical LFP in the absence of active nAChRs and mAChRs, respectively.
Another factor that complicates the interpretation of our results is baseline or prestimulus cholinergic activity, which is inhibited by cholinergic antagonists. Like previous authors (e.g., Buzsaki et al. 1988b), we found that mecamylamine and atropine can alter ongoing activity patterns in cortex. These changes might mask or augment the effects of mecamylamine and atropine on stimulus-evoked changes in the LFP. Furthermore, we found that the effects of these drugs on prestimulus power often differed between mice, further complicating interpretation of their effects. In light of this intermouse variability, we have taken a conservative approach, limiting our interpretation to the effects of ACh that occurred in the majority of mice in our study, and it is likely that the effects of ACh on the LFP include further components that we have been unable to identify.
Identification of a nicotinic component to desynchronization opens many questions regarding the role of nAChRs in desynchronization. For example, in neocortex nAChRs are located on presynaptic terminals, interneurons and pyramidal neurons (Gil et al. 1997; Poorthuis et al. 2013; Xiang et al. 1998). One obvious question is what roles each of these receptor populations play in driving desynchronization. Our results provide no indication of the sites of action of ACh, and this topic will require further research.
Role of noncholinergic receptors in desynchronization.
Activation of ACh receptors is not the only mechanism that can give rise to desynchronization. For example, release of noradrenalin upon stimulation of locus coeruleus can evoke desynchronization (Steriade et al. 1993a). Although it is unlikely to activate many of these pathways, such as that from locus coeruleus, stimulation of nucleus basalis may activate noncholinergic neurons, such as GABAergic basal forebrain neurons that project to neocortex. Electrical stimulation may be particularly nonselective in this regard, hence our decision to use ChR2 to evoke ACh release.
We previously established that our approach of injecting floxed virus into ChAT-Cre mice results in expression of ChR2 that is largely restricted to cholinergic neurons (Kalmbach et al. 2012), which presumably ensures that only cholinergic axons are excited by illumination of the cortical surface with blue light. Nonetheless, activation of noncholinergic neurons could occur, for example if cholinergic neurons in nucleus basalis synapse onto and excite neighboring noncholinergic neurons (Zaborszky and Duque 2000). Unfortunately the connectivity within nucleus basalis is unknown, but all of the effects on the cortical LFP were eliminated by the combined actions of mecamylamine and atropine. This result suggests that, in our optogenetic stimulation experiments, either noncholinergic neurons were not activated in significant numbers, or activation of noncholinergic neuron had negligible effect on the cortical LFP.
Comparison of optogenetically and electrically evoked desynchronization.
Like optogenetically evoked desynchronization, electrical stimulation of nucleus basalis evoked desynchronization that was inhibited, but not eliminated, by atropine. However, electrically evoked desynchronization was insensitive to mecamylamine. One simple interpretation of these results is that optogenetic stimulation evokes desynchronization via mAChRs and nAChRs, whereas electrical stimulation acts via mAChRs and an unidentified non-nAChR mechanism. However, we are unable to accurately estimate the extracellular concentrations of antagonists in the cortex and cannot, therefore, rule out the possibility that residual desynchronization after electrical stimulation results from incomplete antagonism of mAChRs. As a competitive antagonist, the effects of atropine on relatively weak electrically evoked desynchronization can be overcome by increasing the strength of the stimulus (Metherate et al. 1992), making interpretation particularly difficult.
Although optogenetically and electrically evoked desynchronizations were of similar amplitude, electrically evoked desynchronization was more prolonged than optogenetically evoked desynchronization. In terms of the duration of desynchronization, this places electrical stimulation between optogenetic stimulation and arousing sensory stimuli, such as a tail pinch, which can evoke desynchronization that lasts for tens of seconds after cessation of sensory stimulation (Kalmbach et al. 2012; Manns et al. 2000). Tail pinch is thought to act primarily through brain stem cholinergic nuclei, which in turn activate basal forebrain cholinergic neurons, but other pathways are also likely to be activated and might contribute to desynchronization (Steriade et al. 1993a). Hence our results are consistent with the idea that desynchronization can be evoked by a spectrum of mechanisms, with optogenetic stimulation of cholinergic neurons driving a relatively pure cholinergic desynchronization; electrical stimulation of nucleus basalis evoking desynchronization through a limited selection of pathways; and tail pinch operating via a larger number of pathways and involving cholinergic and noncholinergic mechanisms.
If optogenetically evoked desynchronization activates a subset of the neurons activated by electrical stimulation of nucleus basalis, why does mecamylamine inhibit only optogenetically evoked desynchronization? We think it unlikely that optogenetic stimulation excites an additional nAChR-mediated component. ChR2 is permeable to many cations, including calcium, and stimulation of axons via ChR2 can result in greater presynaptic calcium influx than that evoked by action potentials alone (Zhang and Oertner 2007). However, it is hard to see how additional ACh release, evoked by optogenetic stimulation, might activate nAChRs and lead to less prolonged desynchronization than occurs with electrical stimulation. We consider it more likely that additional transmitters released by electrical stimulation obscure the nAChR-mediated component of desynchronization. Hence we consider it most likely that 1) ACh evokes desynchronization via combined actions on nAChRs and mAChRs; and 2) as suggested previously (e.g., Berg et al. 2005), the effects of ACh, particularly via nAChRs, can be supplemented and partially obscured when other transmitters are also released, such as following electrical stimulation of nucleus basalis or a tail pinch.
Cellular mechanisms by which ACh affects the cortical LFP.
The LFP is the weighed sum of many ionic currents. Synaptic currents dominate the LFP across the range of frequencies measured here, with spikes and spike after-potentials making significant contributions only to high frequency bands (Buzsaki et al. 2012; but see Reimann et al. 2013). Synchronized low-frequency activity in the LFP, such as observed during slow-wave sleep or anesthesia, is generally thought to reflect alternating periods of activity and inactivity of cortical neurons, with nearby neurons switching states almost simultaneously (Petersen et al. 2003; Wilson and Kawaguchi 1996) and with the low-frequency power presumably resulting from synchronized synaptic signaling between cortical neurons.
The mechanisms underlying onset and offset responses are less clear, but both onset and offset responses may arise from synchronous spiking of large numbers of neurons, which would provide a large, brief peak in synaptic activity that contributes to the LFP. However, the onset and offset responses differ in several respects: they occur over different frequency ranges, display different pharmacological sensitivities and occur independently of each other, suggesting that they involve different mechanisms. Furthermore, only the onset response is reflected in the mean LFP. The offset response occurs at variable times after stimulus offset and is visible in individual trials, but less so in the mean of the LFP. nAChRs clearly play different roles at stimulus onset and offset, since nAChR activation contributes to the rise in higher-frequency power at stimulus onset, but suppresses the increase in 10- to 20-Hz power at stimulus offset.
The offset response is similar in duration and frequency composition to high-voltage spindles that are observed in neonatal rats following nucleus basalis stimulation (Hanganu et al. 2007) and during slow-wave sleep and quiet immobility (Buzsáki et al. 1988a; Hanganu et al. 2007; Radek 1993; Riekkinen et al. 1993; Ryan 1985). Like the offset response, high-voltage spindles are enhanced by nicotinic antagonists (Radek 1993; Riekkinen et al. 1993; Ryan 1985). The cellular mechanisms underlying high-voltage spindles are unknown, but likely involve synchronous activation of neurons throughout the cortical layers following thalamocortical activity (Buzsáki et al. 1988a; Hartwich et al. 2009). Furthermore, different classes of cortical inhibitory interneurons have distinct roles in synchronizing pyramidal and inhibitory neurons during spindle oscillations (Hartwich et al. 2009; Peyrache et al. 2011). ACh has differing effects on distinct subclasses of interneurons through subclass-specific activation of mAChRs or nAChRs (Christophe et al. 2002; Gulledge et al. 2007; Xiang et al. 1998). Hence blockade of nAChRs may act through discrete subpopulations of interneurons to enhance the offset response, as observed here. A deeper understanding of the cellular mechanisms underlying the changes in higher-frequency power at stimulus onset and offset will require further examination, probably including measurements of cellular activity, such as with unit and intracellular recordings.
GRANTS
We thank the Whitehall Foundation (2006-12-31), National Institute of Mental Health (R21-MH-085117) and National Institute of Neurological Disorders and Stroke (R01-NS-078067) for funding.
DISCLOSURES
No conflicts of interest, financial or otherwise, are declared by the author(s).
AUTHOR CONTRIBUTIONS
Author contributions: A.K. and J.W. conception and design of research; A.K. performed experiments; A.K. analyzed data; A.K. and J.W. interpreted results of experiments; A.K. prepared figures; A.K. drafted manuscript; A.K. and J.W. edited and revised manuscript; A.K. and J.W. approved final version of manuscript.
ACKNOWLEDGMENTS
We thank Becky Imhoff and Lauren Sybert for technical assistance and Tristan Hedrick for immunohistochemistry used in Fig. 1. We thank Tristan Hedrick and Anis Contractor for comments on the manuscript.
REFERENCES
- Abraham S, Cantor EH, Spector S. Atropine lowers blood pressure in normotensive rats through blockade of alpha-adrenergic receptors. Life Sci 28: 315–322, 1981 [DOI] [PubMed] [Google Scholar]
- Alkondon M, Pereira EFR, Eisenberg HM, Albuquerque EX. Nicotinic receptor activation in human cerebral cortical interneurons: a mechanism for inhibition and disinhibition of neuronal networks. J Neurosci 20: 66–75, 2000 [DOI] [PMC free article] [PubMed] [Google Scholar]
- Armitage AK, Hall GH, Sellers CM. Effects of nicotine on electrocortical activity and acetylcholine release from the cat cerebral cortex. Br J Pharmacol 35: 152–160, 1969 [DOI] [PMC free article] [PubMed] [Google Scholar]
- Bakin JS, Weinberger NM. Induction of a physiological memory in the cerebral cortex by stimulation of the nucleus basalis. Proc Natl Acad Sci U S A 93: 11219–11224, 1996 [DOI] [PMC free article] [PubMed] [Google Scholar]
- Bennett-Clarke C, Romagnano M, Joseph SA. Distribution of somatostatin in the rat brain: telencephalon and diencephalon. Brain Res 188: 473–486, 1980 [DOI] [PubMed] [Google Scholar]
- Berg RW, Friedman B, Schroeder LF, Kleinfeld D. Activation of nucleus basalis facilitates cortical control of a brain stem motor program. J Neurophysiol 94: 699–711, 2005 [DOI] [PubMed] [Google Scholar]
- Buzsaki G, Anastassiou CA, Koch C. The origin of extracellular fields and currents–EEG, ECoG, LFP and spikes. Nat Rev Neurosci 13: 407–420, 2012 [DOI] [PMC free article] [PubMed] [Google Scholar]
- Buzsáki G, Bickford RG, Armstrong DM, Ponomareff G, Chen KS, Ruiz R, Thal LJ, Gage FH. Electric activity in the neocortex of freely moving young and aged rats. Neuroscience 26: 735–744, 1988a [DOI] [PubMed] [Google Scholar]
- Buzsaki G, Bickford RG, Ponomareff G, Thai LJ, Mandel R, Gage FH. Nucleus basalis and thalamic control of neocortical activity in the freely moving rat. J Neurosci 8: 4007–4026, 1988b [DOI] [PMC free article] [PubMed] [Google Scholar]
- Cape EG, Manns ID, Alonso A, Beaudet A, Jones BE. Neurotensin-induced bursting of cholinergic basal forebrain neurons promotes gamma and theta cortical activity together with waking and paradoxical sleep. J Neurosci 20: 8452–8461, 2000 [DOI] [PMC free article] [PubMed] [Google Scholar]
- Casamenti F, Deffenu G, Abbamondi AL, Pepeu G. Changes in cortical acetylcholine output induced by modulation of the nucleus basalis. Brain Res Bull 16: 689–695, 1986 [DOI] [PubMed] [Google Scholar]
- Celesia GG, Jasper HH. Acetylcholine released from cerebral cortex in relation to state of activation. Neurology 16: 1053–1063, 1966 [DOI] [PubMed] [Google Scholar]
- Christophe E, Roebuck A, Staiger JF, Lavery DJ, Charpak S, Audinat E. Two types of nicotinic receptors mediate an excitation of neocortical layer I interneurons. J Neurophysiol 88: 1318–1327, 2002 [DOI] [PubMed] [Google Scholar]
- Chu ZG, Zhou FM, Hablitz JJ. Nicotinic acetylcholine receptor-mediated synaptic potentials in rat neocortex. Brain Res 887: 399–405, 2000 [DOI] [PubMed] [Google Scholar]
- Clement EA, Richard A, Thwaites M, Ailon J, Peters S, Dickson CT. Cyclic and sleep-like spontaneous alternations of brain state under urethane anesthesia. PLoS ONE 3: e2004, 2008 [DOI] [PMC free article] [PubMed] [Google Scholar]
- Conrad LC, Pfaff DW. Efferents from medial basal forebrain and hypothalamus in the rat. II. An autoradiographic study of the anterior hypothalamus. J Comp Neurol 169: 221–261, 1976 [DOI] [PubMed] [Google Scholar]
- Cullinan WE, Záborszky L. Organization of ascending hypothalamic projections to the rostralforebrain with special reference to the innervation of cholinergic projection neurons. J Comp Neurol 306: 631–667, 1991 [DOI] [PubMed] [Google Scholar]
- Détári L, Vanderwolf CH. Activity of identified cortically projecting and other basal forebrain neurones during large slow waves and cortical activation in anaesthetized rats. Brain Res 437: 1–8, 1987 [DOI] [PubMed] [Google Scholar]
- Duque A, Balatoni B, Detari L, Zaborszky L. EEG correlation of the discharge properties of identified neurons in the basal forebrain. J Neurophysiol 84: 1627–1635, 2000 [DOI] [PubMed] [Google Scholar]
- Eckenstein FP, Baughman RW, Quinn J. An anatomical study of cholinergic innervation in rat cerebral cortex. Neuroscience 25: 457–474, 1988 [DOI] [PubMed] [Google Scholar]
- Fisher RS, Buchwald NA, Hull CD, Levine MS. GABAergic basal forebrain neurons project to the neocortex: the localization of glutamic acid decarboxylase and choline acetyltransferase in feline corticopetal neurons. J Comp Neurol 272: 489–502, 1988 [DOI] [PubMed] [Google Scholar]
- Gil Z, Connors BW, Amitai Y. Differential regulation of neocortical synapses by neuromodulators and activity. Neuron 19: 679–686, 1997 [DOI] [PubMed] [Google Scholar]
- Goard M, Dan Y. Basal forebrain activation enhances cortical coding of natural scenes. Nat Neurosci 12: 1440–1447, 2009 [DOI] [PMC free article] [PubMed] [Google Scholar]
- Guillem K, Bloem B, Poorthuis RB, Loos M, Smit AB, Maskos U, Spijker S, Mansvelder HB. Nicotinic acetylcholine receptor β2 subunits in the medial prefrontal cortex control attention. Science 333: 888–891, 2011 [DOI] [PubMed] [Google Scholar]
- Gulledge A, Park S, Kawaguchi Y, Stuart G. Heterogeneity of phasic cholinergic signaling in neocortical neurons. J Neurophysiol 97: 2215–2229, 2007 [DOI] [PubMed] [Google Scholar]
- Hanganu IL, Staiger JF, Ben-Ari Y, Khazipov R. Cholinergic modulation of spindle bursts in the neonatal rat visual cortex in vivo. J Neurosci 27: 5694–5705, 2007 [DOI] [PMC free article] [PubMed] [Google Scholar]
- Hartwich K, Pollak T, Klausberger T. Distinct firing patterns of identified basket and dendrite-targeting interneurons in the prefrontal cortex during hippocampal theta and local spindle oscillations. J Neurosci 29: 9563–9574, 2009 [DOI] [PMC free article] [PubMed] [Google Scholar]
- Henny P, Jones BE. Projections from basal forebrain to prefrontal cortex comprise cholinergic, GABAergic and glutamatergic inputs to pyramidal cells or interneurons. Eur J Neurosci 27: 654–670, 2008 [DOI] [PMC free article] [PubMed] [Google Scholar]
- Herrero JL, Roberts MJ, Delicato LS, Gieselmann MA, Dayan P, Thiele A. Acetylcholine contributes through muscarinic receptors to attentional modulation in V1. Nature 454: 1110–1114, 2008 [DOI] [PMC free article] [PubMed] [Google Scholar]
- Janiesch PC, Krüger HS, Pöschel B, Hanganu-Opatz IL. Cholinergic control in developing prefrontal-hippocampal networks. J Neurosci 31: 17955–17970, 2011 [DOI] [PMC free article] [PubMed] [Google Scholar]
- Johnston MV, McKinney M, Coyle JT. Neocortical cholinergic innervation: a description of extrinsic and intrinsic components in the rat. Exp Brain Res 43: 159–172, 1981 [DOI] [PubMed] [Google Scholar]
- Kalmbach A, Hedrick T, Waters J. Selective optogenetic stimulation of cholinergic axons in neocortex. J Neurophysiol 107: 2008–2019, 2012 [DOI] [PMC free article] [PubMed] [Google Scholar]
- Kanai T, Szerb JC. Mesencephalic reticular activating system and cortical acetylcholine output. Nature 205: 80–82, 1965 [DOI] [PubMed] [Google Scholar]
- Kassam SM, Herman PM, Goodfellow NM, Alves NC, Lambe EK. Developmental excitation of corticothalamic neurons by nicotinic acetylcholine receptors. J Neurosci 28: 8756–8764, 2008 [DOI] [PMC free article] [PubMed] [Google Scholar]
- Kilgard M. Cholinergic modulation of skill learning and plasticity. Neuron 38: 678–680, 2003 [DOI] [PubMed] [Google Scholar]
- Knapp DE, Domino EF. Action of nicotine on the ascending reticular activating system. Int J Neuropharmacol 1: 333–351, 1962 [Google Scholar]
- Kuo MC, Rasmusson DD, Dringenberg HC. Input-selective potentiation and rebalancing of primary sensory cortex afferents by endogenous acetylcholine. Neuroscience 163: 430–441, 2009 [DOI] [PubMed] [Google Scholar]
- Lee MG, Hassani OK, Alonso A, Jones BE. Cholinergic basal forebrain neurons burst with theta during waking and paradoxical sleep. J Neurosci 25: 4365–4369, 2005 [DOI] [PMC free article] [PubMed] [Google Scholar]
- Lee MG, Manns ID, Alonso A, Jones BE. Sleep-wake related discharge properties of basal forebrain neurons recorded with micropipettes in head-fixed rats. J Neurophysiol 92: 1182–1198, 2004 [DOI] [PubMed] [Google Scholar]
- Lehmann J, Nagy JI, Atmadja S, Fibiger HC. The nucleus basalis magnocellularis: the origin of a cholinergic projection to the neocortex of the rat. Neuroscience 5: 1161–1174, 1980 [DOI] [PubMed] [Google Scholar]
- Linkenkaer-Hansen K, Nikulin VV, Palva S, Ilmoniemi RJ, Palva JM. Prestimulus oscillations enhance psychophysical performance in humans. J Neurosci 24: 10186–10190, 2004 [DOI] [PMC free article] [PubMed] [Google Scholar]
- Ljungdahl A, Hokfelt T, Nilsson G. Distribution of substance P-like immunoreactivity in the central nervous system of the rat. I. Cell bodies and nerve terminals. Neuroscience 3: 861–943, 1978 [DOI] [PubMed] [Google Scholar]
- Lysakowski A, Wainer BH, Bruce G, Hersh LB. An atlas of the regional and laminar distribution of choline acetyltransferase immunoreactivity in rat cerebral cortex. Neuroscience 28: 291–336, 1989 [DOI] [PubMed] [Google Scholar]
- Madisen L, Mao T, Koch H, Zhuo JM, Berenyi A, Fujisawa S, Hsu YW, Garcia AJ, Gu X, Zanella S, Kidney J, Gu H, Mao Y, Hooks BM, Boyden ES, Buzsaki G, Ramirez JM, Jones AR, Svoboda K, Han X, Turner EE, Zeng H. A toolbox of Cre-dependent optogenetic transgenic mice for light-induced activation and silencing. Nat Neurosci 15: 793–802, 2012 [DOI] [PMC free article] [PubMed] [Google Scholar]
- Manns ID, Alonso A, Jones BE. Discharge properties of juxtacellularly labeled and immunohistochemically identified cholinergic basal forebrain neurons recorded in association with the electroencephalogram in anesthetized rats. J Neurosci 20: 1505–1518, 2000 [DOI] [PMC free article] [PubMed] [Google Scholar]
- Manns ID, Alonso A, Jones BE. Rhythmically discharging basal forebrain units comprise cholinergic, GABAergic, and putative glutamatergic cells. J Neurophysiol 89: 1057–1066, 2003 [DOI] [PubMed] [Google Scholar]
- Manns ID, Mainville L, Jones BE. Evidence for glutamate, in addition to acetylcholine and GABA, neurotransmitter synthesis in basal forebrain neurons projecting to the entorhinal cortex. Neuroscience 107: 249–263, 2001 [DOI] [PubMed] [Google Scholar]
- Mesulam MM, Mufson EJ, Levey AI, Wainer BH. Cholinergic innervation of cortex by the basal forebrain: cytochemistry and cortical connections of the septal area, diagonal band nuclei, nucleus basalis (substantia innominata), and hypothalamus in the rhesus monkey. J Comp Neurol 214: 170–197, 1983 [DOI] [PubMed] [Google Scholar]
- Metherate R, Ashe JH. Ionic flux contributions to neocortical slow waves and nucleus basalis-mediated activation: whole-cell recordings in vivo. J Neurosci 13: 5312–5323, 1993 [DOI] [PMC free article] [PubMed] [Google Scholar]
- Metherate R, Cox CL, Ashe JH. Cellular bases of neocortical activation: modulation of neural oscillations by the nucleus basalis and endogenous acetylcholine. J Neurosci 12: 4701–4711, 1992 [DOI] [PMC free article] [PubMed] [Google Scholar]
- Mitra P, Bokil H. Observed Brain Dynamics. New York: Oxford University Press, 2008 [Google Scholar]
- Papke RL, Sanberg PR, Shytle RD. Analysis of mecamylamine stereoisomers on human nicotinic receptor subtypes. J Pharmacol Exp Ther 297: 646–656, 2001 [PubMed] [Google Scholar]
- Parikh V, Kozak R, Martinez V, Sarter M. Prefrontal acetylcholine release controls cue detection on multiple timescales. Neuron 56: 141–154, 2007 [DOI] [PMC free article] [PubMed] [Google Scholar]
- Parikh V, Sarter M. Cholinergic mediation of attention: contributions of phasic and tonic increases in prefrontal cholinergic activity. Ann NY Acad Sci 1129: 225–235, 2008 [DOI] [PubMed] [Google Scholar]
- Pepeu G, Giovannini MG. Changes in acetylcholine extracellular levels during cognitive processes. Learn Mem 11: 21–27, 2004 [DOI] [PubMed] [Google Scholar]
- Petersen CCH, Hahn TTG, Mehta M, Grinvald A, Sakmann B. Interaction of sensory responses with spontaneous depolarization in layer 2/3 barrel cortex. Proc Natl Acad Sci U S A 100: 13638–13643, 2003 [DOI] [PMC free article] [PubMed] [Google Scholar]
- Peyrache A, Battaglia FP, Destexhe A. Inhibition recruitment in prefrontal cortex during sleep spindles and gating of hippocampal inputs. Proc Natl Acad Sci U S A 108: 17207–17212, 2011 [DOI] [PMC free article] [PubMed] [Google Scholar]
- Poorthuis RB, Bloem B, Schak B, Wester J, de Kock CPJ, Mansvelder HD. Layer-specific modulation of the prefrontal cortex by nicotinic acetylcholine receptors. Cereb Cortex 23: 148–161, 2013 [DOI] [PMC free article] [PubMed] [Google Scholar]
- Price JL, Stern R. Individual cells in the nucleus basalis-diagonal band complex have restricted axonal projections to the cerebral cortex in the rat. Brain Res 269: 352–356, 1983 [DOI] [PubMed] [Google Scholar]
- Radek RJ. Effects of nicotine on cortical high voltage spindles in rats. Brain Res 625: 23–28, 1993 [DOI] [PubMed] [Google Scholar]
- Ramanathan D, Tuszynski MH, Conner JM. The basal forebrain cholinergic system is required specifically for behaviorally mediated cortical map plasticity. J Neurosci 29: 5992–6000, 2009 [DOI] [PMC free article] [PubMed] [Google Scholar]
- Reimann MW, Anastassiou CA, Perin R, Hill SL, Markram H, Koch C. A biophysically detailed model of neocortical local field potentials predict the critical role of active membrane currents. Neuron 79: 375–390, 2013 [DOI] [PMC free article] [PubMed] [Google Scholar]
- Riekkinen P, Riekkinen M, Sirviö J. Effects of nicotine on neocortical electrical activity in rats. J Pharmacol Exp Ther 267: 776–784, 1993 [PubMed] [Google Scholar]
- Roerig B, Nelson DA, Katz LC. Fast synaptic signaling by nicotinic acetylcholine and serotonin 5-HT3 receptors in developing visual cortex. J Neurosci 17: 8353–8362, 1997 [DOI] [PMC free article] [PubMed] [Google Scholar]
- Ryan LJ. Cholinergic regulation of neocortical spindling in DBA/2 mice. Exp Neurol 89: 372–381, 1985 [DOI] [PubMed] [Google Scholar]
- Rye DB, Wainer BH, Mesulam MM, Mufson EJ, Saper CB. Cortical projections arising from the basal forebrain: a study of cholinergic and noncholinergic components employing combined retrograde tracing and immunohistochemical localization of choline acetyltransferase. Neuroscience 13: 627–643, 1984 [DOI] [PubMed] [Google Scholar]
- Shannon CE. Communication in the presence of noise. Proc Instit Radio Eng 37: 10–21, 1949 [Google Scholar]
- Steriade M, Amzica F, Nunez A. Cholinergic and noradrenergic modulation of the slow (∼0.3 Hz) oscillation in neocortical cells. J Neurophysiol 70: 1385–1400, 1993a [DOI] [PubMed] [Google Scholar]
- Steriade M, Nunez A, Amzica F. A novel slow (<1 Hz) oscillation of neocortical neurons in vivo: depolarizing and hyperpolarizing components. J Neurosci 13: 3252–3265, 1993b [DOI] [PMC free article] [PubMed] [Google Scholar]
- Steriade M, Timofeev I, Grenier F. Natural waking and sleep states: a view from inside neocortical neurons. J Neurophysiol 85: 1969–1985, 2001 [DOI] [PubMed] [Google Scholar]
- Steriade M. Sleep oscillations and their blockage by activating systems. J Psychiatry Neurosci 19: 354–358, 1993 [PMC free article] [PubMed] [Google Scholar]
- Stewart DJ, Macfabe DF, Vanderwolf CF. Cholinergic activation of the electrocorticogram: role of the substantia innominata and effects of atropine and quinuclidinyl benzilate. Brain Res 322: 219–232, 1984 [DOI] [PubMed] [Google Scholar]
- Umbriaco D, Watkins KC, Descarries L, Cozzari C, Hartman BK. Ultrastructural and morphometric features of the acetylcholine innervation in adult rat parietal cortex: an electron microscopic study in serial sections. J Comp Neurol 348: 351–373, 1994 [DOI] [PubMed] [Google Scholar]
- Wainer BH, Mesulam MM. Ascending cholinergic pathways in the rat brain. In: Brain Cholinergic Systems, edited by Steriade M, Biesold D. Oxford UK: Oxford University Press, 1990 [Google Scholar]
- Wenk GL, Stoehr JD, Quintana G, Mobley S, Wiley RG. Behavioral, biochemical, histological, and electrophysiological effects of 192 IgG-saporin injections into the basal forebrain of rats. J Neurosci 14: 5986–5995, 1994 [DOI] [PMC free article] [PubMed] [Google Scholar]
- Wikler A. Pharmacologic dissociation of behavior and EEG “sleep patterns” in dogs: morphine, N-allyl normorphine, and atropine. Proc Soc Exp Biol Med 79: 261–265, 1952 [DOI] [PubMed] [Google Scholar]
- Wilson CJ, Kawaguchi Y. The origins of two-state spontaneous membrane potential fluctuations of neostriatal spiny neurons. J Neurosci 16: 2397–2410, 1996 [DOI] [PMC free article] [PubMed] [Google Scholar]
- Winkler J, Suhr ST, Gage FH, Thal LJ, Fisher LJ. Essential role of neocortical acetylcholine in spatial memory. Nature 375: 484–487, 1995 [DOI] [PubMed] [Google Scholar]
- Xiang Z, Huguenard JR, Prince DA. Cholinergic switching within neocortical inhibitory networks. Science 281: 985–988, 1998 [DOI] [PubMed] [Google Scholar]
- Yamamoto K, Domino EF. Nicotine-induced EEG and behavioral arousal. Int J Neuropharmacol 4: 359–373, 1965 [DOI] [PubMed] [Google Scholar]
- Yardeni T, Eckhaus M, Morris HD, Huizing M, Hoogstraten-Miller S. Retro-orbital injections in mice. Lab Anim (NY) 40: 155–160, 2011 [DOI] [PMC free article] [PubMed] [Google Scholar]
- Zaborszky L, Duque A. Local synaptic connections of basal forebrain neurons. Behav Brain Res 115: 143–158, 2000 [DOI] [PubMed] [Google Scholar]
- Zhang YP, Oertner TG. Optical induction of synaptic plasticity using a light-sensitive channel. Nat Methods 4: 139–141, 2007 [DOI] [PubMed] [Google Scholar]
- Zolles G, Wagner E, Lampert A, Sutor B. Functional expression of nicotinic acetylcholine receptors in rat neocortical layer 5 pyramidal cells. Cereb Cortex 19: 1079–1091, 2009 [DOI] [PubMed] [Google Scholar]