

Abstract
The preoptic hypothalamus is implicated in sleep regulation. Neurons in the median preoptic nucleus (MnPO) and the ventrolateral preoptic area (VLPO) have been identified as potential sleep regulatory elements. However, the extent to which MnPO and VLPO neurons are activated in response to changing homeostatic sleep regulatory demands is unresolved. To address this question, we continuously recorded the extracellular activity of neurons in the rat MnPO, VLPO and dorsal lateral preoptic area (LPO) during baseline sleep and waking, during 2 h of sleep deprivation (SD) and during 2 h of recovery sleep (RS). Sleep-active neurons in the MnPO (n = 11) and VLPO (n = 13) were activated in response to SD, such that waking discharge rates increased by 95.8 ± 29.5% and 59.4 ± 17.3%, respectively, above waking baseline values. During RS, non-rapid eye movement (REM) sleep discharge rates of MnPO neurons initially increased to 65.6 ± 15.2% above baseline values, then declined to baseline levels in association with decreases in EEG delta power. Increase in non-REM sleep discharge rates in VLPO neurons during RS averaged 40.5 ± 7.6% above baseline. REM-active neurons (n = 16) in the LPO also exhibited increased waking discharge during SD and an increase in non-REM discharge during RS. Infusion of A2A adenosine receptor antagonist into the VLPO attenuated SD-induced increases in neuronal discharge. Populations of LPO wake/REM-active and state-indifferent neurons and dorsal LPO sleep-active neurons were unresponsive to SD. These findings support the hypothesis that sleep-active neurons in the MnPO and VLPO, and REM-active neurons in the LPO, are components of neuronal circuits that mediate homeostatic responses to sustained wakefulness.
Keywords: adenosine, median preoptic nucleus, REM sleep, sleep homeostasis, ventrolateral preoptic area
sleep homeostasis refers to compensatory increases in sleep amount, sleep consolidation and/or sleep depth that occur in response to sleep deprivation (SD) (Borbely and Acherman 1999). Brain mechanisms that regulate homeostatic responses to SD are not fully understood, but a role for endogenous sleep factors in sleep homeostasis is widely accepted (Obal and Krueger 2003). Increased production of adenosine (AD), interleukin-1β, tumor necrosis factor-α, nitric oxide and prostaglandin D2 have all been implicated in increased sleep and increased electroencephalogram (EEG) slow-wave activity (SWA) (0.3–4 Hz) during sleep following SD (Basheer et al. 2004; Matsumura et al. 1994; Obal and Krueger 2003, 2004; Porkka-Heiskanen et al. 1997). However, there is no consensus where sleep factors act in the brain, or how sleep-promoting and wake-promoting neuronal circuits respond to SD.
Neurons in the preoptic hypothalamus are important regulators of sleep onset and sleep maintenance (see Szymusiak et al. 2007 for review). Lesions of the preoptic hypothalamus cause chronic sleep loss, and local administration of endogenous somnogens into this brain region can promote sleep (John and Kumar 1998; Lu et al. 2000; Matsumura et al. 1994; McGinty and Sterman 1968; Ticho et al. 1991; Ueno et al. 1982). Within the preoptic area, the ventrolateral preoptic area (VLPO) and the median preoptic nucleus (MnPO) contain high densities of neurons that are activated during sleep, as identified by single-unit recordings and by sleep-related expression of c-fos (Gong et al. 2000; Sherin et al. 1996; Suntsova et al. 2002; Szymusiak et al. 1998). Sleep-related c-Fos protein immunoreactivity (IR) in these nuclei occurs in GABAergic neurons, and descending projections from the VLPO and MnPO to several nuclei implicated in generalized brain arousal have been demonstrated (Gong et al. 2004; Sherin et al. 1998; Steininger et al. 2001; Uschakov et al. 2007). Activation of VLPO and MnPO neurons is hypothesized to promote sleep through GABA-mediated inhibition of monoaminergic, hypocretinergic and cholinergic neurons located in the posterior hypothalamus and brainstem (Saper et al. 2001; Szymusiak et al. 2007). VLPO GABAergic neurons also contain the inhibitory neuropeptide galanin (Sherin et al. 1998).
The role of preoptic neurons in homeostatic responses to sleep loss is unresolved. Studies of c-Fos-IR in rats following SD indicate that VLPO neurons are not activated in response to SD unless animals are permitted recovery sleep (RS) (Gvilia et al. 2006b; Sherin et al. 1996). Elevated Fos+ cell counts have been reported in MnPO neurons in rats that were killed prior to opportunity for RS, suggesting that neurons in this nucleus are responsive to increasing homeostatic pressure for sleep during waking (Gvilia et al. 2006b). Due to the time required for gene expression and synthesis of c-Fos protein and the time required to degrade synthesized protein, studies of c-Fos IR provide poor temporal resolution of neuronal activity with respect to dynamic changes in homeostatic sleep pressure. Previous electrophysiological studies of preoptic neurons have focused on activity during spontaneous sleep and wakefulness (Alam et al. 1995; Suntsova et al. 2002; Szymusiak et al. 1998; Takahashi et al. 2009). To more precisely characterize the relationship of preoptic neuronal activity to dynamic changes in homeostatic sleep pressure, we have recorded the discharge of individual MnPO and lateral preoptic area (LPO) neurons across conditions of baseline sleep and waking, SD and RS.
MATERIALS AND METHODS
Subjects
Experiments were conducted on Sprague-Dawley male rats (300–350 g) that were maintained at 12:12-h light-dark cycle (light-on at 8:30 AM) and with food and water available ad libitum. The experiments were conducted in accordance with the National Research Council Guide for the Care and Use of Laboratory Animals, and all experimental protocols were reviewed and approved by the Institutional Animal Care and Use Committee of the V.A. Greater Los Angeles Healthcare system.
Surgical Procedures
Under surgical anesthesia (ketamine, 80 mg/kg plus xylazine, 10 mg/kg ip) and aseptic conditions, rats were surgically prepared for chronic recordings of extracellular neuronal activity from MnPO or LPO and for assessment of sleep-wake state. Four screw electrodes were implanted over the frontal and parietal cortex to record the EEG. Two Teflon-coated stainless wires were implanted into the dorsal neck muscles to record the electromyogram (EMG). For the recording of extracellular unit activity, a single 23-gauge stainless-steel guide cannula attached to a mechanical microdrive was implanted stereotaxically such that its tip was positioned dorsal to the MnPO (anteroposterior = −0.26, lateral = 0.00, horizontal = −4.00) or LPO (anteroposterior = −0.40, lateral = 1.20, horizontal = −4.50) region (Paxinos and Watson 1998). In a subset of animals used for pharmacological study, a microdrive-microdialysis guide cannula assembly, consisting of a single barrel mechanical microdrive and an adjacent guide cannula for microdialysis probe insertion, was implanted such that their tips rested 3 mm above the dorsal aspect of the VLPO. Four pairs of microwires, each consisting of two 20-μm insulated stainless steel wires glued together except for 2.0 mm at the tip and sharply cut at an angle, were passed through the microdrive barrel such that their tips protruded 3 mm beyond the tip of the guide cannula and into the MnPO or LPO. EEG and EMG electrodes and microwires were soldered to miniature plugs, and the entire assembly was anchored to the skull with dental acrylic.
Data Acquisition
Experiments were carried out after allowing at least 10 days for recovery from surgery. During recovery, rats were placed in a cylindrical Plexiglas cage (Raturn System) that was housed in a sound attenuated and electrically shielded chamber. During the final 2–3 days of the recovery period, rats were also acclimatized to the recording procedure by connecting them with recording cables for 2–3 h daily. In recording chambers rats were maintained at the same 12:12-h light-dark cycle (illumination intensity about 100 lux) and had ad libitum access to food and water.
All electrophysiological recordings were performed on unanesthetized, unrestrained rats during early light phase of a 12:12-h light-dark cycle. EEG and EMG activity were recorded using a Grass Model 78 polygraph. Neuronal activity was recorded using bipolar derivations from microwires that were amplified by a differential AC amplifier (model 1700, A-M System) with low and high cutoff filters of 10 Hz and 10 kHz, respectively. Signals were continuously monitored on a digital storage oscilloscope (Hitachi, VC-6024). These signals were also digitized and stored on disk for subsequent offline analysis using a Power1401 data acquisition interface and Spike-2 Software (Cambridge Electronic Design, Cambridge, UK). During recording sessions, the microwires were advanced in 20- to 30-m steps until isolated single units with signal/noise ratio ≥2 were located.
Experimental Procedures
Total sleep-deprivation studies.
First, after isolating individual cells, their baseline discharge activity was recorded across at least three sleep-wake cycles, i.e., during waking, non-rapid eye movement (NREM), and rapid eye movement (REM) sleep. Selected neurons with stable discharge patterns were then recorded continuously during 2 h of SD followed by 2 h of recovery period. During SD, rats were closely monitored both behaviorally as well as with reference to EEG changes. Each time, the animal exhibited EEG synchronization for 5–10 s, it was gently awakened by taping on the cage or slightly turning the cage. Each attempt to prevent the animal from entering into sleep was recorded as an event. After SD, recording continued during a 2-h opportunity for uninterrupted RS.
Selective REM-SD.
In another set of experiments, following the recording of the baseline discharge activity across two to three sleep-wake cycles, rats were subjected to 2 h of selective REM SD (REM-SD) (Gvilia et al. 2006a). During REM-SD, rats were closely monitored for electrophysiological and behavioral signs of REM sleep. Each time, the animal exhibited electrophysiological signs of REM sleep, i.e., EEG desynchronization and lower EMG tone after NREM sleep, for 10 s it was gently awakened by slightly touching the recording cable or turning the cage. Each attempt to prevent the animal from entering into REM sleep was recorded as an event. After REM-SD, rats were left undisturbed for 2 h of RS.
Microdialysis perfusion.
In the third set of experiments, we determined the effects of an AD A2A receptor (A2AR) antagonist, ZM-241385, on the discharge activity of the VLPO neurons across spontaneous sleep-wake cycle as well as during total SD. In this case, at least 24 h before the experiment, the stylet of the microdialysis guide cannula was replaced by a microdialysis probe (semipermeable membrane tip length, 1 mm; outer diameter, 0.22 mm; molecular cut-off size, 50 kDa; Eicom), fixed with dental acrylic and flushed with artificial cerebrospinal fluid (aCSF; composition in mM, 145 NaCl, 2.7 KCl, 1.3 MgSO4, 1.2 CaCl2, and 2 Na2HPO4; pH 7.2) at a flow rate of 2 μl/min. The time taken by the vehicle solution to travel from the reservoir to the tips of the probes was precisely calculated. The ZM-241385 was dissolved in 4% DMSO and, therefore, aCSF containing 4% DMSO was used as control. Approximately 16 h prior to unit recording experiments, the dialysis probe was inserted into the guide cannula, fixed in place and perfused with aCSF (Alam et al. 1999).
In one set of experiments, the discharge rate of isolated VLPO neurons was recorded through two to three stable sleep-wake cycle with aCSF + DMSO perfusion as a baseline. After baseline recording, 50 μM of ZM-241385 were microdialyzed adjacent to the recorded neurons for 10 min so that the transient effects of this drug on the discharge activity of neuron(s) could be studied without triggering a strong behavioral response. After delivery of the drug, the perfusion medium was switched back to aCSF + DMSO, and the recording continued for another 45–90 min as washout or recovery. During the entire recording session, the animal was undisturbed, except, if necessary, a stable episode of waking was achieved by lightly tapping or slightly moving the cage. In another set of experiments, the discharge of VLPO sleep-active neurons was recorded during baseline, and 2 h of SD followed by RS. ZM-241385 was microdialyzed adjacent to the recorded cells for 10 min at the end of SD to determine the effects of A2AR blockade on the SD-induced changes on VLPO neuronal activity.
Histology
At the end of all recording sessions, rats were deeply anesthetized with pentobarbital (100 mg/kg ip), and microlesions were made at the tip of two or three microwires by passing DC current (20 μA, 15–20 s). The microwires that yielded the highest number of cells were selected for microlesion and for tracking of anatomical localization of the recorded neurons. The animals were then injected with heparin (500 units, ip) and perfused through the heart with phosphate-buffered saline (PBS; pH 7.4) followed by fixative containing 4% paraformaldehyde in PBS. The brains were removed, postfixed for 24 h at 4°C in the same fixative, and then placed in PBS containing 30% sucrose for 48 h at 4°C. Forty-micrometer-thick coronal sections were cut serially on a freezing microtome and stained for Nissl (Cresyl violet). Reconstructions of microwire tracts were made with the aid of a Neurolucida imaging system (Microbrighthfield, Colchester, VT) guided by a rat brain atlas (Paxinos and Watson 1998).
Data Analyses
States of waking, NREM sleep and REM sleep were identified on the basis of EEG and EMG patterns using standard criteria. The mean discharge rate of neurons in waking, NREM, and REM sleep was calculated from at least three episodes of each state ranging in duration of 30–300 s. To determine the sleep-wake discharge profiles of the recorded neurons, a minimum of 25% change in discharge rate criterion was used. Neurons were classified as “wake-active” if their NREM/wake discharge rate ratios were <0.75; “sleep-active” if NREM/wake discharge ratio was >1.25. Neurons were classified as REM-active if REM/wake and REM/NREM ratios were >2.0. Neurons exhibiting <25% change in discharge rate across sleep-waking states were classified as state-indifferent.
The 2-h SD and RS periods were divided into 30-min quartiles. Sleep-wake discharge rates were calculated during each quartile to determine the effects of the duration of SD and RS on the discharge rate of various neuronal groups within MnPO and VLPO. Waking discharge rates during SD were calculated during 30- to 60-s periods of wakefulness accompanied by a fully desynchronized EEG and elevated EMG activity, comparable to baseline periods of waking. Episodes of transient EEG synchrony associated with sleep onset attempts were excluded from determinations of waking discharge rate. During SD, discharge rates during waking were expressed as %change from baseline waking rates (see Figs. 3, 4, and 9). During RS, discharge rates during NREM and REM sleep were expressed as %change from baseline rates during those states. The number of attempts to initiate sleep, as evidenced by EEG and behavioral criteria described above, was counted for each 30-min period during SD as a measure of increasing homeostatic sleep drive (see Figs. 3 and 4).
Fig. 3.

Summary of the effects of SD and RS on the discharge of MnPO sleep-active neurons (n = 11). A: mean waking DR, expressed as %change (Δ) from baseline waking values, across 30-min quartiles of the 2-h SD period. There was a significant overall effect of duration of SD on waking DR [F(10,3) = 12.3, P < 0.001]. B: there was also a significant effect of duration of SD on the number of sleep attempts [F(10,3) = 114.0, P < 0.001]. For A and B, **significantly different from all other values, Holm-Sidak test. C: mean DR during recovery NREM sleep, expressed as %change from baseline NREM sleep values. There was a significant overall effect of duration of RS on NREM sleep DR [F(10,3)=10.9, P < 0.001]. D: there was a significant effect of duration of RS on EEG slow-wave activity (SWA) in NREM sleep, expressed as a percentage of baseline NEM sleep values [F(10,3) = 35.6, P < 0.001]. For C and D, **significantly different from all other values; *significantly different from values at 61–90 and 91–120 min; #significantly different from value at 91–120 min, Holm-Sidak test.
Fig. 4.

Summary of the effects of SD and RS on the discharge of VLPO sleep-active neurons (n = 13) and DLPO sleep-active neurons (n = 9). A: mean waking DR, expressed as %change from baseline waking values, across 30-min quartiles of the 2-h SD period. There was a significant overall effect of duration of SD on waking DR for VLPO sleep-active neurons [F(12,3) = 13.3, P < 0.001]. There was no significant effect of duration of SD on waking DR for DLPO neurons [F(8,3) = 0.6, nonsignificant (ns)]. B: there was a significant and comparable effect of duration of SD on the number of sleep attempts for experiments involving both VLPO neurons [F(12,3) = 150.3, P < 0.001] and DLPO neurons [F(8,3) = 130.9, P < 0.001]. For A and B, **significantly different from all other values, P < 0.01; *significantly different from values at 1–30 min, Holm-Sidak test. C: mean DR during recovery NREM sleep, expressed as %change from baseline NREM sleep values, for VLPO and DLPO sleep-active neurons. There was a significant overall effect of duration of RS on NREM sleep DR for VLPO sleep-active neurons [F(12,3) = 4.6, P < 0.05], but not for DLPO sleep-active neurons [F(8,3) = 0.6, ns]. D: there was a significant effect of duration of RS on EEG SWA in NREM sleep, expressed as a percentage of baseline NREM sleep values, for experiments involving both VLPO neurons [F(10,3) = 12.7, P < 0.001] and DLPO neurons [F(8,3) = 7.4, P < 0.01]. For C and D, #significantly different from values at 61–90 min and 91–120 min; *significantly different from values at 91–120 min, Holm-Sidak test.
Fig. 9.

Summary of the effects of SD and selective REM-SD on the discharge of REM-active neurons in the LPO. A: there was a significant overall effect of the duration of SD on the waking discharge of REM-active neurons [F(15,3) = 9.4, P < 0.001]. B: there was also a significant overall effect of the duration of RS after SD on NREM sleep discharge of REM-active cells [F(15,3) = 6.6, P < 0.001]. C: in contrast to SD, there was no significant effect of duration of selective REM-SD on the waking discharge of a separate group of 10 REM-active neurons [F(9,3) = 1.9, ns]. D: there was also no significant effect of the duration of RS that followed 2 h of REM-SD on the NREM sleep discharge of REM-active neurons [F(9,3) = 2.7, ns]. *Significantly different from values at 1–30 min; #significantly different from values at 31–60 min, Holm-Sidak test. **Significantly different from all other values.
During RS, declining EEG SWA in NREM sleep was used as an indicator of diminishing homeostatic sleep pressure (see Figs. 3 and 4). Digitized EEG signals were subjected to a fast Fourier transform algorithm, after which a power spectrum was computed for the delta frequency range of 0.75–4.0 Hz (CED1401, Spike 2 software). This was done for consecutive 10-s epoch of scored NREM sleep during the first two consolidated episodes of NREM sleep (≥2 min in duration) occurring in each 30-min quartile of the RS period. NREM sleep EEG SWA was expressed as a percentage of values calculated during two to four consolidated NREM sleep episodes occurring during the baseline recording period prior to the initiation of SD.
Changes in waking-related neuronal activity across the SD period and in NREM sleep- and REM sleep-related neuronal activity during RS period were assessed with one-way repeated-measures ANOVA, followed by Holm-Sidak test for multiple comparisons (SigmaPlot 11.0). For microdialysis drug delivery experiments, comparisons of waking and NREM sleep discharge rates during baseline perfusion of aCSF and rates following perfusion of ZM-241385 were by paired t-test (see Fig. 6).
Fig. 6.

Effects of perfusion of A2A receptor antagonist, ZM-241385, on the state-dependent discharge of VLPO sleep-active neurons. A: DR of 6 VLPO sleep-active neurons were quantified during baseline perfusion of aCSF and following a 10- to 15-min perfusion of ZM-241385 (50 μM in aCSF). For 4 cells, drug perfusion was initiated after 90–100 min of SD, and for 2 other cells drug was perfused during spontaneous sleep-wake occurring between ZT2 and ZT4. There was a significant decrease in waking DR (paired t-test, t = 2.58, df = 5, *P < 0.05) and NREM sleep DR (t = 3.46, df = 5, *P < 0.05) following ZM-241385 perfusion compared with baseline. B: perfusion of ZM-241385 had no effect on waking and NREM sleep DR in a group of 5 wake-active neurons recorded in the VLPO region.
RESULTS
Summary of Recorded Neurons
A total of 25 neurons in the MnPO and 128 neurons in the dorsal to ventral extent of the LPO were recorded across 8 animals. Table 1 summarizes the number and types of cells recorded in each brain region and the mean discharge rates of each cell type during waking, NREM and REM sleep.
Table 1.
State-dependent discharge rates of sleep-active, wake/REM-active, and state-indifferent neurons during spontaneous waking and sleep
| n | Wake | Non-REM Sleep | REM Sleep | |
|---|---|---|---|---|
| Median preoptic nucleus | ||||
| Wake/REM-active | 5 | 5.7 ± 2.5 (3.3–12.5) | 3.9 ± 2.2 (2.3–8.9) | 4.8 ± 3.9 (3.3–12.4) |
| Sleep-active | 13 | 1.5 ± 0.4 (0.6–3.2) | 3.8 ± 0.6 (1.2–7.4) | 3.7 ± 0.4 (0.8–6.1) |
| State-indifferent | 7 | 4.1 ± 1.4 (1.5–16.1) | 3.8 ± 1.2 (1.2–14.4) | 4.2 ± 1.4 (1.2–24.4) |
| Lateral Preoptic Area | ||||
| Wake/REM active | 48 | 7.9 ± 0.8 (1.3–26.2) | 3.2 ± 0.4 (0.2–17.9) | 8.2 ± 1.0 (1.0–42.8) |
| Sleep-active | 26 | 5.1 ± 2.1 (0.3–12.3) | 8.2 ± 1.3 (1.5–27.9) | 8.8 ± 1.8 (1.4–32.0) |
| REM-active | 29 | 4.9 ± 1.1 (0.3–22.8) | 3.7 ± 1.0 (0.2–12.3) | 13.1 ± 2.2 (1.0–48.3) |
| State-indifferent | 25 | 20.8 ± 5.9 (1.2–47.9) | 19.3 ± 5.4 (1.2–43.8) | 19.9 ± 6.2 (1.3–44.1) |
Values are mean discharge rate (spikes/s) ± SE (range in parentheses); n, no. of rats.
REM, rapid eye movement.
A total of 91 cells were successfully recorded during baseline sleep and waking, during 2 h of SD and during 2 h of RS. Results of these recordings for each of the major functional cell types (sleep-active, REM-active, wake/REM-active and state-indifferent) are summarized in the following sections.
Sleep-Active Neurons
Sleep-active neurons in the MnPO.
The activity of sleep-active neurons localized to the MnPO (n = 11) were quantified during baseline, SD and RS. The spontaneous sleep-wake discharge and locations of these neurons are shown in Fig. 1. An example of continuous recording of an MnPO sleep-active neuron across the three conditions is shown in Fig. 2. During the baseline period, the cell exhibited elevated discharge rates during NREM and REM sleep compared with waking (Fig. 2B). At the start of SD, only infrequent interventions were required to keep the animal awake (Fig. 2A, top trace), and discharge rate of the cell was uniformly low at <1 spikes/s (Fig. 2C). As homeostatic sleep pressure increased with continuing SD, as evidenced by the increasing number of interventions required to maintain wakefulness (Fig. 2A), the discharge rate of the cell increased. By the end of 2 h of SD, the waking discharge rates was approximately double that during baseline sleep (Fig. 2, B and D). Discharge of the cell remained elevated compared with baseline during early RS (Fig. 2, B and E), but returned to baseline levels after 2 h of unrestricted sleep (Fig. 2A).
Fig. 1.

Sleep-active neurons in the median preoptic nucleus (MnPO) and lateral preoptic area (LPO). A: mean baseline sleep-wake discharge rates (DR) for groups of sleep-active neurons in the MnPO, ventrolateral preoptic area (VLPO) and dorsal lateral preoptic area (DLPO) that were studied under conditions of sleep deprivation (SD) and recovery sleep (RS). *Significantly different from wake values. B: coronal sections at the level of the rostral preoptic hypothalamus containing marking lesion (arrow) indicating the end of a microwire track targeting the MnPO. C: reconstruction of locations of sleep-active neurons in the MnPO. D: coronal section at the level of the preoptic hypothalamus, showing the course of a dorsal to ventral microwire bundle pass through the LPO. E: reconstruction of the locations of sleep-active neurons recorded in the VLPO (black circles) and DLPO (open circles). 3V, third ventricle; ac, anterior commissure; BSTMV, bed nucleus of the stria terminalis, medial ventral; HDB, horizontal limb of the diagonal band of Broca; MPA, medial preoptic area; ox, optic chiasm; PS, parastrial nucleus; REM, rapid eye movement.
Fig. 2.
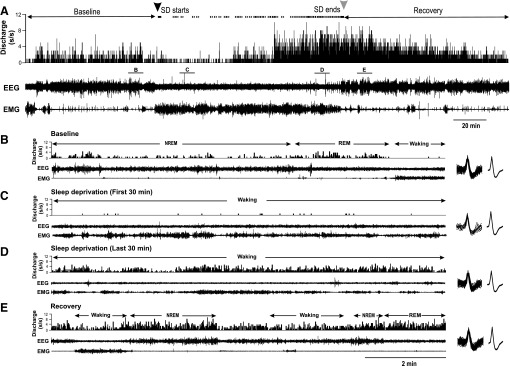
Responses of an MnPO sleep-active neuron to SD. A: from top to bottom, DR histogram (spikes/s), cortical EEG and neck muscle EMG recordings during baseline, SD and RS. Black and gray arrowheads at the top indicate start and end of SD, respectively. The dots between the arrows indicate times when the animal attempted to initiate sleep and the experimenter had to intervene to maintain wakefulness. Note how the frequency of sleep attempts increases with increasing duration of SD. See text for further explanation. B–E: expansion of areas labeled in A, showing 10 min of recording during baseline (B), the first 30 min of SD (C), the last 30 min of SD (D) and early RS (E). The waveforms at the right of B–E are superimposed, and averaged action potentials recorded the 10 min shown in each figure, demonstrating stability of unit recording across all three experimental conditions. NREM, non-REM.
Figure 3 summarizes findings from all MnPO sleep-active neurons studied in the same manner as in Fig. 2. Mean discharge rates, calculated during 30-min quartiles of the SD period, expressed as %change from baseline waking discharge rates, are plotted in Fig. 3A. Discharge rates increased with increasing duration of SD and were significantly elevated during the last 2 quartiles of the SD period, compared with earlier time points (Fig. 3A). There was also a progressive increase in the number of attempts to initiate sleep with increasing duration of SD (Fig. 3B).
Mean NREM sleep discharge rates were elevated during the first 30–60 min of RS and returned to baseline levels after 2 h (Fig. 3C). EEG SWA in NREM sleep showed a similar pattern (Fig. 3D).
Mean discharge rates of MnPO sleep-active neurons during REM sleep did not change significantly across the conditions of baseline (3.3 ± 0.5 s/s), early RS (3.6 ± 0.6 s/s) and late RS [3.17 ± 0.5 s/s; F(10,2)=2.69, nonsignificant (ns)].
Sleep-active neurons in the LPO.
The discharge rates of 13 sleep-active neurons localized to the VLPO and of 9 sleep-active neurons localized to the dorsal LPO (Fig. 1) were quantified during baseline, SD and RS. The effects of SD on VLPO sleep-active neurons are summarized in Fig. 4. Similar to MnPO neurons, waking discharge rates increased with increasing duration of SD (Fig. 4A) in association with increases in the number of attempts to initiate sleep (Fig. 4B).
During RS, VLPO sleep-active neuronal discharge during NREM sleep was initially elevated compared with baseline NREM sleep discharge rates and gradually returned to baseline levels after 2 h (Fig. 4C), in association with the decline in NREM sleep SWA (Fig. 4D). This decline in NREM sleep discharge rates during RS was not as rapid as that observed for MnPO sleep-active neurons, as discharge rates during the first quartile of the RS period did not differ significantly from values recorded during the second and third quartiles (Fig. 4C). Similar to MnPO sleep-active neurons, mean discharge rates of VLPO sleep-active neurons during REM sleep did not change significantly across the conditions of baseline early RS and late RS (Table 2).
Table 2.
Discharge rates of lateral preoptic area neurons during baseline, sleep deprivation, and recovery sleep
| Baseline | SD 0–30 min | SD 91–120 min | RS 0–30 min | RS 91–120 min | F-ratio | |
|---|---|---|---|---|---|---|
| Wake/REM-active (n = 28) | ||||||
| Waking | 6.4 ± 0.7 | 5.4 ± 0.8 | 6.1 ± 0.9 | F(27,2) = 1.70, ns | ||
| Non-REM | 2.7 ± 0.4 | 2.8 ± 0.6 | 2.2 ± 0.5 | F(27,2) = 2.02, ns | ||
| REM | 6.5 ± 0.9 | 7.0 ± 1.1 | 6.3 ± 1.0 | F(27,2) = 0.64, ns | ||
| State-indifferent (n = 14) | ||||||
| Waking | 12.3 ± 4.3 | 12.1 ± 4.2 | 10.3 ± 3.7 | F(13,2) = 0.54, ns | ||
| Non-REM | 11.7 ± 4.2 | 11.0 ± 3.7 | 9.7 ± 3.4 | F(13,2) = 1.49, ns | ||
| REM | 13.8 ± 5.3 | 13.3 ± 4.6 | 11.7 ± 4.8 | F(13,2) = 2.27, ns | ||
| VLPO sleep-active (n = 13) | ||||||
| Waking | 4.5 ± 1.1 | 5.4 ± 1.3 | 7.2 ± 2.1 | F(12,2) = 5.64, P < 0.01 | ||
| Non-REM | 8.8 ± 2.0 | 12.2 ± 2.2 | 10.1 ± 1.6 | F(12,2) = 5.06, P < 0.05 | ||
| REM | 9.7 ± 2.5 | 10.1 ± 2.0 | 9.2 ± 1.8 | F(12,2) = 0.26, ns | ||
| DLPO sleep-active (n = 9) | ||||||
| Waking | 5.1 ± 0.9 | 5.1 ± 1.0 | 5.6 ± 1.4 | F(8,2) = 0.49, ns | ||
| Non-REM | 8.6 ± 1.7 | 6.9 ± 2.0 | 6.6 ± 1.9 | F(8,2) = 1.60, ns | ||
| REM | 9.3 ± 2.8 | 8.3 ± 2.0 | 6.7 ± 2.1 | F(8,2) = 2.00, ns | ||
| REM-active (n = 16) | ||||||
| Waking | 5.6 ± 1.5 | 6.3 ± 1.6 | 8.5 ± 2.3 | F(15,2) = 9.05, P < 0.01 | ||
| Non-REM | 4.8 ± 1.4 | 7.8 ± 2.0 | 5.6 ± 1.6 | F(15,2) = 8.89, P < 0.01 | ||
| REM | 14.9 ± 2.8 | 15.4 ± 2.8 | 15.1 ± 2.8 | F(15,2) = 0.92, ns |
Values are mean discharge rate (spikes/s) ± SE; n, no. of rats. Anatomical locations of wake/REM active, state-indifferent, and REM sleep-active neurons are shown in Fig. 7B. Locations of ventrolateral preoptic area (VLPO) sleep-active and dorsal lateral preoptic area (DLPO) sleep-active neurons are shown in Fig. 1E.
SD, sleep deprivation; RS, recovery sleep; ns, nonsignificant.
Baseline sleep-wake discharge profiles of the nine sleep-active neurons localized to the dorsal LPO were similar to those of VLPO sleep-active neurons (Fig. 1). However, sleep-active neurons in the LPO neurons did not exhibit significant changes in waking discharge rates during 2 h of SD (Fig. 4A), in spite of significant increases in the number of attempts to initiate sleep across the SD period (Fig. 4B). Changes in EEG SWA across the RS period for the experiments involving the nine dorsal LPO neuronal recordings were similar to that observed during recordings of VLPO neuronal activity (Fig. 4D). However, in contrast to VLPO neurons, there was no significant effect of RS on NREM discharge rates of dorsal LPO sleep-active neurons (Fig. 5C and Table 2).
Fig. 5.
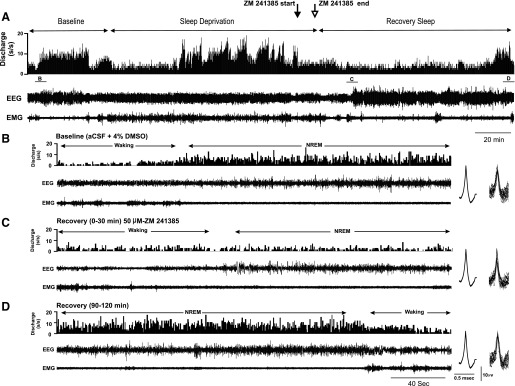
Effects of local perfusion of A2A receptor antagonist, ZM-241385, on discharge of a VLPO sleep-active neuron during SD and RS. A: from top to bottom, DR histogram (spikes/s), cortical EEG and neck muscle EMG recordings during 40-min baseline waking and sleep, during 120 min of SD and 120 min of RS. Just prior to the end of the SD period, perfusion was switched from vehicle [artificial cerebrospinal fluid (aCSF) + 4% DMSO] to 50 μM ZM-241385 for 10 min (arrows), then back to vehicle for the remainder of the recording. B: in the baseline condition, discharge of the cell was strongly sleep-related. A: the cell increased waking discharge, compared with baseline waking, during the second hour of SD. Perfusion of ZM-241385 evoked suppression of waking discharge during the final 10 min of SD. C and B: the cell exhibited marked suppression of NREM sleep discharge during initial RS following ZM-24185 administration, compared with baseline NREM discharge. D: discharge suppression persisted throughout RS, eventually returning to baseline levels during the final 30 min of the RS period. To demonstrate stability of unit recording before and after drug perfusion, figures at right of B–D are averaged action potentials and the superimposed action potentials on which the average waveforms were calculated.
Effects of AD A2AR antagonist on VLPO sleep-active neuronal discharge.
AD is implicated as an endogenous regulator of homeostatic sleep drive. The hypothalamus and adjacent basal forebrain (BF) are sites of action of the sleep regulatory effects of AD (Basheer et al. 2004; Methippara et al. 2005; Porkka-Heiskanen et al. 2003). Extracellular levels of AD in the magnocellular BF, immediately adjacent to the LPO, increase during SD and decline during subsequent RS (Porkka-Heiskanen et al. 2000). Sleep induced by central administration of A2AR agonists is associated with increased c-Fos expression in VLPO and MnPO GABAergic neurons (Kumar et al. 2013; Scammell et al. 2001). Central administration of ZM-241385, an AD A2AR antagonist, suppresses SD-induced expression of c-Fos in MnPO and VLPO neurons (Kumar et al. 2013). Therefore, we examined whether A2AR-mediated adenosinergic signaling contributes to the activation of sleep-active neurons in the VLPO during SD.
Figure 5 shows an example of the effects of ZM-241385 on neuronal discharge during SD and RS in a VLPO sleep-active neuron. As was typical for VLPO sleep-active neurons (Fig. 4A), this neuron exhibited increased waking discharge during the second hour of SD, compared with baseline waking activity. ZM-241385 was delivered for a 10-min period just prior to the end of SD (indicated by solid and open arrows at top of Fig. 5) via a microdialysis probe located adjacent to unit recording electrodes. ZM-241385 perfusion evoked a short latency suppression of waking discharge during SD and also suppressed the expected increase in NREM sleep-related discharge of the cell during early RS (Fig. 5C). There was eventual recovery of NREM sleep discharge rates after ∼75 min following the end of drug perfusion (Fig. 5D). Effects of ZM-241385 perfusion during SD and RS were examined in four sleep-active neurons, and the effects of drug perfusion on spontaneous sleep-waking discharge rates were examined in two additional sleep-active neurons. There was a significant decrease in both waking and NREM sleep discharge rates of these six cells following ZM-241385 perfusion compared with vehicle perfusion (Fig. 6A). In contrast, ZM-241385 perfusion had no effect on state-dependent discharge in a group of neurons with wake-related discharge (Fig. 6B).
REM Sleep-Active Neurons
Effects of total SD on discharge of REM sleep-active neurons.
A total of 16 neurons with REM sleep-active discharge were recorded during baseline, SD and RS. Mean spontaneous sleep-wake discharge rates and locations of these neurons are shown in Fig. 7, A and B, respectively. A representative example of continuous recording of a REM-active neuron during baseline, SD and RS is shown in Fig. 8. Similar to what was observed in MnPO and VLPO sleep-active neurons, waking discharge of this REM-active neuron increased across the 2-h SD period (Fig. 8, A and B). There was a transient increase in NREM discharge rates in this cell early in the RS period, compared with baseline (Fig. 8C). Discharge rates during REM sleep were similar in the baseline and RS conditions (Fig. 8, A and D). Figure 9, A and B, summarizes the effects of SD on waking and NREM sleep discharge in 16 REM-active neurons. Waking discharge rates, expressed as %change from baseline, were significantly elevated in the late vs. early stages of SD (Fig. 9A). NREM sleep discharge rates were maximal during the first 30 min of RS, but returned to baseline levels as RS progressed (Fig. 9B). There were no changes in mean discharge rates during REM sleep across the conditions of baseline sleep-wake the first 30 min of RS and the final 30 min of RS for these 16 REM-active cells (Table 2).
Fig. 7.

REM sleep-active, wake/REM-active and state-indifferent neurons in the LPO. A: mean baseline sleep-wake DR (±SEM) for the different LPO cell types that were studied under conditions of baseline, SD and RS. There was a significant overall effect of sleep-waking state on the discharge of REM-active neurons [F(15,2) = 39.7, P < 0.001], on the discharge of wake/REM-active neurons [F(27,2) = 14.9, P < 0.001], but not on the discharge of state-indifferent neurons [F(13,2) = 1.0, ns]. Significantly different from all other values, *P < 0.05; **P < 0.01. Holm-Sidak test. B: drawing of a coronal section at the level of the preoptic hypothalamus showing the locations of REM-related neurons (black circles), wake/REM-active neurons (gray circles) and state-indifferent neurons (open circles).
Fig. 8.
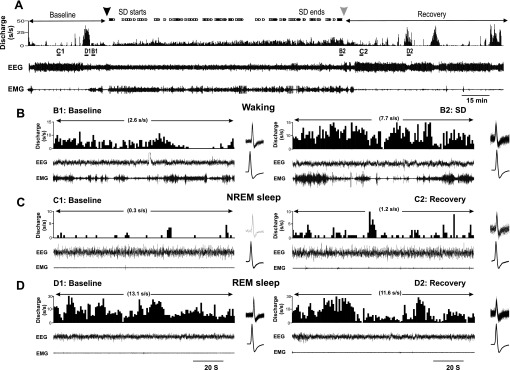
Response of an LPO REM sleep-active neuron to SD. A: continuous recording of EEG and EMG and DR histogram of unit activity during baseline sleep and waking, 2 h of SD and RS. B: Expansion of areas labeled in A, demonstrating increases in waking DR during the final 30 min of SD (B2) compared with baseline waking (B1). Waveforms at the right of each panel are superimposed (top) and mean (bottom) action potentials recorded during the 2 min shown. C: expansion of areas labeled in A demonstrating increases in NREM sleep DR during the first 30 min of RS (C2) compared with baseline NREM sleep (C1). D: DR during recovery REM sleep (D2) were similar to DR during baseline REM sleep (D1).
Effects of REM-SD on discharge of REM sleep-active neurons.
In an attempt to determine if changes in discharge rate of REM-active neurons during total SD were a consequence of increasing homeostatic pressure for REM sleep, we studied an additional 10 REM-active neurons in the LPO during baseline, 2 h of selective REM-SD and subsequent RS. REM-SD was achieved by gently arousing animals at the initial electrographic signs of REM sleep onset, as described previously (Gvilia et al. 2006a). As shown in Fig. 9, C and D, although the general trend of changes in waking discharge rate during 2 h of REM-SD and of changes in NREM sleep discharge rate during 2 h of RS was similar to that observed in REM-active cells as a consequence of total SD, these changes did not reach statistical significance. This argues that REM sleep loss alone cannot account for the changes in neuronal discharge of LPO REM-active neurons that were observed in response to total SD.
Wake/REM-Active Neurons and State-Indifferent Neurons
Discharge of 28 wake/REM-active neurons and 14 state-indifferent neurons were recorded during baseline sleep-wake, SD and RS. The mean discharge rate of these neurons during baseline waking, NREM and REM sleep are shown in Fig. 7A. The reconstructed locations of these neurons in the LPO are shown in Fig. 7B. There were no significant changes in mean waking, NREM and REM sleep discharge rates for wake/REM-active and state-indifferent neurons across the conditions of baseline, SD and RS (Table 2).
DISCUSSION
The preoptic hypothalamus is recognized as a critical sleep regulatory region of the brain. Within the rat preoptic area, the MnPO and VLPO contain sleep-active neuronal populations that are hypothesized to have important sleep regulatory functions. The extent to which MnPO and VLPO neurons are activated in response to expression of sleep as opposed to homeostatically-driven sleep regulatory demands has been controversial. Here we report for the first time that waking discharge of MnPO and VLPO neurons increases during SD in parallel with behavioral indexes of increasing homeostatic sleep pressure. NREM sleep-related discharge of these neurons is elevated during initial RS, in association with elevated EEG SWA, an electrophysiological biomarker of homeostatic sleep pressure. NREM sleep discharge of MnPO neurons rapidly decreases across the RS period, in parallel with the decline in EEG SWA. Elevated NREM discharge rates during RS were more persistent in VLPO neurons. A population of sleep-active neurons located in the dorsal LPO did not demonstrate changes in wake- or sleep-related discharge during SD and RS. Wake/REM-active and state-indifferent neurons in the LPO did not exhibit significant changes in discharge rate in response to SD. These findings demonstrate that the activity of MnPO and VLPO sleep regulatory neurons is reflective of changes in homeostatic sleep pressure in animals subjected to short-term SD early in the light phase.
We also recorded the activity of a population of REM sleep-active neurons located in the LPO. The anatomical distribution of these neurons partially overlap with neurons in the so-called extended VLPO, previously identified by REM sleep-related c-fos expression and excitotoxic lesion-induced REM sleep suppression (Lu et al. 2000, 2002). Here we report the novel finding that discharge of REM-active cells in the LPO is strongly responsive to changes in homeostatic sleep pressure, and that these cells exhibited both increases in waking discharge during SD and an initial increase followed by a decrease in NREM sleep-related discharge during RS (Figs. 8 and 9). To investigate if loss of REM sleep contributed to responses of REM-active cells to total SD, we recorded from a second group of REM-active cells before, during and after 2 h of selective REM-SD. We found no significant effects of REM deprivation on wake- or sleep-related discharge, indicating that loss of REM sleep during total SD did not underlie changes in discharge of REM-active neurons. However, the possibility remains that LPO neurons with REM-related discharge can be activated in response to increasing REM sleep pressure, but that selective REM sleep loss must be extended beyond 2 h.
The neurotransmitter phenotype and anatomical projections of neurons in the dorsal LPO, where REM-active neurons were localized, are not completely known. Neurons that express Fos-IR during REM-enriched sleep, and that are located dorsal to the VLPO core, express galanin and project to the dorsal raphe nucleus (DRN) and the locus coeruleus (LC) (Lu et al. 2002). Neurons throughout the LPO project to the ventrolateral periaqueductal gray (PAG) (Hsieh et al. 2011), an area implicated in REM sleep regulation (Lu et al. 2006; Luppi et al. 2006). If REM-active neurons in the LPO are GABAergic and/or galaninergic, the increase in NREM sleep-related discharge rates in these cells could disinhibit REM-generating neurons in the pontine reticular formation via inhibition of monoaminergic neurons in the DRN and LC and of GABAergic neurons in the PAG (Lu et al. 2006; Luppi et al. 2006; McCarley 2007).
Our findings on the temporal relationships between discharge of MnPO sleep-active neurons and homeostatic sleep pressure (Figs. 2 and 3) are largely consistent with previously published reports. In studies comparing c-Fos expression in glutamic acid decarboxylase (GAD)-positive MnPO neurons following 2 of h spontaneous sleep, 2 h of SD and 2 h of RS, Fos-GAD+ cell counts were highest following SD without opportunity for sleep (Gvilia et al. 2006b). Fos-GAD+ counts were higher in rats killed after 1 h vs. 2 h of RS (Gvilia et al. 2006b), a finding consistent with single-unit activity during RS (Fig. 3). During spontaneous sleep, discharge of MnPO sleep-active neurons is highest around wake-sleep transitions and early in the sleep bout, with decreases in discharge rate occurring across sustained episodes of NREM sleep (Suntsova et al. 2002). This is consistent with the data reported here. The collective evidence indicates that, during the rest phase, discharge of MnPO sleep regulatory neurons accurately reflects dynamic changes in homeostatic sleep pressure during both waking and sleep.
The relationship between the activity of VLPO sleep-regulatory neurons and homeostatic sleep pressure has been less well-understood. Early studies of c-Fos expression indicated that, following 24 h of SD, c-Fos+ cell counts in the VLPO were not elevated unless animals were permitted RS prior to euthanasia (Sherin et al. 1996). In rats subjected to 12–14 h of SD, waking discharge of VLPO neurons remained low, but discharge rates during RS were elevated compared with sleep-related discharge of VLPO neurons recorded in non-sleep-deprived animals (Szymusiak et al. 1998). Comparisons of c-Fos-GAD+ cell counts in the VLPO following 2 h of spontaneous sleep, 2 h of SD and 2 h of RS demonstrated that Fos-GAD+ cell counts were higher in both sleep conditions compared with the condition of SD without opportunity for RS (Gvilia et al. 2006b). Collectively, these findings suggest that activation of VLPO neurons is strongly dependent on the expression of sleep and less reflective of homeostatic sleep pressure during waking.
The findings of the present study suggest that, while activation of VLPO neurons is strongly reflective of sleep expression, a subpopulation of these neurons is also responsive to changing homeostatic sleep pressure during waking, as evidenced by increased waking discharge after 60–120 min of SD (Fig. 4A). The discrepancy with our laboratory's previous studies of c-fos expression in VLPO neurons following short-term SD (Gvilia et al. 2006b) may reflect that Fos studies include the entire VLPO neuronal population which may have heterogeneous responses to SD, while a more homogenous population of VLPO neurons may have been studied here due to microelectrode sampling bias. The negative findings of increased waking-related activity of VLPO neurons after more prolonged periods of SD noted above (Sherin et al. 1996; Szymusiak et al. 1998) may indicate that activation of VLPO neurons during waking may not persist when sleep restriction extends beyond a few hours.
In each of the three groups of neurons that exhibited increases in discharge rate during NREM RS, discharge rates during REM sleep were unchanged compared with baseline values. This suggests that discharge patterns of SD-responsive neurons during REM sleep are more stereotyped and not modulated by factors that cause neuronal activation during sleep-deprived waking and NREM RS. It remains possible that REM sleep discharge rates in SD-responsive preoptic neurons might be altered under conditions of more sustained REM sleep loss.
The MnPO and VLPO are sources of descending GABAergic projections to several wake-promoting regions in the posterior hypothalamus and brain stem. These include the tuberomammillary nucleus, DRN and the LC (Sherin et al. 1998; Steininger et al. 2001; Uschakov et al. 2007). A subset of MnPN and VLPO neurons that project to the DRN and the adjacent ventrolateral PAG express Fos-IR during sleep (Hsieh et al. 2011; Uschakov et al. 2009). Projections from the VLPO and MnPO to the hypocretin neuronal field in the perifornical lateral hypothalamus have also been described (Yoshida et al. 2006), and a subset of these projection neurons exhibit sleep-related Fos-IR (Uschakov et al. 2006). The activation and inactivation of MnPO neurons have been shown to suppress and activate, respectively, wake-active neurons in the lateral hypothalamus (Suntsova et al. 2007). The combined activation of sleep-active, presumed GABAergic neurons in the MnPO, and VLPO in response to short-term sleep loss, as reported here, can be hypothesized to promote homeostatic responses of decreased sleep latency and increased sleep continuity and sleep depth through enhanced GABA-mediated inhibition of neuronal systems that promote behavioral and electrographic arousal.
A population of sleep-active neurons located in the dorsal LPO (Fig. 1E) did not exhibit significant changes in wake- or sleep-related discharge during SD and RS (Fig. 4 and Table 2). The baseline sleep-wake discharge profile of these dorsal LPO neurons was identical to that of sleep-active neurons localized to VLPO (Fig. 1A). These findings indicate that not all neurons with sleep-related discharge have comparable sleep regulatory functions. Simple characterization of activity patterns across spontaneously occurring sleep-waking states may not be sufficient to identify neurons as components of sleep-wake regulatory circuits.
AD is an endogenous neuromodulator that has been critically implicated in sleep regulation (Basheer et al. 2004; Porkka-Heiskanen et al. 2003). The sleep-promoting effects of AD have been shown to involve AD A1R-mediated inhibition of cholinergic and noncholinergic neurons in the BF, which are located immediately lateral to the LPO (Basheer et al. 2004). Extracellular levels of AD in the BF are elevated in response to acute SD (Kalinchuk et al. 2008; Porkka-Heiskanen et al. 2000). A2AR-mediated activation of preoptic sleep regulatory neurons is an additional mechanism through which AD can promote sleep. A2AR agonists delivered to the lateral ventricles or the subarachnoid space, ventral to the BF (SS-BF) promote sleep (Satoh et al. 1999), increase Fos expression in VLPO neurons and decrease Fos-IR in the tuberomammillary nucleus (Scammell et al. 2001). Microinfusion of A2AR agonist into the LPO, including the VLPO, promotes sleep (Methippara et al. 2005). Bath application of AD in vitro reduces firing of some VLPO neurons via direct A1 effects, but excites other VLPO neurons via effects on A2AR (Gallopin et al. 2005). Our laboratory has recently reported that microinjection of A2AR agonist into the SS-BF increases c-Fos expression in GABAergic neurons in the MnPO and VLPO, and that drug-induced activation of preoptic GABAergic neurons persists even if animals are prevented from sleeping during the postinjection period (Kumar et al. 2013). Infusion of A2AR antagonist into the lateral ventricle during the final 2 h of a 3-h period of SD suppresses RS, suppresses EEG SWA during RS, and suppresses c-Fos expression in MnPO and VLPO GABAergic neurons during RS (Kumar et al. 2013). Here we report that local microdialysis perfusion of A2AR antagonist suppresses spontaneous and SD-evoked discharge in VLPO sleep-active neurons (Figs. 5 and 6).
In addition to AD, several other endogenous sleep regulatory substances have been implicated in the regulation of sleep homeostasis, including PGD2, growth hormone releasing hormone and the proinflammatory cytokines interleukin-1β and tumor necrosis factor-α (see Krueger et al. 2008; McCarley 2007; Obal and Krueger 2003 for review). Where and how sleep regulatory substances target sleep-wake regulatory circuits in the brain is poorly understood. Sleep-active neuronal populations with possible sleep regulatory functions have been identified in the perifornical lateral hypothalamus (Hassani et al. 2009, 2010; Konadhode et al. 2013; Suntsova et al. 2007), the neocortex (Kilduff et al. 2011) and the rostral medulla (Anacelt et al. 2012). Optogenetic activation of melanin concentrating hormone neurons in the lateral hypothalamus promotes sleep (Konadhode et al. 2013). This is the first demonstration that selective stimulation of a targeted cell type is sufficient to increase sleep, and provides compelling evidence for a sleep-regulatory role of melanin concentrating hormone neurons. However, of the known sleep-active neuronal populations, only MnPO and VLPO neurons have been shown to be responsive to multiple endogenous sleep regulatory substances, including AD acting via A2AR (Kumar et al. 2013; Scammell et al. 2001), PGD2 acting on DP1 receptors (Huang et al. 2007; Scammell et al. 1998), growth hormone releasing hormone (Peterfi et al. 2008) and interleukin-1β (Alam et al. 2004; Baker et al. 2005). Here we describe for the first time that dynamic increases in MnPO and VLPO neuronal activity are positively correlated with behavioral and EEG biomarkers of increasing homeostatic sleep pressure. Collectively, this evidence supports the hypothesis that increased production/release of endogenous sleep regulatory substances in the ventral BF and adjacent hypothalamus that occurs in response to either spontaneous or forced wakefulness promotes homeostatic responses of increased sleep amount, sleep continuity and sleep depth through excitation of GABAergic sleep-active neurons in the MnPO and VLPO.
GRANTS
This study was supported by the Department of Veterans Affairs and National Institute of Mental Health Grant MH-63323.
DISCLOSURES
No conflicts of interest, financial or otherwise, are declared by the author(s).
AUTHOR CONTRIBUTIONS
Author contributions: M.A.A. and S.K. performed experiments; M.A.A. and S.K. analyzed data; M.A.A., M.N.A., and R.S. prepared figures; M.A.A., S.K., D.M., and M.N.A. edited and revised manuscript; M.A.A., S.K., D.M., M.N.A., and R.S. approved final version of manuscript; D.M., M.N.A., and R.S. conception and design of research; M.N.A. and R.S. interpreted results of experiments; R.S. drafted manuscript.
REFERENCES
- Alam MN, McGinty D, Bashir T, Kumar S, Imeri L, Opp M, Szymusiak R. Interleukin-1beta modulates state-dependent discharge activity of preoptic area and basal forebrain neurons: role in sleep regulation. Eur J Neurosci 29: 207–216, 2004 [DOI] [PubMed] [Google Scholar]
- Alam MN, McGinty D, Szymusiak R. Neuronal discharge of preoptic/anterior hypothalamic thermosensitive neurons: relation to NREM sleep. Am J Physiol Regul Integr Comp Physiol 269: R1240–R1249, 1995 [DOI] [PubMed] [Google Scholar]
- Alam MN, Szymusiak R, Gong H, King J, McGinty D. Adenosinergic modulation of rat basal forebrain neurons during sleep and waking: neuronal recording with microdialysis. J Physiol 521: 679–690, 1999 [DOI] [PMC free article] [PubMed] [Google Scholar]
- Anacelt C, Vetrivelan R, Krenzer M, Vong L, Fuller P, Lu J. Identification and characterization of a sleep-active cell group in the rostral medullary brainstem. J Neurosci 32: 17970–17976, 2012 [DOI] [PMC free article] [PubMed] [Google Scholar]
- Baker FC, Shah S, Stewart D, Angara C, Gong H, Szymusiak R, Opp MR, McGinty D. Interleukin 1b enhances non-rapid eye movement sleep and increases c-Fos protein expression in the median preoptic nucleus of the hypothalamus. Am J Physiol Regul Integr Comp Physiol 288: R998–R1005, 2005 [DOI] [PubMed] [Google Scholar]
- Basheer R, Strecker RE, Thakkar MM, McCarley RW. Adenosine and sleep-wake regulation. Prog Neurobiol 73: 379–396, 2004 [DOI] [PubMed] [Google Scholar]
- Borbely A, Acherman P. Sleep homeostasis and models of sleep regulation. J Biol Rhythms 14: 557–568, 1999 [DOI] [PubMed] [Google Scholar]
- Gallopin T, Luppi PH, Cauli B, Urade Y, Rossier J, Hayaishi O, Lambolez B, Fort P. The endogenous somnogen adenosine excites a subset of sleep-promoting neurons via A2A receptors in the ventrolateral preoptic nucleus. Neuroscience 134: 1377–1390, 2005 [DOI] [PubMed] [Google Scholar]
- Gong H, McGinty D, Guzman-Marin R, Chew KT, Stewart D, Szymusiak R. Activation of c-Fos in GABAergic neurones in the preoptic area during sleep and in response to sleep deprivation. J Physiol 556: 935–946, 2004 [DOI] [PMC free article] [PubMed] [Google Scholar]
- Gong H, Szymusiak R, King J, Steininger T, McGinty D. Sleep-related c-Fos protein expression in the preoptic hypothalamus: effects of ambient warming. Am J Physiol Regul Integr Comp Physiol 279: R2079–R2088, 2000 [DOI] [PubMed] [Google Scholar]
- Gvilia I, Turner A, McGinty D, Szymusiak R. Preoptic area neurons and the homeostatic regulation of rapid eye movement (REM) sleep. J Neurosci 26: 3037–3044, 2006a [DOI] [PMC free article] [PubMed] [Google Scholar]
- Gvilia I, Xu F, McGinty D, Szymusiak R. Homeostatic regulation of sleep: a role for preoptic area neurons. J Neurosci 26: 9426–9433, 2006b [DOI] [PMC free article] [PubMed] [Google Scholar]
- Hassani OK, Henny P, Lee MG, Jones BE. GABAergic neurons intermingled with orexin and MCH neurons in the lateral hypothalamus discharge maximally during sleep. Eur J Neurosci 32: 448–457, 2010 [DOI] [PMC free article] [PubMed] [Google Scholar]
- Hassani OK, Lee MG, Jones BE. Melanin-concentrating hormone neurons discharge in a reciprocal manner to orexin neurons across the sleep-wake cycle. Proc Natl Acad Sci U S A 106: 2418–2422, 2009 [DOI] [PMC free article] [PubMed] [Google Scholar]
- Hsieh KC, Gvilia I, Kumar S, Uschakov A, McGinty D, Szymusiak R. c-Fos expression in neurons projecting from the preoptic and lateral hypothalamic areas to the ventrolateral periaqueductal gray in relation to sleep states. Neuroscience 188: 55–67, 2011 [DOI] [PMC free article] [PubMed] [Google Scholar]
- Huang ZL, Urade Y, Hayaishi O. Prostaglandins and adenosine in the regulation of sleep and wakefulness. Curr Opin Pharmacol 7: 33–38, 2007 [DOI] [PubMed] [Google Scholar]
- John J, Kumar V. Effect of NMDA lesions of the medial preoptic neurons on sleep and other functions. Sleep 21: 587–598, 1998 [DOI] [PubMed] [Google Scholar]
- Kalinchuk A, McCarley RW, Stenberg D, Porkka-Heiskanen T, Basheer R. The role of cholinergic basal forebrain neurons in adenosine-mediated homeostatic control of sleep: lessons from 192 IgG-saporin lesions. Neuroscience 57: 238–253, 2008 [DOI] [PMC free article] [PubMed] [Google Scholar]
- Kilduff TS, Cauli B, Gerashchenko D. Activation of cortical neurons during sleep: an anatomical link to homeostatic sleep regulation. Trends Neurosci 34: 10–19, 2011 [DOI] [PMC free article] [PubMed] [Google Scholar]
- Konadhode RR, Pelluru D, Blanco-Centurion C, Zayachkivsky A, Liu M, Uhde T, Glen WB, van Den Pol AN, Shiromani PJ. Optogenetic stimulation of MCH neurons increases sleep. J Neurosci 33: 10257–10262, 2013 [DOI] [PMC free article] [PubMed] [Google Scholar]
- Krueger JM, Rector D, Roy S, Van Dongen H, Belenky G, Panksepp J. Sleep as a fundamental property of neuronal assemblies. Nat Rev Neurosci 9: 910–919, 2008 [DOI] [PMC free article] [PubMed] [Google Scholar]
- Kumar S, Rai S, Hsieh KC, McGinty D, Alam MN, Szymusiak R. Adenosine A2A receptors regulate the activity of sleep regulatory GABAergic neurons in the preoptic hypothalamus. Am J Physiol Regul Integr Comp Physiol 305: R31–R41, 2013 [DOI] [PMC free article] [PubMed] [Google Scholar]
- Lu J, Bjorkum AA, Xu M, Gaus SE, Shiromani PJ, Saper CB. Selective activation of the extended ventrolateral preoptic nucleus during rapid eye movement sleep. J Neurosci 22: 4568–4576, 2002 [DOI] [PMC free article] [PubMed] [Google Scholar]
- Lu J, Greco MA, Shiromani P, Saper CB. Effect of lesions of the ventrolateral preoptic nucleus on NREM and REM sleep. J Neurosci 20: 3830–3842, 2000 [DOI] [PMC free article] [PubMed] [Google Scholar]
- Lu J, Sherman D, Devor M, Saper CB. A putative flip-flop switch for control of REM sleep. Nature 441: 589–594, 2006 [DOI] [PubMed] [Google Scholar]
- Luppi PH, Gervasoni D, Verret L, Goutagny R, Peyron C, Salvert D, Leger L, Fort P. Paradoxical (REM) sleep genesis: the switch from an aminergic-cholinergic to a GABAergic-glutamatergic hypothesis. J Physiol (Paris) 100: 271–284, 2006 [DOI] [PubMed] [Google Scholar]
- Matsumura H, Nakajima T, Osaka T, Satoh S, Kawase K, Kubo E, Kantha SS, Kasahara K, Hayaishi O. Prostaglandin D2-sensitive, sleep-promoting zone defined in the ventral surface of the rostral basal forebrain. Proc Natl Acad Sci U S A 91: 11998–12002, 1994 [DOI] [PMC free article] [PubMed] [Google Scholar]
- McCarley RW. Neurobiology of REM and NREM sleep. Sleep Med 8: 302–330, 2007 [DOI] [PubMed] [Google Scholar]
- McGinty D, Sterman MB. Sleep suppression after basal forebrain lesions in the cat. Science 160: 1253–1255, 1968 [DOI] [PubMed] [Google Scholar]
- Methippara MM, Kumar S, Alam MN, Szymusiak R, McGinty D. Effects on sleep of microdialysis of adenosine A1 and A2a receptor analogs into the lateral preoptic area of rats. Am J Physiol Regul Integr Comp Physiol 289: R1715–R1723, 2005 [DOI] [PubMed] [Google Scholar]
- Obal F, Jr, Krueger J. GHRH and sleep. Sleep Med Rev 8: 367–377, 2004 [DOI] [PubMed] [Google Scholar]
- Obal F, Jr, Krueger JM. Biochemical regulation of non-rapid-eye-movement sleep. Front Biosci 8: d520–d550, 2003 [DOI] [PubMed] [Google Scholar]
- Paxinos G, Watson C. The Rat Brain in Stereotaxic Coordinates. San Diego, CA: Academic, 1998 [Google Scholar]
- Peterfi Z, McGinty D, Szymusiak R. Growth hormone-releasing hormone activates GABAergic neurons in the rat preoptic hypothalamus. Sleep 31: A21–A22, 2008 [DOI] [PMC free article] [PubMed] [Google Scholar]
- Porkka-Heiskanen T, Kalinchuk A, Alanko L, Urrila A, Stenberg D. Adenosine, engergy metabolism and sleep. ScientificWorldJournal 3: 790–798, 2003 [DOI] [PMC free article] [PubMed] [Google Scholar]
- Porkka-Heiskanen T, Strecker RE, McCarley RW. Brain site specificity of extracellular adenosine concentration changes during sleep deprivation and spontaneous sleep: an in vivo microdialysis study. Neuroscience 99: 507–517, 2000 [DOI] [PubMed] [Google Scholar]
- Porkka-Heiskanen T, Strecker RE, Thakkar M, Bjorkum AA, Greene RW, McCarley RW. Adenosine: a mediator of the sleep-inducing effects of prolonged wakefulness. Science 276: 1265–1268, 1997 [DOI] [PMC free article] [PubMed] [Google Scholar]
- Saper CB, Chou TC, Scammell TE. The sleep switch:hypothalamic control of sleep and wakefulness. Trends Neurosci 24: 726–731, 2001 [DOI] [PubMed] [Google Scholar]
- Satoh S, Matsumura H, Koike N, Tokunga Y, Maeda T, Hayaishi O. Region-dependent difference in the sleep promoting potency of an adenosine A2A receptor agonist. Eur J Neurosci 11: 1587–1597, 1999 [DOI] [PubMed] [Google Scholar]
- Scammell T, Gerashchenko D, Mochizuki T, McCarthy MT, Estabrooke IV, Sears C, Saper CB, Urade Y, Hayaishi O. An adenosine A2a agonist increases sleep and induces Fos in ventrolateral preoptic area neurons. Neuroscience 107: 653–663, 2001 [DOI] [PubMed] [Google Scholar]
- Scammell T, Gerashchenko D, Urade Y, Onoe H, Saper CB, Hayaishi O. Activation of ventrolateral preoptic neurons by the somnogen prostaglandin D2. Proc Natl Acad Sci U S A 95: 7754–7759, 1998 [DOI] [PMC free article] [PubMed] [Google Scholar]
- Sherin JE, Elmquist JK, Torrealba F, Saper CB. Innervation of histaminergic tuberomammillary neurons by GABAergic and galaninergic neurons in the ventrolateral preoptic nucleus of the rat. J Neurosci 18: 4705–4721, 1998 [DOI] [PMC free article] [PubMed] [Google Scholar]
- Sherin JE, Shiromani PJ, McCarley RW, Saper CB. Activation of ventrolateral preoptic neurons during sleep. Science 271: 216–219, 1996 [DOI] [PubMed] [Google Scholar]
- Steininger TL, Gong H, McGinty D, Szymusiak R. Subregional organization of preoptic area/anterior hypothalamic projections to arousal-related monoaminergic cell groups. J Comp Neurol 429: 638–653, 2001 [PubMed] [Google Scholar]
- Suntsova N, Szymusiak R, Alam MN, Guzman-Marin R, McGinty D. Sleep-waking discharge patterns of median preoptic nucleus neurons. J Physiol 543: 665–677, 2002 [DOI] [PMC free article] [PubMed] [Google Scholar]
- Suntsova N, Guzman-Marin R, Kumar S, Alam MN, Szymusiak R, McGinty D. The median preoptic nucleus reciprocally modulates activity of arousal-related and sleep-related neurons in the perifornical lateral hypothalamus. J Neurosci 27: 1616–1630, 2007 [DOI] [PMC free article] [PubMed] [Google Scholar]
- Szymusiak R, Alam N, Steininger TL, McGinty D. Sleep-waking discharge patterns of ventrolateral preoptic/anterior hypothalamic neurons in rats. Brain Res 803: 178–188, 1998 [DOI] [PubMed] [Google Scholar]
- Szymusiak R, Gvilia I, McGinty D. Hypothalamic control of sleep. Sleep Med 8: 291–301, 2007 [DOI] [PubMed] [Google Scholar]
- Takahashi K, Lin JS, Sakai K. Characterization and mapping of sleep-waking specific neurons in the basal forebrain and preoptic hypothalamus. Neuroscience 161: 269–292, 2009 [DOI] [PubMed] [Google Scholar]
- Ticho SR, Radulovacki M. Role of adenosine in sleep and temperature regulation in the preoptic area of rats. Pharmacol Biochem Behav 40: 33–40, 1991 [DOI] [PubMed] [Google Scholar]
- Ueno R, Ishikawa Y, Nakayama T, Hayaishi O. Prostaglandin D2 induces sleep when microinjected into the preoptic area of conscious rats. Biochem Biophys Res Commun 109: 576–582, 1982 [DOI] [PubMed] [Google Scholar]
- Uschakov A, Gong H, McGinty D, Szymusiak R. Sleep-active neurons in the preoptic area project to the hypothalamic paraventricular nucleus and the perifornical lateral hypothalamus. Eur J Neurosci 23: 3284–3296, 2006 [DOI] [PubMed] [Google Scholar]
- Uschakov A, Gong H, McGinty D, Szymusiak R. Efferent projections from the median preoptic nucleus to sleep- and arousal regulatory nuclei in the rat brain. Neuroscience 150: 104–120, 2007 [DOI] [PMC free article] [PubMed] [Google Scholar]
- Uschakov A, McGinty D, Szymusiak R, McKinley MJ. Functional correlates of activity in neurons projecting from the lamina terminalis to the ventrolateral periaqueductal gray. Eur J Neurosci 30: 2347–2355, 2009 [DOI] [PMC free article] [PubMed] [Google Scholar]
- Yoshida K, McCormack S, Espana RA, Crocker A, Scammell TE. Afferents to the orexin neurons of the rat brain. J Comp Neurol 494: 845–861, 2006 [DOI] [PMC free article] [PubMed] [Google Scholar]