

Abstract
The dramatic increase in neocortical size and folding during mammalian brain evolution has been attributed to the elaboration of the subventricular zone (SVZ) and the associated increase in neural progenitors. However, recent studies have shown that SVZ size and the abundance of resident progenitors do not directly predict cortical topography, suggesting that complex behaviors of the progenitors themselves may contribute to the overall size and shape of the adult cortex. Using time-lapse imaging, we examined the dynamic behaviors of SVZ progenitors in the ferret, a gyrencephalic carnivore, focusing our analysis on outer radial glial cells (oRGs). We identified a substantial population of oRGs by marker expression and their unique mode of division, termed mitotic somal translocation (MST). Ferret oRGs exhibited diverse behaviors in terms of division location, cleavage angle, and MST distance, as well as fiber orientation and dynamics. We then examined the human fetal cortex and found that a subset of human oRGs displayed similar characteristics, suggesting that diversity in oRG behavior may be a general feature. Similar to the human, ferret oRGs underwent multiple rounds of self-renewing divisions but were more likely to undergo symmetric divisions that expanded the oRG population, as opposed to producing intermediate progenitor cells (IPCs). Differences in oRG behaviors, including proliferative potential and daughter cell fates, may contribute to variations in cortical structure between mammalian species.
Introduction
Evolutionary expansion of the mammalian neocortex has led to increased cortical surface area accompanied by varying degrees of folding (Zilles et al., 2013), and has been attributed to differences in the size and composition of embryonic germinal zones (Kriegstein et al., 2006; Molnár, 2011). Specifically, the subventricular zone (SVZ) is greatly expanded in gyrencephalic primates and can be subdivided into an inner and outer region, the latter of which is negligible in lissencephalic rodents (Smart et al., 2002; Lukaszewicz et al., 2005; Zecevic et al., 2005; Dehay and Kennedy, 2007; Bayatti et al., 2008; Martínez-Cerdeño et al., 2012). The SVZ contains both intermediate progenitor cells (IPCs), which undergo symmetric divisions to produce neurons (Haubensak et al., 2004; Miyata et al., 2004; Noctor et al., 2004), and outer radial glial cells (oRGs; Fietz et al., 2010; Hansen et al., 2010; Reillo et al., 2011).
Similar to ventricular radial glia (vRGs), oRGs express radial glia markers but lack an apical attachment to the ventricular surface (Fietz et al., 2010; Hansen et al., 2010; Reillo et al., 2011; Shitamukai et al., 2011; Wang et al., 2011) and exhibit a distinct mode of division termed mitotic somal translocation (MST). During MST, the cell body moves rapidly up the basal fiber towards the cortical plate (CP) before undergoing cytokinesis (Hansen et al., 2010; Wang et al., 2011; LaMonica et al., 2013). oRGs self-renew and produce neurons directly (Wang et al., 2011) or indirectly through the production of IPCs, which in the human undergo transit amplifying divisions to increase neuron production (Hansen et al., 2010). An enlarged SVZ, accompanied by an increase in both oRGs and IPCs, may account for neuronal amplification and the tangential dispersion of neurons that contributes to cortical expansion and gyrification (Lui et al., 2011).
The contribution of the SVZ to cortical structure appears to be conserved between primate and nonprimate gyrencephalic species. For example, the ferret is a gyrencephalic carnivore with an expanded SVZ that contains progenitor populations similar to primates (Fietz et al., 2010; Martínez-Cerdeño et al., 2012; Reillo and Borrell, 2012). However, the relative abundance of oRGs does not predict degree of gyrification (García-Moreno et al., 2012; Kelava et al., 2012), and daughter cell fates differ between species. Revealing the proliferative potential and daughter cell fates of ferret oRGs will allow comparison to other species and further our understanding of oRG contributions to cortical development.
Here we show that ferret oRGs undergo multiple rounds of symmetric divisions and only rarely produce IPCs at the ages examined. In addition, they exhibit diverse behaviors in terms of their division mode, location, and cleavage angle, as well as fiber orientation and dynamics. A subset of human oRGs displays similar behavioral diversity, suggesting that this variation is a general feature of oRG progenitors in different gyrencephalic species. We propose that together with proliferative capacity and daughter-cell identities, this range in oRG behavior may contribute to the size and shape of the adult neocortex.
Materials and Methods
Cortical slice culture, viral infection, and time-lapse imaging.
As previously described (Hansen et al., 2010; LaMonica et al., 2013), human fetal brain tissue was collected at San Francisco General Hospital, with previous patient consent and in strict observance of legal and institutional ethical regulations approved by the UCSF Committee on Human Research (institutional review board), and transported in artificial CSF (ACSF; 125 mm NaCl, 2.5 mm KCl, 1 mm MgCl2, 2 mm CaCl2, 1.25 mm NaH2PO4, 25 mm NaHCO3, 25 mm d-(+)-glucose, bubbled with 95%O2/5%CO2) to the laboratory for further processing. Embryonic day (E)27 timed-pregnant ferrets were obtained from Marshall BioResources and maintained according to protocols approved by the UCSF Institutional Animal Care and Use Committee. E39 pregnant dams were deeply anesthetized with ketamine followed by isoflurane administration. Ovariohysterectomy for fetus collection was then performed and embryonic brains, along with meninges, removed in chilled ACSF. Postnatal day (P)0 corresponded to the day of birth. P3 ferret kits were deeply anesthetized with isoflurane, decapitated, and the brain extracted and meninges removed in chilled ACSF. Ferret and human brain tissue was embedded in 3.5–4% low melting point agarose in ACSF and 250–300 μm coronal vibratome sections transferred to Millicell-CM slice culture inserts (Millipore) that were immersed in cortical slice culture medium (66% BME, 25% Hanks, 5% FBS, 1% N-2, 1% penicillin, streptomycin and glutamine, all Invitrogen, and 0.66% d-(+)-glucose, Sigma-Aldrich). CMV-GFP adenovirus at a dilution of 1:50–1:500 (Vector Biolabs, 1 × 10⁶ cfu) was applied to slices that were then cultured at 37°C, 5% CO2, 8% O2 for ∼24 h. For quantification of GFP-labeled oRGs, ferret slices were then fixed in 4% PFA in PBS overnight and processed for immunohistochemistry. For time-lapse imaging, cultures were then transferred to an inverted Leica TCS SP5 with an on-stage incubator streaming 5% CO2, 5% O2, balance N2 into the chamber. Slices were imaged for GFP using a 10× (2.0 zoom) or 40× air objective at 15–30 min intervals for up to 5 d with repositioning of the z-stacks every ∼12 h.
Analysis of divisions.
Maximum intensity projections of the collected stacks (5–10 μm step size) were compiled, generated into movies, and analyzed using Imaris software. Four imaged positions of frontal-parietal lateral cortex from two P3 nonlittermate ferrets of either sex, and four imaged positions of the same region from one E39 ferret of either sex were examined. For each P3 position the VZ surface was visible and all divisions that occurred between the start of imaging and 48 h later were analyzed (n = 512). The distance of the cell from the VZ surface before the division was measured. MST length was measured as the distance between the site of cytokinesis and the center of the soma before the onset of translocation. Using Screen Protractor (Iconico), division angles were determined by calculating the angle between cytokinesis and the ventricular surface (“division angle relative to the VZ”). For MST divisions, the angle between cytokinesis and the primary fiber (the fiber along which the cell body translocated) was also calculated (“division angle relative to the primary fiber”; n = 174). An additional position was used for analysis of divisions at the VZ surface at P3 (n = 12). Five imaged positions from three different human samples of either sex that contained the outer SVZ (oSVZ) were used to determine the angle between cytokinesis and the adjacent radial fiber scaffold for MST divisions (“division angle relative to the radial fiber scaffold”; n = 71). Three imaged positions from two human samples of either sex were used for analysis of divisions at the VZ surface (n = 57).
Immunohistochemistry and confocal imaging.
Upon completion of time-lapse imaging, brain slices were fixed in 4% PFA in PBS overnight at 4°C and then transferred to PBS. As previously described (Hansen et al., 2010; LaMonica et al., 2013), slices were subjected to boiling citrate-based antigen retrieval solution for 20 min and permeabilized and blocked in blocking buffer (PBS plus 0.1% Triton X-100, 10% serum, and 0.2% gelatin) for 1 h. Primary antibodies were diluted in blocking buffer and applied to slices for 36 h at 4°C. Slices were washed with PBS plus 0.5% Triton X-100 and then incubated in secondary antibodies diluted in blocking buffer for 3–5 h. Images were acquired on a Leica TCS SP5 X laser confocal microscope. Primary and secondary antibodies used: goat anti-SOX2 (Santa Cruz Biotechnology, sc-17320, 1:250), rabbit anti-TBR2 (Abcam, ab23345, 1:100), chicken anti-GFP (Aves Labs, GFP-1020, 1:1000), rabbit anti-OLIG2 (Millipore, AB9610, 1:250), mouse anti-OLIG2 (Millipore, MABN50, 1:100), mouse anti-KI67 (Dako, F0788, 1:200), AlexaFluor 488, 546, 594, or 647-conjugated donkey anti-goat, -rabbit, -mouse IgG (Invitrogen, 1:500), and AlexaFluor 488 donkey anti-chicken IgY (Jackson ImmunoResearch, 703-545-155, 1:500).
Statistics.
Graphs were made using Excel and JMP software. A linear regression analysis followed by a t test was used to determine the significance of the relationship between MST length and distance from the VZ, with a sample size of n = 174; *p < 0.05.
Results
SVZ divisions in the developing ferret cortex
At ferret P3–P6, layer II–III neurons are being produced, cortical folds are beginning to appear, and the inner (iSVZ) and outer SVZ (oSVZ) are highly developed and populated by progenitors, including IPCs and oRGs (Jackson et al., 1989; Fietz et al., 2010; Reillo et al., 2011; Reillo and Borrell, 2012). In the human, ferret, and mouse, oRGs have been defined by expression of radial glial markers, location in the SVZ, and morphology, including the presence of a basal fiber that persists during mitosis and the absence of an apical attachment to the ventricular surface (Fietz et al., 2010; Hansen et al., 2010; Wang et al., 2011). Dynamically, oRGs exhibit a behavior known as MST, in which the cell soma moves rapidly towards the CP along the basal fiber beginning ∼1 h before cytokinesis (Hansen et al., 2010; Wang et al., 2011; LaMonica et al., 2013). For the current study, we relaxed our definition of oRGs to investigate all cells that have a RG-specific gene expression profile and exhibit MST, but that may not necessarily fit our previously strict morphological definition of the cell type. To visualize progenitor behaviors in the developing ferret cortex, organotypic slice cultures of P3 brains were labeled with an adenovirus-expressing GFP (AV-GFP) and imaged 24 h later using time-lapse confocal microscopy.
Slice cultures were fixed and stained following virus application to determine the progenitor populations labeled by AV-GFP and to distinguish VZ from SVZ divisions. The VZ was visualized as an ∼100 μm-thick, dense band of Sox2-positive cells with scattered Tbr2-positive cells immediately adjacent to the cerebral ventricle. A cell layer with sparser Sox2 staining and a dense Tbr2-positive band, located basal to the VZ, indicated the iSVZ, and measured 150 μm in thickness (100–250 μm from the VZ surface). Just basal to the iSVZ, the cell layer containing sparse Sox2- and Tbr2-labeling corresponded to the oSVZ and measured 400 μm in thickness and was ∼250–650 μm from the VZ surface (Fig. 1A; Hansen et al., 2010; Martínez-Cerdeño et al., 2012; Reillo and Borrell, 2012). Together, Sox2-expressing progenitors, Tbr2-expressing IPCs (Englund et al., 2005), and Olig2-expressing precursors constitute the vast majority of cycling cells in the P0–P6 ferret SVZ (Reillo et al., 2011; Reillo and Borrell, 2012). Of the AV-GFP-positive cells located in the SVZ and within the cell cycle (Ki67-positive), 55.2% (n = 299) expressed the neural stem cell marker Sox2 and lacked expression of Tbr2 and Olig2, a marker expression profile that can be used to identify oRGs (Hansen et al., 2010). This suggests that over half of the AV-GFP-labeled cycling cells are oRG progenitors (Fig. 1A).
Figure 1.

SVZ divisions in the developing ferret cortex. A, P3 ferret cortical slice labeled with AV-GFP and stained for Sox2 (blue), Tbr2 (red), and Olig2 (white) to distinguish the VZ (100 μm thick on average) from the iSVZ (150 μm thick on average) and oSVZ (400 μm thick on average). Boxed region indicates the location of the magnified region, which highlights AV-GFP+ cells within the iSVZ and oSVZ that are Sox2+, Tbr2−, and Olig2− (white closed arrowheads). Scale bars: in merged image, 50 μm; in single channel images, 20 μm. B, Box plot showing median and interquartile range of MST distances in the iSVZ and oSVZ (n = 162). C, D, Time-lapse stills of oRGs labeled with AV-GFP in P3 ferret cortical slices. Time elapsed from start of imaging indicated in the top right of image (hours:minutes, yellow = start of division). VZ surface is down. Scale bars, 20 μm. C, An oRG (closed white arrowhead) maintains the basal fiber (open white arrowheads) during mitosis and exhibits an MST length of 37 μm (white arrow indicates direction of MST) to produce a basal (closed white arrowhead) and apical daughter (closed yellow arrowhead). D, An example of a stationary oRG division in which the cell (closed white arrowhead) maintains the basal fiber (open white arrowheads) during mitosis, and produces a basal (closed white arrowhead) and apical daughter (closed yellow arrowhead).
Division mode, location, and orientation were then analyzed for all GFP-positive cell divisions that occurred during the first 48 h of time-lapse imaging. In this study, all cells that displayed MST lengths of 6 μm or greater were referred to as oRGs. In total, 485 SVZ divisions were documented, with 162 (33.4%) exhibiting MST lengths >6 μm, the approximate radius of the soma (Fig. 1C). Although the average MST length was 17.6 μm, MST lengths showed a skewed distribution toward smaller distances, with the majority of MST divisions <15 μm (59.9%; Fig. 1B). Interestingly, we observed oRG divisions similar to those described in the human and mouse, in which the cell possesses a basal fiber that does not retract during mitosis and is inherited by the basal daughter, but that did not exhibit MST (Fig. 1D; Hansen et al., 2010; Wang et al., 2011). We refer to these divisions as stationary oRG divisions. Because 55.2% of AV-GFP-labeled cells within the cell cycle are oRGs according to marker expression analysis, and only 33.4% of AV-GFP-labeled cells divided via MST, it is possible that up to 21.8% of the ferret oRG population undergoes stationary divisions (Movie 1).
Ferret oRGs undergo MST and stationary divisions. In this time-lapse series, SVZ progenitors were labeled with AV-GFP in P3 ferret cortical slices. An oRG (yellow circle) with a basally oriented primary fiber divides via MST (12 μm). Next, an oRG, (pink circle) with a curved primary fiber that is basally oriented (white arrowheads), maintains the fiber during mitosis and undergoes a stationary division. This oRG cell has a dynamic growth cone at the end of the primary fiber.
MST divisions are found throughout the VZ and SVZ
Although MST divisions were found throughout the SVZ, the majority occurred within 100–300 μm from the VZ surface, with fewer MST divisions observed at greater distances from the VZ (Fig. 2A). Sixty-six percent and 85% of MST divisions occurred between 100–300 μm and 100–400 μm from the VZ surface, respectively. A scatter plot with a linear regression line is shown in Figure 2B illustrating MST length as a function of the distance of the dividing cell from the VZ surface. There is a modest but significant negative relationship between MST length and distance from the VZ (r2 = 0.03, p = 0.023), suggesting that larger MST lengths tend to occur closer to the VZ surface.
Figure 2.

MST divisions can be found throughout the VZ and SVZ. A, Percentage of SVZ MST divisions (n = 162) occurring at different distances from the VZ surface (100–650 μm). B, Scatter plot and linear regression line were used to analyze the relationship between MST length and division location measured as distance from the VZ surface (n = 174). The regression line equation is y = 23.585–0.0199x; r2 = 0.0296, p = 0.023 (*p < 0.05). C, D, Time-lapse stills of RG cells labeled with AV-GFP in P3 ferret cortical slices. Time elapsed from start of imaging indicated in the top right of image (yellow = division). VZ surface is denoted by a dotted line. Basal daughter indicated with closed white arrowhead and apical daughter with closed yellow arrowhead. Boxed region indicates the location of the basal daughter at the end of time-lapse imaging. Scale bars, 20 μm. C, An RG (closed white arrowhead) divides at the VZ surface with an oblique division angle (36.7° with respect to VZ surface) to produce a basal daughter that inherits the basal process (open white arrowheads) and an apical daughter. Post-time-lapse fate staining reveals that the basal daughter is Sox2+. Shown on the right is a schematic of the time-lapse series. D, An RG (closed white arrowhead) located at the VZ surface undergoes basal MST (10.9 μm, white arrow indicates direction of MST) and divides with a horizontal division angle (4.4° with respect to VZ surface) to produce a basal daughter that inherits the basal process (open white arrowheads) and an apical daughter. Post-time-lapse fate staining reveals that the basal daughter is Sox2+. Schematic of time-lapse series is shown on the right.
In addition to MST divisions in the SVZ, we also observed MST divisions within the VZ. Specifically, 6.9% (12/174) of all MST divisions occurred within 0–100 μm from the VZ surface. An example of this is shown in Figure 2D, in which a RG cell located at the VZ surface undergoes basal MST before dividing with a horizontal division angle (0–30°). The basal daughter inherits the basal fiber, migrates away from the VZ surface, and expresses Sox2, suggestive of oRG identity. We also observed RG cells undergoing mitosis at the VZ surface and dividing with an oblique or horizontal division angle. Similar to ventricular RG (vRG) cell divisions that produce oRGs in the human and mouse (Wang et al., 2011; LaMonica et al., 2013), the basal daughter of these divisions inherited the basal fiber and expressed RG markers (Fig. 2C).
Of 12 divisions where the RG cell was located at the VZ surface, five exhibited MST lengths >6 μm, with an average length of 13.6 μm. Moreover, all of these MST divisions were at a horizontal angle (0–30°) with respect to the VZ surface. Therefore, oRGs are generated not only from RG cells undergoing mitosis at the VZ surface (Wang et al., 2011; LaMonica et al., 2013), but likely also from RG cells residing within the VZ that undergo MST (Movie 2).
RG cells within the ferret VZ divide both at the VZ surface and subapically. In this time-lapse series, VZ progenitors were labeled with AV-GFP in P3 ferret cortical slices. An RG cell (pink circle) undergoes MST (20 μm) and divides at a subapical position with a horizontal angle with respect to the VZ surface. Next, a nearby RG cell (yellow circle) divides at the VZ surface, followed by another RG cell (orange circle) dividing at the VZ surface.
Ferret oRG division angle relative to the VZ varies, whereas division angle relative to the primary fiber remains constant
In the human and mouse cortex, oRGs have been described as possessing a basal fiber reaching to the pial surface, undergoing basally directed MST, and dividing with a horizontal division angle with respect to the VZ surface (Hansen et al., 2010; Wang et al., 2011). Although these features were commonly displayed by ferret oRGs (Fig. 1C), progenitors were also observed undergoing MST that was not basally directed, as well as undergoing MST followed by a nonhorizontal division angle. For instance, 3.7% of MST divisions were apically directed (Fig. 3E). Although the majority of MST divisions in the iSVZ and oSVZ exhibited a horizontal division angle relative to the VZ surface (0–30°), up to 29% divided with an oblique angle (30–60°), and up to 24% with a vertical angle (60–90°; Fig. 3A,D). We observed oRGs with tangentially oriented fibers being generated from MST divisions within the SVZ. An example of this is shown in Figure 3C, in which an oRG cell with a basal fiber undergoes MST with a horizontal division angle to produce daughter cells that extend fibers parallel to the VZ surface. After imaging, these daughters were found to be positive for Sox2 and negative for both Tbr2 and Olig2, suggesting oRG identity. This range in fiber orientation and MST direction has recently been documented in the embryonic macaque cortex (Betizeau et al., 2013), suggesting that this diversity could be a general feature of oRGs.
Figure 3.

oRG division angles vary with respect to the VZ surface but remain constant with respect to the primary fiber. A, Schematic and quantification of cells undergoing MST with horizontal (0–30°, blue), oblique (30–60°, red), and vertical (60–90°, green) division angles with respect to the VZ surface (n = 174). B, Schematic and quantification of cells undergoing MST with vertical (0–30°, green), oblique (30–60°, red), and horizontal (60–90°, blue) division angles with respect to the primary (1′) fiber (n = 174). C–E, Time-lapse stills of progenitors labeled with AV-GFP in P3 ferret cortical slices. Time elapsed from start of imaging indicated in the top right of image (yellow = division). 1′ daughter is denoted with a closed white arrowhead and non-1′ daughter with a closed yellow arrowhead. Yellow line indicates 1′ fiber orientation before MST. White arrow indicates the direction of MST. VZ surface is down. Scale bars, 20 μm. C, An oRG (closed white arrowhead) undergoes MST (17.1 μm, 100.6 μm from VZ surface) to produce daughters that are Sox2+ Tbr2− Olig2−, and that possess 1′ fibers (open white arrowheads) that are parallel to the VZ surface. D, Example of a progenitor undergoing MST (16 μm, 100 μm from VZ surface) parallel to the VZ surface and dividing 76° relative to the 1′ fiber (open white arrowheads). E, Example of a progenitor undergoing apically directed MST (33 μm, 320 μm from VZ surface) and dividing 76° relative to the 1′ fiber (open white arrowheads).
Because ferret oRGs did not always possess a basally oriented fiber (Fig. 3C–E), the fiber along which the progenitor translocated during MST was referred to as the primary (1′) fiber. Although oRGs exhibited variation in division angle with respect to the VZ surface, 96% of MST divisions in the iSVZ and 99% of MST divisions in the oSVZ had a division angle that was perpendicular (60–90°) to the 1′ fiber (Fig. 3B). These data are consistent with oRG divisions in human cortical slices and in dissociated human fetal cortex, further supporting the role of intrinsic mechanisms regulating 1′ fiber inheritance and spindle orientation (LaMonica et al., 2013).
Ferret oRG fibers are dynamic and do not always contact the pial surface
Similar to vRGs, data in mouse, human, and ferret suggest that the 1′ fiber of oRGs maintains contact with the basal lamina throughout the cell cycle and exhibits varicosities during M phase (Fietz et al., 2010; Hansen et al., 2010; Wang et al., 2011). Although this appeared to be the case for a subset of oRG divisions in the ferret (Fig. 1C,D; Fietz et al., 2010; Reillo and Borrell, 2012), we observed several instances where the 1′ fiber of the oRG completely retracted during mitosis. An example of this is shown in Figure 4A. As the soma of the oRG begins to translocate toward the 1′ fiber, the fiber begins to retract, and is completely retracted at the time of division. Interestingly, the division angle remains perpendicular (60–90°) to the orientation of the original 1′ fiber even though it has retracted. Upon cytokinesis, both the basal and apical daughters exhibit process outgrowths that increase in length over time. In addition to retraction of the 1′ fiber during mitosis, we also observed oRGs that exhibited retraction of a non-1′ fiber. Similar to the human (LaMonica et al., 2013) and macaque (Bayatti et al., 2008), we found examples of ferret oRG cells, which in addition to a 1′ fiber, possessed a non-1′ fiber that varied in length from 8 to 97 μm. As shown in Figure 4B, an oRG possesses a non-1′ apical fiber that is retracted during basal MST, after which the apical daughter regrows an apically directed fiber. These data suggest that maintenance of the 1′ fiber is not required for oRG proliferation, one of the oRG daughters does not always inherit the 1′ fiber, and oRG fibers can exhibit a variety of behaviors during mitosis.
Figure 4.

oRG fibers are dynamic during the cell cycle and do not always contact the pial surface. Time-lapse stills of progenitors labeled with AV-GFP in P3 ferret cortical slices. Time elapsed from start of imaging indicated in the top right of image (yellow = division). Basal daughter indicated with closed white arrowhead and apical daughter with closed yellow arrowhead. White arrow indicates the direction of MST. VZ surface is down. Scale bars, 20 μm. A, An oRG (closed white arrowhead, 281 μm from VZ surface) exhibits retraction of the basal, 1′ fiber (open white arrowheads, 125.8 μm) during MST (32 μm), which then regrows after cytokinesis. A corresponding z-plane analysis of the same time point rotated 90° confirms retraction of the 1′ fiber during mitosis. B, An oRG (closed white arrowhead, 476.7 μm from VZ surface) possesses an apical, non-1′ fiber (open white arrowheads, 62 μm) that retracts during MST (18.3 μm). A corresponding z-plane analysis rotated 90° confirms retraction of the apical fiber during mitosis. C, An oRG (closed white arrowhead, 149 μm from VZ surface) with a basally directed 1′ fiber measuring 297 μm (open white arrowheads) maintains the fiber during MST (9.5 μm). Top, A zoomed-in view of the end of the 1′ fiber revealing a growth cone that is motile and dynamic during the cell cycle.
The retraction of the 1′ fiber during MST (Fig. 4A), along with the observation of 1′ fibers that are not basally directed (Fig. 3C,E), corroborate findings in cultured human fetal cortex that oRGs do not need to be in contact with the basal lamina to divide (LaMonica et al., 2013). Further evidence suggesting that not all oRG fibers contact the pial surface comes from the observation of growth cones and filopodia-like processes at the end of oRG 1′ fibers. These growth cones could be found at the end of 1′ fibers that did not retract during MST (Fig. 4C). Similar to descriptions of mouse vRG basal fiber end feet near the pial surface (Yokota et al., 2010), growth cones of oRG 1′ fibers were motile and displayed various morphologies. They also exhibited dynamic behaviors throughout the cell cycle, including retraction at the time of cell division (Fig. 4B).
We have identified diverse behaviors of oRG cells in the developing ferret cortex. Many distinguishing features of oRGs to date, including location in the SVZ, MST mode of division, and presence of a basal fiber that is maintained during mitosis, are not features shared by all oRGs.
Human oRGs exhibit diverse behaviors similar to the ferret
Upon observing a range of oRG behaviors in the ferret, we further investigated the developing human cortex to see whether these oRG characteristics were present in primate species. Human cortical slices were labeled with AV-GFP and imaged using time-lapse confocal microscopy. Although we did not observe stationary oRG divisions at gestational week (GW) 17.5–18 (0/71), we found examples of MST divisions occurring within the human VZ. As illustrated in Figure 5A, for example, a RG cell undergoes apically directed interkinetic nuclear migration (INM) to reach the VZ surface and then initiates MST to divide at the basal region of the VZ with a horizontal angle (3°) with respect to the VZ surface. The basal daughter inherits the basal fiber and migrates away from the VZ, whereas the apical daughter remains in the VZ region. Of 57 divisions where the RG cell was located near the VZ surface, eight exhibited MST, with an average length of 76.2 μm. Similar to the ferret (Fig. 2), all of these MST divisions were at a horizontal angle (0–30°) with respect to the VZ surface. This suggests that in addition to the SVZ, MST divisions in the human can also occur within the VZ.
Figure 5.

Human oRGs exhibit diverse behaviors similar to the ferret. Time-lapse stills of progenitors labeled with AV-GFP in human cortical slices from GW 16 (A) and 18 (C–E). Time elapsed from start of imaging indicated in the top right of image (yellow = division). White arrow indicates the direction of MST. VZ surface is down and denoted by a dotted line. Scale bars, 20 μm. A, A vRG (closed white arrowhead) undergoes INM to reach the VZ surface followed by basal MST (64 μm), dividing with a horizontal division angle (3° with respect to VZ surface) to produce a basal (closed white arrowhead) and apical daughter (closed yellow arrowhead). Schematic of time-lapse series is shown on the right. B, Schematic and quantification of cells undergoing MST with horizontal (0–30°, green), oblique (30–60°, red), and vertical (60–90°, blue) division angles with respect to the adjacent fiber scaffold (n = 71). C, A progenitor (open white arrowhead) undergoes MST (29 μm) and divides with a 30° angle with respect to the radial fiber scaffold (yellow line). D, An oRG (closed white arrowhead) displays retraction of the 1′ fiber (open white arrowheads, 103.7 μm) during MST (37.2 μm) after which daughters (closed white and yellow arrowheads) regrow fibers (open white arrowheads). A corresponding z-plane analysis rotated 90° confirms retraction of the 1′ fiber during mitosis. E, An oRG (closed white arrowhead) has a basally directed 1′ fiber (open white arrowheads, 202.7 μm) that ends in a growth cone that is motile and dynamic during MST (125 μm). Top, A zoomed-in view of the growth cone.
Human oRGs within the SVZ could be observed undergoing nonbasally directed MST and dividing with a nonhorizontal angle with respect to the VZ surface. Surprisingly, we found that 9.9% of human MST divisions in the SVZ at GW 17.5–18 were apically directed. Due to the thickness of the human cortex at this age, it was not possible to measure oRG division angle with respect to the VZ surface. Therefore, we measured oRG division angle with respect to the adjacent radial fiber scaffold and found that the majority of oRGs (77%) divided at a perpendicular angle (60–90°), while 20% and 3% divided at an oblique (30–60°) and parallel (0–30°) angle, respectively (Fig. 5B). An example of an oRG dividing with a nonperpendicular cleavage angle with respect to the radial fiber scaffold is shown in Figure 5C. Because the VZ surface in primates is approximately at right angles relative to the radial fiber scaffold (Rakic, 1971), we concluded that the majority of oRGs (77%) in the human SVZ divide with a horizontal angle with respect to the VZ surface, whereas fewer divide with an oblique (20%) and vertical angle (3%). Only 23% of human oRGs divided nonhorizontally with respect to the VZ surface, compared with an average of 43% of ferret oRGs, suggesting that ferret oRGs display a greater variation in division angle, which could be the result of 1′ oRG fibers in the ferret being less radial compared with the human.
Similar to the ferret, the 1′ fiber of human oRGs does not always contact the pial surface. As shown in Figure 5D, we observed oRG divisions in which the 1′ fiber fully retracted during mitosis and then regrew after cytokinesis. We also observed growth cones at the end of oRG 1′ fibers located within the SVZ. Similar to the ferret, these growth cones could be found on the end of 1′ fibers that did not retract during mitosis (Fig. 5E). Together, these data demonstrate that diverse and dynamic oRG behaviors are not unique to the ferret and can also be found in the developing human neocortex.
Daughters of ferret oRGs undergo multiple rounds of divisions and remain undifferentiated
We next examined the proliferative capacity and daughter cell fates of ferret oRGs. Similar to the human (Hansen et al., 2010), both oRG daughters were able to undergo multiple rounds of division. The “basal” daughter of an MST division, which either inherited the 1′ fiber or regrew one upon retraction (Fig. 3A), was referred to as the primary (1′) daughter. The “apical” daughter of an MST division that did not inherit the 1′ fiber was referred to as the nonprimary (non-1′) daughter. The 1′ and non-1′ daughters had an average cell cycle length of 26.4 h (n = 10) and 25.5 h (n = 10), respectively. Of 11 examples where the 1′ daughter of an oRG divided a second time, four exhibited a second MST division that was increased in length compared with the initial MST (Fig. 6A), four exhibited a second MST division that was decreased in length compared with the initial MST, and three underwent a second division that was stationary (Fig. 6B). Interestingly, in 3/11 examples, the oRG daughter migrated basally >100 μm before undergoing a subsequent division (Fig. 6A). We observed three consecutive MST divisions by a 1′ oRG daughter; however, limitations of slice culture prevented further cell cycles from being observed (Movie 3). We also documented 11 examples where the non-1′ daughter of an oRG divided a second time. Of these, four exhibited a second MST division that ranged in length from 6.3 to 17.9 μm, with two of these being a greater distance compared with the initial MST (Fig. 6C). The remaining seven underwent a second division that was stationary (Fig. 6D).
Figure 6.

oRG daughters can undergo multiple rounds of divisions. Time-lapse stills of progenitors labeled with AV-GFP in P3 ferret cortical slices along with schematics illustrating the divisions shown in the time-lapse series (D = daughter). Time elapsed from start of imaging indicated in the top right of image (yellow = division). White arrow indicates direction of MST. VZ surface is down. Scale bars, 20 μm. A, The 1′ daughter (closed white arrowhead) from an MST division (18 μm) during which the 1′ fiber (open white arrowheads) is retracted, migrates basally (105 μm) and undergoes a second MST division (25 μm) with fiber retraction. B, The 1′ daughter (closed white arrowhead) of an MST division (28 μm), during which the 1′ fiber (open white arrowheads) is retracted, undergoes a second stationary division where the 1′ fiber is maintained (open white arrowheads). C, The non-1′ daughter (closed yellow arrowhead) of an MST division (13 μm), during which the 1′ fiber is retracted (open white arrowheads), regrows a basal fiber (open white arrowheads), and undergoes a second MST division (18 μm) with apparent fiber retraction. D, The non-1′ daughter (closed yellow arrowhead) of an MST division (32 μm), during which the 1′ fiber is retracted (open white arrowheads), regrows a basal fiber, and undergoes a second stationary division where the 1′ fiber is maintained (open white arrowheads).
Ferret oRGs undergo multiple rounds of self-renewing divisions. In this time-lapse series, SVZ progenitors were labeled with AV-GFP in P3 ferret cortical slices. An oRG (yellow circle) with a basally oriented primary fiber undergoes MST (49 μm) to produce a 1′ and non-1′ daughter (yellow circles). Shortly thereafter, another oRG (pink circle) with a basally oriented primary fiber undergoes MST (17.2 μm) to produce a 1′ and non-1′ daughter (pink circles). Both 1′ oRG daughters that retained the primary fiber then undergo a second MST division (yellow circle, 10.1 μm; pink circle, 13.2 μm). The basal, 1′ daughters from these second MST divisions then undergo a third MST division (yellow circle, 12 μm; pink circle, 8.9 μm). From the original, first MST divisions, one of the non-1′ oRG daughters undergoes a stationary division (yellow circle), whereas the other non-1′ oRG daughter undergoes a small MST division (pink circle, 6.1 μm).
These data suggest that fiber inheritance is not required for maintenance of proliferative capacity, and that although both oRG daughters can persist as progenitors, the 1′ daughter appears more likely to undergo a second MST division (8/11) compared with the non-1′ daughter (4/11). Some oRG daughters may have become committed progenitors, such as IPCs or glial progenitors, both of which do not appear to exhibit MST. However, because not all ferret oRGs undergo MST (Fig. 1D), it is also possible that both daughters remained oRGs. Fate staining after time-lapse imaging was used to address these possibilities.
All fate-stained oRG 1′ (closed white arrowheads, 37/37) and non-1′ daughters (closed yellow arrowheads, 34/34) continued to express the neural progenitor marker Sox2, although none expressed the upper layer neuronal marker Satb2 (0/20; Fig. 7A), or the early neuronal marker HuC/D (0/12, data not shown). Although we observed oRG daughters migrating radially (Fig. 7A), a behavior reminiscent of newborn neurons, ferret oRGs do not appear to make neurons directly. To determine the types of progenitors produced by ferret oRGs, slices were stained for Tbr2 and Olig2, IPC, and oligodendrocyte progenitor markers, respectively, following time-lapse imaging. Because astrocytes do not appear within the SVZ until P6 or later (Reillo and Borrell, 2012), we did not fate stain for this lineage. None of the oRG daughters expressed Olig2 (0/31; Fig. 7B). Only 1 of 22 1′ oRG daughters and 1 of 20 non-1′ oRG daughters expressed Tbr2 (Fig. 7B). Similar results were obtained for the daughters of stationary oRG divisions in which the 1′ fiber was basally directed and did not retract during mitosis. Specifically, both daughters expressed Sox2 (8/8), whereas none expressed Olig2 (0/8) or Tbr2 (0/6) (Fig. 7C).
Figure 7.

The majority of oRG daughters remain undifferentiated. Time-lapse stills of progenitors labeled with AV-GFP in P3 (A–C) or E39 (D) ferret cortical slices. Time elapsed from start of imaging indicated in the top right of image (yellow = division), with fate stains performed at 66:50 (A–C) or 50:00 (D). 1′ fiber indicated with open white arrowheads. White arrow indicates the direction of MST. Basal (1′) daughter indicated with closed white arrowhead and apical (non-1′) daughter with closed yellow arrowhead. VZ surface is down. Scale bars, 20 μm. A, An oRG (closed white arrowhead) undergoes MST (68 μm) to produce a basal and apical daughter. Boxed regions indicate the location of the daughters at the end of time-lapse imaging. Fate staining reveals that both GFP+ daughters are Sox2+Satb2−. B, An oRG (closed white arrowhead) undergoes MST (11.2 μm) to produce a basal and apical daughter. Boxed region indicates the location of the daughters at the end of time-lapse imaging. Fate staining reveals that both GFP+ daughters are Sox2+ Tbr2− Olig2−. C, An oRG (closed white arrowhead) undergoes a stationary division to produce a basal and apical daughter. Fate staining reveals that GFP+ progeny are Sox2+ Tbr2− Olig2−. D, An oRG (closed white arrowhead) undergoes MST (12.3 μm) to produce a basal and apical daughter. Boxed region indicates the location of the daughters at the end of time-lapse imaging. Fate staining reveals that both GFP+ daughters are Sox2+ Tbr2− Olig2−.
oRG cells may undergo multiple self-renewing divisions before producing differentiated progenitors and/or the onset of Tbr2 and Olig2 expression may require longer times in culture. Therefore, we stained oRG daughters that had undergone multiple rounds of division. After two rounds of division, daughters expressed Sox2 (20/20) but not Tbr2 (0/12) or Olig2 (0/12). It is also possible that oRGs produce differentiated cells only at earlier stages of neurogenesis. Therefore, we analyzed the marker expression profile of daughters produced by oRGs at E39, which corresponds to the peak of layer IV production. All of the E39 oRG daughters expressed Sox2 (25/25), whereas only 1 of 25 expressed Tbr2, and none expressed Olig2 (0/25) (Fig. 7D). Together, these results suggest that ferret oRGs undergo several rounds of proliferative divisions to expand the progenitor population, do not give rise to postmitotic neurons or glial progenitors directly, and have the ability to produce neuronal progenitors.
Discussion
Although we are only beginning to uncover mechanisms contributing to the evolutionary expansion and gyrification of the mammalian cortex, recent studies have focused on the contribution of embryonic germinal zones. Specifically, the SVZ is expanded in gyrencephalic species and contains the newly characterized oRG cells, which in addition to IPCs, contribute to neurogenesis in mouse and human (Lui et al., 2011). However, there is not a direct association between SVZ size and oRG abundance with degree of gyrification. Specifically, the lissencephalic mouse has a modest population of oRGs (Shitamukai et al., 2011; Wang et al., 2011), whereas the near-lissencephalic marmoset has an expanded SVZ with abundant oRGs (García-Moreno et al., 2012; Kelava et al., 2012). Although oRG numbers do not predict cortical topography, it is possible that their dynamic behaviors, including proliferative potential and daughter identities, help determine adult cortical structure. Therefore, it is important to assess these features in a range of gyrencephalic and lissencephalic species.
In the present study, we used time-lapse imaging to analyze progenitor behaviors in the ferret, a gyrencephalic carnivore with an expanded SVZ. We found that during upper layer cortical neurogenesis, a third of SVZ divisions exhibit MST, a mode of division that was first identified in the human and is unique to oRG progenitors (Hansen et al., 2010). Mean MST length in the human cortex (Hansen et al., 2010) was nearly three times as large as in the ferret. We also observed several oRG-like divisions, where the basal fiber was maintained during mitosis and inherited by the basal daughter, but which lacked a distinct MST, suggesting that ferret oRGs can undergo stationary divisions. It would be interesting to determine the prevalence of stationary divisions in other species, and to address variations in MST length as a function of age.
Originally, oRGs were described in the oSVZ, but they are now known to exist in the mouse, a species that lacks an elaborate oSVZ, and in the iSVZ and oSVZ of the ferret and marmoset (García-Moreno et al., 2012; Kelava et al., 2012; Reillo and Borrell, 2012). We found that the majority of ferret MST divisions occur within the iSVZ, with oRGs dividing closer to the VZ surface tending to exhibit greater MST lengths. However, static marker expression analyses in the ferret predict that a larger percentage of oRGs reside in the oSVZ compared with the iSVZ (Reillo and Borrell, 2012). Therefore, our data suggest that oRGs located within the oSVZ have a greater tendency to undergo stationary divisions. Interestingly, ∼7% of ferret MST divisions observed occurred within the VZ region. This is in agreement with a recent study, in which subapically dividing RGs in the ventral telencephalon of the mouse exhibited MST (Pilz et al., 2013), suggesting that oRG divisions can occur in all three proliferative zones.
In both human and mouse, vRGs have been shown to produce oRGs via horizontal divisions (Shitamukai et al., 2011; Wang et al., 2011; LaMonica et al., 2013). According to fixed image analyses in the ferret, the majority of VZ divisions at P6 are horizontal, suggesting a significant production of oRGs (Chenn and McConnell, 1995; Reillo and Borrell, 2012). Our time-lapse data corroborate these findings as the vast majority of vRG divisions were at an oblique (30–60°) or horizontal (0–30°) angle and produced a basal daughter that inherited the basal fiber, migrated away from the VZ surface, and expressed Sox2, indicative of oRG fate. Surprisingly, in both the ferret and human we observed RG cells at the VZ surface that underwent MST and divided with a horizontal angle to produce a basal daughter with oRG characteristics. Although it is possible that oRGs generated from vRGs remain within the VZ where they divide via MST, INM often preceded MST divisions at the VZ surface. Therefore, it is likely that vRGs can become untethered from the apical domain and undergo MST to produce a basal oRG daughter. Whether the apical daughter of such an MST division is able to anchor within the adherens junction belt and assume a vRG identity or remains delaminated from the VZ surface is unknown. These data further support a close relationship between vRGs and oRGs, and suggest that association with adherens junctions may determine whether RG cells divide via INM or MST.
In our time-lapse analysis of ferret MST divisions, 43% exhibited a nonhorizontal division angle relative to the VZ surface. This is in contrast to the primate, where only 23% of oRG divisions in the human and ∼20% in the macaque (Betizeau et al., 2013) were nonhorizontal. The primate has a predominantly straight radial fiber scaffold running through the SVZ to the cortical plate, whereas the ferret has a more fanned array of radial fibers (Reillo et al., 2011; Borrell and Reillo, 2012). Ferret oRG fibers may exhibit greater curvature and less radial orientation causing more variable division angles as the cell translocates along the fiber during mitosis. This may also contribute to the greater tangential dispersion of clonally related neurons that has been described in the ferret (Reid et al., 1997) compared with the primate cortex (Kornack and Rakic, 1995), resulting in species differences in cortical organization. Despite this variation, ferret oRGs consistently divide at a perpendicular angle with respect to the primary fiber (along which the cell translocates), which is in agreement with recent data from both dissociated cultures and slices of human cortex (LaMonica et al., 2013). The primary fibers of oRG cells do not always contact the pial surface, and some retract during mitosis, suggesting that similar to vRGs (Haubst et al., 2006), contact with the basal lamina is not required for oRG proliferation. However, possible regulation of oRGs by signals from other sources, such as neighboring cells and blood vessels, remains unknown.
Human oRGs undergo multiple rounds of self-renewing divisions with the basal daughter maintaining oRG identity and the apical daughter adopting IPC or oRG fate (Hansen et al., 2010). Similar to the human, we found that ferret oRGs undergo multiple rounds of divisions, with 73% of basal (primary) daughters and 36% of apical (nonprimary) daughters dividing via MST in the subsequent division. Because not all ferret oRGs exhibit MST, some of the apical oRG daughters that underwent stationary divisions may have nonetheless adopted oRG fate. This interpretation is supported by fate-staining analysis, as the vast majority of oRG daughters expressed Sox2 but not Satb2, HuC/D, Olig2, or Tbr2. Therefore, oRGs that exhibit stationary divisions and whose primary fiber does not contact the pial surface are likely oRG apical daughters that adopted oRG fate. Together, these results suggest that ferret oRGs exhibit similar proliferative potential to human oRGs; however, they appear to produce IPCs less frequently (Hansen et al., 2010; Table 1).
Table 1.
Comparison of post-time-lapse oRG daughter cell fates between ferret and human
| Species | Agea | Fate stain |
|
|---|---|---|---|
| Sox2 + Tbr2− | Sox2 ± Tbr2+ | ||
| Human | GW15.5 | 76.5% (13/17) | 23.5% (4/17) |
| Ferret | P3 | 95.2% (40/42) | 4.8% (2/42) |
| Ferret | E39 | 96% (24/25) | 4% (1/25) |
Human and ferret slices were labeled with AV-GFP, imaged for several days, and then immunohistochemistry performed to determine oRG daughter cell fates. The Sox2 + Tbr2− population represents daughters of oRG MST divisions that remained non-neurogenic progenitors, whereas the Sox2± Tbr2+ population represents neurogenic IPCs generated from oRG MST divisions.
aAge of cortical slice preparation. Human GW15.5 corresponds to the end of layer V neurogenesis (Hansen et al., 2010), whereas ferret E39 corresponds to the peak of layer IV production, and P3 is the peak of layer II/III neurogenesis.
These data highlight diversity within the ferret and human oRG populations in terms of location, morphology including fiber orientation, and mitotic dynamics (Fig. 8). Despite this heterogeneity, oRGs express a common set of markers (Sox2+, Tbr2−, Olig2−), possess a primary fiber, and display a consistent division angle determined by primary fiber orientation. Morphological variation within the oRG population has recently been documented in the macaque cortex (Betizeau et al., 2013) and in the ventral telencephalon of the mouse (Pilz et al., 2013). For example, a subapically dividing bipolar RG cell was described that possesses both an apical and basal process and appears to be more abundant in gyrencephalic species. In this study, we also observed bipolar ferret oRG-like cells; however, we found that both apical and basal fibers could rapidly retract during mitosis, suggesting that oRG morphology can undergo cell cycle-related changes. These rapid morphological changes could have been missed with longer imaging intervals.
Figure 8.
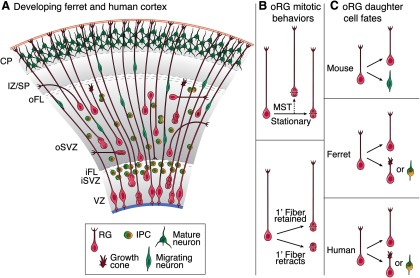
Model of diverse oRG behaviors and daughter cell fates during cortical development. A, During neurogenesis in both the ferret and human, MST divisions can occur throughout the VZ and the SVZ and oRGs exhibit diverse morphologies. Specifically, 1′ fibers do not always contact the pial surface, with some ending in motile growth cones within the SVZ. Moreover, not all oRG 1′ fibers are basally oriented, with some exhibiting curved, horizontal, and apical orientations. However, the vast majority of oRGs divide with a perpendicular division angle with respect to the 1′ fiber. B, The mitotic behavior of oRGs also varies. Although some divide via MST, a subset of oRGs undergoes stationary divisions. In addition, although some oRGs maintain their 1′ fiber during mitosis, which displays varicosities during M phase, some oRGs exhibit retraction of the 1′ fiber upon division. C, oRGs in different species can produce daughters with different cell fates. In the lissencephalic mouse, oRGs appear to make neurons directly. In the gyrencephalic ferret, the majority of oRGs undergo divisions to expand the oRG population, while a small percentage of oRGs produce IPCs. Compared with the ferret, human oRGs appear more likely to produce IPCs that divide symmetrically to produce neurons, and also undergo proliferative, oRG-producing divisions.
It has been proposed that differences in progenitor cell process morphology, as well as variation in the location of dividing progenitor cells, may indicate the existence of multiple progenitor subtypes (Betizeau et al., 2013; Pilz et al., 2013). However, in these studies, cells assigned to distinct subtypes were not identified based on unique molecular marker profiles or mitotic behaviors, and many of the progenitor subtypes described share important features with the initially described oRG cells (Fietz et al., 2010; Hansen et al., 2010). Thus, we propose that many or all of these cells belong to a broad progenitor class. Individual cells within this class may transition between locations and phenotypic states, and exhibit differences in proliferative capacity and daughter output as they age. Single-cell gene expression studies may enable a more accurate subclassification of the SVZ progenitor populations, linking molecular signatures to progenitor cell location, morphology, and/or behavior.
Footnotes
This work was supported by grants from Bernard Osher and the US National Institute of Neurological Disorders and Stroke. We thank William Walantus, Tomasz Nowakowski, and Yingying Wang for technical assistance, and the Kriegstein laboratory members for helpful discussions and critical reading of the paper. We thank the staff at the San Francisco General Hospital for providing access to donated fetal tissue, and the veterinary staff at UCSF for their assistance with ferret handling.
The authors declare no competing financial interests.
References
- Bayatti N, Moss JA, Sun L, Ambrose P, Ward JF, Lindsay S, Clowry GJ. A molecular neuroanatomical study of the developing human neocortex from 8 to 17 postconceptional weeks revealing the early differentiation of the subplate and subventricular zone. Cereb Cortex. 2008;18:1536–1548. doi: 10.1093/cercor/bhm184. [DOI] [PMC free article] [PubMed] [Google Scholar]
- Betizeau M, Cortay V, Patti D, Pfister S, Gautier E, Bellemin-Ménard A, Afanassieff M, Huissoud C, Douglas RJ, Kennedy H, Dehay C. Precursor diversity and complexity of lineage relationships in the outer subventricular zone of the primate. Neuron. 2013;80:442–457. doi: 10.1016/j.neuron.2013.09.032. [DOI] [PubMed] [Google Scholar]
- Borrell V, Reillo I. Emerging roles of neural stem cells in cerebral cortex development and evolution. Dev Neurobiol. 2012;72:955–971. doi: 10.1002/dneu.22013. [DOI] [PubMed] [Google Scholar]
- Chenn A, McConnell SK. Cleavage orientation and the asymmetric inheritance of Notch1 immunoreactivity in mammalian neurogenesis. Cell. 1995;82:631–641. doi: 10.1016/0092-8674(95)90035-7. [DOI] [PubMed] [Google Scholar]
- Dehay C, Kennedy H. Cell-cycle control and cortical development. Nat Rev Neurosci. 2007;8:438–450. doi: 10.1038/nrn2097. [DOI] [PubMed] [Google Scholar]
- Englund C, Fink A, Lau C, Pham D, Daza RA, Bulfone A, Kowalczyk T, Hevner RF. Pax6, Tbr2, and Tbr1 are expressed sequentially by radial glia, intermediate progenitor cells, and postmitotic neurons in developing neocortex. J Neurosci. 2005;25:247–251. doi: 10.1523/JNEUROSCI.2899-04.2005. [DOI] [PMC free article] [PubMed] [Google Scholar]
- Fietz SA, Kelava I, Vogt J, Wilsch-Bräuninger M, Stenzel D, Fish JL, Corbeil D, Riehn A, Distler W, Nitsch R, Huttner WB. OSVZ progenitors of human and ferret neocortex are epithelial-like and expand by integrin signaling. Nat Neurosci. 2010;13:690–699. doi: 10.1038/nn.2553. [DOI] [PubMed] [Google Scholar]
- García-Moreno F, Vasistha NA, Trevia N, Bourne JA, Molnár Z. Compartmentalization of cerebral cortical germinal zones in a lissencephalic primate and gyrencephalic rodent. Cereb Cortex. 2012;22:482–492. doi: 10.1093/cercor/bhr312. [DOI] [PubMed] [Google Scholar]
- Hansen DV, Lui JH, Parker PR, Kriegstein AR. Neurogenic radial glia in the outer subventricular zone of human neocortex. Nature. 2010;464:554–561. doi: 10.1038/nature08845. [DOI] [PubMed] [Google Scholar]
- Haubensak W, Attardo A, Denk W, Huttner WB. Neurons arise in the basal neuroepithelium of the early mammalian telencephalon: a major site of neurogenesis. Proc Natl Acad Sci U S A. 2004;101:3196–3201. doi: 10.1073/pnas.0308600100. [DOI] [PMC free article] [PubMed] [Google Scholar]
- Haubst N, Georges-Labouesse E, De Arcangelis A, Mayer U, Götz M. Basement membrane attachment is dispensable for radial glial cell fate and for proliferation, but affects positioning of neuronal subtypes. Development. 2006;133:3245–3254. doi: 10.1242/dev.02486. [DOI] [PubMed] [Google Scholar]
- Jackson CA, Peduzzi JD, Hickey TL. Visual cortex development in the ferret: I. Genesis and migration of visual cortical neurons. J Neurosci. 1989;9:1242–1253. doi: 10.1523/JNEUROSCI.09-04-01242.1989. [DOI] [PMC free article] [PubMed] [Google Scholar]
- Kelava I, Reillo I, Murayama AY, Kalinka AT, Stenzel D, Tomancak P, Matsuzaki F, Lebrand C, Sasaki E, Schwamborn JC, Okano H, Huttner WB, Borrell V. Abundant occurrence of basal radial glia in the subventricular zone of embryonic neocortex of a lissencephalic primate, the common marmoset Callithrix jacchus. Cerebral cortex. 2012;22:469–481. doi: 10.1093/cercor/bhr301. [DOI] [PMC free article] [PubMed] [Google Scholar]
- Kornack DR, Rakic P. Radial and horizontal deployment of clonally related cells in the primate neocortex: relationship to distinct mitotic lineages. Neuron. 1995;15:311–321. doi: 10.1016/0896-6273(95)90036-5. [DOI] [PubMed] [Google Scholar]
- Kriegstein A, Noctor S, Martínez-Cerdeño V. Patterns of neural stem and progenitor cell division may underlie evolutionary cortical expansion. Nat Rev Neurosci. 2006;7:883–890. doi: 10.1038/nrn2008. [DOI] [PubMed] [Google Scholar]
- LaMonica BE, Lui JH, Hansen DV, Kriegstein AR. Mitotic spindle orientation predicts outer radial glial cell generation in human neocortex. Nat Commun. 2013;4:1665. doi: 10.1038/ncomms2647. [DOI] [PMC free article] [PubMed] [Google Scholar]
- Lui JH, Hansen DV, Kriegstein AR. Development and evolution of the human neocortex. Cell. 2011;146:18–36. doi: 10.1016/j.cell.2011.06.030. [DOI] [PMC free article] [PubMed] [Google Scholar]
- Lukaszewicz A, Savatier P, Cortay V, Giroud P, Huissoud C, Berland M, Kennedy H, Dehay C. G1 phase regulation, area-specific cell cycle control, and cytoarchitectonics in the primate cortex. Neuron. 2005;47:353–364. doi: 10.1016/j.neuron.2005.06.032. [DOI] [PMC free article] [PubMed] [Google Scholar]
- Martínez-Cerdeño V, Cunningham CL, Camacho J, Antczak JL, Prakash AN, Cziep ME, Walker AI, Noctor SC. Comparative analysis of the subventricular zone in rat, ferret and macaque: evidence for an outer subventricular zone in rodents. PloS one. 2012;7:e30178. doi: 10.1371/journal.pone.0030178. [DOI] [PMC free article] [PubMed] [Google Scholar]
- Miyata T, Kawaguchi A, Saito K, Kawano M, Muto T, Ogawa M. Asymmetric production of surface-dividing and non-surface-dividing cortical progenitor cells. Development. 2004;131:3133–3145. doi: 10.1242/dev.01173. [DOI] [PubMed] [Google Scholar]
- Molnár Z. Evolution of cerebral cortical development. Brain, behavior and evolution. 2011;78:94–107. doi: 10.1159/000327325. [DOI] [PubMed] [Google Scholar]
- Noctor SC, Martínez-Cerdeño V, Ivic L, Kriegstein AR. Cortical neurons arise in symmetric and asymmetric division zones and migrate through specific phases. Nat Neurosci. 2004;7:136–144. doi: 10.1038/nn1172. [DOI] [PubMed] [Google Scholar]
- Pilz GA, Shitamukai A, Reillo I, Pacary E, Schwausch J, Stahl R, Ninkovic J, Snippert HJ, Clevers H, Godinho L, Snippert HJ, Clevers H, Godinho L, Guillemot F, Borrell V, Matsuzaki F, Götz M. Amplification of progenitors in the mammalian telencephalon includes a new radial glial cell type. Nat Commun. 2013;4:2125. doi: 10.1038/ncomms3125. [DOI] [PMC free article] [PubMed] [Google Scholar]
- Rakic P. Guidance of neurons migrating to the fetal monkey neocortex. Brain Res. 1971;33:471–476. doi: 10.1016/0006-8993(71)90119-3. [DOI] [PubMed] [Google Scholar]
- Reid CB, Tavazoie SF, Walsh CA. Clonal dispersion and evidence for asymmetric cell division in ferret cortex. Development. 1997;124:2441–2450. doi: 10.1242/dev.124.12.2441. [DOI] [PubMed] [Google Scholar]
- Reillo I, Borrell V. Germinal zones in the developing cerebral cortex of ferret: ontogeny, cell cycle kinetics, and diversity of progenitors. Cereb Cortex. 2012;22:2039–2054. doi: 10.1093/cercor/bhr284. [DOI] [PubMed] [Google Scholar]
- Reillo I, de Juan Romero C, García-Cabezas MÁ, Borrell V. A role for intermediate radial glia in the tangential expansion of the mammalian cerebral cortex. Cereb Cortex. 2011;21:1674–1694. doi: 10.1093/cercor/bhq238. [DOI] [PubMed] [Google Scholar]
- Shitamukai A, Konno D, Matsuzaki F. Oblique radial glial divisions in the developing mouse neocortex induce self-renewing progenitors outside the germinal zone that resemble primate outer subventricular zone progenitors. J Neurosci. 2011;31:3683–3695. doi: 10.1523/JNEUROSCI.4773-10.2011. [DOI] [PMC free article] [PubMed] [Google Scholar]
- Smart IH, Dehay C, Giroud P, Berland M, Kennedy H. Unique morphological features of the proliferative zones and postmitotic compartments of the neural epithelium giving rise to striate and extrastriate cortex in the monkey. Cereb Cortex. 2002;12:37–53. doi: 10.1093/cercor/12.1.37. [DOI] [PMC free article] [PubMed] [Google Scholar]
- Wang X, Tsai JW, LaMonica B, Kriegstein AR. A new subtype of progenitor cell in the mouse embryonic neocortex. Nat Neurosci. 2011;14:555–561. doi: 10.1038/nn.2807. [DOI] [PMC free article] [PubMed] [Google Scholar]
- Yokota Y, Eom TY, Stanco A, Kim WY, Rao S, Snider WD, Anton ES. Cdc42 and Gsk3 modulate the dynamics of radial glial growth, inter-radial glial interactions and polarity in the developing cerebral cortex. Development. 2010;137:4101–4110. doi: 10.1242/dev.048637. [DOI] [PMC free article] [PubMed] [Google Scholar]
- Zecevic N, Chen Y, Filipovic R. Contributions of cortical subventricular zone to the development of the human cerebral cortex. J Comp Neurol. 2005;491:109–122. doi: 10.1002/cne.20714. [DOI] [PMC free article] [PubMed] [Google Scholar]
- Zilles K, Palomero-Gallagher N, Amunts K. Development of cortical folding during evolution and ontogeny. Trends Neurosci. 2013;36:275–284. doi: 10.1016/j.tins.2013.01.006. [DOI] [PubMed] [Google Scholar]
Associated Data
This section collects any data citations, data availability statements, or supplementary materials included in this article.
Supplementary Materials
Ferret oRGs undergo MST and stationary divisions. In this time-lapse series, SVZ progenitors were labeled with AV-GFP in P3 ferret cortical slices. An oRG (yellow circle) with a basally oriented primary fiber divides via MST (12 μm). Next, an oRG, (pink circle) with a curved primary fiber that is basally oriented (white arrowheads), maintains the fiber during mitosis and undergoes a stationary division. This oRG cell has a dynamic growth cone at the end of the primary fiber.
RG cells within the ferret VZ divide both at the VZ surface and subapically. In this time-lapse series, VZ progenitors were labeled with AV-GFP in P3 ferret cortical slices. An RG cell (pink circle) undergoes MST (20 μm) and divides at a subapical position with a horizontal angle with respect to the VZ surface. Next, a nearby RG cell (yellow circle) divides at the VZ surface, followed by another RG cell (orange circle) dividing at the VZ surface.
Ferret oRGs undergo multiple rounds of self-renewing divisions. In this time-lapse series, SVZ progenitors were labeled with AV-GFP in P3 ferret cortical slices. An oRG (yellow circle) with a basally oriented primary fiber undergoes MST (49 μm) to produce a 1′ and non-1′ daughter (yellow circles). Shortly thereafter, another oRG (pink circle) with a basally oriented primary fiber undergoes MST (17.2 μm) to produce a 1′ and non-1′ daughter (pink circles). Both 1′ oRG daughters that retained the primary fiber then undergo a second MST division (yellow circle, 10.1 μm; pink circle, 13.2 μm). The basal, 1′ daughters from these second MST divisions then undergo a third MST division (yellow circle, 12 μm; pink circle, 8.9 μm). From the original, first MST divisions, one of the non-1′ oRG daughters undergoes a stationary division (yellow circle), whereas the other non-1′ oRG daughter undergoes a small MST division (pink circle, 6.1 μm).