Abstract
BACKGROUND
Urinary albumin excretion is a sensitive diagnostic and prognostic marker for renal disease. Therefore, measurement of urinary albumin must be accurate and precise. We have developed a method to quantify intact urinary albumin with a low limit of quantification (LOQ).
METHODS
We constructed an external calibration curve using purified human serum albumin (HSA) added to a charcoal-stripped urine matrix. We then added an internal standard, 15N-labeled recombinant HSA (15NrHSA), to the calibrators, controls, and patient urine samples. The samples were reduced, alkylated, and digested with trypsin. The concentration of albumin in each sample was determined by liquid chromatography–tandem mass spectrometry (LC-MS/MS) and linear regression analysis, in which the relative abundance area ratio of the tryptic peptides 42LVNEVTEFAK51 and 526QTALVELVK534 from albumin and 15NrHSA were referenced to the calibration curve.
RESULTS
The lower limit of quantification was 3.13 mg/L, and the linear dynamic range was 3.13–200 mg/L. Replicate digests from low, medium, and high controls (n = 5) gave intraassay imprecision CVs of 2.8%–11.0% for the peptide 42LVNEVTEFAK51, and 1.9%–12.3% for the 526QTALVELVK534 peptide. Interassay imprecision of the controls for a period of 10 consecutive days (n = 10) yielded CVs of 1.5%–14.8% for the 42LVNEVTEFAK51 peptide, and 6.4%–14.1% for the 526QTALVELVK534 peptide. For the 42LVNEVTEFAK51 peptide, a method comparison between LC-MS/MS and an immunoturbidometric method for 138 patient samples gave an R2 value of 0.97 and a regression line of y = 0.99x + 23.16.
CONCLUSIONS
Urinary albumin can be quantified by a protein cleavage LC-MS/MS method using a 15NrHSA internal standard. This method provides improved analytical performance in the clinically relevant range compared to a commercially available immunoturbidometric assay.
The accurate and precise measurement of urinary albumin excretion is important in clinical medicine because even modest increases in albuminuria predict progression of renal disease as well as cardiovascular morbidity (1–3). Standardization of assays for this analyte will improve the management of patients with renal and cardiovascular disease. We previously reported an LC-MS assay for albumin that employed in-source fragmentation and had a limit of quantification of 20 mg/L (4, 5). However, because of the prognostic and diagnostic importance of even modest increases in urinary albumin excretion within the normal range, we wanted to improve the limit of quantification (LOQ)6 of the assay in the normoalbuminuric range (<30 mg per 24 h).
Barr and coworkers were among the first to demonstrate that with a mass spectrometer as the detector peptides produced following proteolysis of a protein could be used to quantify the original intact protein (6). This approach to absolute protein quantification has recently increased in popularity since protein cleavage coupled with liquid chromatography–tandem mass spectrometry (LC-MS/MS) has proven viable for the quantification of several proteins (7–13).
We report here that proteolysis of human serum albumin (HSA) followed by LC-MS/MS can be used to quantify intact urinary albumin with a low detection limit. A unique feature of our approach is the use of a full-length recombinant 15N-labeled HSA (15NrHSA) internal standard. Except for mass, this recombinant internal standard is identical to the native protein, and thus it is the ideal internal standard and can account for variations in both the digestion and LC-MS/MS processes. To the best of our knowledge, this is the first report of a full-length purified recombinant 15N-labeled protein being used for absolute quantification by a protein-cleavage LC-MS/MS approach.
Materials and Methods
CALIBRATOR PREPARATION
HSA was purchased from Sigma Aldrich (#A3782) and was reported by the manufacturer to have a purity of approximately 99%. An 8.20 g/L stock solution of HSA was prepared in water. The concentration was determined by ultraviolet absorption spectroscopy with a molar absorptivity of 38533 (mol/L)–1 cm–1 at 280 nm (14). We prepared calibrators by adding the stock solution to a charcoal-stripped urine matrix (SeraCare Life Sciences) and performing serial dilutions to achieve concentrations of 3.13, 6.25, 12.5, 25, 50, 100, and 200 mg/L. Low, medium, and high controls were also prepared by adding the stock to the stripped urine matrix. All calibrators and controls were divided into aliquots and frozen at –80 °C until used.
ANALYSIS OF URINARY ALBUMIN BY AN IMMUNOTURBIDOMETRIC ASSAY
Urinary HSA was measured in the Mayo Clinic Renal Function laboratory using an immunoturbidometric method on a Hitachi 912 chemistry analyzer with the DiaSorin SPQ™ reagent system for microalbumin. The system was calibrated using the above calibrators prepared in charcoal-stripped urine in an attempt to avoid a potential source of assay bias. Samples were centrifuged at 650g for 10 min before chemistry analysis.
PROTEOLYSIS OF CALIBRATORS AND SAMPLES
All digestions were performed using 40 μL of urine, which was diluted with 135 μL of 0.1 mol/L ammonium bicarbonate (Sigma-Aldrich) to normalize sample pH, followed by a 10 μL addition of 161 mg/L stock 15NrHSA internal standard. Details of the 15NrHSA synthesis in Pichia pastoris is provided in the supplemental portion of a previous publication (15). Samples were then reduced by the addition of dithiothreitol (Sigma-Aldrich) at a concentration of 10 mmol/L for 60 min at 60 °C, and alkylated with iodoacetamide (Sigma-Aldrich) at 50 mmol/L for 30 min in the dark at 25 °C. After reduction and alkylation, 5 μL of L-(tosylamido-2-phenyl) ethyl chloromethyl ketone–treated trypsin (Sigma-Aldrich) at 1g/L in 0.1 mol/L ammonium bicarbonate was added, and the sample was digested for 1 h at 37 °C. Following proteolysis, all samples were acidified with 2 μL of concentrated formic acid. The final sample digest volume was 204 μL.
LC-MS/MS
Independent tryptic digests of the HSA calibrators and 15NrHSA were analyzed in the Mayo Clinic Development and Validation Center by LC-MS/MS on a Premier quadrupole time-of-flight mass spectrometer (Waters), which identified and acquired relative abundance data for the digests. A more detailed description of the LC-MS/MS conditions used can be found in a previous publication (16).
The following tryptic peptides were identified by searching a human protein subset of the SwissProt protein database using MS/MS data from the quadrupole–time-of-flight and the protein database search engine Mascot: 13DLGEENFK20, 42LVNEVTEFAK51, 318NYAEAK323, 415VPQVSTPTLVEVSR428, 526QTALVELVK534, and 546AVMDDFAAFVEK557. The peptides 42LVNEVTEFAK51 and 526QTALVELVK534 provided the best signal responses and reproducibility; therefore only data from these peptides are reported. A BLAST search against other human proteins revealed that sequences of the LVNEVTEFAK and QTALVELVK peptides were specific to albumin (HSA Accession # P02768, gi:113576). However, it should be noted that these tryptic peptide sequences are also observed in other mammalian species.
LC-MS/MS CONDITIONS
We performed quantification by LC-MS/MS using a Thermo Scientific Aria TLX2 LC system coupled to an Applied Biosystems API5000 triple-quadrupole mass spectrometer. For each run a total of 20 μL of sample digest was injected onto a 50 × 2.1 mm TARGA C18 column (Higgins Analytical). Chromatography was performed at a flow rate of 250 μL/min. Total run time was 30 min. Mobile phases consisted of solvent A (0.1% formic acid in water) and solvent B (0.1% formic acid in methanol). The chromatographic run started at 5% B for 2 min, followed by a 22-min linear gradient to 95% B, held at 95% B for 2 min, returned to 5% B in 0.5 min, and held there for 3.5 min. The first 5 min of the LC run were sent to waste, and data were collected for the next 16 min, before again diverting the last 9 min of the LC run to waste. The API 5000 instrument source parameters were CAD: 12, CUR: 40, GS1: 20, GS2: 25, IS: 5500, TEM: 600 and EP: 10. The doubly-charged precursor ion for 42LVNEVTEFAK51 at m/z 575.5 was selected in Q1 (DP: 90), and 4 singly charged transitions were monitored in Q3: the a2-ion LV at m/z 185.35 (CE: 31, CXP: 34), the b2-ion LV at m/z 213.4 (CE: 26, CXP: 14), the y5-ion TEFAK at m/z 595.6 (CE: 28, CXP: 44), and the y8-ion NEVTEFAK at m/z 937.6 (CE: 25, CXP: 37). For 526QTALVELVK534 the doubly charged precursor ion at m/z 500.9 was selected in Q1 (DP: 100), and 3 singly charged transitions were monitored in Q3: the y1-ion K at m/z 147.3 (CE: 35, CXP: 9), the y5-ion VELVK at m/z 587.65 (CE: 25, CXP: 35), the y6-ion LVELVK at m/z 700.5 (CE: 24, CXP: 42). All ions were monitored continuously throughout the MS/MS run with a 40 ms dwell time.
Corresponding transitions were monitored for the 15NrHSA internal standard with the appropriate mass shifts: LVNEVTEFAK, Q1 mass shift of +12 and respective mass-shifted Q3 ions; a2-ion +2 (187.16), b2-ion +2 (215.16), y5-ion +6 (601.31), and y8-ion +10 (947.46); QTALVELVK, Q1 mass shift of +10 and respective mass-shifted Q3 ions; y1-ion +2 (149.11), y5-ion +6 (593.38), and y6-ion +7 (707.46). We monitored tryptic peptides from the internal standard 15NrHSA using the same conditions listed above for the native peptides.
STUDY POPULATION
Unused human urine samples from those submitted to the Mayo Clinic Renal Function Laboratory by patients with clinical indications were acquired and separated into 3 groups based on the albumin concentration measured by the immunoturbidometric assay: normoalbuminuric (0–25 mg/L, n = 50), microalbuminuric (25–200 mg/L, n = 50), and macroalbuminuric (>2000 mg/L, n = 38) ranges. All samples were frozen at –80 °C until assayed within 6 months by laboratorians blinded to the initial result. The Mayo Clinic Institutional Review Board approved the use of the above specimens.
LIMIT OF QUANTIFICATION AND LIMIT OF DETECTION
The LOQ for urine albumin was calculated as the response for digested HSA spiked into a charcoal-stripped urine matrix and resulting in a CV <20%. The limit of detection was determined using 3 SDs from the background signal of a zero calibrator digest without the addition of 15NrHSA.
STATISTICAL ANALYSIS
Regression analysis for method comparisons was performed using linear regression analysis along with Passing-Bablok regression analysis, which was generated with the statistical program Analyze-it® version 2.12 (Analyze-it Software).
Results
A prerequisite for performing protein cleavage LC-MS/MS is selection of peptides that provide specificity and adequate response to develop a valid and robust assay. The tryptic peptides 42LVNEVTEFAK51 and 526QTALVELVK534 were chosen on the basis of experimental results from LC-MS/MS data on tryptic digests from the HSA calibrators. Several other tryptic peptides of HSA were examined, specifically 13DLGEENFK20, 318NYAEAK323, 415VPQVSTPTLVEVSR428, and 546AVMDDFAAFVEK557. However, they lacked adequate signal and were not useful for quantification under the conditions employed.
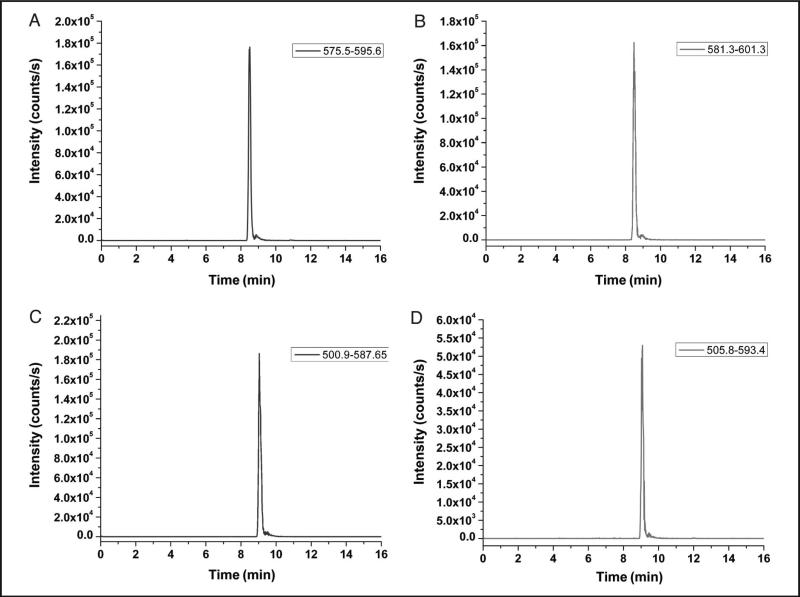
Representative chromatograms for the LVNEVTEFAK and QTALVELVK peptides along with their corresponding 15NrHSA peptides from a 50 mg/L calibrator are provided in Fig. 1. The retention time for the LVNEVTEFAK peptide (plots A and B) was 8.5 min, whereas the QTALVELVK peptide (plots C and D) had an elution time of 9 min.
Fig. 1.
Chromatographic representations of a 50 mg/L calibrator for the native LVNEVTEFAK (575.5–595.6) (A), 15NrHSA analog LVNEVTEFAK (581.3–601.3) (B), native QTALVELVK (500.9–587.7) (C), and 5NrHSA analog QTALVELVK (505.8–593.4) (D) peptides.
We determined the concentration of albumin in patient urine samples by comparing the ratio of the urinary albumin to the peak area to the 15NrHSA internal standard peak area and referencing to an external calibration curve. Calibration curves were determined using linear regression analysis with a 1/x weighting factor on Analyst® software (Applied Biosystems). Representative calibration curves are shown for the LVNEVTEFAK y5-ion and the QTALVELVK y5-ion in Supplemental Fig. 1 of the Data Supplement that accompanies the online version of this article at http://www.clinchem.org/content/vol55/issue6. Intraassay imprecision, determined by using 5 replicates of low, medium, and high controls, yielded CVs <12.4% for both peptides and their corresponding ions (online Supplemental Table 1). Interassay imprecision, determined by surveying calibrators and controls for a 10-day period, yielded CVs <15.2% for all ion pairs of the LVNEVTEFAK and QTALVELVK peptides (online Supplemental Table 2). The LOQ was determined using the calibration imprecision data over the course of 10 days. For all transitions, repeated measurements at 3.13 mg/L (45.1 nmol/L) resulted in CVs <14.1%; at lower concentrations the signal was found to deviate from linearity, and the CVs rose to more than 20%. Accounting for the final sample volume and 20-μL injection, a column load of 176.9 fmol is the absolute LOQ. The limit of detection, determined as 3 SDs of the signal from a zero calibrator digest without the addition of 15NrHSA, was 0.035 mg/L or 2.0 fmol using the same volume and column-loading convention as above. We performed recovery/linearity experiments by spiking a normoalbuminuric sample with stock HSA, and then diluting serially with the sample itself. Each sample and dilution was digested independently. Recovery data, in the clinically relevant range, are summarized in online Supplemental Table 3 along with the linear regression equations and correlation coefficients for each ion pair.
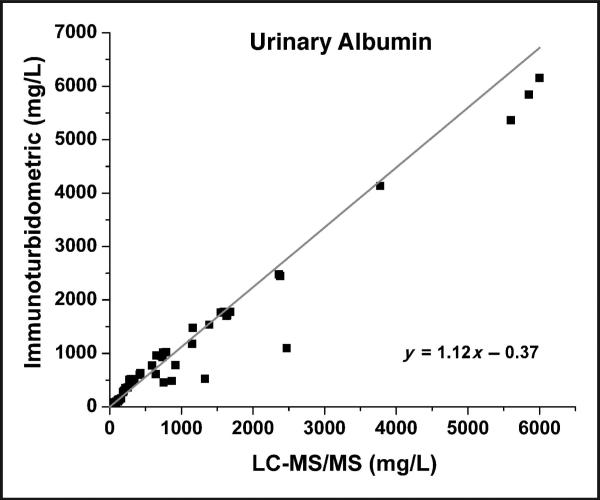
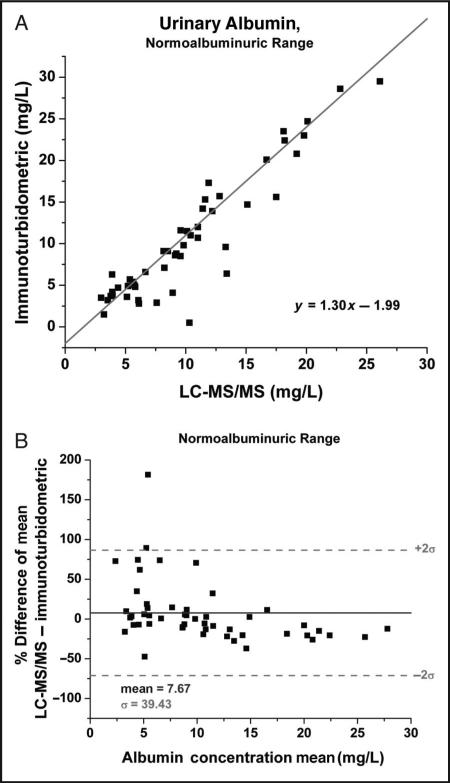
LC-MS/MS results for 138 patient specimens were compared to immunoturbidometric results obtained on a Hitachi 912 chemistry analyzer. A Passing-Bablok comparison plot is shown in Fig. 2 for samples analyzed using the LVNETEFAK peptide ion transition 575.5–595.6. All other transitions along with the data generated from the QTALVELVK peptide transitions were comparable with this representative transition. Comparison data were then divided into the clinically relevant normoalbuminuric and microalbuminuric ranges. In the normoalbuminuric range there appears to be a positive bias (Fig. 3A), which is also observed in the Bland-Altman plot (Fig. 3B). Possible causes of this discrepancy include the curve-fitting parameters set in the chemistry analyzer program and poorer detection limit of the immunoturbidometric assay because it deviates from linear response below 25 mg/L (data not shown). In comparison, the LC-MS/MS method was linear to 3.13 mg/L (online Supplemental Fig. 1).
Fig. 2.
Passing–Bablok comparison plot of the immunoturbidometric assay vs the LC-MS/MS method using the LVNEVTEFAK y5 peptide transition (575.5–595.6) for all samples ranging from the normoalbuminuric range up to the macroalbuminuric range.
Linear regression analysis (not shown) provided the following relationship: y = 0.99x + 23.16, R2 = 0.97.
Fig. 3.
Passing–Bablok comparison plot for the normoalbuminuric range (0–25 mg/L) of the immunoturbidometric assay vs the LC-MS/MS method using the LVNEVTEFAK y5 peptide transition (575.5–595.6).
Linear regression analysis (not shown) provided the following relationship; y = 1.23x – 2.11, R2 = 0.86 (A) and the corresponding Bland–Altman plot over the normoalbuminuric region (B).
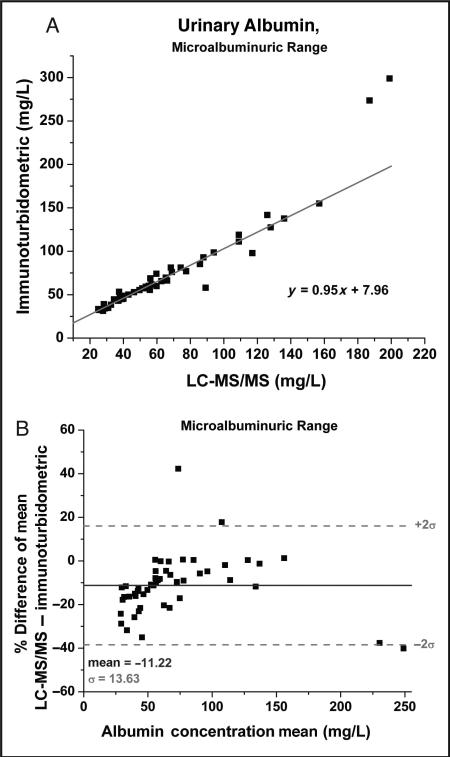
Correlations for the microalbuminuric range are shown in Fig. 4. A break in the comparison correlation occurs around 200 mg/L (Fig. 4A), a region in which the immunoturbidometric method displays a higher bias. However, the chemistry analyzer performs a 1:10 dilution at 180 mg/L in order to remain within the assay dynamic range. Therefore, in this region of the curve the chemistry analyzer assay system appears to overestimate, which may account for the break in the correlation. The Bland-Altman analysis for the microalbuminuric range in Fig. 4B also suggests that re sults of the immunoturbidometric assays are increased across this range, as evidenced by the –11% mean bias. Only a few points travel into the positive bias region >0%. This result should not be attributable to the calibration differences, because the same calibrators were used in each system.
Fig. 4.
Passing–Bablok comparison plot for the microalbuminuric range (25–200 mg/L) of the immunoturbidometric assay vs the LC-MS/MS method using the LVNEVTEFAK y5 peptide transition (575.5–595.6).
Linear regression analysis (not shown) provided the following relationship; y = 1.22x – 6.96, R2 = 0.90 (A) and the corresponding Bland–Altman plot over the microalbuminuric region (B).
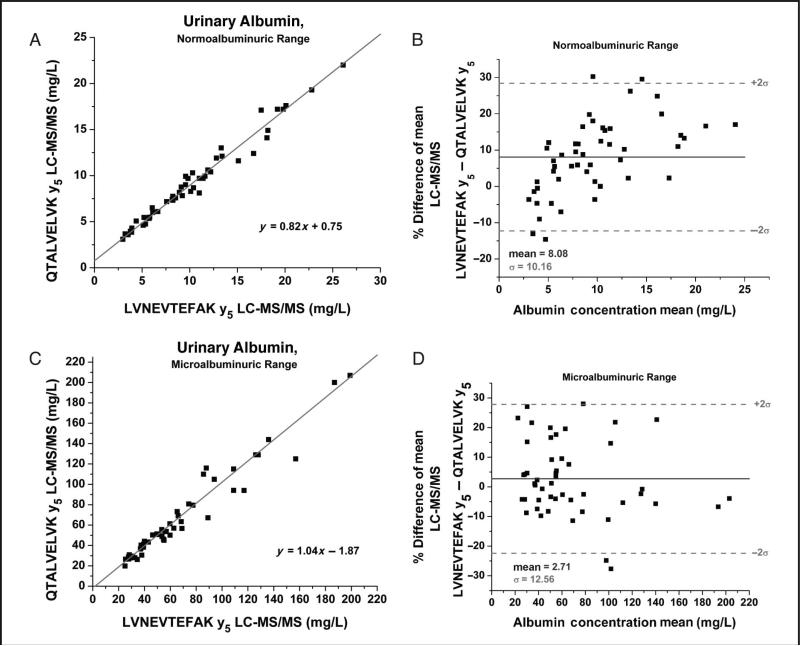
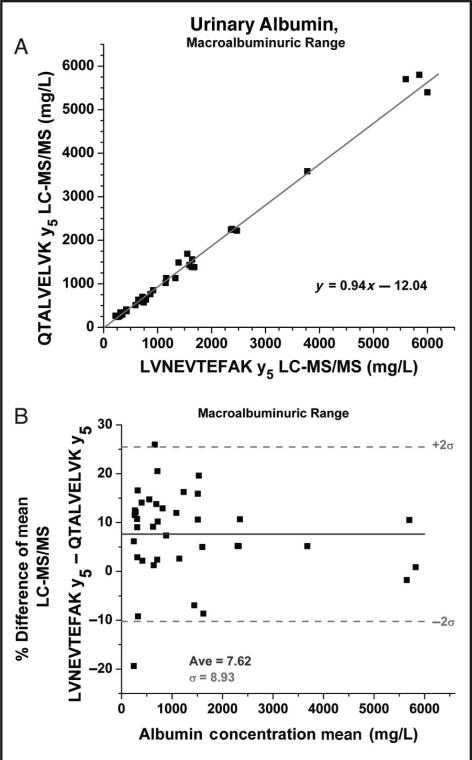
Comparison plots of patient results from the 2 different peptides were also generated and divided into the 3 states of albuminuria. The normoalbuminuric range (0–25 mg/L) comparison (Figs. 5A and 5B) shows a positive bias in both the linear regression (Fig. 5A) and the Bland-Altman (Fig. 5B) plots. The Bland-Altman displays a migrating bias from negative to positive as the concentrations increase and yields an average positive bias with the LVNEVTEFAK peptide. This systemic bias could theoretically be explained by method error because both peptides produced CVs of around 10% in this region of the curve. In the microalbuminuric range (25–200 mg/L) sample comparison results are randomly distributed about the mean (2.71%) (Figs. 5C and 5D). However, differences >30% were observed for certain samples despite the fact that the LC-MS/MS assay had CVs of approximately 5% in this region. Therefore system error alone may not be the only factor contributing to the differences observed. For specimens in the macroalbuminuric range (>200 mg/L) the assay displayed a reasonable correlation (Fig. 6A), and percentage differences were randomly distributed about the mean (Fig. 6B). However, as with the normoalbuminuric samples, a slight positive bias was observed for the LVNEVTEFAK vs the QTALVELVK peptide.
Fig. 5.
Passing–Bablok comparison plot for the normoalbuminuric range (0–25 mg/L) of the LC-MS/MS method QTALVELVK (500.9–587.7) peptide transition vs the LC-MS/MS method LVNEVTEFAK y5 peptide transition (575.5–595.6) linear regression analysis provided the following relationship; y = 0.81x + 0.93, R2 = 0.9735 (A) and the corresponding Bland–Altman plot over the normoalbuminuric region (B).
The microalbuminiuric range (25–200) Passing–Bablok comparison for QTALVELVK y5 peptide transition (500.9–587.7) vs LVNEVTEFAK y5 peptide transition (575.5–595.6) Linear regression analysis (not shown) provided the following relationship; y = 1.01x – 1.52, R2 = 0.94 (C) and the corresponding Bland–Altman plot over the microalbuminuric range (D).
Fig. 6.
Passing–Bablok comparison plot for the macroalbuminuric range (>200 mg/L) of the LC-MS/MS method QTALVELVK y5 peptide transition (500.9–587.7) vs the LC-MS/MS method LVNEVTEFAK y5 peptide transition (575.5–595.6).
Linear regression analysis (not shown) provided the following relationship; y = 0.97x – 36.61, R2 = 0.99 (A) and the corresponding Bland–Altman plot over the macroalbuminuric region (B).
Discussion
Our method for absolute quantification of albumin in urine by using protein cleavage LC-MS/MS appears to be a viable option for a clinical laboratory setting. This method provides a lower LOQ compared to an immunoturbidometric system using DiaSorin microalbumin reagents. This method also provides a high degree of analytical specificity because the LC-MS/MS methodology incorporates separation and specific mass transitions for the detection of each peptide, and the LVNEVTEFAK and QTALVELVK peptides are specific to HSA (accession # P02768, gi:113576). To the best of our knowledge this is the only report of data obtained using protein cleavage methodologies and an intact stable isotope-labeled recombinant internal standard for quantification of urinary albumin from several peptides. The previous method reported by our group using insource fragmentation LC-MS with BSA and 15NrHSA internal standards for quantification afforded measurement of urinary albumin without any sample preparation (4, 15). However, the previous method had a limit of quantification of 20 mg/L, and thus the assay performance fell short of analytical requirements needed for a clinical assay (5). To enhance the quantification of albumin in the normoalbuminuric range (<25 mg/L), we developed a urinary albumin assay using protein cleavage LC-MS/MS. Results presented here demonstrate that this assay has an LOQ of 3.13 mg/L, well below the clinically relevant range, and also has a large dynamic range (3.13–200 mg/L).
Because our method incorporates a digestion step, it is theoretically possible that preexisting N-terminal and/or C-terminal albumin fragments present in urine could be measured, thereby falsely increasing results (17–19). Truncated versions of albumin have also been detected in the serum of patients with pancreatitis (20). To detect such forms in urine, the ratio of N-terminal and C-terminal albumin peptides could be compared, with any deviation from unity suggesting the presence of such preformed N- or C-terminal peptides. However, if the truncations were minimal it is still possible that these forms could contain both of the peptides that are monitored in this assay. In addition, posttranslational modifications within these assayed peptides would change their masses and therefore cause them to go undetected, thereby falsely lowering the experimental results. Any modifications to albumin that would inhibit digestion by trypsin for 2 peptides chosen could also present falsely low results. Any of the above possibilities could be contributing to the differences observed when results from the 2 peptides were compared (Figs. 5 and 6). Because the discrepancies between the albumin peptides we monitored were relatively minor, our data suggest the majority of albumin in urine is intact. However, other strategies and additional studies would have to be developed to definitively test these possibilities and detect the presence of these molecules in native urine to document their potential diagnostic and prognostic importance. With the above caveats in mind, the current LC-MS/MS method can serve as a clinical assay for intact albumin in urine, or more likely as a reference method.
Urinary albumin quantification is important because increased albumin excretion predicts an increased likelihood of progression to overt renal disease, and even an increased risk for nonrenal outcomes (e.g., cardiovascular events). Therefore, efforts to standardize this assay are a current priority, following the example for standardization of serum creatinine (21). Our results demonstrate that LC-MS/MS after trypsin digestion is a viable option for a reference method to quantify urinary albumin.
Supplementary Material
Acknowledgments
The authors graciously thank Ward H. Lutz for the aid in synthesizing the 15NrHSA, Ashia Shaikh for the help with sample collection, and Sue Reicks for helpful discussions.
Role of Sponsor: The funding organizations played no role in the design of study, choice of enrolled patients, review and interpretation of data, or preparation or approval of manuscript.
Footnotes
Nonstandard abbreviations: LOQ, limit of quantification; LC-MS/MS, liquid chromatography–tandem mass spectrometry.
Author Contributions: All authors confirmed they have contributed to the intellectual content of this paper and have met the following 3 requirements: (a) significant contributions to the conception and design, acquisition of data, or analysis and interpretation of data; (b) drafting or revising the article for intellectual content; and (c) final approval of the published article.
Authors’ Disclosures of Potential Conflicts of Interest: No authors declared any potential conflicts of interest.
References
- 1.Meigs JB, D'Agostino RB, Sr, Nathan DM, Rifai N, Wilson PW. Longitudinal association of glycemia and microalbuminuria: the Framingham Offspring Study. Diabetes Care. 2002;25:977–83. doi: 10.2337/diacare.25.6.977. [DOI] [PubMed] [Google Scholar]
- 2.Cao JJ, Biggs ML, Barzilay J, Konen J, Psaty BM, Kuller L, et al. Cardiovascular and mortality risk prediction and stratification using urinary albumin excretion in older adults ages 68–102: the Cardiovascular Health Study. Atherosclerosis. 2008;197:806–13. doi: 10.1016/j.atherosclerosis.2007.07.029. [DOI] [PubMed] [Google Scholar]
- 3.Mortensen HB, Marinelli K, Norgaard K, Main K, Kastrup KW, Ibsen KK, et al. A nation-wide cross-sectional study of urinary albumin excretion rate, arterial blood pressure and blood glucose control in Danish children with type 1 diabetes mellitus. Danish Study Group of Diabetes in Childhood. Diabet Med. 1990;7:887–97. doi: 10.1111/j.1464-5491.1990.tb01324.x. [DOI] [PubMed] [Google Scholar]
- 4.Babic N, Larson TS, Grebe SK, Turner ST, Kumar R, Singh RJ. Application of liquid chromatography-mass spectrometry technology for early detection of microalbuminuria in patients with kidney disease. Clin Chem. 2006;52:2155–7. doi: 10.1373/clinchem.2006.072892. [DOI] [PubMed] [Google Scholar]
- 5.Shaikh A, Seegmiller JC, Borland TM, Burns BE, Ladwig PM, Singh RJ, et al. Comparison between immunoturbidimetry, size-exclusion chromatography, and LC-MS to quantify urinary albumin. Clin Chem. 2008;54:1504–10. doi: 10.1373/clinchem.2008.107508. [DOI] [PMC free article] [PubMed] [Google Scholar]
- 6.Barr JR, Maggio VL, Patterson DG, Jr, Cooper GR, Henderson LO, Turner WE, et al. Isotope dilution–mass spectrometric quantification of specific proteins: model application with apolipoprotein A-I. Clin Chem. 1996;42:1676–82. [PubMed] [Google Scholar]
- 7.Kulasingam V, Smith CR, Batruch I, Buckler A, Jeffery DA, Diamandis EP. “Product ion monitoring” assay for prostate-specific antigen in serum using a linear ion-trap. J Proteome Res. 2008;7:640–7. doi: 10.1021/pr7005999. [DOI] [PubMed] [Google Scholar]
- 8.Bondar OP, Barnidge DR, Klee EW, Davis BJ, Klee GG. LC-MS/MS quantification of Zn-alpha2 glycoprotein: a potential serum biomarker for prostate cancer. Clin Chem. 2007;53:673–8. doi: 10.1373/clinchem.2006.079681. [DOI] [PubMed] [Google Scholar]
- 9.Gerber SA, Rush J, Stemman O, Kirschner MW, Gygi SP. Absolute quantification of proteins and phosphoproteins from cell lysates by tandem MS. Proc Natl Acad Sci U S A. 2003;100:6940–5. doi: 10.1073/pnas.0832254100. [DOI] [PMC free article] [PubMed] [Google Scholar]
- 10.Barnidge DR, Goodmanson MK, Klee GG, Muddiman DC. Absolute quantification of the model biomarker prostate-specific antigen in serum by LC-Ms/MS using protein cleavage and isotope dilution mass spectrometry. J Proteome Res. 2004;3:644–52. doi: 10.1021/pr049963d. [DOI] [PubMed] [Google Scholar]
- 11.Anderson L, Hunter CL. Quantitative mass spec-trometric multiple reaction monitoring assays for major plasma proteins. Mol Cell Proteomics. 2006;5:573–88. doi: 10.1074/mcp.M500331-MCP200. [DOI] [PubMed] [Google Scholar]
- 12.Beynon RJ, Doherty MK, Pratt JM, Gaskell SJ. Multiplexed absolute quantification in proteomics using artificial QCAT proteins of concatenated signature peptides. Nat Methods. 2005;2:587–9. doi: 10.1038/nmeth774. [DOI] [PubMed] [Google Scholar]
- 13.Hanke S, Besir H, Oesterhelt D, Mann M. Absolute SILAC for accurate quantitation of proteins in complex mixtures down to the attomole level. J Proteome Res. 2008;7:1118–30. doi: 10.1021/pr7007175. [DOI] [PubMed] [Google Scholar]
- 14.Gill SC, von Hippel PH. Calculation of protein extinction coefficients from amino acid sequence data. Anal Biochem. 1989;182:319–26. doi: 10.1016/0003-2697(89)90602-7. [DOI] [PubMed] [Google Scholar]
- 15.Singh R, Crow FW, Babic N, Lutz WH, Lieske JC, Larson TS, Kumar R. A liquid chromatography-mass spectrometry method for the quantification of urinary albumin using a novel 15N-isotopically labeled albumin internal standard. Clin Chem. 2007;53:540–2. doi: 10.1373/clinchem.2006.078832. [DOI] [PubMed] [Google Scholar]
- 16.Barnidge DR, Tschumper RC, Jelinek DF, Muddiman DC, Kay NE. Protein expression profiling of CLL B cells using replicate off-line strong cation exchange chromatography and LC-MS/MS. J Chromatogr B Analyt Technol Biomed Life Sci. 2005;819:33–9. doi: 10.1016/j.jchromb.2005.01.021. [DOI] [PubMed] [Google Scholar]
- 17.Osicka TM, Comper WD. Characterization of immunochemically nonreactive urinary albumin. Clin Chem. 2004;50:2286–91. doi: 10.1373/clinchem.2004.039743. [DOI] [PubMed] [Google Scholar]
- 18.Sviridov D, Drake SK, Hortin GL. Reactivity of urinary albumin (microalbumin) assays with fragmented or modified albumin. Clin Chem. 2008;54:61–8. doi: 10.1373/clinchem.2007.092825. [DOI] [PubMed] [Google Scholar]
- 19.Brennan SO, George PM, Peach RJ. Characterisation of a slow component of normal human serum albumin. Clin Chim Acta. 1988;176:179–84. doi: 10.1016/0009-8981(88)90205-7. [DOI] [PubMed] [Google Scholar]
- 20.Brennan SO, George PM. Three truncated forms of serum albumin associated with pancreatic pseudocyst. Biochim Biophys Acta. 2000;1481:337–43. doi: 10.1016/s0167-4838(00)00177-1. [DOI] [PubMed] [Google Scholar]
- 21.Myers GL, Miller WG, Coresh J, Fleming J, Greenberg N, Greene T, et al. Recommendations for improving serum creatinine measurement: a report from the Laboratory Working Group of the National Kidney Disease Education Program. Clin Chem. 2006;52:5–18. doi: 10.1373/clinchem.2005.0525144. [DOI] [PubMed] [Google Scholar]
Associated Data
This section collects any data citations, data availability statements, or supplementary materials included in this article.


