

Abstract
The biosynthesis of secondary metabolites provides higher plants mechanisms of defense against microbes, insects, and herbivores. One common cellular target of these molecules is the highly conserved microtubule cytoskeleton and microtubule targeting compounds with insecticidal, antifungal, nematicidal and anticancer activities have been identified from plants. A new retro-dihydrochalcone, taccabulin A, with microtubule destabilizing activity has been identified from the roots and rhizomes of Tacca species. This finding is notable because the microtubule stabilizing taccalonolides are also isolated from these sources. This is the first report of an organism producing compounds with both microtubule stabilizing and destabilizing activities. A two-step chemical synthesis of taccabulin A was performed. Mechanistic studies showed that taccabulin A binds within the colchicine site on tubulin and has synergistic antiproliferative effects against cancer cells when combined with a taccalonolide, which binds to a different site on tubulin. Taccabulin A is effective in cells that are resistant to many other plant-derived compounds. The discovery of a natural source that contains both microtubule stabilizing and destabilizing small molecules is unprecedented and suggests that the synergistic action of these compounds was exploited by nature long before it was discovered in the laboratory.
Plants as sessile organisms have evolved within their ecosystems to overcome biotic and abiotic stresses. Higher plants have developed sophisticated mechanisms of defense from insects, fungi, nematodes, and mammalian herbivores.1,2 Chemical defenses include the production of plant secondary metabolites that can be toxic, targeting fundamental biological processes, including mitochondrial respiration, proteases, ATPases, neuronal receptors, and cytoskeletal plasticity, which are thought to protect plants from a range of threats from infection to consumption.3,4 A common target for plant-derived secondary metabolites is the cytoskeleton. Plant-derived compounds that disrupt each of the major cytoskeletal components, intermediate filaments, microfilaments, and microtubules, have been discovered.5–8 We hypothesize that the ability of these compounds to interact directly with highly evolutionarily conserved cytoskeletal proteins may provide defense against a broad genera of predatory organisms.
Compounds that bind to tubulin/microtubules are divided into two categories, microtubule stabilizers and destabilizers, which increase or decrease cellular microtubule mass, respectively.7 Although they are named for their opposing effects on tubulin polymer equilibrium, at the lowest effective concentrations both stabilizers and destabilizers suppress microtubule dynamics, impairing cellular processes from vesicular transport to mitosis. The combination of a microtubule stabilizer and destabilizer that occupy different binding sites on tubulin can act synergistically to reduce microtubule function leading to cytotoxicity.9,10 Many microtubule destabilizing secondary metabolites have been isolated from plants, including colchicine, vinblastine, combretastatin A-4 (CA-4), and podophyllotoxin. Additionally, the first microtubule stabilizer identified, taxol, isolated from Taxus brevifolia, the Pacific yew11 is one of the most successful anticancer agents ever discovered. While microtubule stabilizers and destabilizers have been isolated from a wide range of plant species, no species has ever demonstrated the ability to produce compounds with each of these activities.
Here we show that the roots and rhizomes of Tacca sp, the bat flower, produce both a microtubule destabilizing retro-dihydrochalcone in addition to the known taccalonolide microtubule stabilizing compounds.12–14 These structurally diverse compounds have opposite effects on microtubule polymer mass, but at the lowest antiproliferative concentrations they cause super-additive effects against cancer cells. It is interesting to speculate that together these compounds could provide superior chemical defenses for the plant.
RESULTS AND DISCUSSION
Isolation and Identification of Taccabulin A
The taccalonolides are a new class of microtubule stabilizers that have been isolated from the roots and/or rhizomes of Tacca species including chantrieri,13,14 leontopetaloides,15 paxiana,16 subflaellata,17 integrifolia,13 and plantaginea12,18 (Figure 1A). There is evidence that the taccalonolides provide defenses against soil pests including nematodes.19 During bioassay-guided fractionation of the taccalonolides, extracts and chromatography fractions are evaluated for their effects on cellular microtubules to identify those containing microtubule active compounds. Fractions of taccalonolide-enriched material, including the major metabolite taccalonolide A (1), cause stabilization and bundling of interphase microtubules (Figure 1B). Recently, more stringent fractionation employed to isolate rare and potent taccalonolides yielded two fractions that caused microtubule destabilization. Compounds with this activity have never been reported from any Tacca species. Further bioassay-guided fractionation of the extracts with microtubule destabilizing bioactivity yielded a new retro-dihydrochalcone that we named taccabulin A (2). Taccabulin A caused significant microtubule depolymerization (Figure 1C) and antiproliferative effects with an IC50 of 435 ± 14 nM in the MDA-MB-435 melanoma cancer cell line.
Figure 1.

A microtubule stabilizer and destabilizer isolated from Tacca sp. (A) The black bat flower, T. chantreiri. (B) Effects of 5 JM taccalonolide A (1) and (C) 40 μM taccabulin A (2) on interphase microtubules.
Taccabulin A (2) was obtained as a yellow powder. The molecular formula, C19H22O6, was determined by HRESIMS [m/z 347.1483 (calcd for C19H23O6 m/z 347.1495)] and NMR data. The 1H NMR spectrum showed three protons of a 1,3,4-trisubstituted phenyl group at δ 6.87 (d, J = 8.5 Hz, H-5), 7.58 (dd, J = 8.5, 1.9 Hz, H-6), and 7.62 (d, J = 1.9 Hz, H-2), two equivalent protons of a tetrasubstituted phenyl group at δ 6.14 (s, 2H, H-3′,5′), two vicinal methylene signals at δ 2.96 (m, 2H, H-β) and 3.02 (m, 2H, H-α), four methoxy signals at δ 3.95, 3.81 (each s, 3H), and 3.79 (s, 6H), and a hydroxy signal at δ 5.62 (br) (Table 1). These data suggested a retrochalcone skeleton similar to evelynin, which was isolated from this plant previously.20
Table 1.
NMR Data for Taccabulin A (2).
| δH (J in Hz) | δC | |
|---|---|---|
| 1 | 131.1 | |
| 2 | 7.62 d 1.9 | 114.7 |
| 3 | 145.4 | |
| 4 | 150.4 | |
| 5 | 6.87 d 8.5 | 109.9 |
| 6 | 7.58 dd 8.5, 1.9 | 121.7 |
| 1′ | 109.9 | |
| 2′ | 159.0 | |
| 3′ | 6.14 s | 90.6 |
| 4′ | 159.7 | |
| 5′ | 6.14 s | 90.6 |
| 6′ | 159.0 | |
| α | 2.96 m | 18.8 |
| β | 3.02 m | 38.7 |
| CO | 199.8 | |
| 4′-OCH3 | 3.81 | 55.5 |
| 2′-OCH3 | 3.79 s, 3H | 55.7 |
| 6′-OCH3 | 3.79 s, 3H | 55.7 |
| 4-OCH3 | 3.95 s, 3H | 56.2 |
| 3-OH | 5.62 |
The long range heteronuclear correlations between H-11, 14, 15 and the methoxy signal at δ 3.95 and C-4 at δ 150, indicated a methoxy group at C-4, while the correlations between H-2, 5 and C-3 at δ 145.4 suggested a hydroxyl group at C-3. The correlations between H-β/C-1′,2′,6′,α,CO, H-α/C-1,CO and H-2,6/CO established the connection of the two phenyl groups via a -CH2CH2C(O)- group. Thus, the structure was determined as 1-(3-hydroxy-4-methoxyphenyl)-3-(2,4,6-trimethoxyphenyl)propan-1-one and a trivial name taccabulin A (“tacca” for Tacca species and “bulin” for tubulin as the biological target) was assigned.
Synthesis of Taccabulin A (2)
The structure of 2 was amenable to two-step total synthesis as depicted in Figure 2. 2,4,6-Trimethoxybenzaldehyde and 3-hydroxy-4-methoxyacetophenone were reacted in MeOH and 50% aqueous NaOH to give dehydrotaccabulin in a 27% yield. Dehydrotaccabulin was treated with 2 mol% PtO2 and H2 in EtOAc to afford analytically pure 2 in 39% yield. The LC/MS and NMR profiles of the synthetically-derived 2 were identical to the natural product. As expected, synthetic 2 had antiproliferative potency similar to the natural compound with an IC50 of 355 ± 16 nM against MDA-MB-435 cells. Compound 2 produced by total synthesis also retained microtubule depolymerizing activity, confirming that this molecule is responsible for the microtubule destabilizing effects observed with the natural product. Synthetic 2 was used in all additional experiments exploring its mechanism of action.
Figure 2.
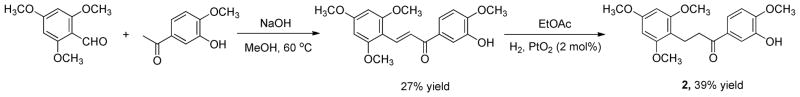
Synthesis of taccabulin A (2).
Taccabulin A (2) Inhibits Tubulin Polymerization and Binds Within the Colchicine Site on Tubulin
All known microtubule destabilizers bind directly to tubulin, which allows the effects of these drugs to be observed in biochemical preparations containing only purified tubulin and guanosine triphosphate (GTP) in a glycerol buffer. Under these conditions, tubulin can assemble into microtubules, as observed by an increase in turbidity over time (Figure 3A). Taccabulin A (2) caused a dose dependent decrease in the rate and extent of microtubule polymerization. A 25 μM concentration of 2 caused approximately 50% inhibition of polymerization (Figure 3A) indicating that it is less potent than CA-4 which caused 50% inhibition of polymerization at 2 – 3 μM.21
Figure 3.
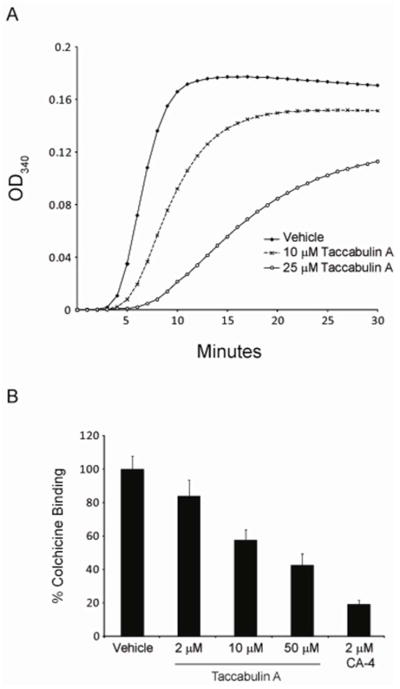
Taccabulin A (2) directly inhibits tubulin polymerization by binding to the colchicine site on tubulin. (A) The polymerization of purified porcine brain tubulin was monitored by absorbance at 340 nm with vehicle or 10 μM or 25 μM 2. (B) Dose-dependent displacement of colchicine from tubulin by 2 was detected by monitoring the fluorescence emitted by colchicine binding to tubulin. CA-4 was used as a positive control and error bars represent standard deviations from 3 replicates.
Two sites for microtubule destabilizers have been identified on tubulin: the vinca site and the colchicine site. While the large complex natural products of the vinca family bind within the vinca site, most small molecule microtubule destabilizers bind to the colchicine site. Owing to the strong structural similarities between 2 and colchicine-site agents, including CA-4,21 we hypothesized that 2 also binds to the colchicine site. When colchicine is bound to tubulin, a conformational change causes the drug to fluoresce, a property that unbound colchicine does not possess.22 This property of colchicine-tubulin binding was utilized to determine whether 2 could compete for binding to this site on tubulin. A dose dependent inhibition of colchicine fluorescence was observed when 2 was added to biochemical preparations containing purified tubulin, colchicine, and GTP (Figure 3B). Interestingly, the concentrations of 2 that caused a 50% inhibition of colchicine binding or a 50% inhibition of tubulin polymerization in biochemical assays were equivalent (compare Figures 3A & B).
Taccabulin A (2) Disrupts Microtubule-dependent Processes
Microtubule stabilizers and destabilizers have seemingly opposite cellular effects based on their respective ability to increase or decrease interphase microtubule mass (Figure 1). However, the prevailing view of the mechanism by which both classes of drugs inhibit the proliferation of cells in culture is by inhibiting microtubule dynamics. During mitosis, the mitotic spindle and kinetochore microtubules rapidly grow and shrink to properly align and separate sister chromatids and this requires highly dynamic microtubules. Mitotic microtubules are 3.6-fold more dynamic than interphase microtubules.23
Microtubule stabilizers and destabilizers disrupt highly dynamic mitotic spindles leading to mitotic arrest at concentrations lower than those that cause gross changes in interphase microtubule mass. Indeed, 2, like the taccalonolides, arrested cells in the G2/M phase of the cell cycle as determined by flow cytometry (Figures 4A–C). Consistent with the flow cytometry results, when the microtubules of 2-treated cells were visualized, abnormal mitotic spindles were observed. Normal bipolar mitotic spindles were present in vehicle-treated cells (Figure 4D) while the taccabulin A (2)-treated cells contained multiple aberrant spindle asters (Figure 4F). The formation of aberrant spindles during mitosis contributes to the inability of both taccalonolide A (1) and taccabulin A (2)-treated cells to progress through the cell cycle, even though the morphologies of the spindles formed by these two drugs are distinct (compare Figures 4E, F).
Figure 4.
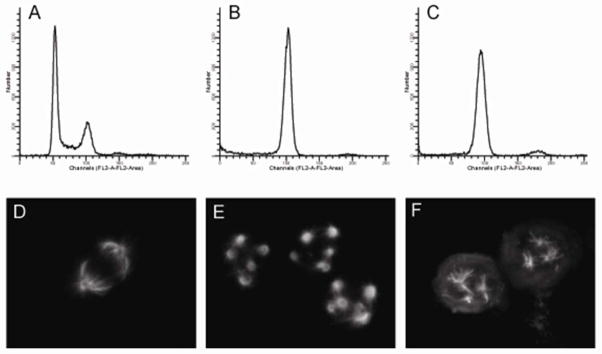
Taccabulin A (2) and taccalonolide A (1) cause mitotic arrest with multiple spindles. Cell cycle distribution (A–C) and mitotic tubulin spindle morphology (D–F) of HeLa cells treated with vehicle (A, D), 5 JM 1 (B, E), or 5 μM 2 (C, F) were determined by flow cytometry and indirect immunofluorescence, respectively.
Taccabulin A (2) Circumvents Common Modes of Xenobiotic Resistance
While plants produce cytotoxic microtubule active compounds, other organisms co-evolved adaptations that limit their susceptibility to these agents. One mechanism by which organisms develop resistance to complex natural products is by expression of the mdr-1 gene product, P-glycoprotein (Pgp), a xenobiotic efflux transporter. Expression of this transporter leads to insecticide resistance.24 This transporter has also been associated with clinical multidrug resistance.25 In addition to Pgp, the expression of specific tubulin isoforms, for example mammalian βIII which contains an alanine residue at 277, leads to multidrug resistance to the taxane and vinca alkaloid classes of plant-derived microtubule targeted compounds.25,26 Interestingly, some parasites and fungal plant pathogens, including Gibberella fujikuroi which causes bakanae disease in rice seedlings, also express β-tubulins that contain an alanine at β277, suggesting they would be resistant to taxanes and vinca alkaloids. The efficacy of 2 in each of these drug resistant settings was tested by comparing its antiproliferative potency in cancer cell lines expressing Pgp (SK-OV-3/MDR-1-6/6) or βIII tubulin that contains an alanine at residue 277 (WTβIII) as compared to their respective parental cell lines, SK-OV-3 and HeLa.
The known Pgp substrate, paclitaxel, has a relative resistance (Rr) of 1,625 in the Pgp- overexpressing cell line, whereas CA-4, which is known to circumvent Pgp-mediated resistance, has an Rr of 3.6 in this cell line pair (Table 2). The Rr for 2 in this cell line pair is 2.7, within the range observed for non-Pgp substrates in both current and previous studies (Table 2).27 The Rr of 2 in WTβIII cells as compared to the parental HeLa cell line is 1.2 (Table 2), which indicates it retains efficacy in cells that contain an alanine residue at β277. CA-4 is equally potent in each cell line with Rr of 0.98, whereas paclitaxel, which is susceptible to this mode of resistance, has an Rr of 6.5 (Table 2). It has previously been shown that the taccalonolides are also able to circumvent both Pgp and βIII-tubulin mediated drug resistance.28
Table 2.
The effects of microtubule targeting agents on parental and Pgp or βIII expressing cell lines. The IC50 values were calculated using the SRB assay and the relative resistance (Rr) for each cell line pair was calculated by dividing the IC50 of the drug resistant cell line by the IC50 of the parental drug sensitive cell line. CA-4 and paclitaxel were used as negative and positive controls, respectively.
| 2 (nM) | CA-4 (nM) | Paclitaxel (nM) | |
|---|---|---|---|
|
|
|||
| HeLa | 581 ± 6 | 4.1 ± 0.1 | 1.4 ± 0.1 |
| WTβIII | 690 ± 51 | 4.0 ± 0.3 | 9.1 ± 0.5 |
| (Rr) | (1.2) | (0.98) | (6.5) |
| SK-OV-3 | 812 ± 65 | 6.1 ± 0.6 | 3.0 ± 0.1 |
| SK-OV-3/MDR-1-6/6 | 2,228 ± 155 | 22 ± 6.9 | 4,875 ± 153 |
| (Rr) | (2.7) | (3.6) | (1,625) |
Taccabulin A (2) and the Taccalonolides Have Synergistic Antiproliferative Effects
The taccalonolides and taccabulin A (2) were both isolated from roots and rhizomes of Tacca sp. While the specific cells and tissues producing these compounds are not yet known, we hypothesize that these compounds may act synergistically for plant defense. The effect of taccalonolide A (1) and taccabulin A (2) in combination was evaluated in two cancer cell lines, MDA-MB-435 and HeLa. The synergistic difference was calculated as the difference between the expected additive percent inhibition of proliferation and the observed value of combinations of the two compounds. Purely additive effects would be represented by a synergistic difference of 0%, while synergistic and antagonistic effects would be depicted by positive or negative values, respectively. Synergistic differences between 8 and 21% were observed when 1 was added in combination with a range of concentrations of 2 (Figure 5A). Similar results were observed for a variety of concentrations of 2 and the potent taccalonolide AJ12 in both cell lines (Figures 5B, C), suggesting that synergy with taccabulin A (2) is a common property of the taccalonolide microtubule stabilizers. Additional experiments were performed in accordance with the determination of synergy by Chou and Talalay using isobologram analysis and the calculation of combination indices (CI).29 In this analysis, complete additivity of two drugs is indicated by a CI value of 1 and a graphical representation of the drug combination on the diagonal line of the isobologram. Synergistic drug combinations will have CI values less than one and be represented under the diagonal line of the isobologram. Of the three combinations of taccabulin A and taccalonolide A tested, two were found to be synergistic and one was found to be strictly additive (Figure 5D). Synergy between taccalonolide AJ and taccabulin A was more pronounced with CI values between 0.65 and 0.85 for all seven combinations tested (Figure 5E). The finding the bat flower plant produces two distinct microtubule active agents that have synergistic effects against highly proliferative cells, is the first example of naturally occurring combination chemotherapy of a microtubule stabilizer and destabilizer. It is intriguing to speculate that other organisms may also contain complementary small molecules that may find utility in the treatment of human disease when used in combination.
Figure 5.

The synergistic differences for combinations of (A) taccabulin A (2) and taccalonolide A (1) or taccabulin A and taccalonolide AJ in MDA-MB-435 (B) or HeLa (C) cells were calculated as the differences between the expected additive and observed percent inhibition of cellular proliferation with standard error from at least three independent experiments. Isobologram analysis was performed on additional combinations of taccabulin and taccalonolide A (D) or taccalonolide AJ (E). Combination indices (CI) for each are included.
EXPERIMENTAL SECTION
General Experimental Procedures
NMR spectra were acquired on Bruker Avance 600 MHz or 500 MHz instruments and reported in ppm using the internal standard TMS. HRMS was measured using an Agilent Technologies 6224 TOF LC/MS mass system. The UV spectrum was obtained with a Waters 996 PDA Detector. TLC was performed on aluminum sheets (silica gel 60 F254, Merck KGaA, Germany). Preparative HPLC was performed on a Waters Breeze HPLC system using a Phenomenex Luna C18 column (250 × 22.20 mm, 5μm). Gradients of MeCN:H2O or MeOH:H2O were utilized with a 9 mL/min flow rate. LC/MS was recorded on a Waters Alliance 2695 HPLC equipped with Micromass Quattro triple quadrupole mass spectrometer using ESI model.
Plant Material
Taccabulin A (2) was identified from pooled minor fractions of Tacca chantrieri (the black bat flower) and T. integrifolia (the white bat flower) obtained from sources at the University of Hawaii at Manoa, Gardino Nurseries in Delray Beach, Florida and the San Antonio Botanical Gardens from 2004–2008. Plants from each source were identified by botanists at each institution: Dr. Will McClatchey, Mr. Sid Gardino, and Mr. Paul Cox, respectively. Voucher specimens of T. chantrieri (SLM370, SLM371, SLM373 & SLM374) and T. integrifolia (SLM372 & 375) are housed in the herbarium of the University of Texas Health Science Center at San Antonio. The roots and rhizomes were collected and stored at −20 °C until lyophilized.
Extraction and Isolation
Taccalonolides A (1) and AJ were isolated as previously described.12,27 Taccabulin A (2) was isolated from combined minor fractions by separation on silica gel and elution with a gradient of DCM:acetone (0~20%). Further purification of 2 (2.0 mg) was achieved by bioassay guided fractionation using a C18 HPLC column eluted with a gradient MeOH: H2O, repeatedly (50~100% in 40 min, then 30 to 80% in 40 min).
Taccabulin A [1-(3-hydroxy-4-methoxyphenyl)-3-(2,4,6-trimethoxyphenyl)propan-1-one] was synthesized from the reaction of 2,4,6-trimethoxybenzaldehyde (2.9 g, 15 mmol) and 3-hydroxy-4-methoxyacetophenone (2.5 g, 15 mmol) dissolved in MeOH (40 mL) and 50% (w/v) aqueous NaOH (2 mL). The mixture was heated to 60 °C for 12 hours then cooled to room temperature. The reaction was acidified with 1N HCl (30 mL) and the crude product extracted with CHCl3 and dried over anhydrous Na2SO4. After concentration, the crude product was partially purified via silica gel chromatography using a gradient of 0 – 100% EtOAc/hexanes. Concentration of the appropriate fractions yielded dehydrotaccabulin A as a ~1:1 mixture with 2,4,6-trimethoxybenzaldehyde. The mixture was taken on “as is” (containing ~3 mmol of dehydrotaccabulin A) and reacted with 2 mol% PtO2, and H2 (balloon pressure) in EtOAc (40 mL) for ~12 h. Upon completion, the residual platinum was filtered and the filtrate was concentrated to a crude solid. The product was purified via silica gel chromatography using a gradient of 0 – 5% MeOH/DCM. Further purification was achieved by recrystallization from DCM/hexanes to afford taccabulin A as a white solid in 39% yield. The structures of naturally occurring taccabulin A and synthetic 2 were determined by LC/MS and NMR and found to be identical. Purified 2 was found to be greater than 95% pure by NMR and LC/MS.
Taccabulin A (2): yellow powder, UV λmax 228, 274, 307 nm; 1H and 13C NMR see Table 1; HRMS m/z 347.1483 [M+H]+ (calcd m/z 347.1495); ESIMS m/z 347.1 [M+H]+, 369.1 [M+Na]+, m/z 693.4 [2M+H]+.
Biological Assays
HeLa cervical cancer cells and SK-OV-3 ovarian cancer cells were purchased from the American Type Culture Collection (Manassas, VA, USA). MDA-MB-435 melanoma cells were acquired from the Lombardi Cancer Center (Washington, DC, USA). SK-OV-3/MDR-1-6/6 and WTβIII cell lines were constructed and characterized as previously described.27 MDA-MB-435 cells were cultured in Richter’s Medium (IMEM) (Invitrogen, Carlsbad, CA) and HeLa, SK-OV-3, SK-OV-3/MDR-1-6/6 and WTβIII cells were cultured in Basal Medium Eagle with Earle’s salts (Sigma-Aldrich). Media was supplemented with 10% FBS and 25 – 50 μg/mL gentamicin. The IC50 values for inhibition of cellular proliferation were determined using the SRB assay30 as described previously.14 The relative resistance (Rr) of drug resistant cell lines to drugs was calculated as previously described.27 For the synergistic difference, the observed antiproliferative effect values, % inhibition, were subtracted from the expected additive values of each compound alone and standard errors of the mean were propagated. Isobologram analysis and calculation of combination indices were calculated using CompuSyn software in accordance with the equations of Chou and Talalay.29 Immunofluorescence, flow cytometry, tubulin polymerization, and colchicine displacement studies were performed as previously described.22,31–34
Supplementary Material
Acknowledgments
We thank Dr. W. McClatchy and N. Dybdal-Hargreaves for critical reading of the manuscript and Dr. R. Ludueña for helpful discussions. This work was supported by NCI CA121138 (SLM), DOD-CDMRP Postdoctoral Award BC087466 (ALR), and NCI P30 CA054174 (SLM). Support of the CTRC Flow Cytometry, Macromolecule Structure (NMR), and Mass Spectrometry resources is gratefully acknowledged.
Footnotes
Supporting Information Available: 1H, COSY, HSQC, and HMBC NMR spectra of 2 is available free of charge via the Internet at http://pubs.acs.org
References
- 1.Mazid M, Khan TA, Mohammad F. Biology and Medicine. 2011;3:232–249. [Google Scholar]
- 2.Mithofer A, Boland W. Annu Rev Plant Biol. 2012;63:431–450. doi: 10.1146/annurev-arplant-042110-103854. [DOI] [PubMed] [Google Scholar]
- 3.Newman DJ, Cragg GM. J Nat Prod. 2012;75:311–335. doi: 10.1021/np200906s. [DOI] [PMC free article] [PubMed] [Google Scholar]
- 4.Pan L, Chai HB, Kinghorn AD. Frontiers in Bioscience. 2012;4:142–156. doi: 10.2741/257. [DOI] [PMC free article] [PubMed] [Google Scholar]
- 5.Peterson JR, Mitchison TJ. Chem Biol. 2002;9:1275–1285. doi: 10.1016/s1074-5521(02)00284-3. [DOI] [PubMed] [Google Scholar]
- 6.Bargagna-Mohan P, Hamza A, Kim YE, Khuan Abby Ho Y, Mor-Vaknin N, Wendschlag N, Liu J, Evans RM, Markovitz DM, Zhan CG, Kim KB, Mohan R. Chem Biol. 2007;14:623–634. doi: 10.1016/j.chembiol.2007.04.010. [DOI] [PMC free article] [PubMed] [Google Scholar]
- 7.Dumontet C, Jordan MA. Nat Rev Drug Discov. 2010;9:790–803. doi: 10.1038/nrd3253. [DOI] [PMC free article] [PubMed] [Google Scholar]
- 8.Sorensen PM, Iacob RE, Fritzsche M, Engen JR, Brieher WM, Charras G, Eggert US. ACS Chem Biol. 2012;7:1502–1508. doi: 10.1021/cb300254s. [DOI] [PMC free article] [PubMed] [Google Scholar]
- 9.Clark EA, Hills PM, Davidson BS, Wender PA, Mooberry SL. Mol Pharm. 2006;3:457–467. doi: 10.1021/mp060016h. [DOI] [PubMed] [Google Scholar]
- 10.Photiou A, Shah P, Leong LK, Moss J, Retsas S. Eur J Cancer. 1997;33:463–470. doi: 10.1016/s0959-8049(97)89023-5. [DOI] [PubMed] [Google Scholar]
- 11.Schiff PB, Fant J, Horwitz SB. Nature. 1979;277:665–667. doi: 10.1038/277665a0. [DOI] [PubMed] [Google Scholar]
- 12.Li J, Risinger AL, Peng J, Chen Z, Hu L, Mooberry SL. JACS. 2011;133:19064–19067. doi: 10.1021/ja209045k. [DOI] [PMC free article] [PubMed] [Google Scholar]
- 13.Peng J, Risinger AL, Fest GA, Jackson EM, Helms GL, Polin LA, Mooberry SL. J Med Chem. 2011 doi: 10.1021/jm200757g. [DOI] [PMC free article] [PubMed] [Google Scholar]
- 14.Tinley TL, Randall-Hlubek DA, Leal RM, Jackson EM, Cessac JW, Quada JC, Jr, Hemscheidt TK, Mooberry SL. Cancer Research. 2003;63:3211–3220. [PubMed] [Google Scholar]
- 15.Scheuer PJ, Swanholm CE, Madamba LA, Hudgins WR. Lloydia. 1963;26:133–140. [Google Scholar]
- 16.Muehlbauer A, Seip S. Helvetica Chimica Acta. 2003;86:2065–2072. [Google Scholar]
- 17.Huang Y, Liu JK. Helvetica Chimica Acta. 2002;85:2553–2558. [Google Scholar]
- 18.Chen ZL, Shen JH, Gao YS, Wichtl M. Planta Medica. 1997;63:40–43. doi: 10.1055/s-2006-957600. [DOI] [PubMed] [Google Scholar]
- 19.Muehlbauer A, Adam, Andersch, Erdelen, Gehling, Harder, Liu, Marczok, Nauen, Van T, Turberg, Velten Patent WO01040256 A1. 2001
- 20.Peng J, Jackson EM, Babinski DJ, Risinger AL, Helms G, Frantz DE, Mooberry SL. J Nat Prod. 2010;73:1590–1592. doi: 10.1021/np100350s. [DOI] [PMC free article] [PubMed] [Google Scholar]
- 21.Lin CM, Singh SB, Chu PS, Dempcy RO, Schmidt JM, Pettit GR, Hamel E. Mol Pharm. 1988;34:200–208. [PubMed] [Google Scholar]
- 22.Bhattacharyya B, Wolff J. PNAS. 1974;71:2627–2631. doi: 10.1073/pnas.71.7.2627. [DOI] [PMC free article] [PubMed] [Google Scholar]
- 23.Rusan NM, Fagerstrom CJ, Yvon AM, Wadsworth P. Mol Biol Cell. 2001;12:971–980. doi: 10.1091/mbc.12.4.971. [DOI] [PMC free article] [PubMed] [Google Scholar]
- 24.Aurade RM, Jayalakshmi SK, Sreeramulu K. Biochim Biophys Acta. 2010;1798:1135–1143. doi: 10.1016/j.bbamem.2010.02.019. [DOI] [PubMed] [Google Scholar]
- 25.Kavallaris M. Nat Rev Cancer. 2010;10:194–204. doi: 10.1038/nrc2803. [DOI] [PubMed] [Google Scholar]
- 26.Magnani M, Ortuso F, Soro S, Alcaro S, Tramontano A, Botta M. FEBS J. 2006;273:3301–3310. doi: 10.1111/j.1742-4658.2006.05340.x. [DOI] [PubMed] [Google Scholar]
- 27.Risinger AL, Jackson EM, Polin LA, Helms GL, LeBoeuf DA, Joe PA, Hopper-Borge E, Luduena RF, Kruh GD, Mooberry SL. Cancer Research. 2008;68:8881–8888. doi: 10.1158/0008-5472.CAN-08-2037. [DOI] [PMC free article] [PubMed] [Google Scholar]
- 28.Risinger AL, Jackson EM, Polin LA, Helms GL, LeBoeuf DA, Joe PA, Hopper-Borge E, Luduena RF, Kruh GD, Mooberry SL. Cancer Research. 2008;68:8881–8888. doi: 10.1158/0008-5472.CAN-08-2037. [DOI] [PMC free article] [PubMed] [Google Scholar]
- 29.Chou TC, Talalay P. Adv Enzyme Regul. 1984;22:27–55. doi: 10.1016/0065-2571(84)90007-4. [DOI] [PubMed] [Google Scholar]
- 30.Skehan P, Storeng R, Scudiero D, Monks A, McMahon J, Vistica D, Warren JT, Bokesch H, Kenney S, Boyd MR. J Nat Can Inst. 1990;82:1107–1112. doi: 10.1093/jnci/82.13.1107. [DOI] [PubMed] [Google Scholar]
- 31.Krishan A. J Cell Bio. 1975;66:188–193. doi: 10.1083/jcb.66.1.188. [DOI] [PMC free article] [PubMed] [Google Scholar]
- 32.Risinger AL, Westbrook CD, Encinas A, Mulbaier M, Schultes CM, Wawro S, Lewis JD, Janssen B, Giles FJ, Mooberry SL. JPET. 2011;336:652–660. doi: 10.1124/jpet.110.175331. [DOI] [PMC free article] [PubMed] [Google Scholar]
- 33.Tinley TL, Leal RM, Randall-Hlubek DA, Cessac JW, Wilkens LR, Rao PN, Mooberry SL. Cancer Research. 2003;63:1538–1549. [PubMed] [Google Scholar]
- 34.Banerjee A, Luduena RF. J Bio Chem. 1992;267:13335–13339. [PubMed] [Google Scholar]
Associated Data
This section collects any data citations, data availability statements, or supplementary materials included in this article.