

Abstract
Objective:
The purpose of this study was to examine the correlation between the quality of visually graded patient (clinical) chest images and a quantitative assessment of chest phantom (physical) images acquired with a computed radiography (CR) imaging system.
Methods:
The results of a previously published study, in which four experienced image evaluators graded computer-simulated postero-anterior chest images using a visual grading analysis scoring (VGAS) scheme, were used for the clinical image quality measurement. Contrast-to-noise ratio (CNR) and effective dose efficiency (eDE) were used as physical image quality metrics measured in a uniform chest phantom. Although optimal values of these physical metrics for chest radiography were not derived in this work, their correlation with VGAS in images acquired without an antiscatter grid across the diagnostic range of X-ray tube voltages was determined using Pearson’s correlation coefficient.
Results:
Clinical and physical image quality metrics increased with decreasing tube voltage. Statistically significant correlations between VGAS and CNR (R=0.87, p<0.033) and eDE (R=0.77, p<0.008) were observed.
Conclusion:
Medical physics experts may use the physical image quality metrics described here in quality assurance programmes and optimisation studies with a degree of confidence that they reflect the clinical image quality in chest CR images acquired without an antiscatter grid.
Advances in knowledge:
A statistically significant correlation has been found between the clinical and physical image quality in CR chest imaging. The results support the value of using CNR and eDE in the evaluation of quality in clinical thorax radiography.
Chest radiography is one of the most frequently performed diagnostic radiographic examinations in the UK. A Health Protection Agency report [1] in 2010 showed that chest radiographs represented 19.6% of all radiographic examinations (albeit the contribution to collective dose was small at about 0.5%), so optimisation of radiation dose and image quality in chest radiography is an important research area, especially in the era of digital imaging. It is also a legal requirement in the UK under the Ionising Radiation (Medical Exposure) Regulations 2000 [2] to optimise all medical exposures.
Many investigators [3–12] have shown that it is not the system (including quantum) noise that is the limiting factor in chest radiography, but rather the projected patient anatomy or “anatomical noise”. It therefore follows that any images used to optimise a digital radiographic system for chest radiography must contain clinically realistic anatomical features and noise. The assessment of image quality of digital systems is typically undertaken with physical quality metrics, such as modulation transfer function (MTF), noise power spectra (NPS), detective quantum efficiency (DQE), contrast-to-noise ratio (CNR) and threshold contrast measurements [13–19]. Although these parameters describe the inherent performance of the imaging detector extremely well, it is difficult to link them to clinical image quality (i.e. the adequacy of patient images) [20] and therefore it is difficult to use them in any optimisation exercise. Furthermore, recent work by Samei et al [21,22] has shown that these metrics are not only detector centric but also not measured under typical clinical conditions. An alternative metric, the effective DQE (eDQE), was therefore proposed by the authors of that work. This new metric was designed to provide a measure of the signal-to-noise transfer characteristics of a digital imaging system measured under clinical conditions, using a phantom designed for a specific examination type, e.g. chest radiography. More recently, the same group argued that, although the eDQE provides a more clinically realistic measure of DQE, it does not take into account the radiation risk to the patient; hence, the concept of effective dose efficiency (eDE) was proposed [23], which is the effective noise equivalent quanta (eNEQ) normalised to the effective dose. However, a link between eDE and clinical image quality had not been established.
Although there is a lack of work demonstrating a link between the physical and clinical image quality, De Crop et al [24] have recently established a correlation between a contrast detail phantom and clinical chest image quality by grading radiographs of embalmed cadavers and comparing the results with those derived from the phantom. However, only three cadavers were used, limiting the statistical significance of their findings, and no pathology of interest, such as lung nodules, was available.
In this study, the results of a previous optimisation study performed by our group [25] using computer-simulated postero-anterior (PA) chest images have been used to investigate their correlation with the physical image quality metrics, eDE and CNR, across the diagnostic energy range (50–125 kV). The simulated images of the previous study contained clinically realistic projected anatomy and lung nodules (simulated images were used to avoid the obvious ethical issues associated with experimenting on real patients). We have chosen CNR, as this is a simple measure of image quality that is easy to use and understand, and it is often used to obtain practical measures of object detectability. However, CNR can only really be used to assess large area contrast sensitivity, as it does not include the system MTF or any noise variations with spatial frequency. Conversely, the eDE does include system resolution and noise properties as a function of spatial frequency, so this alternative more complex metric has also been investigated. It should be noted that the physical image quality metrics described in this work are not being optimised in themselves (i.e. optimal values of CNR and eDE for chest imaging are not being investigated) but are being used to predict, using a simple phantom, how the radiographic technique affects the clinical image quality.
METHODS
Scoring of simulated chest images (derived from previous work)
A computer algorithm capable of simulating computed radiography (CR) chest images of average adults at various tube voltages, detector air kerma values and different scatter rejection techniques has been used by our group in a previous study to derive optimum exposure parameters for chest CR imaging [26]. The algorithm creates a digitally reconstructed radiograph (DRR), i.e. a simulation of a conventional two-dimensional radiographic image created from CT data. It is currently configured to simulate the Agfa (Peissenberg, Germany) CR-85 reader with MD4.0 plates (35×43 cm, effective pixel pitch of 0.1 mm), exposed with an Optimus Diagnost TH (Philips Medical Systems, Surrey, UK) ceiling-suspended radiographic system with a focus-to-detector distance of 180 cm and a total filtration equivalent to 3.1 mm of aluminium. Chest images produced by the DRR simulator reconstructed with tube voltages 50 and 125 kV are shown in Figure 1a,b, respectively. As expected, it can be seen that there is a decrease in contrast as the tube voltage increases owing to a decrease in photoelectric absorption at higher tube voltages.
Figure 1.

Simulated chest images of an average-sized patient reconstructed at 50 kV (a) and 125 kV (b).
Data from the previous study, in which four experienced image evaluators scored the quality of simulated images reconstructed without an antiscatter grid (n=50), across the diagnostic energy range (50–150 kV), are again being used for the clinical image quality metric for this study, except for one important difference: data above 125 kVp have not been used. This is because, since the previous work, all radiographic units in our radiology department have had their tube voltage stations above 125 kV removed from clinical use (without our knowledge). It was therefore not possible to measure CNR or eDE at these tube voltages. This is very unlikely to influence the findings reported in this study, given that our previous work [25] showed that there was very little (if any) difference in the image quality at tube voltages of 125 kV and above, and very few radiology departments in the UK use tube voltages higher than this for chest radiography.
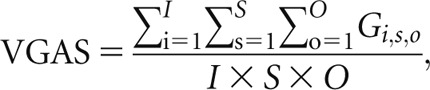
In the previous work, all images were graded on reporting picture archiving and communications systems workstations with a dual monitor configuration (Barco Ltd, Brussels, Belgium). The monitors were calibrated to national standards [27]. Image criteria were based on the Council of European Communities (CEC) Quality Criteria [28], slightly revised to reflect modern diagnostic requirements and experiences of other groups [29–33]. Test images (50, 60, 70, 81, 90, 109, 125, 133, 141 and 150 kV) were scored against a reference image at a tube voltage of 102 kV, with negative and positive scores indicating inferior and superior image quality, respectively (tube voltages stated here were those available on the Philips radiographic system). A visual grading analysis score (VGAS) was calculated using the formula described by Tingberg and Sjöström [34]:
 |
(1) |
where Gi,s,o is the grading (−3, −2, −1, 0, +1, +2, +3) given by observer o for image i and structure s, I is the number of images per tube potential (dependent on the number of patients), S is the number of chest anatomical structures (eight in total; six normal and two lung nodules) and O is the number of evaluators.
Measurement of physical image quality: effective dose efficiency
The theory and measurement of the effective detective quantum efficiency (eDQE), eNEQ and eDE have been comprehensively described elsewhere [21–23], but for completeness these are discussed briefly below. Essentially, the eNEQ is an extension of the conventional NEQ metric given by
 |
(2) |
where SNR (fm)2OUT is the frequency-dependent square of the signal-to-noise ratio “transferred” from the radiographic field incident on the detector through the radiographic system to the resulting image and can be considered as the apparent number of X-ray quanta per square millimetre that contribute to the image, corrected for scatter and blurring (it should be noted that conventional NEQ does not correct for scatter and blurring). The suffix m is the magnification in the object plane of interest (e.g. surface of a phantom—see Phantom section), fm is the magnification-corrected spatial frequency (f×m), eMTF and eNNPS are the effective MTF and effective normalised noise power spectrum, respectively, measured at the surface of the phantom, and SF is the scatter fraction (ratio of scatter to total radiation incident on the CR detector).
As discussed, the eNEQ does not reflect the detriment of the radiation exposure; therefore, used alone, it is of limited value in optimisation exercises. However, the eNEQ can incorporate the effective dose by using the following equation:
 |
(3) |
Measurements of the variables required to calculate eDE (i.e. equations 2 and 3) are described in the Phantom, Phantom acquisitions and Other practical measurements sections.
Phantom
The phantom used to measure eDE was the same as that used in the study by Samei et al [23], and is based on the LucAl phantom. This uniform phantom was manufactured in-house and consists of 300×300-mm plates of polymethylmethacrylate (PMMA) and 1100 alloy Al. The overall thickness of the phantom is 267.1 mm, with a total of 4.1 mm Al, 73 mm PMMA and a 190-mm air gap sandwiched between the front and back sheets of PMMA. The positions and geometry of the relevant compartments have been shown to provide accurate simulation of the primary and scatter transmission through the lung field of an average patient equivalent to an anthropomorphic chest phantom (Radiology Support Devices, Long Beach, CA) in the diagnostic energy range imaged in a PA orientation [35]; the phantom has subsequently been endorsed in the USA by the Food and Drug Administration [36]. We used the original version of the phantom in this study [23] but have also used a slightly modified version of it in previous work with some success [37–39].
Phantom acquisitions
All phantom acquisitions were carried out under the same conditions described for the simulated images in the Scoring of simulated chest images (derived from previous work) section. Unless stated, all phantom exposures were made with a focus-to-detector distance of 180 cm, with the CR detector placed 5 cm behind the phantom in the cassette holder. As per the local operating procedure for chest radiography, all images were acquired without an antiscatter grid. Tube voltages of 50, 60, 70, 81, 90, 102, 109 and 125 kV were investigated. The tube current–time product (mAs) at each tube voltage (kV) was adjusted to produce an effective dose as close as possible to 0.011 mSv (i.e. the effective dose received by an average patient undergoing radiography with standard exposure factors in our radiology department) for all acquisitions, but this was not strictly possible owing to the coarse mAs stations available on the Philips radiographic system; see Table 1 for exposure factors and subsequent detector and phantom surface air kermas used during this study. The effective dose was computed with commercial software PCXMC (v. 2.0.1; STUK, Helsinki, Finland) using the tube filtration and measured output (µGy mAs−1 at 1 m) of the radiographic system. The phantom was placed with its surface 149 cm from the focus and centred on the beam axis. The radiographic field was collimated to the edges of the phantom and, since different individual detectors do not have exactly matching sensitivities, a single CR cassette (digitised in the CR reader with a fixed sensitivity of 400, i.e. flat field 400 for this Agfa system) was used throughout the study. No clinical post processing was applied. It should be noted that the clinical simulated images were produced with exactly the same settings as those used for acquiring these phantom images (i.e. the pixel value to the phosphor dose relationship used by the DRR algorithm was matched to that measured on the Agfa system using a 400-speed sensitivity without post processing).
Table 1.
The exposure settings used to acquire each image. Effective dose (E), phantom entrance surface air kerma (ESAK), phantom transmission factor (TF), detector entrance air kerma (DAK) corrected for transmission of the phantom and scatter fractions (SFs) are also shown
| Tube voltage (kV) | Tube current–time product (mAs) | E (±0.1 µSv) | ESAK (±0.1 µGy) | TF | DAK (± 0.1 µGy) | SF |
| 50 | 20.00 | 8.9 | 108.5 | 0.038 | 3.0 | 0.47 |
| 60 | 8.00 | 9.5 | 97.8 | 0.043 | 2.9 | 0.48 |
| 70 | 5.00 | 11.0 | 85.2 | 0.054 | 3.1 | 0.49 |
| 81 | 3.20 | 12.2 | 73.7 | 0.065 | 3.3 | 0.50 |
| 90 | 2.00 | 11.1 | 56.2 | 0.073 | 2.8 | 0.50 |
| 102 | 1.25 | 10.5 | 44.8 | 0.083 | 2.6 | 0.49 |
| 109 | 1.00 | 10.2 | 40.4 | 0.088 | 2.5 | 0.50 |
| 125 | 0.80 | 10.6 | 42.1 | 0.099 | 2.9 | 0.49 |
Other practical measurements
The measurements of all the other parameters required for the determination of eNEQ and eDE were undertaken in the same manner as described elsewhere [21–23]. Briefly, these were as follows.
Measurement of the system transfer properties (STP) of the CR reader. This was achieved using 1-mm-thick Cu at the X-ray port with a tube potential of 70 kV. Three air kerma values without backscatter (1, 4 and 12 µGy) at the position of the CR detector (with the CR detector removed) were measured with a calibrated Unfors Xi dosemeter (Unfors Instruments AB, Billdal, Sweden). The CR detector was then exposed at the three levels of air kerma in turn, being digitised approximately 30 s after each exposure. The mean pixel value of the central 15×15-cm square of each image was plotted against air kerma to derive the STP relationship; all subsequent images acquired on the CR system were linearised using this relationship.
Air kerma measurement at the CR detector and phantom surface. Although not required for the calculation of eNEQ and eDE, it was felt necessary to measure the air kerma under backscatter-free conditions at the position of the phantom surface and CR detector to ensure that any differences in the measured eDE values could be fully discussed (e.g. does a high eDE stem from a high detector entrance kerma?). These metrics were measured at each tube voltage investigated in this study with no added filtration over and above that inherent in the radiographic unit. The air kerma was measured at each tube voltage using the mA values shown in Table 1 with a calibrated Radcal 6-ml ionisation chamber (MDH model 9010; Radcal, Monrovia, CA) positioned on the central axis of the beam, 100 cm from the focus. The air kerma at the phantom entrance surface and the CR detector [detector entrance air kerma (DAK)] was determined by extrapolating the above measurements according to the inverse square law (the DAK was calculated by correcting for phantom transmission—see below). These values can be seen in Table 1.
Transmission factor (TFnb). This was measured under narrow beam conditions with the Radcal ionisation chamber placed 120 cm from the focus and the phantom positioned approximately 5 cm from the X-ray port, to minimise measurement of scattered radiation. Three air kerma measurements were made at each tube voltage with the phantom in place, and then removed. Mean air kerma values were derived for each configuration and the TFnb calculated. TF values can be seen in Table 1. It should be noted that it is very unlikely that narrow beam geometry will skew the DAK values (owing to the absence of scatter), as SFs at each tube voltage differ by <4% from the mean SF.
Scatter fractions. These were measured at each tube voltage using the generic set-up (Phantom acquisitions section), exposure factors shown in Table 1 and a beam stop technique described by Floyd et al [40]. The beam stop consists of an array of 224 lead beam stops, each of 6 mm in thickness and 3 mm in diameter, 25 mm apart, suspended on a 1-mm-thick PMMA sheet. The array was positioned at the tube side of the phantom. SFs were calculated by deriving the ratio of scattered radiation (mean pixel value within each beam stop) to total radiation (mean pixel value adjacent to each beam stop). A CR-acquired image of the phantom with the lead stop array is shown in Figure 2, and SF values can be seen in Table 1.
Effective normalized noise power spectrum (eNNPS). The eNNPS was measured at each tube voltage using the generic set-up (Phantom acquisitions section) and the exposure factors shown in Table 1. A 12.5×12.5-cm square of each image was used to calculate the eNNPS using the methods described by Dobbins et al [41]. A CR-acquired image of the phantom demonstrating the area used for the eNNPS calculation is shown in Figure 3.
Effective modulation transfer function (eMTF). Using the generic set-up (Phantom acquisitions section), the eMTF was measured by placing a radio-opaque tungsten edge tool (manufactured in-house) on the surface of the phantom, centred with the beam axis at each tube voltage with an mA value three times that shown in Table 1. The eMTF was then calculated using the methods described previously [42,43]. A CR-acquired image of the phantom demonstrating the edge tool used for eMTF calculation is shown in Figure 4.
Calculation of the eDE. This metric was calculated at each tube voltage using Equations (2) and (3). To assess correlation with the simulated clinical image quality (VGAS), the mean of the eDE values at 0.5, 1.0, 1.5, 2.0 and 2.5 lp mm–1 at each tube voltage was calculated and found as a function of VGAS.
Figure 2.

A computed radiography-acquired image of the uniform LucAl phantom with the lead stop array visible for calculation of scatter fractions.
Figure 3.

A computed radiography-acquired image of the phantom demonstrating the area used (region of interest) for the effective normalised noise power spectrum calculation.
Figure 4.

A computed radiography-acquired image of the phantom demonstrating the edge tool used for the effective modulation transfer function (eMTF) calculation. The eMTF was calculated in the region of interest.
Measurement of physical image quality—contrast-to-noise ratio
Measurement of the CNR was carried out using the same phantom and radiographic techniques described in the Phantom and Phantom acquisitions sections, respectively. The CNR was measured by adding a paraffin wax block to the lung area of the phantom; a CR-acquired image of the phantom showing the regions of interest (ROIs) used for the CNR calculation is shown in Figure 5. Paraffin wax was chosen for its near-tissue equivalence and availability [44]. The CNR was computed using the following equation:
 |
(4) |
where  is the average value of the pixels in a ROI within the wax block or background, and σwax/bgd their standard deviation.
Figure 5.

A computed radiography-acquired image of the phantom demonstrating the regions of interest used for the contrast-to-noise ratio calculation.
Statistical analysis
All CNR and eDE measurements presented as a function of VGAS in the Results section were derived by finding the arithmetic difference between the measured CNR and eDE at each tube voltage (i.e. kV_X) and CNR and eDE at 102 kV, e.g. CNRkV_1=CNR50kV−CNR102kV, CNRkV_2=CNR60kV–CNR102kV and so forth. This was done because the VGA scores [25] were derived with a reference image acquired at 102 kV, i.e. all test images were scored with respect to the reference. Correlation between the clinical (VGAS) and physical (CNR and eDE) image quality was determined by derivation of Pearson’s correlation coefficient. p <0.05 was considered as a statistically significant correlation between data sets (i.e. a 95% confidence interval). The VGAS error bars shown in the graphical data were calculated by averaging the standard deviations of each VGAS for each chest structure over all patients [25]. The eDE and CNR error bars were found by measuring the standard deviation of the eDE and CNR calculated from five separate images, each acquired with the same exposure factors.
RESULTS
Figure 6 presents the eDE of the CR system for images acquired without an antiscatter grid. For approximately matched detector entrance air kerma (Table 1), the eDE is highest at 50 kVp and decreases as the tube voltage increases. This result is similar to that reported by Ertan et al [45], who found that eDE was superior at low tube voltages on a CR system from the same vendor (Agfa) as that employed here, as did Samei et al [23], albeit with an integrated digital imaging system.
Figure 6.

Plot of effective dose efficiency (eDE) vs spatial frequency. As tube voltage decreases, eDE increases.
Figure 7 shows a linear fit between CNRkV_X and VGAS. A Pearson’s correlation coefficient of 0.87 (p<0.033) was found; both the CNRkV_X and VGAS increase as the tube voltage decreases. The results here therefore demonstrate a good correlation between a basic measure of physical image quality (CNR) and clinical image quality (VGAS). It should be noted that the increase in CNR as the tube voltage decreases (i.e. the X-ray beam becomes “softer”) is because photoelectric absorption increasingly becomes the dominant attenuation process, varying with X-ray beam energy (voltage) as approximately E−3.
Figure 7.

Plot of the contrast-to-noise (CNRkV_X − CNR102_kV) ratio vs visual grading analysis scoring (VGAS). CNR and VGAS increase as tube voltage decreases.
Figure 8 demonstrates a linear fit between the mean eDEkV_X and VGAS. A Pearson’s correlation coefficient of 0.77 (p<0.008) was found; both the mean eDEkV_X and VGAS increase as the tube voltage decreases. The results here are similar to the CNR results in that they demonstrate a good correlation between the physical and the clinical image quality. It is likely that the eDE decreases as the tube voltage increases because of the reduced photon absorption efficiency of the CR phosphor at higher energies [46]; for a constant air kerma at the CR detector (as employed in this study; Table 1), this would lead to more noise (mottle) in an image, thus increasing the magnitude of the eNNPS (it should be remembered that eMTF is relatively unaffected by the tube voltage and effective dose has been held approximately constant).
Figure 8.

Plot of the mean effective dose efficiency (eDEkV_X − eDE102_kV) vs visual grading analysis scoring (VGAS). Mean eDE and VGAS increase as tube voltage decreases.
DISCUSSION
In the UK (and the European Union), a major role of the medical physics expert (MPE) in radiological imaging is to ensure optimisation of patient radiation exposure and image quality. It has been demonstrated in the literature that anatomical noise is the limiting factor in chest radiography, so it would seem logical that any phantoms (physical or computational) used in the optimisation exercise should contain this information. However, the MPE seldom has access to phantoms that contain levels of anatomical detail that adequately mimic real patient data; most medical physics departments utilise non-anatomical commercially available contrast detail phantoms such as the one used by De Crop et al [24] and those available from Leeds Tests Objects Ltd (Boroughbridge, UK), or in-house uniform manufactured ones such as that used in this study. It would therefore be useful if measurements with non-anatomical phantoms could be shown to predict changes in the clinical image quality. In the current study, the correlation between the results of a virtual clinical trial (VGAS) with two measures of physical image quality, CNR and eDE, measured in a phantom containing no anatomical detail has been investigated.
The work presented in this manuscript demonstrates good correlation between the clinically observed image quality and the two physical image quality metrics, measured using a clinically relevant set-up. This significant correlation confirms that differences in the clinical image quality may be predicted with phantoms and measurements that the MPE can easily implement and use. On the basis of this research, it may be possible to establish baseline CNR and/or eDE quantities for chest radiography that correspond to the minimum clinical image quality required. The availability of such baseline measurements will be extremely useful for the MPE within a routine quality assurance programme and for assessing how the introduction of new radiographic techniques (such as new exposure factors) affects the clinical image quality. CNR may be used as a simple descriptor of how beam quality and dose affect the clinical image quality, given that these parameters are unlikely to influence different spatial frequencies in different ways. The eDE may be used to assess how different CR phosphors or even some image-processing algorithms (assuming the linearity of the system is not destroyed) affect the clinical image quality, as it is likely that these parameters will influence different spatial frequencies in different ways. It should be remembered, however, that, given the relatively large errors in the VGAS owing to the limited simulated patient information set (n=50) used in the previous study, the acquired level of change one may expect to see in the clinical image quality, for a given change in the physical image quality, may not be observed in reality. The results reported here must therefore be interpreted in the context of this limitation. Also, these results are only relevant for chest imaging without a scatter grid, which is the standard procedure in our radiology department (and typical in the UK). Nevertheless, further work would be worthwhile to determine whether the same positive correlations apply with images acquired with a grid, and indeed to other anatomies.
It is essential to remember that anatomical detail is an important factor in determining the optimal exposure technique, something that CNR and eDE do not account for. However, given the positive significant correlations derived here with VGAS, and the results of the previous study [25], our radiology department has adopted a standard operating protocol for average chest exposures of 60 kV (reduced from a standard of 85 kV). In the 18 months that the new exposure protocol has been in place, there have been no complaints about the image quality. In the near future we intend to carry out an image quality audit to determine whether the image quality has improved. Large-scale patient dose audits at the new low tube potential, following the method by Wood et al [47], have shown that median dose–area products (DAP) for standard-sized patients are no higher than the national diagnostic reference level of 0.12 Gy cm2 for PA chest exposures. It would be interesting to see whether even lower tube potentials provide superior clinical image quality, but there would undoubtedly come a point where there is so little transmission through the patient that low signal (and subsequently high quantum noise) would become a limiting factor, resulting in un-reportable images. An investigation into this would be worthy of future studies.
Furthermore, it is interesting to report that the results here show eDE and VGAS increase with decreasing tube voltage for approximately equal detector air kerma and equal effective dose (Table 1). It is acknowledged that some hospitals still use high tube voltage techniques primarily to (1) minimise the appearance of ribs and (2) minimise patient entrance dose, but the natural conclusion of this work, as implemented by our radiology department, is that chest CR imaging should be performed at much lower tube voltages (even though a genuinely optimal tube voltage is dependent on the ROI—a difficulty that will only be overcome with the implementation of dual energy imaging). However, one must not forget that, to maintain an equal detector air kerma across the tube voltage range, patient entrance air kerma (i.e. mAs) must be increased as tube voltage is lowered. Nevertheless, the highest entrance air kermas encountered with chest radiography (maximum measured here was 108.5 µGy at 50 kV) will always be sub-mGy, so it should be an effective dose (and therefore risk), and not an entrance dose, that is the limiting factor in determining the optimum tube voltage for chest radiography with digital imaging systems. Another implication of decreasing the tube voltage and increasing the mAs is the possible requirement to increase exposure times, which may result in patient motion blur. However, to produce diagnostically acceptable images, even at very low tube voltages, most modern X-ray generators are capable of restricting exposure times to <20 ms (as recommended by the CEC [28]), assuming there is a corresponding increase in mA. Motion unsharpness should therefore not be an issue. Furthermore, in the era of film–screen radiography high tube voltages were required to overcome the restricted dynamic range of film, but this is no longer an issue with digital detectors. Owing to the results presented in this paper and in previous work [25], the use of low tube voltages for chest radiography is clearly justified.
CONCLUSIONS
It has been demonstrated that a statistically significant correlation between clinical (VGAS) and physical image quality metrics, CNR and eDE, exists for CR chest images acquired without an antiscatter grid. Clinical image quality results were derived from a previously published study and physical image quality metrics were measured in a uniform chest phantom that was relatively simple to construct in-house and use. This will allow the MPE to derive baseline physical measurements that can be used in a quality assurance programme, optimisation studies and in the assessment of the image quality implications of new radiographic techniques. This work has also demonstrated that low tube voltages provide superior image quality for a matched effective dose and risk.
It should be remembered that the findings in this paper are specific to the Agfa CR receptor technology. However, given that most powder-based CR phosphors are based on the barium fluorohalide family, it is likely that the conclusions of this work are transferable to other manufacturers, but further studies would be worthwhile.
REFERENCES
- 1.Hart D, Wall BF, Hillier MC, Shrimpton PC. Frequency and collective dose for medical and dental X-ray examinations in the UK 2008. Chilton, UK: Health Protection Agency; 2010 [Google Scholar]
- 2.The Ionising Radiation (Medical Exposure) Regulations 2000 London, UK: The Stationery Office; 2000 [Google Scholar]
- 3.Bochud FO, Valley JF, Verdun FR, Hessler C, Schnyder P. Estimation of the noisy component of anatomical backgrounds. Med Phys 1999;26:1365–70 [DOI] [PubMed] [Google Scholar]
- 4.Samei E, Flynn MJ, Eyler WR. Detection of subtle lung nodules: relative influence of quantum and anatomical noise on chest radiographs. Radiology 1999;213:727–34 [DOI] [PubMed] [Google Scholar]
- 5.Samei E, Eyler W, Baron L. Effects of anatomical structure on signal detection. In: Beutel J, Kundel HL, Van Metter RL, eds. Handbook of medical emaging. Vol. 1 Physics and psychophysics Orlando, Fl: SPIE Press; 2000. pp. 655–82 [Google Scholar]
- 6.Keelan BW, Topfer K, Yorkston J, Sehnert WJ, Ellinwood JS. Relative impact of detector noise and anatomical structure on lung nodule detection. Proc SPIE 2004;5372:230–41 [Google Scholar]
- 7.Sund P, Bath M, Kheddache S, Mansson LG. Comparison of visual grading analysis and determination of detective quantum efficiency for evaluating system performance in digital chest radiography. Eur Radiol 2004;14:48–58 10.1007/s00330-003-1971-z [DOI] [PubMed] [Google Scholar]
- 8.Håkansson M, Båth M, Börjesson S, Kheddache S, Johnsson AA, Månsson LG. Nodule detection in digital chest radiography: effect of system noise. Radiat Prot Dosimetry 2005;114:97–101 [DOI] [PubMed] [Google Scholar]
- 9.Håkansson M, Båth M, Börjesson S, Kheddache S, Grahn A, Ruschin M, et al. Nodule detection in digital chest radiography: summary of the RADIUS chest trial. Radiat Prot Dosimetry 2005;114:114–20 [DOI] [PubMed] [Google Scholar]
- 10.Bath M, Hakansson M, Borjesson S, Kheddache S, Grahn A, Bochud F O, et al. Nodule detection in digital chest radiography: introduction to the RADIUS chest trial. Radiat Prot Dosimetry 2005;114:85–91 [DOI] [PubMed] [Google Scholar]
- 11.Båth M, Håkansson M, Börjesson S, Kheddache S, Grahn A, Bochud FO, et al. Nodule detection in digital chest radiography: part of image background acting as pure noise. Radiat Prot Dosimetry 2005;114:102–8 10.1093/rpd/nch523 [DOI] [PubMed] [Google Scholar]
- 12.Båth M, Håkansson M, Börjesson S, Hoeschen C, Tischenko O, Kheddache S, et al. Nodule detection in digital chest radiography: effect of anatomical noise. Radiat Prot Dosimetry 2005;114:109–13 [DOI] [PubMed] [Google Scholar]
- 13.Dobbins JT, Rice JJ, Beam CA, Ravin CE. Threshold perception performance with computed and screen-film radiography: implications for chest radiography. Radiology 1992;183:179–87 [DOI] [PubMed] [Google Scholar]
- 14.Chotas HG, Floyd CE, Dobbins JT, Ravin CE. Digital chest radiography with photostimulable phosphors: signal-to-noise ratio as a function of kilovoltage with matched exposure risk. Radiology 1993;186:395–8 [DOI] [PubMed] [Google Scholar]
- 15.Oda N, Nakata H, Murakami S, Terada K, Nakamura K, Yoshida A. Optimal beam quality for chest radiography. Invest Radiol 1996;31:126–31 [DOI] [PubMed] [Google Scholar]
- 16.Tingberg A, Sjostrom D. Search for optimal tube voltage for image plate radiography. Invest Radiol 1996;31:126–318675419 [Google Scholar]
- 17.Honey ID, MacKenzie A, Evans DS. Investigation of optimum energies for chest imaging using film-screen and computed radiography. Br J Radiol 2005;78:422–7 10.1259/bjr/32912696 [DOI] [PubMed] [Google Scholar]
- 18.Båth M, Sund P, Månsson LG. Evaluation of imaging properties of two generations of a CCD-based system for digital chest radiography. Med Phys 2002;29:2286–97 [DOI] [PubMed] [Google Scholar]
- 19.Samei E, Flynn MJ. An experimental comparison of detector performance for direct and indirect digital radiography systems. Med Phys 2003;30:608–22 [DOI] [PubMed] [Google Scholar]
- 20.Mansson LG. Methods for the evaluation of image quality: a review. Radiat Prot Dosimetry 2000;90:89–99 [Google Scholar]
- 21.Samei E, Ranger NT, MacKenzie A, Honey ID, Dobbins JT, Ravin CE. Detector or system? Extending the concept of detective quantum efficiency to characterize the performance of digital radiographic systems. Radiology 2008;249:926–37 10.1148/radiol.2492071734 [DOI] [PMC free article] [PubMed] [Google Scholar]
- 22.Samei E, Ranger NT, MacKenzie A, Honey ID, Dobbins JT, Ravin CE. Effective DQE (eDQE) and speed of digital radiographic systems: an experimental methodology. Med Phys 2009;36:3806–17 [DOI] [PMC free article] [PubMed] [Google Scholar]
- 23.Samei E, Ranger NT, Dobbins JT, Ravin CE. Effective dose efficiency: an application-specific metric of quality and dose for digital radiography. Phys Med Biol 2011;56:5099–111 10.1088/0031-9155/56/16/002 [DOI] [PubMed] [Google Scholar]
- 24.De Crop A, Bacher K, Van Hoof T, Smeets PV, Smet BS, Vergauwen M, et al. Correlation of contrast-detail analysis and clinical image quality assessment in chest radiography with a human cadaver study. Radiology 2012;262:298–304 10.1148/radiol.11110447 [DOI] [PubMed] [Google Scholar]
- 25.Moore CS, Avery G, Swift A, Needler L, Balcam S, Beavis AW, et al. Use of a digitally reconstructed radiograph based computer simulation for the optimisation of chest radiographic techniques for computed radiography imaging systems. Br J Radiol 2012;85:e630–9 10.1259/bjr/47377285 [DOI] [PMC free article] [PubMed] [Google Scholar]
- 26.Moore CS, Liney GP, Beavis AW, Saunderson JR. A method to produce and validate a digitally reconstructed radiograph-based computer simulation for optimisation of chest radiographs acquired with a computed radiography imaging system. Br J Radiol 2011;84:890–902 [DOI] [PMC free article] [PubMed] [Google Scholar]
- 27.Institute of Physics and Engineering in Medicine. Recommended standards for the routine performance testing of diagnostic X-ray imaging systems. Report no. 91. York, UK: IPEM; 2005. 10.1093/rpd/ncs302 [DOI] [Google Scholar]
- 28.Commission of the European Communities European guidelines on quality criteria for diagnostic radiographic images. Report EUR 16260. Geneva, Switzerland: EC; 1996 [Google Scholar]
- 29.Tingberg A. Quantifying the quality of medical X-ray images. An evaluation based on normal anatomy for lumbar spine and chest radiography. Thesis Malmo, Sweden: Lund University; 2000 [Google Scholar]
- 30.Sund P, Herrmann C, Tingberg A, Kheddache S, Mansson LG, Almen A, et al. Comparison of two methods for evaluating image quality of chest radiographs. Proc SPIE 2000;3981:251–7 [Google Scholar]
- 31.Tingberg A, Sjöström D. Optimisation of image plate radiography with respect to tube voltage. Radiat Prot Dosimetry 2005;114:286–93 10.1093/rpd/nch536 [DOI] [PubMed] [Google Scholar]
- 32.Lanhede B, Båth M, Kheddache S, Sund P, Björneld L, Widell M, et al. The influence of different technique factors on image quality of chest radiographs as evaluated by modified CEC image quality criteria. Br J Radiol 2002;75:38–49 [DOI] [PubMed] [Google Scholar]
- 33.Tingberg A, Herrmann C, Lanhede B, Almén A, Sandborg M, McVey G, et al. The influence of the characteristic curve on the image quality of clinical radiographs. Br J Radiol 2004;77:204–15 [DOI] [PubMed] [Google Scholar]
- 34.Tingberg A, Sjöström D. Optimisation of image plate radiography with respect to tube voltage. Radiat Prot Dosimetry 2005;114:286–93 10.1093/rpd/nch536 [DOI] [PubMed] [Google Scholar]
- 35.Conway BJ, Butler BF, Duff JE, Fewell TR, Gross RE, Jenning RJ, et al. Beam quality independent attenuation phantom for estimating patient exposure from x ray automatic exposure controlled chest examinations. Med Phys 1984;11:827–32 [DOI] [PubMed] [Google Scholar]
- 36.Food and Drug Administration and Conference of Radiation Control Program Directors Nationwide evaluation of X-ray trends: Twenty-five years of NEXT. Silver Spring, MD: US Food and Drug Administration; 2003. [Google Scholar]
- 37.Moore CS, Liney GP, Beavis AW, Saunderson JR. A method to optimize the processing algorithm of a computed radiography system for chest radiography. Br J Radiol 2007;80:727–30 10.1259/bjr/33261679 [DOI] [PubMed] [Google Scholar]
- 38.Moore CS, Beavis AW, Saunderson JR. Investigation of optimum X-ray beam tube voltage and filtration for chest radiography with a computed radiography system. Br J Radiol 2008;81:771–7 10.1259/bjr/21963665 [DOI] [PubMed] [Google Scholar]
- 39.Moore CS, Beavis AW, Saunderson JR. Investigating the exposure class of a computed radiography system for optimisation of physical image quality for chest radiography. Br J Radiol 2009;82:705–10 10.1259/bjr/27942950 [DOI] [PubMed] [Google Scholar]
- 40.Floyd CE, Lo JY, Chotas HG, Ravin CE. Quantitative scatter measurement in digital radiography using a photostimulable phosphor imaging system. Med Phys 1991;18:408–13 [DOI] [PubMed] [Google Scholar]
- 41.Dobbins JT, Samei E, Ranger NT, Chen Y. Intercomparison of methods for image quality characterization. II. Noise power spectrum. Med Phys 2006;33:1466–75 [DOI] [PubMed] [Google Scholar]
- 42.Samei E, Flynn MJ, Reimann DA. A method for measuring the presampled MTF of digital radiography systems using an edge test device. Med Phys 1998;25:102–13 [DOI] [PubMed] [Google Scholar]
- 43.Samei E, Ranger NT, Chen Y. Intercomparison of methods for image quality characterization. I. Modulation transfer function. Med Phys 2006;33:1454–65 [DOI] [PubMed] [Google Scholar]
- 44.International Commission on Radiological Units and Measurements Tissue substitutes in radiation dosimetry. ICRU report 44. Bethesda, MD: ICRU; 1989 [Google Scholar]
- 45.Ertan F, Mackenzie A, Urbanczyk HJ, Ranger NT, Samei E. Use of effective detective quantum efficiency to optimise radiographic exposures for chest imaging with computed radiography. Proc SPIE 2009;1:7258 [Google Scholar]
- 46.Fetterley KA, Hangiandreou NJ. Effects of x-ray spectra on the DQE of a computed radiography system. Med Phys 2000;28:241–9 [DOI] [PubMed] [Google Scholar]
- 47.Wood TJ, Davis AW, Moore CS, Beavis AW, Saunderson JR. Validation of a large scale audit technique for CT dose optimisation. Radiat Prot Dosimetry 2012;150:427–33 10.1093/rpd/ncr434 [DOI] [PubMed] [Google Scholar]