Abstract
We report a new step in the fertilization in Xenopus laevis which has been found to involve activation of Src tyrosine kinase to stimulate phospholipase C-γ (PLC- γ) which increases inositol 1,4,5-trisphosphate (IP3) to release intracellular calcium ([Ca]i). Molecular species analysis and mass measurements suggested that sperm activate phospholipase D (PLD) to elevate phosphatidic acid (PA). We now report that PA mass increased 2.7 fold by 1 minute after insemination and inhibition of PA production by two methods inhibited activation of Src and PLCγ, increased [Ca]i and other fertilization events. As compared to 14 other lipids, PA strongly bound Xenopus Src but not PLCγ. Addition of synthetic PA activated egg Src (an action requiring intact lipid rafts) and PLCγ as well as doubling the amount of PLCγ in rafts. In the absence of elevated [Ca]i, PA addition elevated IP3 mass to levels equivalent to that induced by sperm (but twice that achieved by calcium ionophore). Finally, PA induced [Ca]i release that was blocked by an IP3 receptor inhibitor. As only PLD1b message was detected, and Western blotting did not detect PLD2, we suggest that sperm activate PLD1b to elevate PA which then binds to and activates Src leading to PLCγ stimulation, IP3 elevation and [Ca]i release. Due to these and other studies, PA may also play a role in membrane fusion events such as sperm-egg fusion, cortical granule exocytosis, the elevation of phosphatidylinositol 4,5-bisphosphate and the large, late increase in sn 1,2-diacylglycerol in fertilization.
Keywords: phospholipase D, membrane fusion, phospholipase Cγ, membrane rafts, exocytosis
INTRODUCTION
In fertilization of Xenopus laevis, sperm activate Src which in turn activates phospholipase C-γ (PLCγ) to induce the hydrolysis of phosphatidylinositol 4,5-bisphosphate (PI45P2) to inositol 1,4,5-trisphosphate (IP3) and sn 1,2-diacylglycerol (DAG) (Sato et al., 2006). IP3 would then bind to intracellular receptors to cause the release of intracellular calcium ([Ca]i) and activation of fertilization events (Nader et al., 2013). Src family tyrosine kinases and PLCγ are involved in external fertilization in other species: sea urchin, starfish, ascidian, annelids, and fish (Kinsey, 2013; McGinnis et al., 2011b; Moore and Kinsey, 1994; Satoh and Garbers, 1985; Stricker et al., 2010). We now provide evidence that sperm elevate phosphatidic acid (PA) to activate Src during Xenopus fertilization.
A comparison of the mass increases in IP3 (Stith et al., 1992a; Stith et al., 1994; Stith et al., 1993) and DAG (Stith et al., 1992b; Stith et al., 1991; Stith et al., 1997) from Xenopus oocyte maturation through fertilization, and first mitosis and cleavage, provide insight into lipid signaling during these crucial developmental periods. The IP3 mass increase at fertilization begins by 1 min after insemination, and is larger than those IP3 increases during oocyte maturation, first mitosis or first cleavage. The IP3 increase takes place during the sperm-induced wave of elevated [Ca]i and cortical granule exocytosis (Stith et al., 1994; Stith et al., 1993). Induction of polyspermy (entry of ~75 sperm) did not increase IP3 mass over that produced after entry of one sperm and this suggests that much of the IP3 increase occurs during the calcium wave, not at the sperm-egg binding site (Stith et al., 1993). Although PLC can be activated by elevated [Ca]i (Rhee, 2001), sperm stimulate PLC in the absence of elevated [Ca]i and prevention of the [Ca]i increase actually results in a larger increase in IP3 mass (suggesting that the [Ca]i increase stimulates IP3 metabolism)(Stith et al., 1994)(Stith, unpublished manuscript). As another measure of the role of [Ca]i in PLC activation, calcium ionophore only increases IP3 mass to levels less than half that induced by sperm (Stith et al., 1993).
There is a [Ca]i-independent increase in DAG mass at fertilization and we recorded membrane translocation for two isoforms of protein kinase C (PKC) (Stith et al., 1997). However, the DAG increase (48 pmol) occurred later than that of IP3 and was ~300 times larger (Stith et al., 1997). Due to these disparities, that the DAG increase at fertilization is ~50 times larger than the amount of PI45P2 present (Snow et al., 1996), and since choline mass increased at ~1 minute, we suggested that 99+% of the late DAG increase does not originate from PI45P2 hydrolysis by PLC but may be due to phospholipase D (PLD) activation (Stith et al., 1997). PLD catalyzes the degradation of phosphatidylcholine (PC) to phosphatidic acid (PA) and choline, and PA can be dephosphorylated by Lipin to DAG (Bocckino, 1996; Exton, 1994; Martin et al., 1994; Quest, 1996; Reue and Brindley, 2008).
Our subsequent molecular species analysis supported the role for PA: DAG produced at fertilization has monounsaturated fatty acids (Petcoff et al., 2008) which suggests that DAG originates from PC (DAG derived from PI45P2 is largely made up of highly polyunsaturated fatty acids such as 20:4 and 22:6)(Madani et al., 2001; Wakelam, 1998). Specifically, the increase in DAG is largely due to 18:1n9 DAG and there is a similar decline in the amount of this species in PC (Petcoff et al., 2008). As the monounsaturated form of DAG is believed to be unable to stimulate PKC (Madani et al., 2001), this neutral lipid may have other roles in fertilization such as membrane fusion during cortical granule exocytosis.
In addition to being a source for DAG, PA itself may play a direct or indirect role in membrane fusion between sperm and egg or between the plasma membrane and cortical granules (i.e., exocytosis) (Bearer and Friend, 1982; Chapman, 2008; Choi et al., 2006; Domino et al., 1989; Mendonsa and Engebrecht, 2009; Roth, 2008; Sudhof and Rothman, 2009; van den Bogaart et al., 2012; Vitale et al., 2001; Yang and Frohman, 2012).
We report now that PA mass increased during fertilization and that two PLD inhibitors reduced activation of Src, PLC, [Ca]i release, gravitational rotation and first cleavage. Gravitational rotation, where the less dense dark pole of the zygote rotates upward, is a measure of cortical granule exocytosis (Kline, 1988). Furthermore, we find that Xenopus Src (but not PLCγ) binds more strongly to PA than 14 other lipids, and addition of synthetic PA activates both Src, PLCγ and [Ca]i release and doubles the amount of PLCγ in low density, detergent resistant membrane rafts (DRM). These data support a model whereby sperm activate PLD1b to produce PA which activates Src to induce fertilization events (Fig. 13).
Fig. 13. Model for the role of PLD1b and PA in fertilization.
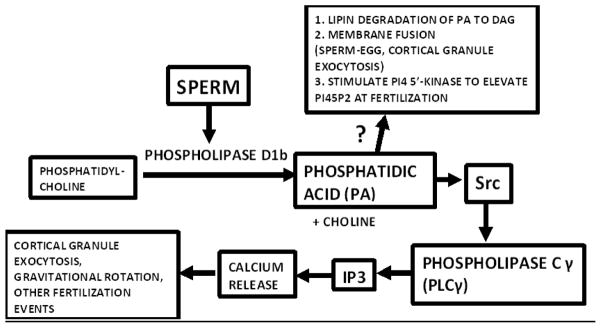
Our work suggests that sperm activate PLD1b very early after insemination, and that phosphatidic acid (PA) may have multiple roles in fertilization: (1) PA stimulates Src which in turn activates PLCγ leading to release of [Ca]i, (2) PA may also play a role in the membrane fusion events of fertilization such as sperm-egg merger or cortical granule exocytosis, (3) PA metabolism may be responsible for the large, late increase in DAG at fertilization, and (4) PA may induce the doubling of PI45P2 during fertilization.
MATERIALS AND METHODS
Xenopus laevis (Daudin) females were obtained from Xenopus One (Ann Arbor, MI, USA), Xenopus Express (Homosassa, FL, USA) or NASCO (Salida, CA, USA). Sperm (167 μL containing 9.47 million sperm) were added to 1 ml of eggs per published protocols (Petcoff et al., 2008; Stith et al., 1994; Stith et al., 1993; Stith et al., 1997). On the day of use, fresh Modified Barth’s Solution (MBS) (pH 7.5; 88 mM NaCl, 1 mM KCl, 2.4 mM NaHC03, 10 mM N-2-hydroxyethylpiperazine-N′-2-ethanesulfonic acid, 0.82 mM MgS04.7H20, 0.33 mM Ca(N03)2.4H20, 0.41 mM CaCl2.2H20) was prepared and fertilization was conducted in 10% MBS. Animal protocols have been approved by the University of Colorado Denver IACUC (#86612(01)1D, expiration date: 1/18/2015). To record the percent of cells undergoing fertilization events, the percentage and time of gravitational rotation (the result of cortical granule exocytosis) and first cleavage was recorded. Under control conditions, we did not see evidence of polyspermy (multiple cleavage furrows).
PA mass measurement
Lipids were extracted with ice cold 1:2 chloroform:methanol (v/v) with BHT, and PA mass was determined with an HPLC (HXPL Rainen, Varian, Santa Clara, CA, USA) and a Sedex 55 evaporative light scattering mass detector (Holland et al., 2003; Stith et al., 2000). PA detector peaks were integrated (Dynamax Method Manager 1.4 software, Rainen), and PA mass calculated with known amounts of standards (Avanti Polar Lipids, Alabaster, AL, USA) and a PA mass of 695 Daltons.
IP3 Assay
PLC activity was recorded by measurement of IP3 mass determined by experimental sample IP3 displacement of labeled IP3 from a calf brain receptor preparation (PerkinElmer Life Sciences, Boston, MA, USA)(Stith et al., 1992a; Stith et al., 1994; Stith et al., 1993). Briefly, IP3 was acid extracted, acid was removed using 600 μl of 3:1 freon:tri-N-octylamine, and the release of [3H]IP3 induced by cold IP3 in the experimental sample was quantified by liquid scintillation. To minimize variation between IP3 receptor preparations and determine the IP3 mass per Xenopus egg, standards were analyzed with each set of experimental samples (Stith et al., 1992a).
Addition of Lipids
Groups of Xenopus eggs were incubated with 400 μM 1,2- Dicapryloyl-sn-Glycero-3-Phosphate (dPA) or control 400 μM 1,2-Dioctanoyl-sn-Glycero-3-[Phospho-L-Serine] (dPS) (Avanti Polar Lipids). In some experiments, cells were treated with 250 μM BAPTA-AM (Calbiochem, La Jolla, CA, USA) or 6.1% DMSO (the carrier for BAPTA-AM) for 1 hour, then 400 μM dPA (10 minutes) was added.
Western blotting in whole cells and raft fractions
For determination of the active, tyrosine phosphorylated forms of Src and PLCγ, cells were homogenized in lysis buffer: 5% BME, 3.5 mM SDS, 200 mM PMSF, 2.5 mM EDTA, Protease Arrest; KP14001 (Calbiochem, San Diego, CA, USA), 0.3% Phosphatase Inhibitor Cocktail 2; P5726 (Sigma-Aldrich Corp., St. Louis, MO, USA), 88% Phosphosafe Extraction Reagent; 71296-3 (Novagen, Billerica, MA, USA), Freon extracted to remove yolk proteins. Following centrifugation (10 minutes, 13,991xg), sample buffer (NP0008, Invitrogen, Life Technologies, Grand Island, NY, USA) was added and samples boiled. After electrophoresis and transfer to 0.45 μm Immobilon- FL PDVF membrane (Millipore, Billerica, MA, USA), antibodies to Src phosphorylated on tyrosine 416/418 (44-660G, Invitrogen) or PLCγ1 phosphorylated on tyrosine 783 (AB4828, Abcam, Boston, MA, USA) were used to detect the activated forms of the enzymes (McGinnis et al., 2011b; Sato et al., 2002; Sato et al., 2001; Sato et al., 2003; Sato et al., 2000; Stricker et al., 2010; Tokmakov et al., 2002). In the lipid binding experiment, total PLCγ1/2 was detected with a commercial antibody (51911, Abcam). After use of Odyssey Blocking Buffer (927-40000, LI-COR Biosciences, Lincoln, NE, USA), goat anti-rabbit polyclonal antibody conjugated to an infrared fluor (at 700 nm: 926-32220, and 926-32211 at 800 nm; LI-COR Biosciences) was added and detection utilized an Odyssey two-laser infrared imaging system (LI-COR). In addition, a phosphoSrc ELISA was used as a second method to record Src activation (KHO 0171, Biosource International/Life Technologies).
A “pan PLD” antibody against all isoforms of PLD (conjugated to KLH; gift from Dr. David Brindley; University of Alberta, Edmonton, Canada) was used. To detect PLD1b, an custom antibody was generated by use of a peptide that spans the splice site present only in the 1b isoform of PLD (SIDSESHRGSVR; see Fig. 12) (Open Biosystems/Thermo Scientific, Waltham, MA, USA). We also used four commercially available polyclonal, affinity purified PLD antibodies (Biosource International/Life Technologies): antibodies against the N terminus of human PC-specific PLD1, against the N terminus of mouse PC-specific PLD2, against an internal domain of human PC-specific PLD1 and against an internal domain of mouse PC-specific PLD2. Groups of 100 cells were homogenized by ice cold mortar and pestle in the presence of protease inhibitors (AEBSF, E-64, bestatin, leupeptin, aprotinin, EDTA; P2714, Sigma-Aldrich). After clearing with protein A sepharose and PLD immunoprecipitation (with the pan PLD antibody and protein A sepharose), electrophoresis and Western blotting were conducted with the Odyssey detection (Stith et al., 1996).
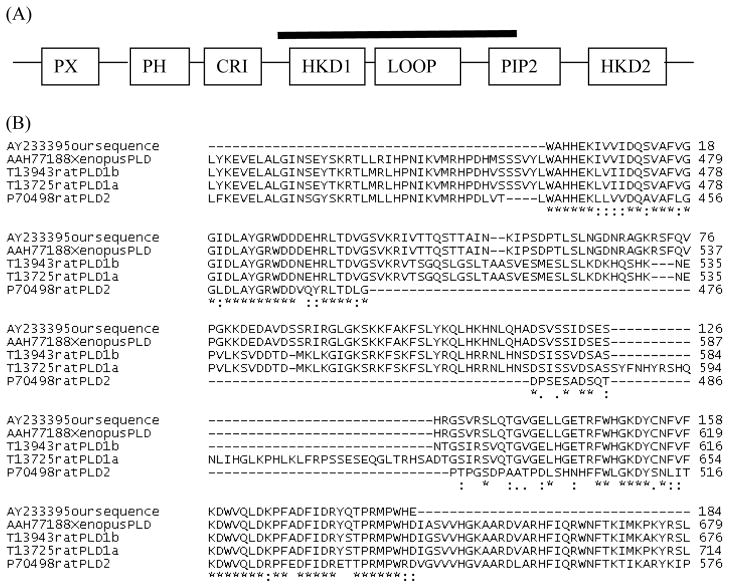
Fig. 12. Reverse Transcriptase PCR suggests that only PLD1b is present in the Xenopus Egg.
(A) The partial clone obtained from Xenopus eggs corresponds to the sequence found under the solid black line of PLD. The domain structure of mammalian PLD1a (1074 amino acids) includes PX (PHOX), PH (Pleckstrin) and PIP2 domains which interact with lipids, whereas the CRI and HKD domains make up the active site. The loop domain may block the active site for autoinhibition. (B) CLUSTAL W was used for multiple sequence alignment of the Xenopus PLD fragment (AY233395) from Xenopus eggs (this paper), homologous regions of the sequence reported subsequently from Xenopus stage 10 embryos (AAH77188), and Rat PLD1b (T13943), Rat PLD1a (T13725), and Rat PLD2 (P70498) isoforms. The symbol “*” represents identical amino acids in all sequences, and “:” refers to conservative substitutions, and “.” refers to semiconservative substitutions.
Using modifications of published methods (Luria et al., 2002; Tokmakov et al., 2010), Xenopus egg detergent-resistant membrane rafts (DRM) and non-DRM fractions were isolated with 1% Triton X-100 and density gradient centrifugation. Groups of 110 eggs were dejellied (2% L-cysteine)(Stith et al., 1997), homogenized with glass mortar and pestle in 1% Triton X-100, with protease and phosphatase inhibitors (see above), followed by centrifugation (15,000xg, 10 min, 4° C). The fluffy layer just above the dark pellet is removed and mixed with Optiprep (Sigma, D1556) to a final concentration of 42.5% Optiprep, and 1.5 ml is placed into a polyallomer ultracentrifuge tube. This solution is overlaid with 7.5 mL of 30% and then 2 mL of 5% Optiprep and then centrifuged for 23 hours at 144,000 x g (39,000 rpm) in a Sorvall WX Ultracentrifuge with a TH641 rotor (4° C). A light scattering band between the 5% and 30% layers contains the lipid rafts (collecting one mL fractions from the top, rafts are in fractions #3 and #4, with the non-raft membrane in fractions #9 and #10). Sample buffer is then added to a density gradient fraction and Western detection was performed for caveolin (antibody from Sigma-Aldrich), Src and PLCγ.
Fluorescent Imaging and Calcium Detection
To prevent artificial activation due to injection of calcium-sensitive dye, eggs were massaged out of the albino frog directly onto a 1mm polypropylene grid (Spectrumlabs; Rancho Dominguez, CA, USA) and rinsed for 2 minutes in a wash solution (~10 ml of 10 mM Chlorobutanol, 82.5 mM NaCl, 20 mM MgCl2, 10 mM HEPES, and 2 mM EGTA; pH 7.5)(Larabell and Nuccitelli, 1992; Sato et al., 1999). The solution was then removed and eggs were microinjected (NanoJect II Microinjector; Drummond Scientific; Broomall, PA, USA) with fluorescent calcium-sensitive dye Fluo-4 (5 nL, to a final concentration of 100 μM) (Invitrogen), and then the dish was flooded with the wash solution for another 2 minutes. After Fluo-4 injection, eggs were washed with and kept in MBS and allowed to rest for 30 minutes. Eggs were then incubated in 2-butanol, carrier DMSO, or PLD inhibitors: either 1-butanol (VWR, Radnor, PA, USA) or 5-Fluoro-2-indolyl des-chlorohalopemide (FIPI) (Sigma-Aldrich or Caymen Chemical, Ann Arbor, MI) for 30 minutes and washed in MBS before insemination.
To record [Ca]i, images were recorded with an inverted Nikon Diaphot fluorescence microscope and 75W Xenon lamp (Nikon Inc., Melville, NY), and an ORCA-ER Digital Camera and shutter box (Hamamatsu Corporation, San Jose CA). Cells were imaged while in a well of a 12 well plate (Corning, Inc.; Corning, NY) with a 10x ocular and 4x Nikon objective (at 40x, one cell filled the image). Two Nikon excitation filters (450–490, 410–500 nm) were used with a dichroic mirror (reflecting less than 510 nm), and with a Nikon emission filter (passes light > 520 nm). A region of interest was drawn around each cell, and images were acquired at 1–2 frames per second in 2.1-tone grey scale for rapid capture and analysis using Simple PCI 6 imaging software (Hamamatsu).
To estimate actual [Ca]i, calcium standards (Cal-BUF 1; World Precision Instruments, Sarasota, FL) were combined with a Fluo-4 solution and fluorescent units recorded. With known concentrations in the standard-fluor mixture, ionic strength was calculated with Lenntech Ionic Strength calculator (http://www.lenntech.com/calculators/activity/activity-coefficient.htm) and free [Ca] was found with MaxChelator (http://maxchelator.stanford.edu/) (Stith et al., 1994). A standard line, with a regression coefficient (r2) of 0.98, was obtained: fluorescence units = (1889) (log of free [Ca]) + 186. To determine the total amount of calcium released, fluorescence units entered into this logarithmic calcium standard line to estimate the actual [Ca]i values. Using an estimated free volume of 0.56 μL (Stith et al., 1993), the actual amount of calcium released was found. With this value as the height of a triangle, and the base being 20 minutes, the area was equal to the amount of calcium released in femtomoles per min.
Synthetic dPA or dPS was added to intact Xenopus eggs or to eggs that were partially dejellied (Stith et al., 1997) and no difference in size of the fertilization [Ca]i release was noted (data not shown). In some groups, dejellied eggs were preincubated (30 minutes) with the cell permeable IP3 receptor blocker 2-aminoethoxydiphenyl borate (2APB) (Calbiochem) (Maruyama et al., 1997). 2APB inhibited fertilization events (data not shown), and, as Xenopus eggs do not have store-operated calcium entry (Nader et al., 2013), 2APB does not act through inhibition of this process. To compare the time of the initial changes in phosphoSrc and phosphoPLCγ after dPA addition, oocytes were used to reduce the variability for dPA to reach the cell as oocytes lack the covering layers that surround the egg. In order to obtain stage VI oocytes, frogs were primed with 35IU pregnant mare’s serum gonadotropin (PMSG) (Calbiochem). The ovaries were surgically removed and placed into room temperature O-R2 solution (83mM NaCl, 0.5 mM CaCl2, 1mM MgCl2, 10 mM HEPES, pH 7.5). Healthy stage VI oocytes were then manually isolated from follicular membranes using forceps and maintained in O-R2 (Stith et al., 1992b). Cells were injected with fluor in calcium free O-R2 then transferred to O-R2. After a 30 minute recovery period, dPA or dPS, or H202 were added.
Binding of protein to lipids
Xenopus laevis oocytes were placed into O-R2 buffer (83mM NaCl, 1mM MgCl2, 10mM HEPES, 0.5mM CaCl2), and homogenized (2 ml glass Dounce homogenizer) with 1.1 ml of lysis buffer (100 μl of protease inhibitor cocktail 2, Sigma-Aldrich, P2714; 2mM mM PMSF in DMSO in RIPA). After Freon extraction, centrifugation (10 minutes, 13,991xg), supernatants were incubated for 1 hour with PIP Strips (P-6001, Echelon Biosciences, Salt Lake City, UT, USA). PIP Strips, which are spotted with 100 pmoles of 15 lipids, were pre-blocked by Odyssey Blocking Buffer (927-40000, LI-COR) for 1 hour before use. The strips were washed 3 times, 5 minutes each, with a PBS-Tween solution (0.1% Tween-20, 137mM NaCl, 2.7mM KCl, 10mM Na2HPO4, 1.8mM KH2PO4). The PIP strips were incubated for one hour with antibody raised against Xenopus laevis Src (1:500; gift of Dr. Ken-Ichi Sato, Kyoto Sangyo University, Kyoto, Japan) or with PLC γ1/2 antibody (1:500; ab51911; Abcam). After washing with PBS-Tween, goat secondary antibody raised against rabbit antibodies (1:20,000; 926-3221; LI-COR) was added (1 hour), the PIP strips washed, and bands quantified with the Odyssey system.
Partial Clone of Xenopus PLD1b
Since PLD amino acid sequences WAHHEK and PRMPWHD are conserved in human and yeast (Nakashima et al., 1997), we synthesized degenerate primers designed from these sequences (Oligo 1000M DNA synthesizer, Beckman Coulter). Sense: TGGGCICACCACGAAAA, TGGGCICACCACGAGAA, TGGGCICACCATGAAAA, TGGGCICACCATGAGAA, TGGGCICATCACGGAAAA, TGGGCICATCACGAGAA, TGGGCICATCATGAAAA, TGGGCICATCATGAGAA. Antisense: TCATGCCAIGGCATICGIGG, TCATGCCAIGGCATICTIGG, TCGTGCCAIGGCATICGIGG, TCGTGCCAIGGCATICTIGG.
Xenopus eggs were flash-frozen in liquid nitrogen and total RNA was obtained (MicroRNA Isolation kit, Stratagene, La Jolla, CA, USA) and stored in DEPC-treated water. Using 5 ug of total RNA, cDNA was synthesized by Moloney Murine Leukemia Virus reverse transcriptase (Ready to Go kit, GE Healthcare, Piscataway, NJ, USA) and purified (High Pure PCR Purification kit, Roche Applied Science, Indianapolis, IN, USA). With 12 different FailSafe Premixes (Epicentre, Madison, WI, USA), PCR amplification was performed for 30 cycles at 94 deg C (30 s), 45 deg C (2 minutes), 72 deg C (3 minutes), with a final hold at 72 deg C (7 minutes)(Gene Amp PCR System 2400; Perkin Elmer, Boston, MA, USA). Products were separated by electrophoresis on 1.2% agarose gels (E-Gels, Invitrogen) and extracted (QIAquick gel extraction kit, Qiagen, Germany). PCR products (in pCR4-TOPO vector; TOPO TA Cloning kit, Invitrogen) were transformed into TOP10 E. coli, which were incubated (37°C). Plasmids were isolated from the colonies (Wizard Plus SV miniprep DNA purification kit, Promega, Madison WI, USA), and cycle sequencing was performed (BigDye terminator v3.1 cycle sequencing kit; Applied Biosystems/Life Technologies) using M13 forward and M13 reverse primers in separate reactions. After purification of the PCR products (Performa DTR gel filtration cartridges; Edge BioSystems, Gaithersburg, MD, USA), drying (SpeedVac, Thermo Fisher), resuspension in Template Suppression Reagent, heating and chilling, samples were sequenced by dideoxy nucleotide termination (sequenase, Prism 310 automated DNA sequencer, Applied Biosystems/Life Technologies).
A DIG-labeled 48 mer oligonucleotide (antisense to the first HKD motif of human PLD1) was synthesized on Oligo 1000M DNA synthesizer and was used to probe for PLD mRNA on northern blots of total RNA from Xenopus eggs. An anti-DIG antibody conjugated to alkaline phosphatase was then bound to the probe, chemiluminescent substrate (CDP star; Roche Applied Science, Indianapolis, IN, USA) was added, and the blot was then exposed to x-ray film for 1 h.
Statistics
All data in the text and figures are reported as average ± standard error of the mean (s.e.m.) and n is equal to the number of data points. Standard [Ca] regression lines and the Student’s t-test (in figures, significance was noted with an asterisk) were obtained with SigmaPlot (version 11.2, Systat Software, San Jose, CA, USA).
RESULTS
PA levels increase at fertilization
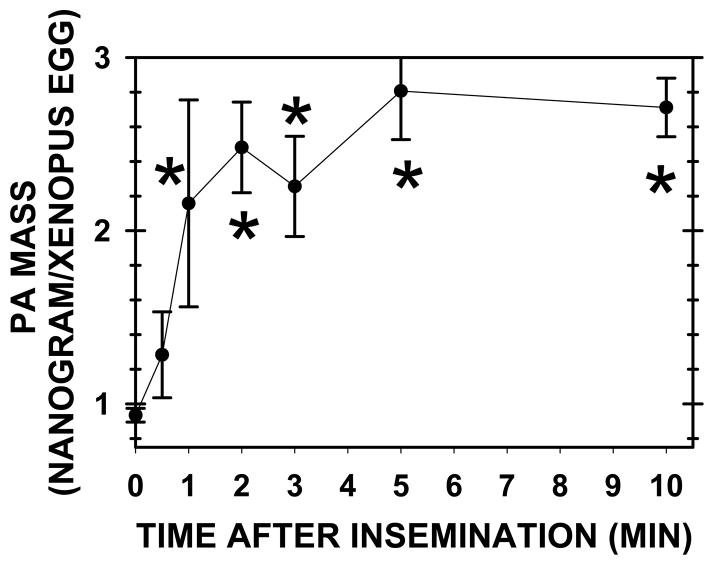
At fertilization, PA mass increased 2.7 fold (from 0.93 ± 0.04, n=20, to 2.51 ± 0.13 ng/egg, n=29) (P< 0.001) (Fig. 1), or from 1.34 to 3.61 pmol/egg for an increase of 2.27 pmol/egg (assuming a PA molecular mass of 695 Da). Maximal PA levels were achieved by 1 minute after insemination (PA values from 1 to 10 minutes were not significantly different). As IP3 mass increases at 45–60 seconds after insemination (Stith et al., 1993), one would expect a rapid increase in PA mass if the lipid plays a role in the activation of PLC.
Fig. 1. PA mass elevates to maximal levels within one minute of insemination.
The lipids from 200 Xenopus eggs or zygotes were extracted and PA mass determined by HPLC and light scattering detection (Holland et al., 2003). For the egg alone value (time zero), there were 20 determinations, whereas later time points involved 5–8 determinations.
Sperm contain PA (W. Holland, B. Stith, unpublished), but since the PA value at 30 seconds was not different from egg alone, the amount of PA in sperm (~1 millionth the size of eggs) was not significant relative to eggs.
Inhibition of PA production by 1-Butanol inhibits fertilization events
PA production through the action of PLD is inhibited by primary alcohols whereas secondary alcohols are without effect (Brown et al., 2007; Exton, 2002a, b). Thus, eggs were treated with 1-butanol or 2-butanol, washed, and then inseminated. We used 1-butanol due to its ability to enter cells and it allows the use of a secondary alcohol (2-butanol) to control for alcohol effects. Furthermore, there are apparently lower nonspecific effects with 1-butanol than with ethanol, and PLD shows higher affinity for 1-butanol over ethanol (Bonser et al., 1989; Dainin M, 1993; Randall et al., 1990).
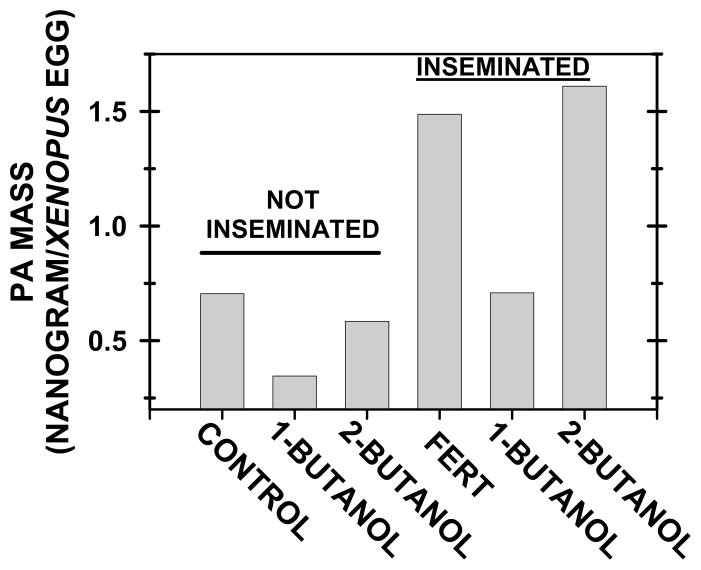
In Fig. 2, note that once again PA increased after insemination and that 1-butanol (but not 2-butanol) blocked this increase. These data support the idea that sperm activate PLD to increase PA mass and that PA is not produced through other pathways.
Fig. 2. 1-Butanol, but not 2-butanol, inhibited the PA increase at fertilization.
As PLD production of PA is inhibited by primary (but not secondary) alcohols, groups of 200 eggs (“not inseminated”) were treated with either 0.75% “1-BUTANOL” or “2-BUTANOL” for 30 minutes, and then lipids were extracted for PA analysis. In the “inseminated” groups, lipids were extracted 4 minutes after insemination. In comparison to the control group with untreated eggs (“FERT”), eggs were treated with 0.75% “1-BUTANOL” or “2-BUTANOL” for 30 minutes before insemination.
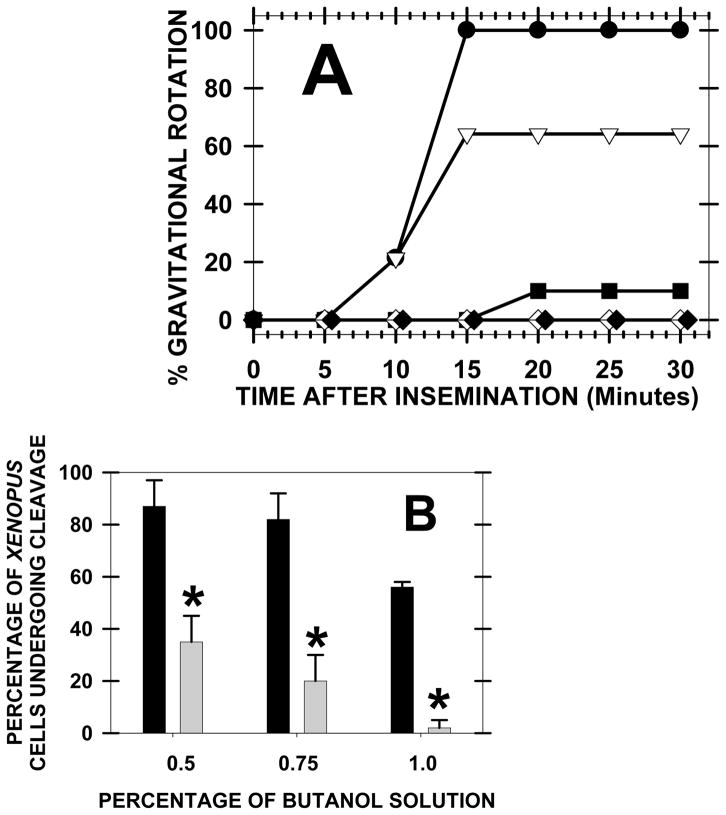
Furthermore, since the primary alcohol prevented the elevation of PA, we determined whether fertilization events were affected. 1-Butanol (0.5–0.75%) treatment of eggs fully inhibited fertilization events such as gravitational rotation (a measure of cortical granule exocytosis) and first cleavage (Fig. 3). A lower concentration (0.1%) of 1-butanol did not slow or reduce the percentages from control (data not shown). 2-Butanol (0.75–1%) produced less inhibition or no effect. Note that 0.5% 1-butanol induced 100% inhibition of gravitational rotation but only 61% inhibition of first cleavage. 1-Butanol may inhibit exocytosis more strongly than other fertilization events (see later discussion on 1-butanol inhibition of exocytosis by a method not involving PLD inhibition).
Fig. 3. Inhibition of PA production by 1-butanol inhibited two fertilization events.
Groups of 15 eggs were preincubated with butanols for one hour, and then the eggs were washed (3x, 30 minutes) before insemination and microscopy. (A) The percentage of zygotes undergoing gravitational rotation (after cortical granule exocytosis, the less dense animal pole rotates upward) was graphed for control (closed circle) and these treatment groups: 1% 2-Butanol (open point), 1% 1-Butanol (closed square), 0.75% 1-Butanol (closed diamond), and 0.5% 1-Butanol (open diamond). Due to variability in gravitational rotation between cells from different animals, we report a typical example but repeated the experiment 10 times with similar results. (B) The percentage of zygotes that underwent first cleavage was recorded after pretreatment of eggs with various concentrations of 2-Butanol (filled bar) or 1-Butanol (shaded bars). The data were collected at 120 minutes after insemination and minimal variation was found between cells from different animals, so four experiments are summarized (15 cells per group for each experiment) (asterisk denotes significance at P< 0.05).
The current model for Xenopus fertilization involves Src activation of PLCγ which leads to [Ca]i release (Sato et al., 2006). Similar to many other fertilization studies (McGinnis et al., 2011a; Sato et al., 2003), activation of Src was recorded by Western blot analysis using antibodies against phosphotyrosine418 Src.
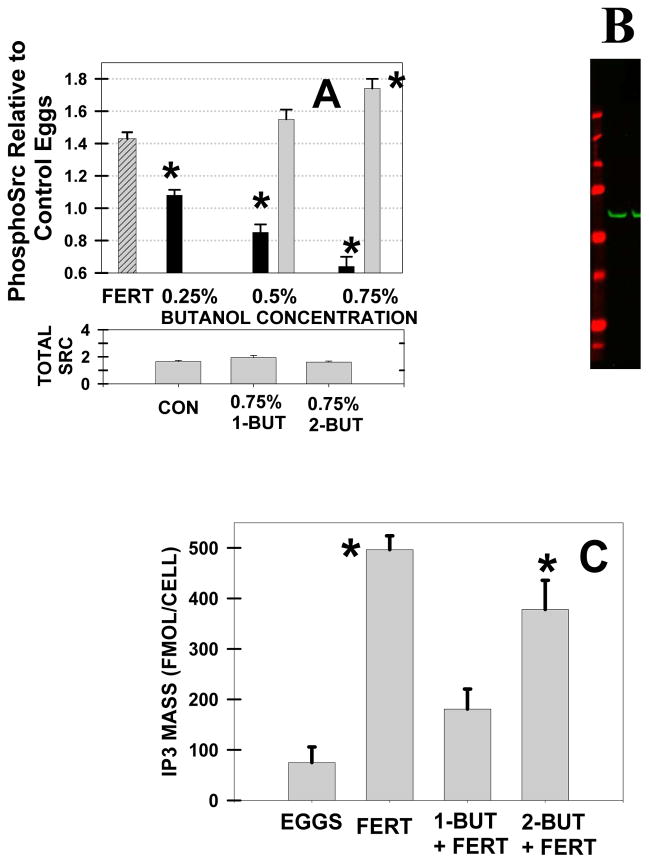
Whereas fertilization is associated with a 40% increase in phosphoSrc at 2 minutes post-insemination, 1-butanol fully blocked this elevation (Fig. 4A). In contrast, 2-Butanol did not lower phosphoSrc (in fact, 0.75% 2-butanol increased the level of phosphoSrc). These changes in phosphoSrc are not due to changes in total Src protein (Fig. 4A). With detection by the infrared Odyssey system, the phosphoSrc antibody produced one band at the appropriate molecular mass (~59 kDa) (Fig. 4B).
Fig. 4. 1-Butanol, but not 2-butanol, inhibited the Src and PLC activation in Xenopus fertilization.
(A) Src activation was detected by Western blotting for phosphoSrc. At 2 minutes postinsemination, fertilization (“FERT” group; n=4; striped column) was associated with a 43% increase in phosphoSrc (P< 0.002). After a 1 hour preincubation, increasing levels of 1-butanol (filled bars) decreased the level of Src activation at 2 minutes, whereas 2-butanol treatment (grey bars) had no effect or increased phosphoSrc (asterisks denote P< 0.01). Attached at the bottom of panel A, total Src does not change with butanol treatment. (B) Sample Western blotting image of phosphoSrc (59 kDa) with a LI-COR Odyssey infrared system. Gel standards were: 250, 150, 100, 75, 50, 37, and 25 kDa. (C) As compared eggs alone (“EGGS”), IP3 mass increased 5 minutes after insemination (“FERT”) (n=4 for all groups) (asterisks denote P<0.05). The other two inseminated groups were preincubated (1 h) with 0.75% 1-butanol (“1-BUT+FERT”) or 2-butanol (“2-BUT+FERT”). 1-Butanol treatment decreased the IP3 elevation as compared with that of the control fertilization (P<0.0006) and 2-butanol treated (P<0.03). 2-Butanol treatment did not lower the IP3 peaks from control fertilization.
As a measure of PLC activation, IP3 mass increases at fertilization (Stith et al., 1994; Stith et al., 1993) but 1-butanol prevented this increase (Fig. 4C). The basal level of IP3 mass in eggs before insemination (74 ± 31 fmol/egg) was similar with groups that were pretreated with 0.75% 1-butanol and inseminated (181 ± 40 fmol/cell), however the level of significance was P < 0.081. In contrast to the 1-butanol results, pretreatment with 2-butanol did not inhibit the increase in IP3 mass at fertilization.
In summary, 1-butanol fully inhibited the fertilization PA increase, Src tyrosine phosphorylation, gravitational rotation, and cleavage.
PLD inhibitor FIPI blocks Src activation at fertilization
FIPI is a new inhibitor of both phospholipase D1 and 2 (Chang et al., 2011; Faugaret et al., 2011; Monovich et al., 2007; Patel et al., 2011; Secor et al., 2011; Su et al., 2009) that is more specific than 1-butanol (Su et al., 2009; Yanase et al., 2010).
FIPI inhibited the PA increase at fertilization (Fig. 5A) and, like 1-butanol, FIPI fully inhibited the increase in phosphoSrc at fertilization (Fig. 5B). In addition, as the 1 minute phosphoSrc value was not different from egg alone, sperm addition alone did not explain the 42% increase in phosphoSrc at 2–3 minutes (phosphoSrc levels return to control values by 4 min after insemination; data not shown).
Fig. 5. PLD inhibitor FIPI inhibited fertilization events.
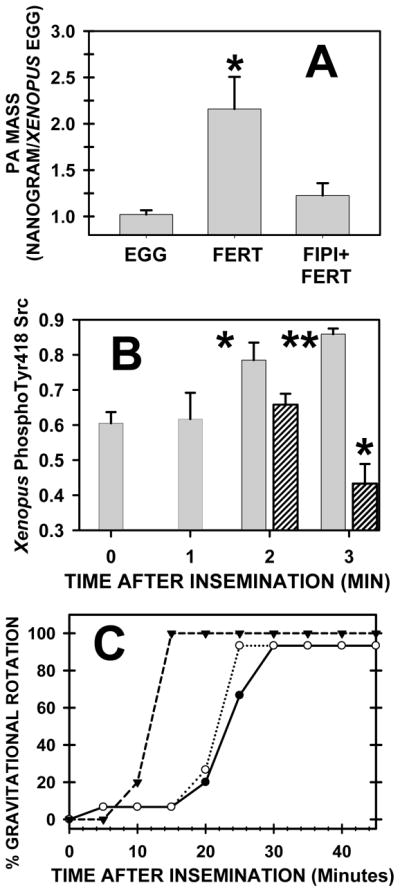
(A) PA mass was measured before fertilization (EGG; n=5) and 4 min after insemination (FERT; n=7), and, in the third group (FIPI+FERT; n=8), 5 μM FIPI was added for 30 minutes before insemination. PA mass elevated at fertilization (P< 0.003) but FIPI inhibited this increase (P< 0.226). (B) PhosphoSrc levels increase from untreated eggs (time zero) at 2–3 minutes after insemination (shaded bars), whereas pretreatment with 10 μM FIPI (striped bars)(30 minutes) inhibited this increase (as compared to time zero, one asterisk denotes P < 0.03 whereas two signify P < 0.0001). (C) FIPI delayed gravitational rotation (a measure of cortical granule exocytosis) after insemination. Eggs (20 per group) were preincubated (30 minutes) with increasing concentrations of FIPI (open triangle: control fertilization; closed point: 1 μM FIPI; open circle: 10 μM FIPI).
Gravitational rotation is a measure of [Ca]i-induced cortical granule exocytosis. Whereas 0.5% 1-Butanol fully inhibited, FIPI delayed gravitational rotation by ~10 minutes and did not significantly reduce the final percentage of cells undergoing gravitational rotation (Fig. 5C). In addition, 2, 5 or 10 μM FIPI (30 min egg pretreatment followed by washing) delayed first cleavage by 11 minutes. Note that all FIPI treated groups achieved 100% first cleavage and FIPI did not induce polyspermy.
1-Butanol and FIPI inhibition of the fertilization [Ca]i release
The central event of fertilization is the release of [Ca]i in the form of a wave that spreads from the sperm binding site to the other side of the zygote (Busa and Nuccitelli, 1985; Fontanilla et al., 1998).
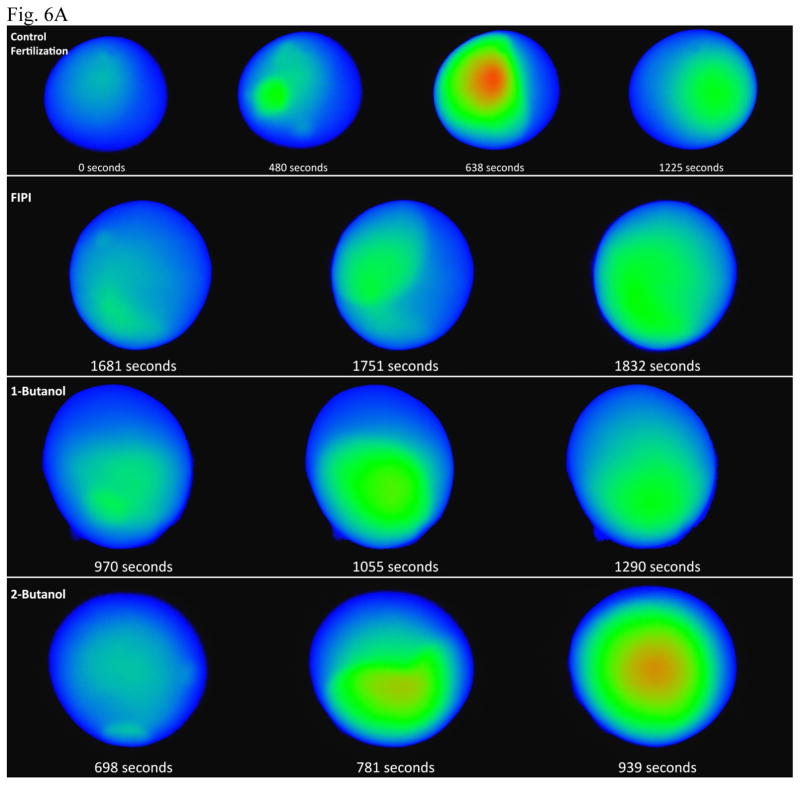
With our intracellular calcium imaging system (control fertilization, top row, Fig. 6A), we typically observed transient spots of [Ca]i release, which are presumed to be sites of initial sperm-egg interaction that would generate a [Ca]i wave. For example, spots were visualized at the left and near the bottom of the cell (second image from left, top row, Fig. 6A). These small [Ca]i increases began 5.59 ± 0.43 minutes after insemination (n=7). In contrast, we estimate that sperm egg contact and the IP3 mass increase maximizes by 1 min after insemination (Stith et al., 1993). As has been noted by other methods that require use of micropipettes [recording membrane potential; (Busa and Nuccitelli, 1985) or injection of calcium-sensitive dyes; (Fontanilla and Nuccitelli, 1998)], the breach of the plasma membrane by the injection needle delays sperm-egg merger. The micropipette may induce a small membrane depolarization that acts as a partial “fast block to polyspermy” to delay sperm-egg merger by ~3 to 9 minutes (Glahn and Nuccitelli, 2003). After injection of fluor, our delay of ~5 minutes suggests that injection calcium leakage around the micropipette was minimal.
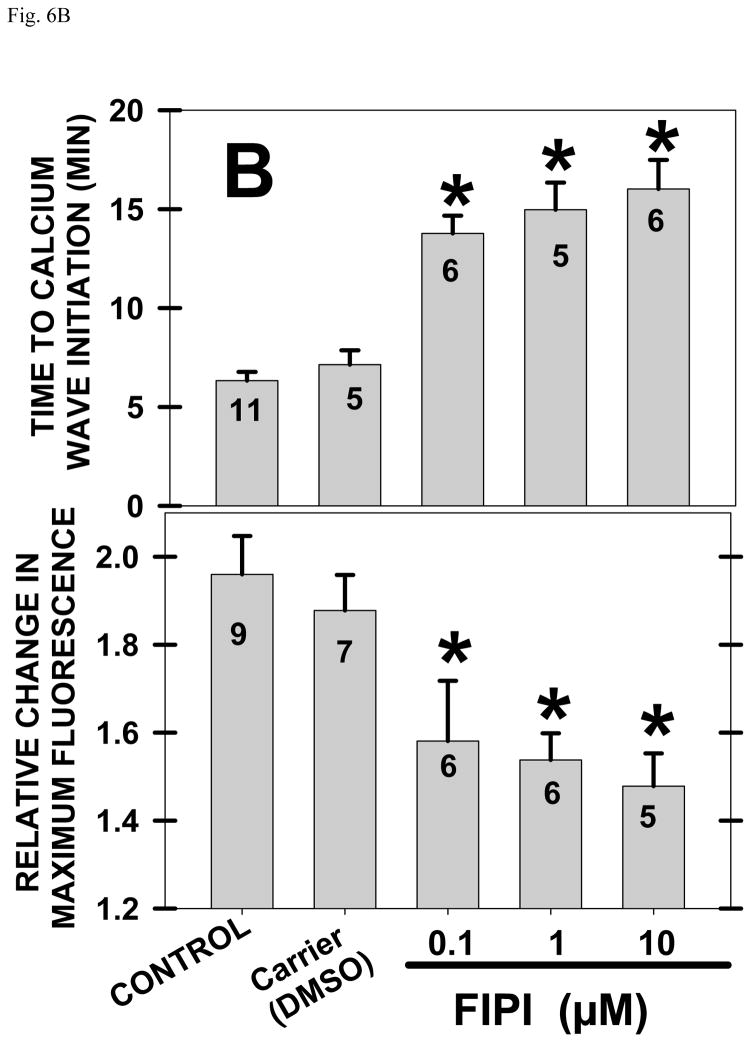
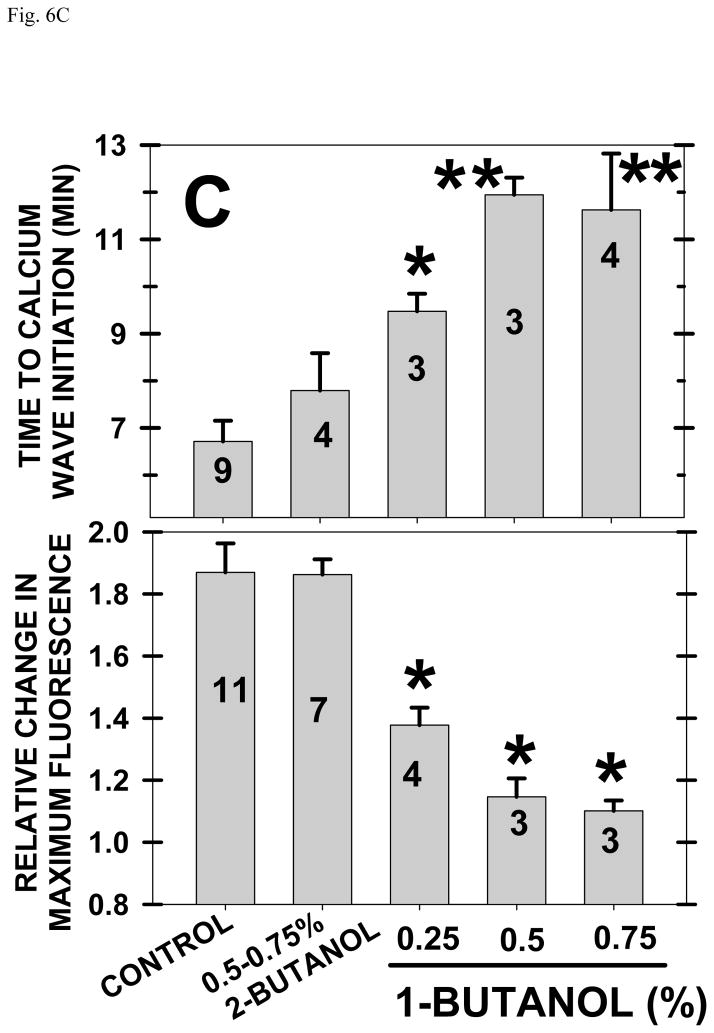
Fig. 6. FIPI or 1-Butanol inhibit the [Ca]i release at fertilization.
(A) The top row shows the [Ca]i wave after insemination of albino Xenopus eggs, whereas the second and third rows show the [Ca]i in the presence of the PLD inhibitors FIPI (10 μM) or 1-Butanol (0.75%). The bottom row shows cells treated with the control 2-Butanol (0.75%). The time for the determination is noted under each image (note the variance), and the highest [Ca]i is represented by red, next by green, and blue represents the lowest [Ca]i. (B) Pixels of [Ca]i images from multiple experiments (numbers in the columns represent different cells) were summarized to show that (top) FIPI slowed the initiation of the sperm-induced calcium wave, and (bottom) reduced the size of the [Ca]i increase (measured by recording relative changes from basal to peak fluorescence). The carrier for FIPI (1.3% DMSO) did not affect either time to wave initiation or maximal [Ca]i. (C) As compared to controls, 1-Butanol delayed the wave initiation and reduced the size of the [Ca]i increase. 2-Butanol had no effect. One asterisk denotes a P < 0.03 whereas two signify P < 0.0001.
Pretreatment of eggs with FIPI (second row, Fig. 6A) or 1-butanol (third row, Fig. 6A) delayed the onset of the wave and reduced the peak [Ca]i (red color) achieved. In contrast, 2-butanol (bottom row) had little effect (note the local [Ca]i releases at the bottom and right side of the egg by 11 minutes/698 seconds, and that the wave passed the middle of the zygote by ~11–13 minutes).
The time from insemination to the large rise in [Ca]i, and the fluorescence units at the peak [Ca]i (found just behind the leading edge of the [Ca]i wave) were quantified. A summary (11 experiments) showed that FIPI slowed the average time to initiation of the [Ca]i wave by ~9 minutes- from 6 to 15 minutes after insemination (Fig. 6B). This delay is similar to that induced by FIPI for [Ca]i-dependent gravitational rotation (a measure of cortical granule exocytosis) (Fig. 5C). In addition, the 2 fold increase in maximal [Ca]i values was reduced by FIPI from 2 to 1.5 relative fluorescence units (Fig. 6B). With fluorescence units, the calcium standard line and free intracellular volume, peak [Ca]i values, and combining all control (n=11) or FIPI treated groups (n=20; values not significantly different with different FIPI concentrations)(see Methods), FIPI induced an 87% decrease in the amount of intracellular calcium released over 20 minutes; restated, FIPI decreased the fertilization calcium release from 7570 to 970 femtomoles of calcium per zygote.
1-Butanol also delayed [Ca]i wave initiation by ~12 minutes and reduced the maximum [Ca]i achieved whereas 2-butanol had no effect (Fig. 6C). Combining data with 0.25, 0.5 and 0.75% 1-butanol (groups were not significantly different from each other), calcium release over 20 minutes was lowered from 7570 to 1150 femtomoles per zygote for an 85% decrease. With two different inhibitors producing equivalent inhibition of [Ca]i release, it is less likely that FIPI was acting as a calcium buffer or that 1-butanol was acting through a nonPLD action.
Neither pretreatment of the egg with FIPI or 1-butanol blocked sperm movement through the egg jelly, or sperm interaction with the egg, as sperm were able to induce a brief, local increase in [Ca]i at the sperm binding site. For example, in the case of FIPI pretreatment, note the local calcium release (sperm-egg binding) in the upper left side of the cell at 1681 seconds (row 2, column one, Fig. 6A).
PA binds Xenopus Src, but not PLCγ
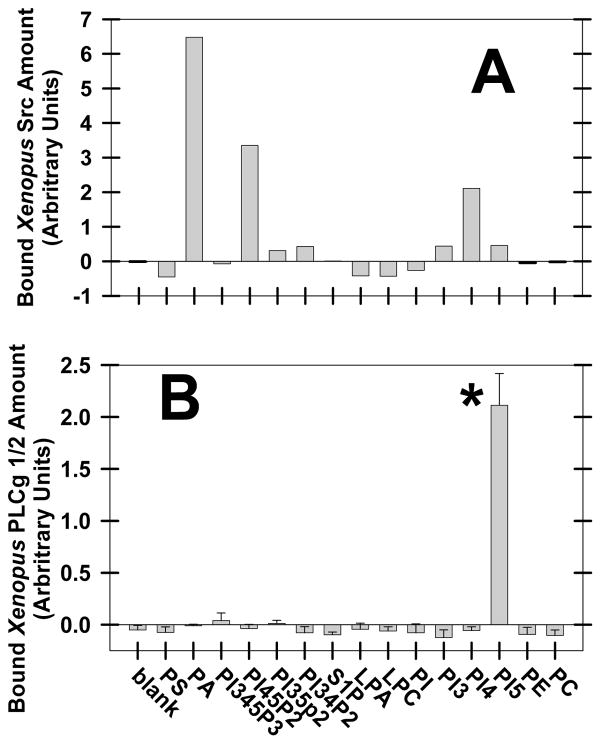
To determine whether PA binds to Xenopus Src or PLCγ, protein binding to 15 different lipids spotted onto nitrocellulose paper (PIP Strips; Echelon Biosciences Inc) was quantified by Western blotting. Xenopus Src bound most strongly to PA (Fig. 7A) as compared to other lipids. Due to variation between experiments, one experiment is shown for Src binding. However, summarizing 5 experiments, the binding of Src for PA was 1.732 ± 1.2 density units, whereas PI45P2 showed negligible binding in 3 of the 5 experiments (summarizing all 5 experiments: 1.15 ± 0.74 density units; n=5) and phosphatidylinositol 4-phosphate binding to Src (0.88 ± 0.41 density units; n=5) was also low. In contrast, Xenopus PLCγ did not bind to PA or 13 other lipids, but bound to phosphatidylinositol 5-phosphate (Fig. 7B). Due to low binding and less variability, three experiments are summarized with PLCγ binding. Unexpectedly, PLCγ did not bind to PI45P2, which suggests that this assay may not reflect cellular conditions or that unactivated PLCγ does not bind substrate well. As the binding data also suggest that PI45P2 or phosphatidylinositol 4-phosphate may interact with Src, and PI5 may interact with PLCγ, we are currently measuring Src or PLC activity, and [Ca]i in the presence of these lipids.
Fig. 7. Xenopus Src, but not PLCγ, binds PA.
Xenopus egg extract was added to PIP strips spotted with 15 different lipids, and Src (A) or PLC-γ (B) were detected by Western blotting. Due to variation between experiments (see text for summary), one experiment is shown for Src (A) whereas the summary of 3 experiments is shown for PLCγ1/2 (B). Xenopus egg homogenate was added to PIP Strips on which 100 pmoles of these lipids were spotted: phosphatidylserine (PS), PA, phosphatidylinositol 3,4,5-trisphosphate (PI345P3), phosphatidylinositol 4,5-bisphosphate (PI45P2), phosphatidylinositol 3,5-bisphosphate (PI35P2), phosphatidylinositol 3,4-bisphosphate (PI34P2), sphingosine-1-phosphate (S1P), lysophosphatidic acid (LPA), lysophosphatidylcholine (LPC), phosphatidylinositol (PI), phosphatidylinositol 3-phosphate (PI3), phosphatidylinositol 4-phosphate (PI4), phosphatidylinositol 5-phosphate (PI5), phosphatidylethanolamine (PE), and phosphatidylcholine (PC). Asterisk denotes P < 0.01.
Exogenous PA activates cortical contraction, gravitational rotation, Src and PLCγ
Work with many cell types (Bhugra et al., 2003; Dhalla et al., 1997; Liu et al., 1999; Siddiqui and English, 1997, 2000) has shown that addition of ~50–100 μM dicapryloyl PA (dPA) elevated [Ca]i. Thus, we added dPA to Xenopus eggs and found that the lipid induced [Ca]i-dependent fertilization events (e.g., cortical contraction and gravitational rotation, a measure of cortical granule exocytosis) had an IC50 of ~100 μM and maximal response was achieved by 400 μM PA (data not shown). Addition of another anionic lipid, dPS, did not stimulate fertilization events.
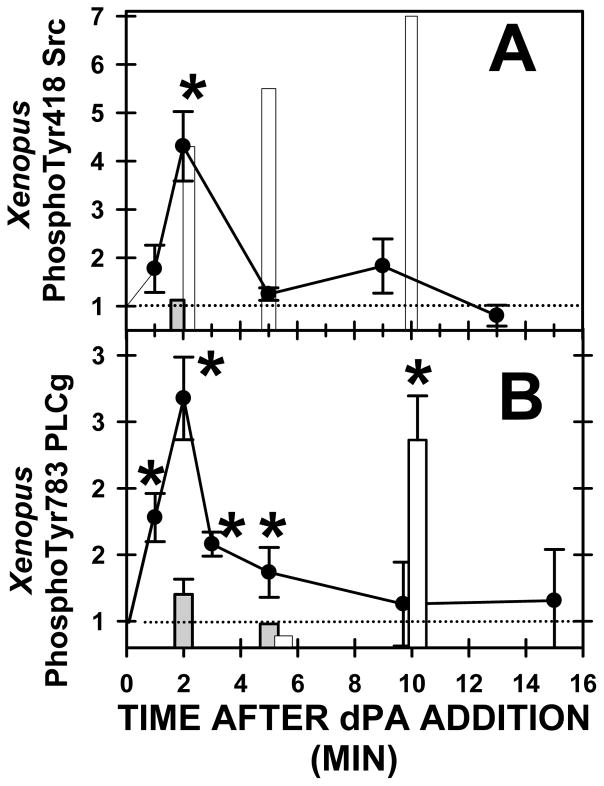
The addition of dPA activated Src and PLCγ as detected by a 4.3 fold increase in the amount of Src phosphorylated on tyrosine 418 (Fig. 8A) and a 2.6 fold increase of PLCγ phosphorylated on tyrosine 783 (Fig. 8B). Treatment with an anionic lipid dPS did not induce any change in Src or PLCγ phosphorylation (filled bars, Fig. 8).
Fig. 8. Addition of exogenous PA stimulates Xenopus Src and PLCγ.
dPA (400 μM)(closed circles), control anionic lipid dPS (400 μM) (closed bars), or H2O2 (10 mM)(open bars) was added to Xenopus oocytes, phosphospecific Western blot analysis conducted and results stated relative to the control band density. (A) Xenopus phosphoSrc increased at two minutes after dPA addition, whereas dPS had no effect, and H202 stimulated Src on a much slower time course (asterisk denotes P < 0.03). Each lane has 3–9 determinations. (B) Xenopus phosphoPLCγ increased at two minutes after dPA addition, or by 10 minutes after H202 addition, however dPS addition was ineffective (asterisks denote P < 0.05).
Src activation by dPA was brief compared to that of PLCγ: Src phosphorylation returned to basal by 5 minutes however, phosphorylation of PLCγ remained elevated by ~ 40% at 5 minutes. The time course of these changes induced by dPA are similar to that induced by sperm: sperm briefly stimulated Src at ~2–3 minutes after insemination (Fig. 5B) whereas IP3 mass (PLC activity) peaked by 5 minutes but remained elevated over egg values over a longer period (Stith et al., 1994; Stith et al., 1993). Thus, PLCγ activation appears to last longer than the brief period of Src activation.
However, note that sperm induced a ~38% increase in phosphoSrc (Fig. 4A, 5B) whereas addition of dPA induced a 430% increase (Fig. 8A). As these were three different sets of experiments, we then used one experiment to directly compare Src activation and used a different antibody and protocol. Using an ELISA for phosphorylated Src tyrosine 418, two minutes after addition of sperm, Src phosphorylation increased to 0.541 ± 0.060 absorbance units (n=4), whereas dPA produced a larger increase to 0.862 ± 0.045 (n=5) over control groups (0.337 ± 0.037 absorbance units; n=6). With the ELISA, the 2.6 fold increase in Src phosphorylation by dPA was greater than the 1.6 fold increase by sperm (P< 0.0003).
The larger Src activation with dPA versus fertilization may be due to the addition of more PA (400 μM) than may be produced during fertilization, or that adding dPA produces a global increase versus a presumed local increase in PA at the sperm-egg binding site. Comparisons of concentration and levels of membrane levels are not appropriate as PA is in a planar membrane and may be further concentrated in patches or rafts.
H202 is a strong activator of Xenopus tyrosine kinases (Sato et al., 2001; Sato et al., 2003), and it induced a slow, large increase in Src activity that lasted much longer than sperm or dPA addition (Fig. 8A). Our results agree with Sato’s work (Sato et al., 2001; Sato et al., 2003) wherein it was shown that H202 slowly increased Src tyrosine phosphorylation as compared with the increase after insemination, and that there was a larger increase in Src phosphorylation by H202 than after insemination. H202 also increased PLCγ tyrosine phosphorylation (Fig. 8B) at a later point as compared with Src as there was no change in PLCγ phosphorylation at 6 minutes after addition, but large increase after 10 minutes. Perhaps due to the artificial nature of H202, there appears to be a gap between Src and PLCγ activation: Src tyrosine phosphorylation was elevated 4-fold at 2 minutes but PLCγ tyrosine phosphorylation did not elevate until after 5 minutes.
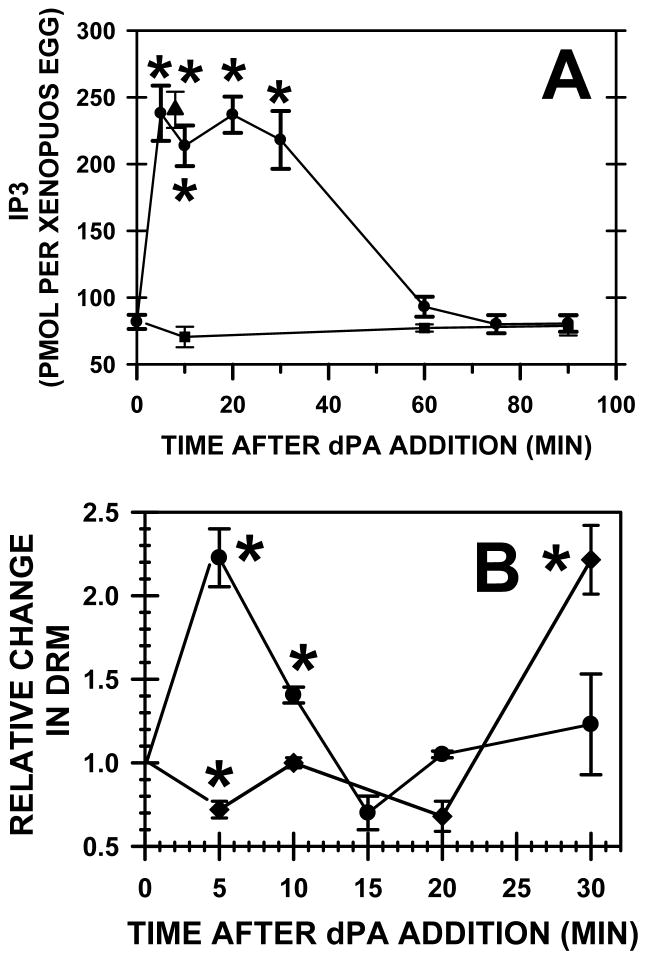
As measured by IP3 mass elevation, dPA (400 μM) stimulated Xenopus egg PLC activity to levels (filled circles, Fig. 9A) similar to those seen following fertilization (for insemination, see filled triangle in Fig. 9A)(Stith et al., 1994; Stith et al., 1993). Treatment with calcium ionophore or pricking the egg increases IP3 production but these artificial activation methods only raise IP3 mass to less than half that seen with sperm (Stith et al., 1993) or dPA. Thus, dPA mimics sperm in its ability to increase IP3 and this suggests that dPA is not acting as an ionophore or causing leakage of calcium across compromised membranes. Furthermore, dPA may activate other isoforms of PLC (or inhibit IP3 degradation) as activating tyrosine phosphorylation of PLCγ decreased by 10 minutes after dPA addition (Fig. 8B) but dPA induced a maximal elevation in IP3 for at least 30 minutes. Addition of another anionic phospholipid (600 μM PS) had no effect on PLC activity (filled squares, Fig. 9A).
Fig. 9. Addition of PA simulates PLC activity and increases PLCγ in DRM.
(A) Addition of dPA (400 μM; closed circle) or sperm (closed triangle) increased IP3 mass to equivalent levels when compared to a control group of Xenopus eggs (time zero) (asterisks denote P< 0.002). However, dPS (600 μM; closed square) did not alter IP3 mass. (B) Xenopus eggs (time zero) or after addition of dPA (400 μM), DRM were isolated by density gradient centrifugation and Western blotting with densitometry recorded total Src or PLCγ. Experimental values (n=3–4 per group) were relative to the amount in eggs and asterisks denote significance (P< 0.02).
Exogenous PA decreased Src but increased PLCγ in DRM
As noted, rafts are required for fertilization, and Src is located in egg DRM before fertilization whereas PLCγ translocates to DRM after fertilization (Sato et al., 2002; Sato et al., 2003). Five minutes after addition of dPA, the amount of Src in DRM decreased by ~30%, but levels returned to control levels by 10 minutes and then doubled by 30 minutes (Fig. 9B). Based on this and the cellular phosphoSrc data (Fig. 8A), PA activates Src rapidly but this activation could lead to lowered levels of Src in rafts. Although PA mass was maximal from 1 to at least 10 min after insemination (Fig. 1), phosphoSrc data show that Src was activated briefly at 2–3 minutes after insemination, so removal of Src from rafts may be a mechanism to decrease membrane associated Src activity in the continued presence of activating PA. Sato (Hasan et al., 2011; Sato et al., 1999) also notes that Src leaves the membrane fraction after fertilization and suggests that, during the 2 minutes of its activation, Src would move to substrates not located at the plasma membrane (e.g., Shc, heterogenous nuclear ribonucleoprotein K).
In contrast to Src which is already in rafts before fertilization, dPA induced a 2.2-fold increase in PLCγ in DRM at 5 minutes but levels returned to basal by 15 minutes (Fig. 9B). By inducing PLCγ translocation to DRM, dPA addition again mimics fertilization.
As methyl-β-cyclodextrin can disrupt Xenopus rafts and inhibit fertilization (Sadler and Jacobs, 2004; Sato et al., 2002), we determined whether dPA can activate Src after raft disruption. dPA was unable to activate Src after methyl-β-cyclodextrin treatment (50 mM, 30 min incubation followed by two washes before 400 μM dPA addition to eggs): dPA induced a 186 ± 7.7% (n=9) over control values to significantly increase phosphoSrc (P< 0.001), but methyl-β-cyclodextrin pretreatment prevented this increase (106 ± 4.5%; n= 10). However, if methyl-β-cyclodextrin was washed away and eggs were allowed to recover for 3 hours, the ability of dPA to activate Src partially recovered (128 ± 5.8%; n= 4; P< 0.02).
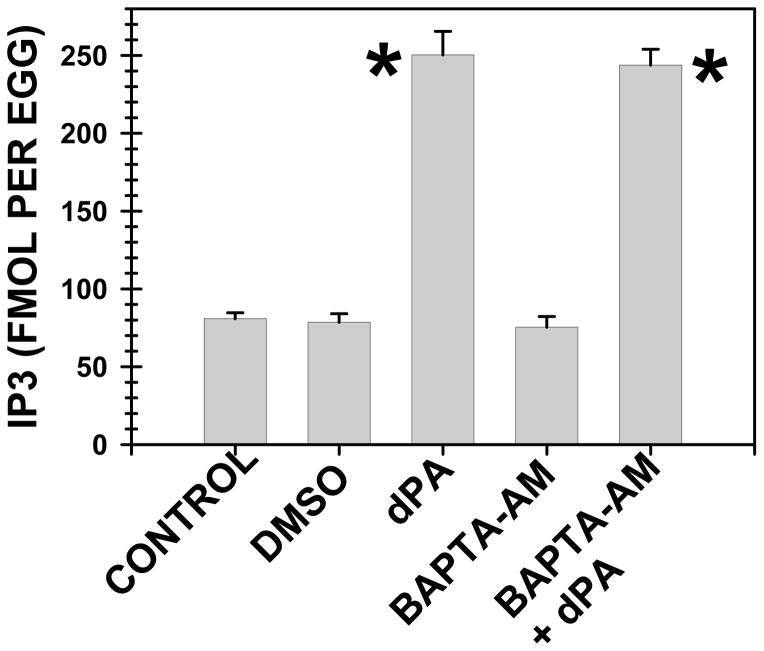
Sperm can activate PLC without a prior elevation of [Ca]i (Stith et al., 1994) so a putative activator of fertilization should be able to stimulate PLC without elevation of [Ca]i. To examine this point, we prevented any increase in [Ca]i with a calcium chelator and examined whether dPA could increase IP3 mass. Similar to published results (Kline and Kline, 1992), we noted that preincubation of Xenopus eggs with the cell permeable calcium chelator BAPTA-AM blocked fertilization events such as gravitational rotation and cleavage. However, BAPTA-AM did not reduce dPA-induced IP3 elevation in Xenopus eggs (Fig. 10). This reinforces the hypothesis that dPA can mimic sperm and that PA is not releasing [Ca]i which would in turn activate PLC activity. Like sperm, PA must be activating PLC through a non-[Ca]i dependent mechanism.
Fig. 10. Buffering of [Ca]i did not reduce PA-induced PLC activation.
Xenopus eggs were treated with BAPTA-AM (250 μM, 1 h), which buffers [Ca]i and blocked the calcium-dependent fertilization events such as gravitational rotation and development, or carrier pluronic F-127/DMSO, did not significantly alter IP3 mass from that in control eggs. dPA (400 μM, 10 minutes) elevated IP3 mass and this elevation was not reduced when elevation of [Ca]i was prevented with prior treatment with BAPTA-AM.
Exogenous PA increased [Ca]i
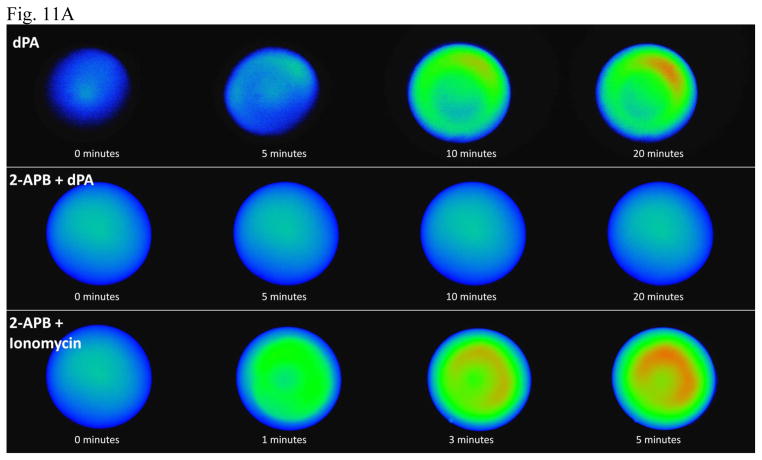
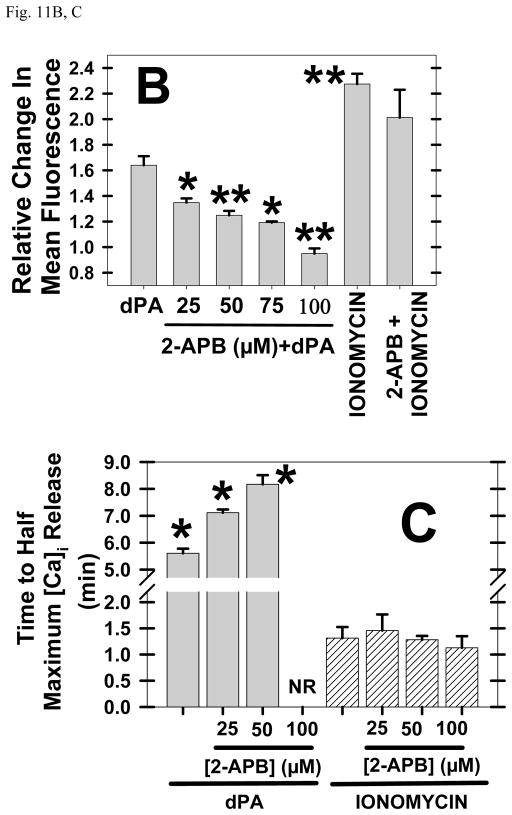
Addition of dPA increased [Ca]i in Xenopus eggs (Fig 11A) whereas another anionic lipid commonly used as a control, dPS, did not induce fertilization events or release [Ca]i (data not shown). There is evidence that dPA is acting through PLC activation as the cell permeable IP3 receptor blocker 2APB (Maruyama et al., 1997) prevented dPA induction of [Ca]i release (second row, Fig. 11A) but did not affect the release of [Ca]i by ionomycin (third row, Fig. 11A). A summary of data from multiple experiments shows that the highest [2APB] fully inhibited the [Ca]i release induced by dPA but had no effect on [Ca]i release by ionomycin (Fig. 11B, C).
Fig. 11. PA release of [Ca]i is blocked by IP3 receptor blocker 2APB.
In the top row, dPA (400 μM) was added to albino Xenopus eggs preinjected with Fluo-4. In the middle row, 100 μM IP3 receptor blocker 2APB (100 μM) was added before 400 μM dPA and this eliminated [Ca]i release. In the bottom row, 100 μM 2APB pretreatment before addition of the calcium ionophore ionomycin (10 μM) did not reduce [Ca]i release. (B) Summarizing multiple experiments, 2APB reduced [Ca]i release by dPA but not that released by ionomycin. (C) As measured by the time required to reach half maximal release, 2APB delayed dPA-induced elevation of [Ca]i (but not that by ionomycin). “NR” represents no measurable [Ca]i release by dPA.
Perhaps reflecting a direct action of ionophore versus an indirect dPA mechanism, PA-induced release of [Ca]i began at ~6 minutes (reaching a maximum at 25–30 minutes), but calcium ionophore ionomycin induced a detectable change in [Ca]i in 30 seconds, a half maximal release by 2 minutes, and maximal [Ca]i was achieved by 5 minutes. In another comparison between the ionophore to dPA, ionomycin released ~40% more [Ca]i in less than half the time required by dPA. Although there could be differences in the site of action and hydrophobicity, diffusion through egg jelly and vitelline envelope may not be responsible for this time difference as dPA is smaller (ionomycin’s molecular mass is 747 Da versus 390 Da for dPA).
As noted, 1-butanol does not inhibit PLC (or phospholipase A2)(Cesnjaj et al., 1995; Chalifa-Caspi et al., 1998; Melendez et al., 1998). The ability of dPA to release [Ca]i in a mechanism dependent upon Src and PLC allowed us to examine whether 1-butanol or FIPI nonspecifically inhibited a step in this pathway to [Ca]i release. The ability of dPA to release [Ca]i was not inhibited by 1-butanol or FIPI (data not shown).
The fertilization [Ca]i wave is not affected by removal of extracellular calcium and eggs do not have store-operated calcium entry so the wave is due to release from intracellular [Ca]i stores rather than calcium influx into the cell (Fontanilla and Nuccitelli, 1998; Nader et al., 2013; Wilkinson et al., 1998). Similarly, addition of dPA to cells in minus calcium medium (and eggs were briefly washed with 2 mM EGTA) led to an increase in [Ca]i that was equivalent to cells in calcium containing medium (data not shown).
The PLD1b isoform is present in the Xenopus egg
Using degenerate primers that detected all PLD isoforms in various cell types (Nakashima et al., 1997), RT-PCR was used to search for PLD isoforms in Xenopus eggs. Three fragments were amplified (220 bp, 615 bp, 820 bp): the 615 bp fragment appeared under 11 of 12 different PreMix Failsafe solutions (not mix C) whereas the 220 and 820 bp bands were found with 10 of the different solutions (not mix C and L). In order to examine mispriming with our degenerate primers, amplification with PreMix D (which had given the strongest signal) was repeated at four different annealing temperatures (45, 47, 53.8, 58.5 deg C). The use of the two lowest temperatures resulted the same 3 bands noted above (higher temperatures resulted in poor amplification). The 220 and 820 bp fragments were also cloned and sequenced, but only the 615 bp fragment (GenBank: AY233395) showed any homology to PLD, specifically it is PLD1b (Fig. 12B). Xenopus PLD1a or PLD2 mRNAs were not detected.
The cloned Xenopus PLD fragment begins a few amino acids upstream of the first active site (HKD motif), continues through the loop domain and ends in the middle of the CRII domain. The cloned segment corresponds to the nucleotides under the dark bar that is drawn over the domain structure of hPLD1a in Fig. 12A. Xenopus PLD is more similar to mammalian PLD1b (65% identical to rat PLD1b; with conservative substitutions, 80% conservation) than to PLD1a or PLD2, and has the same 38 amino acid splice deletion as rat PLD1b (compare with underlined letters present in rat and human PLD1a; third paragraph, Fig. 12B).
As no PLD1a or PLD2 message was detected, we searched for PLD isoforms by Western blotting (see Methods section for details). We obtained strong signals from two custom antibodies: a pan PLD antibody (directed toward the conserved active site of PLD isoforms) and a custom antibody produced to a peptide that spans a splice site only found in PLD1b. Rabbit polyclonal antibodies to the N terminus of PC-specific human PLD1 and the internal domain PLD1 antibody also produced strong signals (the N terminal antibody produced a stronger signal). However, there was no detectable signal from the two different PLD2 antibodies (to the N terminus and to an internal sequence). Thus, the gene for PLD2 may not be expressed in the egg or Xenopus PLD2 may not be recognized by these antibodies.
DISCUSSION
We now provide more evidence that PA stimulates Src, PLCγ and releases [Ca]i to play a role in fertilization in Xenopus laevis (Fig. 13). Using our HPLC method (Holland et al., 2003), PA mass increased at fertilization, and two PLD inhibitors (but not 2-butanol) inhibited PA production, Src and PLCγ activation, the release of [Ca]i, gravitational rotation and first cleavage. The ability of these two inhibitors to reduce PA production also demonstrates that PA is produced at fertilization through PLD action, not some other pathway.
The ~2.8-fold increase in PA (from 1.3 pmol/egg to 3.6 pmol/zygote) can be compared to the 1.4 to 12 fold changes determined in other cell types, often with TLC and Commassie blue staining (Agwu et al., 1991; Cross et al., 1996; el Bawab et al., 1995; Pettitt et al., 2001; Rais et al., 1998; Tou and Urbizo, 2001; Zakaroff-Girard et al., 1999). The time of the early PA increase (1 minute) is similar to that for the increase in IP3 (Stith et al., 1993) and choline (Stith et al., 1997), whereas Src activation was detected at 2 minutes after insemination. As IP3 mass increased before the detection of activating Src tyrosine phosphorylation, PLC may be also activated independently of Src. Maximal PA levels were maintained through the period of the [Ca]i wave and cortical granule exocytosis (~4–7 min) and beyond (to at least 10 minutes postinsemination).
PA, PC, choline, and DAG mass increases in fertilization
As eggs are very short lived, it is difficult to label lipid precursors (Stith et al., 1992a), so mass measurements allow an accurate comparison of the timing and size of the changes of precursor and product lipids during fertilization. As noted, PLD catalyzes the hydrolysis of PC to PA and choline. During Xenopus fertilization, the only significant decrease (430 pmol/cell) in a molecular species of PC was 18:1n9 (Petcoff et al., 2008) and mammalian PLD activity largely produces a PA 18:1 species (Pettitt et al., 2001). Choline increased by 134 pmol/cell (Stith et al., 1997) but the PA increase reported here (2.3 pmol/cell) was smaller. As has been noted in other systems, very rapid degradation of PA can produce smaller than expected changes (Cross et al., 1996; Pettitt et al., 2001). In addition, the PC decrease may be larger than that of choline or PA as it may be degraded by lipases other than PLD (such as phospholipase A2)(Petcoff et al., 2008).
Through Lipin activity, PA may be the source of the DAG increase as the increase in PA mass is earlier than that of DAG (the latter increases at ~5 minutes and peaks at ~12 minutes postinsemination)(Petcoff et al., 2008; Stith et al., 1994; Stith et al., 1993; Stith et al., 1997). Our molecular species analysis (Petcoff et al., 2008) supported the suggestion that DAG derives PA, however, the increase in DAG was about 18 fold larger (48 pmoles/cell) than that of PA (2.7 pmoles/cell). One might again suggest that PA is less stable than DAG. In addition, PA may produce DAG since equivalent amounts of PA and choline should be produced by PLD action, and the increase in choline mass (134 pmol/cell) is over twice that of DAG.
PA activates Src
PA mass increased before Src activation in fertilization, two inhibitors of PA production fully inhibited Src activation at fertilization, dPA addition stimulated Src activity (an action that required intact membrane rafts), and Src (but not PLCγ) bound specifically to PA (a vesicle sedimentation assay also supports this specificity; P. Yang and B. Stith, unpublished). PS is an anionic phospholipid that is commonly used as a control for the action of PA, and PS did not stimulate Src or PLCγ activity, release [Ca]i nor did it bind to Src or PLCγ. With a plasma membrane-cortex cell free preparation, which allows dPA and inhibitors access to the inner leaflet of the plasma membrane, or with whole eggs, 5 tyrosine kinase inhibitors reduced PA-induced calcium release (C. Fees, J. Stafford and B. Stith, unpublished). In a crude Xenopus oocyte membrane fraction that presumably would contain Src (Sato et al., 2002), PLC activity was activated 200% by addition of PA but not by PS, PC, or PE (Jacob et al., 1993). Similar to our results, half maximal stimulation of this in vitro PLC activity was achieved at 100 μM [PA] whereas 400 μM was typically used in experiments.
Since PA is an activator of Src, we can compare these results with our use of another tyrosine kinase activator. H202 stimulated tyrosine kinase activity, PLCγ tyrosine phosphorylation, elevation of IP3 mass, and [Ca]i release in Xenopus eggs (Sato et al., 2001; Sato et al., 2003; Tokmakov et al., 2002). Our time course and size of response to H202 was similar to those previously reported: in comparison with sperm, H202 induced a slower activation of Src but activated Src to higher levels. Perhaps due to the slow time course, H202 clearly elevates Src before PLCγ and this supports the current model for Xenopus fertilization (however, there appears to be a surprisingly long gap between Src and PLCγ activation). PA action was similar to that of sperm but not H202: PA activated Src faster and to lower levels of tyrosine phosphorylation than H202.
DRM involvement in fertilization
DRM, a measure of membrane rafts, are required for fertilization (Belton Jr et al., 2001; Sato et al., 2002), and we have shown that DRM isolated from Xenopus eggs have a liquid-ordered state, high levels of sphingomyelin, and cholesterol (Luria et al., 2002). In Xenopus, Src is present in DRM before fertilization whereas PLCγ translocates to DRM only after sperm addition (Luria et al., 2002; Sato et al., 2002; Sato et al., 2003). Similarly, our new data show that addition of PA doubled the amount of PLCγ in DRM. However, perhaps because Src was already in DRM before fertilization, PA did not increase the amount of Src in DRM. Since PA mass remains high to at least 10 min after insemination (Fig. 1), yet phosphoSrc levels are low by 4 min, the decrease in Src in DRM at 5 min after PA addition (Fig. 4C) may account for Src inactivation in the presence of elevated PA.
Methyl-β-cyclodextrin disrupts Xenopus rafts (Sadler and Jacobs, 2004; Sato et al., 2002), inhibits sperm induction of fertilization events (Sato et al., 2002) and inhibits PA’s ability to activate Src. Future experiments will examine whether PA induced PLCγ translocation requires Src activity.
At ~10 minutes of PA addition, both PLCγ activity (Fig. 8B) and presence in DRM (Fig. 9B) are low yet IP3 mass remains at maximal levels until at least 30 minutes (Fig. 9A). As IP3 is rapidly degraded (Stith et al., 1994), these data suggest that other isoforms of PLC are active at ~10 minutes after PA addition; these results are similar to those seen after insemination (see discussion below).
Inhibition of fertilization events by two PLD inhibitors
PA production by PLD is reduced in the presence of primary alcohols (Bonser et al., 1989; Liscovitch and Eli, 1991) such as 1-butanol, and 2-butanol is used to control for alcohol effects. In contrast, 1-Butanol or other primary alcohols do not inhibit PLC in many cell types (Bonser et al., 1989; Cesnjaj et al., 1995; Jackson et al., 2004; Liu et al., 1997; Nilssen et al., 2005; Rooney et al., 1989; Tolan et al., 1997; Walter et al., 2000). One of the reasons that we used butanols is that higher levels of ethanol actually stimulate PLC but 1-butanol does not (Liscovitch et al., 1994).
While 1-Butanol completely inhibited the PA increase, gravitational rotation (a measure of [Ca]i-dependent cortical granule exocytosis), and activating tyrosine phosphorylation of Src, there was a small increase in IP3 mass, [Ca]i release and percentage of cells achieving first cleavage in the presence of the inhibitor. The IP3 mass assay and [Ca]i measurement may be more sensitive to small changes than phosphoSrc detection, and gravitational rotation may require higher levels of [Ca]i release but these results suggest the existence of a weaker, PA- and Src-independent mechanism of PLC activation.
A more specific PLD inhibitor (FIPI) has been recently described and it did not affect stress fibers, PLD1/2 localization, or activities of Akt, Map kinase, autotaxin or PLC (Su et al., 2009; Yanase et al., 2010). However, some pathways blocked by 1-butanol were not blocked by FIPI (Monovich et al., 2007; Su et al., 2009; Yanase et al., 2010).
FIPI pretreatment of Xenopus eggs fully inhibited the increase in activating tyrosine phosphorylation of Src, but only reduced peak [Ca]i (from 1.4 to 0.18 μM) and delayed gravitational rotation (a measure of cortical granule exocytosis) and initiation of the [Ca]i wave by ~12 minutes. That is, production of PA in the zygote may be required for Src activation and a majority of the [Ca]i increase, but not for sperm-egg fusion or a small [Ca]i release (however, sperm also contain PA so one cannot conclude that sperm PA is still required; W. Holland and B. Stith, unpublished).
As FIPI or 1-butanol inhibited ~87% of the [Ca]i released during fertilization, what is PA’s role in the [Ca]i wave? If the late [Ca]i wave is due to IP3 diffusion into a new area to cause [Ca]i release, which in turn stimulates PLC activity to produce more IP3 (Wagner et al., 2004), then PA may play a role in this mechanism. Along with IP3, DAG is produced during this time (Stith et al., 1997) and there is a wave of PKC activation associated with the [Ca]i wave (Larabell et al., 2004). We have suggested that PA is degraded to DAG and there may be a positive feedback system involving DAG stimulation of PA production. Since PKC is an activator of PLD1 (Peng and Frohman, 2012), DAG production might activate PKC to induce a wave of PLD activation and PA production that would activate Src and PLCγ. Arguing against this mechanism is the fact that detectable activating tyrosine phosphorylation of Src is at control levels by 4 minutes after insemination yet the [Ca]i calcium wave starts at ~4 minutes and ends at ~6 minutes (Stith et al., 1994).
As FIPI and 1-butanol did not fully inhibit the increase in [Ca]i at fertilization, IP3 mass increased before detectable Src activation by tyrosine phosphorylation, PA-induced PLCγ tyrosine phosphorylation decreased by 10 min but IP3 production remained high for another 20 minutes, and due to the presence of weak [Ca]i-stimulated PLC activity (Stith et al., 1993), there are multiple lines of evidence for a small PLC activation that does not require Src or PA production in the zygote.
This redundancy or multiple paths to PLC activation may relate to the idea that SH2 domains in PLCγ are not required in Xenopus fertilization (Runft et al., 1999). Furthermore, Src inhibition through peptide A7 did not fully inhibit fertilization events (Sato et al., 1999) and Src inhibitor PP1 did not eliminate the [Ca]i increase in all cells (Sato et al., 2000). With the use of greater than 10−6 sperm/ml, tyrosine kinase inhibitor lavendustin A only partially inhibited fertilization events, and the local release of calcium at the sperm-egg binding site was not blocked (Glahn et al., 1999). In agreement, our recent results suggest that the weaker, second method of PLC activation (not involving egg PLD or Src) is associated with the initial [Ca]i release at the sperm-egg binding site (Fees, Stafford, Stith, unpublished data).
Since 1-butanol fully inhibited gravitational rotation (a measure of cortical granule exocytosis) and FIPI only delayed the event by ~10 minutes, 1-butanol may inhibit cortical granule exocytosis independently of inhibition of PLD. In addition, the ability of 1-butanol to inhibit 100% of gravitational rotation as compared 61% of first cleavage may be related to its ability to strongly inhibit exocytosis. These results support the idea that 1-butanol inhibits exocytosis in HL-60 cells, mast cells, platelets and neutrophils in a PLD-independent manner (Bader and Vitale, 2009; Chasserot-Golaz et al., 2010; Morris, 2007; Way et al., 2000).
One must consider that there could be a small undetectable increase in PA in the presence of the PLD inhibitors (e.g., as shown in Fig. 5A, the average of PA in the FIPI+ FERT group was 1.22 versus 1.02 ng in the egg, but these values were not significantly different). A small amount of PA may produce a small increase in [Ca]i that would be amplified through calcium-induced calcium release which could involve [Ca]i activation of PLC (Rhee, 2001; Stith et al., 1993) or IP3 receptors (Larabell and Nuccitelli, 1992; Larabell et al., 2004; Miyazaki, 2006; Rahman, 2012; Shuai et al., 2007). As another source of PA, we have found that sperm contain PA (W. Holland and B. Stith, unpublished) and treatment of the egg with FIPI or 1-butanol would not affect sperm PA.
Addition of PA mimics sperm by activating Src, PLC and [Ca]i release
Addition of PA to Xenopus eggs increased activating tyrosine phosphorylation of Src and PLCγ, raised IP3 mass and [Ca]i. Similar to sperm, PA’s ability to elevate [Ca]i was fully inhibited by the IP3 receptor blocker 2APB, PA elevated IP3 independently of elevated [Ca]i and to IP3 levels seen after insemination but twice that induced by ionophore (Fig. 9A)(Stith et al., 1993). Removal of extracellular calcium did not diminish the release of [Ca]i by PA. A similar comparison with H202 data shows similarities between PA and sperm but not the peroxide. Furthermore, PA and sperm released [Ca]i much more slowly than does ionophore. Similarly, Moolenaar reported that PA can activate PLC to elevate [Ca]i and showed that PA does not simply act through an increase in calcium influx into the cell (Moolenaar et al., 1986).
In another similarity with sperm, phosphoSrc and phosphoPLCγ levels fell by 10 minutes after PA addition (Fig. 8) yet IP3 mass and [Ca]i remained high for at least 30 minutes (Fig. 9A, 11A). In terms of later IP3 production, this suggests that PLCγ activation through Src phosphorylation becomes negligible.
The role of PA in the fertilization events of membrane fusion, exocytosis and PI45P2 production
With either 1-Butanol or FIPI, inhibition of PA production in the zygote slowed [Ca]i release (Fig. 6B, 6C) and gravitational rotation (Fig. 3A; Fig. 5C) by ~10 minutes. This delay means that PA could play a facilitory role in sperm-egg fusion in addition to releasing most [Ca]i. Our demonstration that PA mass is elevated during the period of sperm-egg fusion (estimated at ~1 minute after insemination)(Stith et al., 1993) and cortical granule-plasma membrane fusion (the time of the [Ca]i wave; ~4 to 6 minutes postinsemination)(Stith et al., 1994) is not surprising in light of past studies linking PLD, PA and exocytosis in neutrophil, neuroendocrine, neurons, mast cells, pancreatic β cells and adipocytes (Chasserot-Golaz et al., 2010; Cockcroft et al., 2002; Holden et al., 2011; Su and Frohman, 2011; Vitale, 2010; Vitale et al., 2002; Zeniou-Meyer et al., 2008; Zeniou-Meyer et al., 2007).
PA versus LPA
Although there is evidence that PA metabolism to LPA does not play a role in [Ca]i release (Liu et al., 1999), LPA may be produced from PA and LPA may activate G protein-linked receptors (the Edg family) and PLCβ that would be responsible for [Ca]i release. As there is a halving of LPC mass during fertilization, this could reflect production of LPA through activation of autotaxin (Petcoff et al., 2008).
However, LPA does not bind Xenopus Src or PLCγ (Fig. 7)(we have obtained similar results with a vesicle binding assay; P. Yang and B. Stith, ms in preparation) nor release [Ca]i (data not shown). LPA does not activate PLC in a membrane fraction from Xenopus oocytes (Jacob et al., 1993) and PLCβ is not thought to play a role in Xenopus fertilization (Runft et al., 1999). Both fertilization (Glahn et al., 1999; Sato et al., 1999) and PA action is inhibited by tyrosine kinase inhibitors (C. Fees, J. Stafford, B. Stith, unpublished) whereas LPA action does not involve a tyrosine kinase. Gabor Tigyi (personal communication) (University of Tennessee) has found that LPA receptors are lost during Xenopus oocyte maturation to the egg. In addition, pertussis toxin blocks the ability of LPA to release [Ca]i in Xenopus oocytes (Durieux et al., 1993; Durieux et al., 1992) yet does not block the [Ca]i release at fertilization in Xenopus (Kline et al., 1991).
Conclusions
In summary, we provide support that sperm activate PLD1b to produce PA which then binds and activates Src through a mechanism that requires intact rafts (Fig. 13). This leads to a calcium-independent activation of PLCγ, along with increased amount of PLCγ in membrane DRM, increased IP3 and the release of [Ca]i during fertilization in Xenopus. We also provide evidence of a second Src-independent pathway to [Ca]i release. Furthermore, PA may play a role in DAG production and cortical granule exocytosis. As elevated PA has been associated with cancer, PA may promote transformation not only through mTOR (Peng and Frohman, 2012) but also through Src activation. We are currently examining how sperm activate PLD1b, the role of sperm PA, and the mechanism of the local increase in [Ca]i at the site of sperm-egg interaction.
Acknowledgments
We thank Ngoc Vu, Thomas Arthur, Jason Stafford, Ying Chang, Crystal Szczesny, Erinn Stauter, Elizabeth Lampert, Ryan Koonze, Kai Savi, and Thomas Morrison for their technical help. We appreciate discussions with Dr. Jefferson Knight (University of Colorado Denver), the kind gift of pan PLD antibody from Dr. David Brindley (University of Alberta, Canada) and Xenopus Src antibody from Dr. K. Sato (Kyoto Sangyo University, Japan).
Funding
The project described was supported by Award Numbers R15HD052546 and R15HD065661 from the Eunice Kennedy Shriver National Institute of Child Health & Human Development. The content is solely the responsibility of the authors and does not necessarily represent the official views of the Eunice Kennedy Shriver National Institute of Child Health & Human Development or the National Institutes of Health. Support was also received by grants from the University of Colorado Denver Undergraduate Research Opportunity Program.
Abbreviations
- [Ca]i
intracellular calcium
- DAG
sn 1,2-diacylglycerol
- dPA
1,2- Dicapryloyl-sn-Glycero-3-Phosphate
- dPS
1,2-Dioctanoyl-sn-Glycero-3-[Phospho-L-Serine]
- ELSD
evaporative light scattering detector
- FIPI
5-fluoro-2-indolyl des-chlorohalopemide
- IP3
inositol 1,4,5-trisphosphate
- LPA
lysophosphatidic acid
- LPC
lysophosphatidylcholine
- PA
phosphatidic acid
- PC
phosphatidylcholine
- PE
phosphatidylethanolamine
- PI
phosphatidylinositol
- PI3
phosphatidylinositol 3-phosphate
- PI4
phosphatidylinositol 4-phosphate
- PI5
phosphatidylinositol 5-phosphate
- PI35P2
phosphatidylinositol 3,5-bisphosphate
- PI45P2
phosphatidylinositol 4,5-bisphosphate
- PI34P2
phosphatidylinositol 3,4-bisphosphate
- PI345P3
phosphatidylinositol 3,4,5-trisphosphate
- PKC
protein kinase C
- PLC
phospholipase C
- PLCγ
phospholipase C-γ
- PLD
phospholipase D
- PS
phosphatidylserine
- RT-PCR
reverse transcriptase polymerase chain reaction
- S1P
sphingosine-1-phosphate
Footnotes
Competing interests statement
The authors declare no competing financial interests.
Publisher's Disclaimer: This is a PDF file of an unedited manuscript that has been accepted for publication. As a service to our customers we are providing this early version of the manuscript. The manuscript will undergo copyediting, typesetting, and review of the resulting proof before it is published in its final citable form. Please note that during the production process errors may be discovered which could affect the content, and all legal disclaimers that apply to the journal pertain.
References
- Agwu DE, McPhail LC, Sozzani S, Bass DA, McCall CE. Phosphatidic acid as a second messenger in human polymorphonuclear leukocytes. Effects on activation of NADPH oxidase. J Clin Invest. 1991;88:531–539. doi: 10.1172/JCI115336. [DOI] [PMC free article] [PubMed] [Google Scholar]
- Bader MF, Vitale N. Phospholipase D in calcium-regulated exocytosis: lessons from chromaffin cells. Biochim Biophys Acta. 2009;1791:936–941. doi: 10.1016/j.bbalip.2009.02.016. [DOI] [PubMed] [Google Scholar]
- Bearer EL, Friend DS. Modifications of anionic-lipid domains preceding membrane fusion in guinea pig sperm. J Cell Biol. 1982;92:604–615. doi: 10.1083/jcb.92.3.604. [DOI] [PMC free article] [PubMed] [Google Scholar]
- Belton RJ, Jr, Adams NL, Foltz KR. Isolation and characterization of sea urchin egg lipid rafts and their possible function during fertilization. Mol Reprod Dev. 2001;59:294–305. doi: 10.1002/mrd.1034. [DOI] [PubMed] [Google Scholar]
- Bhugra P, Xu YJ, Rathi S, Dhalla NS. Modification of intracellular free calcium in cultured A10 vascular smooth muscle cells by exogenous phosphatidic acid. Biochem Pharmacol. 2003;65:2091–2098. doi: 10.1016/s0006-2952(03)00201-6. [DOI] [PubMed] [Google Scholar]
- Bocckino SB, Exton JH. Handbook of Lipid Research. Plenum Publishing Co; New York: 1996. [Google Scholar]
- Bonser RW, Thompson NT, Randall RW, Garland LG. Phospholipase D activation is functionally linked to superoxide generation in the human neutrophil. Biochem J. 1989;264:617–620. doi: 10.1042/bj2640617. [DOI] [PMC free article] [PubMed] [Google Scholar]
- Brown HA, Henage LG, Preininger AM, Xiang Y, Exton JH. Biochemical analysis of phospholipase D. Methods Enzymol. 2007;434:49–87. doi: 10.1016/S0076-6879(07)34004-4. [DOI] [PubMed] [Google Scholar]
- Busa WB, Nuccitelli R. An elevated free cytosolic Ca2+ wave follows fertilization in eggs of the frog, Xenopus laevis. The Journal of cell biology. 1985;100:1325–1329. doi: 10.1083/jcb.100.4.1325. [DOI] [PMC free article] [PubMed] [Google Scholar]
- Cesnjaj M, Zheng L, Catt KJ, Stojilkovic SS. Dependence of stimulus-transcription coupling on phospholipase D in agonist-stimulated pituitary cells. Mol Biol Cell. 1995;6:1037–1047. doi: 10.1091/mbc.6.8.1037. [DOI] [PMC free article] [PubMed] [Google Scholar]
- Chalifa-Caspi V, Eli Y, Liscovitch M. Kinetic analysis in mixed micelles of partially purified rat brain phospholipase D activity and its activation by phosphatidylinositol 4,5-bisphosphate. Neurochem Res. 1998;23:589–599. doi: 10.1023/a:1022422418388. [DOI] [PubMed] [Google Scholar]
- Chang LC, Huang TH, Chang CS, Tsai YR, Lin RH, Lee PW, Hsu MF, Huang LJ, Wang JP. Signaling mechanisms of inhibition of phospholipase D activation by CHS-111 in formyl peptide-stimulated neutrophils. Biochem Pharmacol. 2011;81:269–278. doi: 10.1016/j.bcp.2010.10.007. [DOI] [PubMed] [Google Scholar]
- Chapman ER. How does synaptotagmin trigger neurotransmitter release? Annu Rev Biochem. 2008;77:615–641. doi: 10.1146/annurev.biochem.77.062005.101135. [DOI] [PubMed] [Google Scholar]
- Chasserot-Golaz S, Coorssen JR, Meunier FA, Vitale N. Lipid dynamics in exocytosis. Cell Mol Neurobiol. 2010;30:1335–1342. doi: 10.1007/s10571-010-9577-x. [DOI] [PubMed] [Google Scholar]
- Choi SY, Huang P, Jenkins GM, Chan DC, Schiller J, Frohman MA. A common lipid links Mfn-mediated mitochondrial fusion and SNARE-regulated exocytosis. Nature cell biology. 2006;8:1255–1262. doi: 10.1038/ncb1487. [DOI] [PubMed] [Google Scholar]
- Cockcroft S, Way G, O’Luanaigh N, Pardo R, Sarri E, Fensome A. Signalling role for ARF and phospholipase D in mast cell exocytosis stimulated by crosslinking of the high affinity FcepsilonR1 receptor. Mol Immunol. 2002;38:1277–1282. doi: 10.1016/s0161-5890(02)00075-5. [DOI] [PubMed] [Google Scholar]
- Cross MJ, Roberts S, Ridley AJ, Hodgkin MN, Stewart A, Claesson-Welsh L, Wakelam MJ. Stimulation of actin stress fibre formation mediated by activation of phospholipase D. Curr Biol. 1996;6:588–597. doi: 10.1016/s0960-9822(02)00545-6. [DOI] [PubMed] [Google Scholar]
- Dainin M, CV, Mohn H, Schmidt US, Liscovitch M. Lipid Metabolism in Signaling Systems. Academic Press; San Diego: 1993. [Google Scholar]
- Dhalla NS, Xu YJ, Sheu SS, Tappia PS, Panagia V. Phosphatidic acid: a potential signal transducer for cardiac hypertrophy. J Mol Cell Cardiol. 1997;29:2865–2871. doi: 10.1006/jmcc.1997.0522. [DOI] [PubMed] [Google Scholar]
- Domino SE, Bocckino SB, Garbers DL. Activation of phospholipase D by the fucose-sulfate glycoconjugate that induces an acrosome reaction in spermatozoa. J Biol Chem. 1989;264:9412–9419. [PubMed] [Google Scholar]
- Durieux ME, Carlisle SJ, Salafranca MN, Lynch KR. Responses to sphingosine-1-phosphate in X. laevis oocytes: similarities with lysophosphatidic acid signaling. Am J Physiol. 1993;264:C1360–1364. doi: 10.1152/ajpcell.1993.264.5.C1360. [DOI] [PubMed] [Google Scholar]
- Durieux ME, Salafranca MN, Lynch KR, Moorman JR. Lysophosphatidic acid induces a pertussis toxin-sensitive Ca(2+)-activated Cl- current in Xenopus laevis oocytes. Am J Physiol. 1992;263:C896–900. doi: 10.1152/ajpcell.1992.263.4.C896. [DOI] [PubMed] [Google Scholar]
- el Bawab S, Macovschi O, Lagarde M, Prigent AF. Time-course changes in content and fatty acid composition of phosphatidic acid from rat thymocytes during concanavalin A stimulation. Biochem J. 1995;308 (Pt 1):113–118. doi: 10.1042/bj3080113. [DOI] [PMC free article] [PubMed] [Google Scholar]
- Exton JH. Phosphatidylcholine breakdown and signal transduction. Biochim Biophys Acta. 1994;1212:26–42. doi: 10.1016/0005-2760(94)90186-4. [DOI] [PubMed] [Google Scholar]
- Exton JH. Phospholipase D-structure, regulation and function. Rev Physiol Biochem Pharmacol. 2002a;144:1–94. doi: 10.1007/BFb0116585. [DOI] [PubMed] [Google Scholar]
- Exton JH. Regulation of phospholipase D. FEBS Lett. 2002b;531:58–61. doi: 10.1016/s0014-5793(02)03405-1. [DOI] [PubMed] [Google Scholar]
- Faugaret D, Chouinard FC, Harbour D, El azreq MA, Bourgoin SG. An essential role for phospholipase D in the recruitment of vesicle amine transport protein-1 to membranes in human neutrophils. Biochem Pharmacol. 2011;81:144–156. doi: 10.1016/j.bcp.2010.09.014. [DOI] [PubMed] [Google Scholar]
- Fontanilla R, Kume S, Mikoshiba K, Nuccitelli R. Function-blocking IP3R antibody, 1G9, blocks fertilization wave propagation but not “hot spots” in the fertilizing Xenopus egg. Molecular Biology of the Cell. 1998;9:441a–441a. [Google Scholar]
- Fontanilla RA, Nuccitelli R. Characterization of the sperm-induced calcium wave in Xenopus eggs using confocal microscopy. Biophysical journal. 1998;75:2079–2087. doi: 10.1016/S0006-3495(98)77650-7. [DOI] [PMC free article] [PubMed] [Google Scholar]
- Glahn D, Mark SD, Behr RK, Nuccitelli R. Tyrosine kinase inhibitors block sperm-induced egg activation in Xenopus laevis. Dev Biol. 1999;205:171–180. doi: 10.1006/dbio.1998.9042. [DOI] [PubMed] [Google Scholar]
- Glahn D, Nuccitelli R. Voltage-clamp study of the activation currents and fast block to polyspermy in the egg of Xenopus laevis. Development, growth & differentiation. 2003;45:187–197. doi: 10.1034/j.1600-0854.2004.00684.x. [DOI] [PubMed] [Google Scholar]
- Hasan A, Fukami Y, Sato K-i. Gamete membrane microdomains and their associated molecules in fertilization signaling. Mol Reprod Dev. 2011;78:814–830. doi: 10.1002/mrd.21336. [DOI] [PubMed] [Google Scholar]
- Holden NJ, Savage CO, Young SP, Wakelam MJ, Harper L, Williams JM. A dual role for diacylglycerol kinase generated phosphatidic Acid in autoantibody-induced neutrophil exocytosis. Mol Med. 2011;17:1242–1252. doi: 10.2119/molmed.2011.00028. [DOI] [PMC free article] [PubMed] [Google Scholar]
- Holland WL, Stauter EC, Stith BJ. Quantification of phosphatidic acid and lysophosphatidic acid by HPLC with evaporative light-scattering detection. J Lipid Res. 2003;44:854–858. doi: 10.1194/jlr.D200040-JLR200. [DOI] [PubMed] [Google Scholar]
- Jackson JK, Zhang X, Llewellen S, Hunter WL, Burt HM. The characterization of novel polymeric paste formulations for intratumoral delivery. Int J Pharm. 2004;270:185–198. doi: 10.1016/j.ijpharm.2003.10.010. [DOI] [PubMed] [Google Scholar]
- Jacob G, Allende CC, Allende JE. Characteristics of phospholipase C present in membranes of Xenopus laevis oocytes. Stimulation by phosphatidic acid. Comp Biochem Physiol B. 1993;106:895–900. doi: 10.1016/0305-0491(93)90047-9. [DOI] [PubMed] [Google Scholar]
- Kinsey WH. Intersecting roles of protein tyrosine kinase and calcium signaling during fertilization. Cell Calcium. 2013;53:32–40. doi: 10.1016/j.ceca.2012.11.003. [DOI] [PMC free article] [PubMed] [Google Scholar]
- Kline D. Calcium-dependent events at fertilization of the frog egg: injection of a calcium buffer blocks ion channel opening, exocytosis, and formation of pronuclei. Developmental biology. 1988;126:346–361. doi: 10.1016/0012-1606(88)90145-5. [DOI] [PubMed] [Google Scholar]
- Kline D, Kline JT. Repetitive calcium transients and the role of calcium in exocytosis and cell cycle activation in the mouse egg. Dev Biol. 1992;149:80–89. doi: 10.1016/0012-1606(92)90265-i. [DOI] [PubMed] [Google Scholar]
- Kline D, Kopf GS, Muncy LF, Jaffe LA. Evidence for the involvement of a pertussis toxin-insensitive G-protein in egg activation of the frog, Xenopus laevis. Dev Biol. 1991;143:218–229. doi: 10.1016/0012-1606(91)90072-b. [DOI] [PubMed] [Google Scholar]
- Larabell C, Nuccitelli R. Inositol lipid hydrolysis contributes to the Ca2+ wave in the activating egg of Xenopus laevis. Developmental biology. 1992;153:347–355. doi: 10.1016/0012-1606(92)90119-2. [DOI] [PubMed] [Google Scholar]
- Larabell CA, Rowning BA, Moon RT. A PKC wave follows the calcium wave after activation of Xenopus eggs. Differentiation. 2004;72:41–47. doi: 10.1111/j.1432-0436.2004.07201005.x. [DOI] [PubMed] [Google Scholar]
- Liscovitch M, Chalifa V, Pertile P, Chen CS, Cantley LC. Novel function of phosphatidylinositol 4,5-bisphosphate as a cofactor for brain membrane phospholipase D. J Biol Chem. 1994;269:21403–21406. [PubMed] [Google Scholar]
- Liscovitch M, Eli Y. Ca2+ inhibits guanine nucleotide-activated phospholipase D in neural-derived NG108-15 cells. Cell Regul. 1991;2:1011–1019. doi: 10.1091/mbc.2.12.1011. [DOI] [PMC free article] [PubMed] [Google Scholar]
- Liu P, Xu Y, Hopfner RL, Gopalakrishnan V. Phosphatidic acid increases inositol-1,4,5,-trisphosphate and [Ca2+]i levels in neonatal rat cardiomyocytes. Biochim Biophys Acta. 1999;1440:89–99. doi: 10.1016/s1388-1981(99)00115-8. [DOI] [PubMed] [Google Scholar]
- Liu T, Ryan M, Dahlquist FW, Griffith OH. Determination of pKa values of the histidine side chains of phosphatidylinositol-specific phospholipase C from Bacillus cereus by NMR spectroscopy and site-directed mutagenesis. Protein Sci. 1997;6:1937–1944. doi: 10.1002/pro.5560060914. [DOI] [PMC free article] [PubMed] [Google Scholar]
- Luria A, Vegelyte-Avery V, Stith B, Tsvetkova NM, Wolkers WF, Crowe JH, Tablin F, Nuccitelli R. Detergent-free domain isolated from Xenopus egg plasma membrane with properties similar to those of detergent-resistant membranes. Biochemistry. 2002;41:13189–13197. doi: 10.1021/bi026107b. [DOI] [PubMed] [Google Scholar]
- Madani S, Hichami A, Legrand A, Belleville J, Khan NA. Implication of acyl chain of diacylglycerols in activation of different isoforms of protein kinase C. The FASEB journal. 2001;15:2595–2601. doi: 10.1096/fj.01-0753int. [DOI] [PubMed] [Google Scholar]
- Martin I, Dubois MC, Defrise-Quertain F, Saermark T, Burny A, Brasseur R, Ruysschaert JM. Correlation between fusogenicity of synthetic modified peptides corresponding to the NH2-terminal extremity of simian immunodeficiency virus gp32 and their mode of insertion into the lipid bilayer: an infrared spectroscopy study. J Virol. 1994;68:1139–1148. doi: 10.1128/jvi.68.2.1139-1148.1994. [DOI] [PMC free article] [PubMed] [Google Scholar]
- Maruyama T, Kanaji T, Nakade S, Kanno T, Mikoshiba K. 2APB, 2-aminoethoxydiphenyl borate, a membrane-penetrable modulator of Ins(1,4,5)P3-induced Ca2+ release. J Biochem. 1997;122:498–505. doi: 10.1093/oxfordjournals.jbchem.a021780. [DOI] [PubMed] [Google Scholar]
- McGinnis LK, Carroll DJ, Kinsey WH. Protein tyrosine kinase signaling during oocyte maturation and fertilization. Mol Reprod Dev. 2011a doi: 10.1002/mrd.21326. [DOI] [PMC free article] [PubMed] [Google Scholar]
- McGinnis LK, Carroll DJ, Kinsey WH. Protein tyrosine kinase signaling during oocyte maturation and fertilization. Mol Reprod Dev. 2011b;78:831–845. doi: 10.1002/mrd.21326. [DOI] [PMC free article] [PubMed] [Google Scholar]
- Melendez A, Floto RA, Gillooly DJ, Harnett MM, Allen JM. FcγRI coupling to phospholipase D initiates sphingosine kinase-mediated calcium mobilization and vesicular trafficking. Journal of Biological Chemistry. 1998;273:9393–9402. doi: 10.1074/jbc.273.16.9393. [DOI] [PubMed] [Google Scholar]
- Mendonsa R, Engebrecht JA. Phosphatidylinositol-4, 5-bisphosphate and phospholipase D-generated phosphatidic acid specify SNARE-mediated vesicle fusion for prospore membrane formation. Eukaryotic cell. 2009;8:1094–1105. doi: 10.1128/EC.00076-09. [DOI] [PMC free article] [PubMed] [Google Scholar]
- Miyazaki S. Thirty years of calcium signals at fertilization. Elsevier; 2006. pp. 233–243. [DOI] [PubMed] [Google Scholar]
- Monovich L, Mugrage B, Quadros E, Toscano K, Tommasi R, LaVoie S, Liu E, Du Z, LaSala D, Boyar W, Steed P. Optimization of halopemide for phospholipase D2 inhibition. Bioorg Med Chem Lett. 2007;17:2310–2311. doi: 10.1016/j.bmcl.2007.01.059. [DOI] [PubMed] [Google Scholar]
- Moolenaar WH, Kruijer W, Tilly BC, Verlaan I, Bierman AJ, de Laat SW. Growth factor-like action of phosphatidic acid. Nature. 1986;323:171–173. doi: 10.1038/323171a0. [DOI] [PubMed] [Google Scholar]
- Moore KL, Kinsey WH. Identification of an abl-related protein tyrosine kinase in the cortex of the sea urchin egg: possible role at fertilization. Developmental biology. 1994;164:444–455. doi: 10.1006/dbio.1994.1214. [DOI] [PubMed] [Google Scholar]
- Morris AJ. Regulation of phospholipase D activity, membrane targeting and intracellular trafficking by phosphoinositides. Biochem Soc Symp. 2007:247–257. doi: 10.1042/BSS0740247. [DOI] [PubMed] [Google Scholar]
- Nader N, Kulkarni RP, Dib M, Machaca K. How to make a good egg!: The need for remodeling of oocyte Ca2+ signaling to mediate the egg-to-embryo transition. Cell Calcium. 2013;53:41–54. doi: 10.1016/j.ceca.2012.11.015. [DOI] [PubMed] [Google Scholar]
- Nakashima S, Matsuda Y, Akao Y, Yoshimura S, Sakai H, Hayakawa K, Andoh M, Nozawa Y. Molecular cloning and chromosome mapping of rat phospholipase D genes, Pld1a, Pld1b and Pld2. Cytogenet Cell Genet. 1997;79:109–113. doi: 10.1159/000134694. [DOI] [PubMed] [Google Scholar]
- Nilssen LS, Dajani O, Christoffersen T, Sandnes D. Sustained diacylglycerol accumulation resulting from prolonged G protein-coupled receptor agonist-induced phosphoinositide breakdown in hepatocytes. J Cell Biochem. 2005;94:389–402. doi: 10.1002/jcb.20260. [DOI] [PubMed] [Google Scholar]
- Patel RB, Kotha SR, Sherwani SI, Sliman SM, Gurney TO, Loar B, Butler SO, Morris AJ, Marsh CB, Parinandi NL. Pulmonary fibrosis inducer, bleomycin, causes redox-sensitive activation of phospholipase D and cytotoxicity through formation of bioactive lipid signal mediator, phosphatidic acid, in lung microvascular endothelial cells. Int J Toxicol. 2011;30:69–90. doi: 10.1177/1091581810388850. [DOI] [PMC free article] [PubMed] [Google Scholar]
- Peng X, Frohman MA. Mammalian phospholipase D physiological and pathological roles. Acta Physiologica. 2012 doi: 10.1111/j.1748-1716.2011.02298.x. [DOI] [PMC free article] [PubMed] [Google Scholar]
- Petcoff DW, Holland WL, Stith BJ. Lipid levels in sperm, eggs, and during fertilization in Xenopus laevis. J Lipid Res. 2008;49:2365–2378. doi: 10.1194/jlr.M800159-JLR200. [DOI] [PubMed] [Google Scholar]
- Pettitt TR, McDermott M, Saqib KM, Shimwell N, Wakelam MJ. Phospholipase D1b and D2a generate structurally identical phosphatidic acid species in mammalian cells. Biochem J. 2001;360:707–715. doi: 10.1042/0264-6021:3600707. [DOI] [PMC free article] [PubMed] [Google Scholar]
- Quest AF. Regulation of protein kinase C: a tale of lipids and proteins. Enzyme Protein. 1996;49:231–261. doi: 10.1159/000468635. [DOI] [PubMed] [Google Scholar]
- Rahman T. Dynamic clustering of IP3 receptors by IP3. Biochemical Society transactions. 2012;40:525–530. doi: 10.1042/BST20110772. [DOI] [PubMed] [Google Scholar]
- Rais S, Pedruzzi E, Dang MC, Giroud JP, Hakim J, Perianin A. Priming of phosphatidic acid production by staurosporine in f-Met-Leu-Phe-stimulated human neutrophils--correlation with respiratory burst. Cell Signal. 1998;10:121–129. doi: 10.1016/s0898-6568(97)00116-2. [DOI] [PubMed] [Google Scholar]
- Randall RW, Bonser RW, Thompson NT, Garland LG. A novel and sensitive assay for phospholipase D in intact cells. FEBS Lett. 1990;264:87–90. doi: 10.1016/0014-5793(90)80772-b. [DOI] [PubMed] [Google Scholar]
- Reue K, Brindley DN. Thematic Review Series: Glycerolipids. Multiple roles for lipins/phosphatidate phosphatase enzymes in lipid metabolism. Journal of lipid research. 2008;49:2493–2503. doi: 10.1194/jlr.R800019-JLR200. [DOI] [PMC free article] [PubMed] [Google Scholar]
- Rhee SG. Regulation of phosphoinositide-specific phospholipase C. Annu Rev Biochem. 2001;70:281–312. doi: 10.1146/annurev.biochem.70.1.281. [DOI] [PMC free article] [PubMed] [Google Scholar]
- Rooney TA, Hager R, Rubin E, Thomas AP. Short chain alcohols activate guanine nucleotide-dependent phosphoinositidase C in turkey erythrocyte membranes. J Biol Chem. 1989;264:6817–6822. [PubMed] [Google Scholar]
- Roth MG. Molecular mechanisms of PLD function in membrane traffic. Traffic. 2008;9:1233–1239. doi: 10.1111/j.1600-0854.2008.00742.x. [DOI] [PubMed] [Google Scholar]
- Runft LL, Watras J, Jaffe LA. Calcium release at fertilization of Xenopus eggs requires type I IP(3) receptors, but not SH2 domain-mediated activation of PLCgamma or G(q)-mediated activation of PLCbeta. Dev Biol. 1999;214:399–411. doi: 10.1006/dbio.1999.9415. [DOI] [PubMed] [Google Scholar]
- Sadler SE, Jacobs ND. Stimulation of Xenopus laevis oocyte maturation by methyl-β-cyclodextrin. Biology of reproduction. 2004;70:1685–1692. doi: 10.1095/biolreprod.103.026161. [DOI] [PubMed] [Google Scholar]
- Sato K, Fukami Y, Stith BJ. Signal transduction pathways leading to Ca2+ release in a vertebrate model system: lessons from Xenopus eggs. Semin Cell Dev Biol. 2006;17:285–292. doi: 10.1016/j.semcdb.2006.02.008. [DOI] [PubMed] [Google Scholar]
- Sato K, Iwao Y, Fujimura T, Tamaki I, Ogawa K, Iwasaki T, Tokmakov AA, Hatano O, Fukami Y. Evidence for the involvement of a Src-related tyrosine kinase in Xenopus egg activation. Dev Biol. 1999;209:308–320. doi: 10.1006/dbio.1999.9255. [DOI] [PubMed] [Google Scholar]
- Sato K, Iwasaki T, Ogawa K, Konishi M, Tokmakov AA, Fukami Y. Low density detergent-insoluble membrane of Xenopus eggs: subcellular microdomain for tyrosine kinase signaling in fertilization. Development. 2002;129:885–896. doi: 10.1242/dev.129.4.885. [DOI] [PubMed] [Google Scholar]
- Sato K, Ogawa K, Tokmakov AA, Iwasaki T, Fukami Y. Hydrogen peroxide induces Src family tyrosine kinase-dependent activation of Xenopus eggs. Dev Growth Differ. 2001;43:55–72. doi: 10.1046/j.1440-169x.2001.00554.x. [DOI] [PubMed] [Google Scholar]
- Sato K, Tokmakov AA, He CL, Kurokawa M, Iwasaki T, Shirouzu M, Fissore RA, Yokoyama S, Fukami Y. Reconstitution of Src-dependent phospholipase Cgamma phosphorylation and transient calcium release by using membrane rafts and cell-free extracts from Xenopus eggs. J Biol Chem. 2003;278:38413–38420. doi: 10.1074/jbc.M302617200. [DOI] [PubMed] [Google Scholar]
- Sato K, Tokmakov AA, Iwasaki T, Fukami Y. Tyrosine kinase-dependent activation of phospholipase Cgamma is required for calcium transient in Xenopus egg fertilization. Dev Biol. 2000;224:453–469. doi: 10.1006/dbio.2000.9782. [DOI] [PubMed] [Google Scholar]
- Satoh N, Garbers DL. Protein tyrosine kinase activity of eggs of the sea urchin Strongylocentrotus purpuratus: The regulation of its increase after fertilization. Developmental biology. 1985;111:515–519. doi: 10.1016/0012-1606(85)90503-2. [DOI] [PubMed] [Google Scholar]
- Secor JD, Kotha SR, Gurney TO, Patel RB, Kefauver NR, Gupta N, Morris AJ, Haley BE, Parinandi NL. Novel Lipid-Soluble Thiol-Redox Antioxidant and Heavy Metal Chelator, N,N′-bis(2-Mercaptoethyl)Isophthalamide (NBMI) and Phospholipase D-Specific Inhibitor, 5-Fluoro-2-Indolyl Des-Chlorohalopemide (FIPI) Attenuate Mercury-Induced Lipid Signaling Leading to Protection Against Cytotoxicity in Aortic Endothelial Cells. Int J Toxicol. 2011;30:619–638. doi: 10.1177/1091581811422413. [DOI] [PMC free article] [PubMed] [Google Scholar]
- Shuai J, Pearson JE, Foskett JK, Mak DOD, Parker I. A kinetic model of single and clustered IP3 receptors in the absence of Ca2+ feedback. Biophysical journal. 2007;93:1151–1162. doi: 10.1529/biophysj.107.108795. [DOI] [PMC free article] [PubMed] [Google Scholar]
- Siddiqui RA, English D. Phosphatidic acid elicits calcium mobilization and actin polymerization through a tyrosine kinase-dependent process in human neutrophils: a mechanism for induction of chemotaxis. Biochim Biophys Acta. 1997;1349:81–95. doi: 10.1016/s0005-2760(97)00085-4. [DOI] [PubMed] [Google Scholar]
- Siddiqui RA, English D. Phosphatidylinositol 3′-kinase-mediated calcium mobilization regulates chemotaxis in phosphatidic acid-stimulated human neutrophils. Biochim Biophys Acta. 2000;1483:161–173. doi: 10.1016/s1388-1981(99)00172-9. [DOI] [PubMed] [Google Scholar]
- Snow P, Yim DL, Leibow JD, Saini S, Nuccitelli R. Fertilization stimulates an increase in inositol trisphosphate and inositol lipid levels in Xenopus eggs. Dev Biol. 1996;180:108–118. doi: 10.1006/dbio.1996.0288. [DOI] [PubMed] [Google Scholar]
- Stith B, Jaynes C, Goalstone M, Silva S. Insulin and progesterone increase 32PO4-labeling of phospholipids and inositol 1, 4, 5-trisphosphate mass in Xenopus oocytes. Cell Calcium. 1992a;13:341–352. doi: 10.1016/0143-4160(92)90069-5. [DOI] [PubMed] [Google Scholar]
- Stith BJ, Espinoza R, Roberts D, Smart T. Sperm increase inositol 1,4,5-trisphosphate mass in Xenopus laevis eggs preinjected with calcium buffers or heparin. Dev Biol. 1994;165:206–215. doi: 10.1006/dbio.1994.1247. [DOI] [PubMed] [Google Scholar]
- Stith BJ, Goalstone M, Silva S, Jaynes C. Inositol 1,4,5-trisphosphate mass changes from fertilization through first cleavage in Xenopus laevis. Mol Biol Cell. 1993;4:435–443. doi: 10.1091/mbc.4.4.435. [DOI] [PMC free article] [PubMed] [Google Scholar]
- Stith BJ, Goalstone ML, Espinoza R, Mossel C, Roberts D, Wiernsperger N. The antidiabetic drug metformin elevates receptor tyrosine kinase activity and inositol 1,4,5-trisphosphate mass in Xenopus oocytes. Endocrinology. 1996;137:2990–2999. doi: 10.1210/endo.137.7.8770923. [DOI] [PubMed] [Google Scholar]
- Stith BJ, Goalstone ML, Kirkwood AJ. Protein kinase C initially inhibits the induction of meiotic cell division in Xenopus oocytes. Cell Signal. 1992b;4:393–403. doi: 10.1016/0898-6568(92)90034-6. [DOI] [PubMed] [Google Scholar]
- Stith BJ, Hall J, Ayres P, Waggoner L, Moore JD, Shaw WA. Quantification of major classes of Xenopus phospholipids by high performance liquid chromatography with evaporative light scattering detection. J Lipid Res. 2000;41:1448–1454. [PubMed] [Google Scholar]
- Stith BJ, Kirkwood AJ, Wohnlich E. Insulin-like growth factor 1, insulin, and progesterone induce early and late increases in Xenopus oocyte sn-1,2-diacylglycerol levels before meiotic cell division. J Cell Physiol. 1991;149:252–259. doi: 10.1002/jcp.1041490211. [DOI] [PubMed] [Google Scholar]
- Stith BJ, Woronoff K, Espinoza R, Smart T. sn-1,2-diacylglycerol and choline increase after fertilization in Xenopus laevis. Mol Biol Cell. 1997;8:755–765. doi: 10.1091/mbc.8.4.755. [DOI] [PMC free article] [PubMed] [Google Scholar]
- Stricker SA, Carroll DJ, Tsui WL. Roles of Src family kinase signaling during fertilization and the first cell cycle in the marine protostome worm Cerebratulus. International Journal of Developmental Biology. 2010;54:787. doi: 10.1387/ijdb.092918ss. [DOI] [PubMed] [Google Scholar]
- Su W, Frohman MA. Phospholipase D. Transduction Mechanisms in Cellular Signaling: Cell Signaling Collection. 2011:323. [Google Scholar]
- Su W, Yeku O, Olepu S, Genna A, Park JS, Ren H, Du G, Gelb MH, Morris AJ, Frohman MA. 5-Fluoro-2-indolyl des-chlorohalopemide (FIPI), a phospholipase D pharmacological inhibitor that alters cell spreading and inhibits chemotaxis. Mol Pharmacol. 2009;75:437–446. doi: 10.1124/mol.108.053298. [DOI] [PMC free article] [PubMed] [Google Scholar]
- Sudhof TC, Rothman JE. Membrane fusion: grappling with SNARE and SM proteins. Science. 2009;323:474–477. doi: 10.1126/science.1161748. [DOI] [PMC free article] [PubMed] [Google Scholar]
- Tokmakov AA, Iwasaki T, Sato KI, Fukami Y. Analysis of signal transduction in cell-free extracts and rafts of< i> Xenopus</i> eggs. Methods. 2010;51:177–182. doi: 10.1016/j.ymeth.2010.01.008. [DOI] [PubMed] [Google Scholar]
- Tokmakov AA, Sato KI, Iwasaki T, Fukami Y. Src kinase induces calcium release in Xenopus egg extracts via PLCgamma and IP3-dependent mechanism. Cell Calcium. 2002;32:11–20. doi: 10.1016/s0143-4160(02)00078-7. [DOI] [PubMed] [Google Scholar]
- Tolan D, Conway AM, Pyne NJ, Pyne S. Sphingosine prevents diacylglycerol signaling to mitogen-activated protein kinase in airway smooth muscle. Am J Physiol. 1997;273:C928–936. doi: 10.1152/ajpcell.1997.273.3.C928. [DOI] [PubMed] [Google Scholar]
- Tou J, Urbizo C. Resveratrol inhibits the formation of phosphatidic acid and diglyceride in chemotactic peptide- or phorbol ester-stimulated human neutrophils. Cell Signal. 2001;13:191–197. doi: 10.1016/s0898-6568(01)00137-1. [DOI] [PubMed] [Google Scholar]
- van den Bogaart G, Meyenberg K, Diederichsen U, Jahn R. Phosphatidylinositol 4,5-bisphosphate increases Ca2+ affinity of synaptotagmin-1 by 40-fold. J Biol Chem. 2012;287:16447–16453. doi: 10.1074/jbc.M112.343418. [DOI] [PMC free article] [PubMed] [Google Scholar]
- Vitale N. Synthesis of fusogenic lipids through activation of phospholipase D1 by GTPases and the kinase RSK2 is required for calcium-regulated exocytosis in neuroendocrine cells. Biochem Soc Trans. 2010;38:167–171. doi: 10.1042/BST0380167. [DOI] [PubMed] [Google Scholar]
- Vitale N, Caumont AS, Chasserot-Golaz S, Du G, Wu S, Sciorra VA, Morris AJ, Frohman MA, Bader MF. Phospholipase D1: a key factor for the exocytotic machinery in neuroendocrine cells. EMBO J. 2001;20:2424–2434. doi: 10.1093/emboj/20.10.2424. [DOI] [PMC free article] [PubMed] [Google Scholar]
- Vitale N, Chasserot-Golaz S, Bader MF. Regulated secretion in chromaffin cells: an essential role for ARF6-regulated phospholipase D in the late stages of exocytosis. Ann N Y Acad Sci. 2002;971:193–200. doi: 10.1111/j.1749-6632.2002.tb04463.x. [DOI] [PubMed] [Google Scholar]
- Wagner J, Fall CP, Hong F, Sims CE, Allbritton NL, Fontanilla RA, Moraru II, Loew LM, Nuccitelli R. A wave of IP3 production accompanies the fertilization Ca2+ wave in the egg of the frog, Xenopus laevis: theoretical and experimental support. Cell Calcium. 2004;35:433–447. doi: 10.1016/j.ceca.2003.10.009. [DOI] [PubMed] [Google Scholar]
- Wakelam MJO. Diacylglycerol-when is it an intracellular messenger? Biochimica et Biophysica Acta (BBA)-Molecular and Cell Biology of Lipids. 1998;1436:117–126. doi: 10.1016/s0005-2760(98)00123-4. [DOI] [PubMed] [Google Scholar]
- Walter M, Tepel M, Nofer JR, Neusser M, Assmann G, Zidek W. Involvement of phospholipase D in store-operated calcium influx in vascular smooth muscle cells. FEBS Lett. 2000;479:51–56. doi: 10.1016/s0014-5793(00)01880-9. [DOI] [PubMed] [Google Scholar]
- Way G, O’Luanaigh N, Cockcroft S. Activation of exocytosis by cross-linking of the IgE receptor is dependent on ADP-ribosylation factor 1-regulated phospholipase D in RBL-2H3 mast cells: evidence that the mechanism of activation is via regulation of phosphatidylinositol 4,5-bisphosphate synthesis. Biochem J. 2000;346(Pt 1):63–70. [PMC free article] [PubMed] [Google Scholar]
- Wilkinson N, Gao F, Hamill O. Effects of mechano-gated cation channel blockers on Xenopus oocyte growth and development. Journal of Membrane Biology. 1998;165:161–174. doi: 10.1007/s002329900430. [DOI] [PubMed] [Google Scholar]
- Yanase Y, Carvou N, Frohman MA, Cockcroft S. Reversible bleb formation in mast cells stimulated with antigen is Ca2+/calmodulin-dependent and bleb size is regulated by ARF6. Biochem J. 2010;425:179–193. doi: 10.1042/BJ20091122. [DOI] [PubMed] [Google Scholar]
- Yang CY, Frohman MA. Mitochondria: Signaling with Phosphatidic Acid. The International Journal of Biochemistry & Cell Biology. 2012;44:1346–1350. doi: 10.1016/j.biocel.2012.05.006. [DOI] [PMC free article] [PubMed] [Google Scholar]
- Zakaroff-Girard A, El Bawab S, Nemoz G, Lagarde M, Prigent AF. Relationships between phosphatidic acid and cyclic nucleotide phosphodiesterases in activated human blood mononuclear cells. J Leukoc Biol. 1999;65:381–390. doi: 10.1002/jlb.65.3.381. [DOI] [PubMed] [Google Scholar]
- Zeniou-Meyer M, Liu Y, Begle A, Olanich ME, Hanauer A, Becherer U, Rettig J, Bader MF, Vitale N. The Coffin-Lowry syndrome-associated protein RSK2 is implicated in calcium-regulated exocytosis through the regulation of PLD1. Proc Natl Acad Sci U S A. 2008;105:8434–8439. doi: 10.1073/pnas.0710676105. [DOI] [PMC free article] [PubMed] [Google Scholar]
- Zeniou-Meyer M, Zabari N, Ashery U, Chasserot-Golaz S, Haeberlé AM, Demais V, Bailly Y, Gottfried I, Nakanishi H, Neiman AM. Phospholipase D1 production of phosphatidic acid at the plasma membrane promotes exocytosis of large dense-core granules at a late stage. Journal of Biological Chemistry. 2007;282:21746–21757. doi: 10.1074/jbc.M702968200. [DOI] [PubMed] [Google Scholar]


