Abstract
Objectives:
To investigate the accuracy of cone beam CT (CBCT) images obtained with and without artefact reduction (AR) in detecting simulated buccal peri-implant and buccal periodontal defects.
Methods:
42 implants inserted into edentulous mandibles, and 38 teeth present in dry mandibles were used. Simulated buccal peri-implant defects (n = 22) and buccal periodontal defects (n = 22) were prepared. 20 implants and 18 teeth without simulated defects were the control group. Images of the mandibles were obtained using a Planmeca ProMax® 3D Max CBCT unit (Planmeca Oy, Helsinki, Finland). Image reconstructions were prepared without and with low, medium and high AR modes. Images were viewed randomly by six observers twice for the presence of defects. Kappa coefficient was calculated. F2_LD_F1 design for non-parametric analysis of longitudinal data was used. Area under curves (AUCs) were calculated for each observer. Significance level was taken as α = 0.05.
Results:
Intraobserver kappa ranged from 0.140 to 0.792 for peri-implant and from 0.189 to 1.0 for periodontal defects. All factors were statistically significant (p < 0.001), except for image mode and implant brand. Pairwise interactions were found between periodontal defects and peri-implant defects (p < 0.001), observers (p < 0.001), observer and image mode (p < 0.001), defect model and observer (p < 0.001) and defect model, image mode and observer (p = 0.04). AUC values ranged from 0.39 to 0.52 for peri-implant and from 0.45 to 0.71 for periodontal defects. Higher AUC values were found for periodontal defects than for peri-implant defects.
Conclusions:
Buccal peri-implant defects were more difficult to detect than buccal periodontal defects. No difference was found among CBCT images obtained with and without AR modes.
Keywords: buccal peri-implant defects, buccal periodontal defects, CBCT, artefacts, artefact reduction, diagnosis
Introduction
Maxillofacial cone beam CT (CBCT) is a volumetric acquisition technique providing accurate and reliable submillimeter resolution images in all spatial dimensions, which shows promise in the detection of periodontal and peri-implant defects.1–4 Intraoral radiographs are insufficient to detect and quantify initial subtle periodontal disease owing to superimposition of adjacent structures. Keeping in mind concerns over dose, CBCT can be used as a supplementary imaging technique in situations where traditional two-dimensional techniques are unable to provide sufficient reliable information for periodontal assessment and treatment.1,2,5,6 CBCT may play a role in the assessment of marginal bone contours and three-dimensional defects, especially furcations and infrabony defects in which defect morphology directly influences treatment planning and prognosis. Specifically, CBCT is better able to assess buccal and lingual/palatal surface defects, which are difficult to visualize in two-dimensional imaging.7,8 In addition, CBCT can be used to localize implants after placement, to assess bone implant interfaces, to evaluate demineralized bone and bone transplants and to identify peri-implant defects.2,9–11 In case of peri-implant defects, intraoral periapical images demonstrate the mesial and distal aspects of alveolar bone/fixture interface and marginal alveolar bone tangential to the X-ray beam. However, initial post-insertion bone loss occurs mostly on the facial or buccal aspect of the dental implant, and CBCT may be useful in determining the presence and dimensions of buccal marginal alveolar defect when a peri-implant defect is suspected.9–11 A significant limitation to CBCT imaging is the presence of metallic artefacts, i.e. image flaws that are unrelated to the scanned object, which are caused by metal and amalgam restorations and, to a lesser extent, root-canal filling material and implants. Such artefacts include streaks around materials as well as dark zones that affect the overall quality of the image. Streak artefacts appear as linear hyperdensities that radiate from a metallic object and may extend to the width of the field, affecting visualization of areas even on the opposite side of an image. Artefacts may also occur as a result of beam hardening, i.e. the preferential gradual absorption of lower-energy X-ray photons as they traverse through layers of tissue, resulting in a gradual increase in the mean energy of the residual beam. Beam hardening may be more pronounced in CBCT than in medical CT, mainly because of the lower tube potential and thus lower mean energy of the X-ray beam in CBCT systems.12–14 Beam-hardening artefacts, which appear as dark bands adjacent to high-density structures, may mimic disease. Artefacts originating from the root-canal filling material, for example, may mimic root fractures, whereas dark bands around dental implants may mimic loss of osseointegration.15,16
Nowadays, CBCT companies are actively developing artefact-reducing algorithms to be used during image reconstruction. These processes, although contributory, are rather slow and may add to the total reconstruction time. More modern approaches attempt to avoid reconstruction errors either by supplementing missing or incorrect information in projection images or by integrating some sort of meta-information into an iterative reconstruction process.17,18 All these methods, however, require massive computational power, which has so far prevented them from being used in daily routine work performed by commercial scanners. Luckily, increasing computational speed and advances in graphics processing units can be expected to overcome this problem.17,18
In view of the common confusion between artefacts and marginal peri-implant defects as well as the difficulties involved in detecting small buccal peri-implant and buccal periodontal defects, the present study assessed observer ability to diagnose ex vivo simulated buccal marginal alveolar peri-implant and buccal marginal periodontal cavities from CBCT images reconstructed without and with different artefact reduction (AR) algorithms. Using ex vivo mandibular bone, we compared the accuracy of ProMax® 3D Max (Planmeca Oy, Helsinki, Finland) CBCT images obtained with and without AR modes in detecting simulated buccal marginal alveolar peri-implant and periodontal defects.
Materials and methods
Approval of the use of dry mandibles (n = 12; with dentulous and edentulous regions) was obtained through the local ethical committee. Red wax was applied to the mandibles as a soft-tissue equivalent material. Implants were randomly inserted into edentulous premolar and molar regions of six mandibles by an experienced operator. A total of 42 dental implants were used from two manufacturers; 18 were MIS (MIS Implants Technologies Ltd., Shlomi, Israel) (diameter range 3.75–4.20 mm; length range 10–13 mm) and 24 were Oxy Implants (Biomec SRL, Colico, Italy) (diameter range 3.75 mm–4.25 mm; length range 9–13 mm). After implant placement, mechanical cavities simulating localized peri-implant marginal defects were prepared on the buccal aspect of the marginal alveolar cortical bone using 2 mm round and cylindrical dental burs to their full depth in 22 implants. Other 20 implants were left without simulated cavities and served as a control group. For the preparation of periodontal marginal buccal defects, 38 teeth (premolars and molars) from 6 mandibles were used. 20 cavities were prepared on the buccal aspect of the marginal alveolar cortical bone of 20 teeth using 2 mm round and cylindrical dental burs to their full depth. 18 teeth without simulated cavities were the control group. Dimensional measurements of the maximum width and depth of the defects were performed using an electronic digital caliper with fine pointed jaws and a measuring range of 0–200 mm and resolution of 0.01 mm. Mechanical defect depths and widths for both peri-implant and periodontal cavities were similar and between 3 mm and 4 mm.
Each mandible was flattened, levelled and placed on a putty impression material for stabilization. Images of the teeth and implants inserted in the mandibles were obtained using a Planmeca ProMax® 3D Max CBCT unit with a flat panel sensor, using a child mode operating at 66 kVp, 6.0 mA, 0.2 mm3 voxel, 11 cm × 7.5 cm field of view and an exposure time of 12 s to image each mandible specimen. Image reconstructions were then prepared without and with three different AR options (low, medium and high). A total of four image sets were obtained: (1) normal mode without AR, (2) AR (low mode), (3) AR (medium mode) and (4) AR (high mode). The artefact removal in Romexis software (Planmeca Oy) works as follows: the software algorithm recognizes metal areas in the basic frames and corrects them by interpolation, after which a three-dimensional volume is calculated from the corrected basic frames and artefacts are reduced. The low–medium–high selection is the threshold value to recognize the metal areas. The user can set the threshold value for recognition. The threshold values are 8000 for low, 4000 for medium and 3500 for high. The scale is 0–8191 (13 bit).
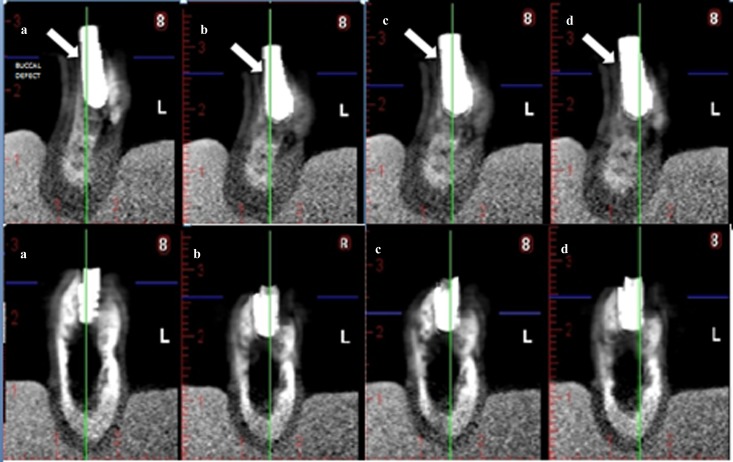
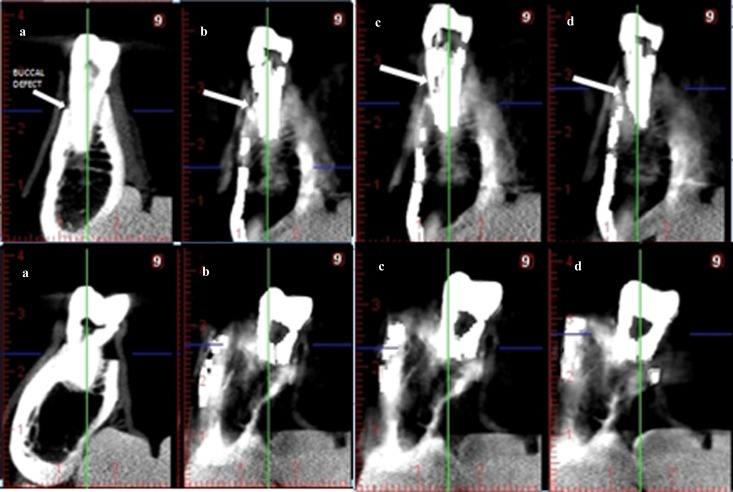
Selected cross-sectional CBCT images were exported by one researcher as tagged image file format (TIFF) images. A total of 152 TIFF images were evaluated for 38 (teeth) × 4 (normal, low, medium and high mode) (each TIFF image included 6 cross-sectional images for each tooth). In addition, in total, 168 TIFF images were evaluated for 42 (implants) × 4 (normal, low, medium and high mode) (each TIFF image included 6 cross-sectional images for each implant). Images were viewed randomly by six observers using custom-designed software (IrfanView, designed by Irfan Skiljan, Wiener Neustadt, Austria) in a dimly lit room on a 15.6-in laptop monitor (F755-3D350, Qosmio®; Toshiba, Tokyo, Japan) at a screen resolution of 1920 × 1080 and 32-bit colour depth. Image sets were viewed at 1 week intervals, and repetitions were performed 1 month after the initial viewings. The presence or absence of buccal peri-implant and buccal periodontal cavities was scored using a 5 point scale as follows: 1 = cavity definitely present; 2 = cavity probably present; 3 = uncertain–unable to tell; 4 = cavity probably not present; 5 = cavity definitely not present. Figure 1 shows cross-sectional CBCT images of an implant with and without buccal marginal defect and Figure 2 shows cross-sectional CBCT images of a tooth with and without buccal marginal defect.
Figure 1.
Cross-sectional cone beam CT (CBCT) images of an implant with and without buccal marginal defect. (a) Normal, without artefact reduction (AR), (b) low-mode AR, (c) medium-mode AR and (d) high-mode AR. Upper row: cross-sectional CBCT images of an implant with buccal marginal defect. Arrows show simulated buccal defect. Lower row: Cross-sectional CBCT images of an implant without buccal marginal defect
Figure 2.
Cross-sectional cone beam CT (CBCT) images of a tooth with and without buccal marginal defect. (a) Normal, without artefact reduction (AR), (b) low-mode AR, (c) medium-mode AR and (d) high-mode AR. Upper row: cross-sectional CBCT images of a tooth with buccal marginal defect. Arrows show simulated buccal defect. Lower row: cross-sectional CBCT images of a tooth without buccal marginal defect
Intraobserver agreements were calculated by weighted kappa coefficient. F2_LD_F1 design for non-parametric analysis of longitudinal data was used as statistical analysis in consideration with the data structure. Observer, defect model and implant brand were taken as independent model effects, and image mode was taken as a dependent model effect. The freely available R software was used for statistical analysis (R Foundation for Statistical Computing, Vienna, Austria; r-project.org). Area under curve values (AUCs) were calculated for peri-implant defects and periodontal defects for each observer. Because of the data structure, binormal receiver operating characteristic (ROC) estimations were used for accuracy values. Sensitivity, specificity, positive predictive value and negative predictive value were also calculated. ROCKIT.9B.exe program was used for binormal ROC analysis. Type-I error rate was taken as α = 0.05 for statistical significance.
Results
Intraobserver agreements ranged from 0.140 to 0.792 for peri-implant defects and from 0.189 to 1.000 for periodontal defects, suggesting better kappa values for the latter. There was a tendency for intraobserver agreement to be higher when rereading periodontal defects than when rereading peri-implant defects, irrespective of image mode. Table 1 shows the intraobserver agreement values according to image mode for peri-implant defects and periodontal defects. Table 2 shows interobserver agreements calculated for the observers by image mode for peri-implant defects and periodontal defects. Again there was a tendency for interobserver agreement to be higher when rereading periodontal defects than when rereading peri-implant defects, irrespective of image mode.
Table 1.
Intraobserver agreement calculated for each observer by image mode for peri-implant defects and periodontal defects
| Defects | Weighted kappa–standard error | |||||
| Observer 1 | Observer 2 | Observer 3 | Observer 4 | Observer 5 | Observer 6 | |
| Peri-implant defects | ||||||
| Normal | 0.316–0.121 | 0.429–0.139 | 0.524–0.129 | 0.454–0.113 | 0.372–0.144 | 0.556–0.111 |
| Low | 0.483–0.120 | 0.397–0.132 | 0.500–0.134 | 0.319–0.117 | 0.294–0.120 | 0.511–0.110 |
| Medium | 0.351–0.111 | 0.551–0.132 | 0.140–0.161 | 0.192–0.086 | 0.442–0.113 | 0.633–0.108 |
| High | 0.443–0.108 | 0.756–0.101 | 0.346–0.165 | 0.443–0.105 | 0.424–0.144 | 0.792–0.084 |
| Periodontal defects | ||||||
| Normal | 0.699–0.114 | 0.625–0.128 | 0.682–0.119 | 0.189–0.146 | 0.99–0.001 | 0.673–0.119 |
| Low | 0.672–0.118 | 0.526–0.138 | 0.774–0.106 | 0.770–0.156 | 1.00–0.00 | 0.564–0.133 |
| Medium | 0.454–0.142 | 0.661–0.127 | 0.785–0.101 | 0.360–0.287 | 1.00–0.00 | 0.670–0.123 |
| High | 0.564–0.132 | 0.94–0.059 | 0.890–0.075 | 0.360–0.287 | 1.00–0.00 | 0.681–0.120 |
Table 2.
Interobserver agreement calculated for the observers by image mode for peri-implant defects and periodontal defects
| Defects | Observer 2 | Observer 3 | Observer 4 | Observer 5 | Observer 6 | |
| Peri-implant defects | ||||||
| Normal | Observer 1 | 0.155–0.114 | 0.057–0.154 | 0.164–0.150 | 0.126–0.115 | 0.039–0.154 |
| Observer 2 | 0.056–0.114 | 0.146–0.126 | 0.050–0.104 | 0.093–0.110 | ||
| Observer 3 | 0.321–0.147 | 0.208–0.117 | 0.327–0.146 | |||
| Observer 4 | 0.318–0.117 | 0.127–0.153 | ||||
| Observer 5 | 0.166–0.115 | |||||
| Low | Observer 1 | 0.298–0.098 | 0.079–0.144 | 0.095–0.142 | 0.096–0.111 | 0.048–0.144 |
| Observer 2 | 0.036–0.091 | 0.059–0.124 | 0.021–0.060 | 0.118–0.123 | ||
| Observer 3 | 0.182–0.133 | 0.064–0.117 | 0.091–0.136 | |||
| Observer 4 | 0.038–0.103 | 0.036–0.156 | ||||
| Observer 5 | 0.154–0.098 | |||||
| Medium | Observer 1 | 0.173–0.129 | 0.152–0.154 | 0.101–0.146 | 0.004–0.110 | 0.005–0.143 |
| Observer 2 | 0.033–0.124 | 0.065–0.132 | 0.062–0.044 | 0.217–0.062 | ||
| Observer 3 | 0.021–0.147 | 0.025–0.104 | 0.456–0.139 | |||
| Observer 4 | 0.081–0.090 | 0.081–0.162 | ||||
| Observer 5 | 0.172–0.064 | |||||
| High | Observer 1 | 0.315–0.123 | 0.168–0.149 | 0.049–0.139 | 0.044–0.101 | 0.011–0.147 |
| Observer 2 | 0.039–0.131 | 0.067–0.117 | 0.056–0.066 | 0.049–0.126 | ||
| Observer 3 | 0.063–0.145 | 0.068–0.096 | 0.424–0.144 | |||
| Observer 4 | 0.032–0.068 | 0.026–0.152 | ||||
| Observer 5 | 0.263–0.077 | |||||
| Periodontal defects | ||||||
| Normal | Observer 1 | 0.342–0.129 | 0.283–0.136 | 0.305–0.139 | 0.188–0.122 | 0.098–0.123 |
| Observer 2 | 0.023–0.155 | 0.330–0.152 | 0.211–0.130 | 0.185–0.210 | ||
| Observer 3 | 0.327–0.147 | 0.383–0.134 | 0.450–0.149 | |||
| Observer 4 | 0.132–0.115 | 0.239–0.143 | ||||
| Observer 5 | 0.129–0.116 | |||||
| Low | Observer 1 | 0.246–0.154 | 0.105–0.156 | 0.312–0.144 | 0.241–0.088 | 0.110–0.189 |
| Observer 2 | 0.231-0149 | 0.129–0.138 | 0.114–0.126 | 0.167–0.112 | ||
| Observer 3 | 0.158–0.152 | 0.263–0.106 | 0.234–0.157 | |||
| Observer 4 | 0.146–0.068 | 0.089–0.145 | ||||
| Observer 5 | 0.267–0.142 | |||||
| Medium | Observer 1 | 0.391–0.146 | 0.149–0.119 | 0.105–0.111 | 0.086–0.053 | 0.099–0.167 |
| Observer 2 | 0.064–0.140 | 0.071–0.140 | 0.031–0.091 | 0.310–0.128 | ||
| Observer 3 | 0.164–0.162 | 0.063–0.045 | 0.346–0.123 | |||
| Observer 4 | 0.070–0.050 | 0.097–0.189 | ||||
| Observer 5 | 0.187–0.078 | |||||
| High | Observer 1 | 0.283–0.143 | 0.130–0.135 | 0.146–0.135 | 0.099–0.106 | 0.019–0.128 |
| Observer 2 | 0.101–0.145 | 0.045–0.147 | 0.042–0.089 | 0.056–0.115 | ||
| Observer 3 | 0.139–0.164 | 0.085–0.051 | 0.090–0.167 | |||
| Observer 4 | 0.095–0.056 | 0.087–0.154 | ||||
| Observer 5 | 0.324–0.145 | |||||
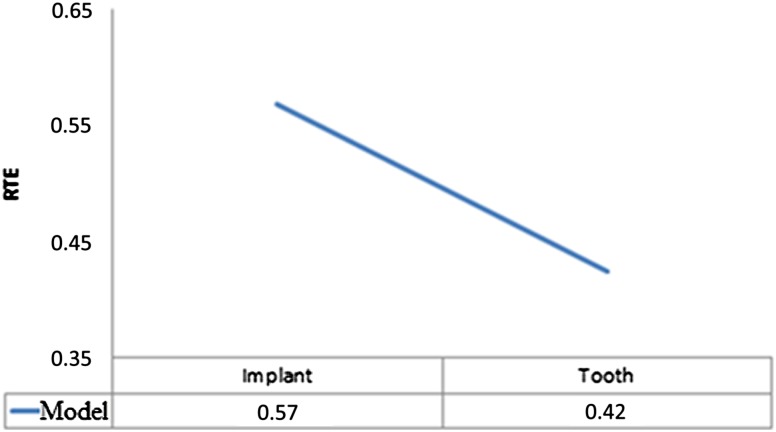
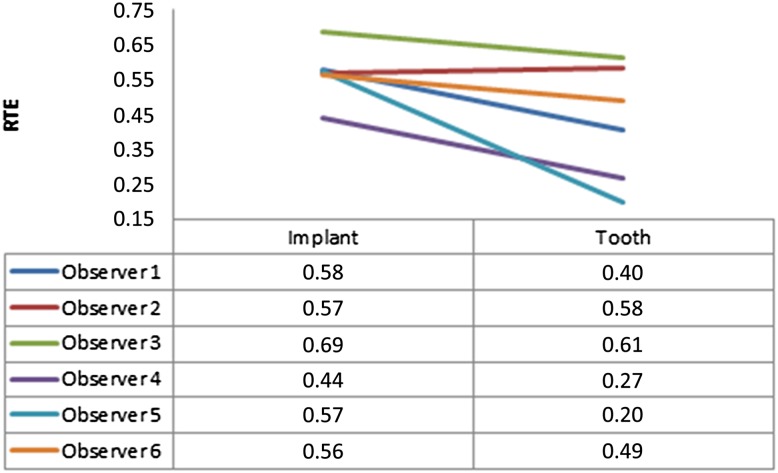
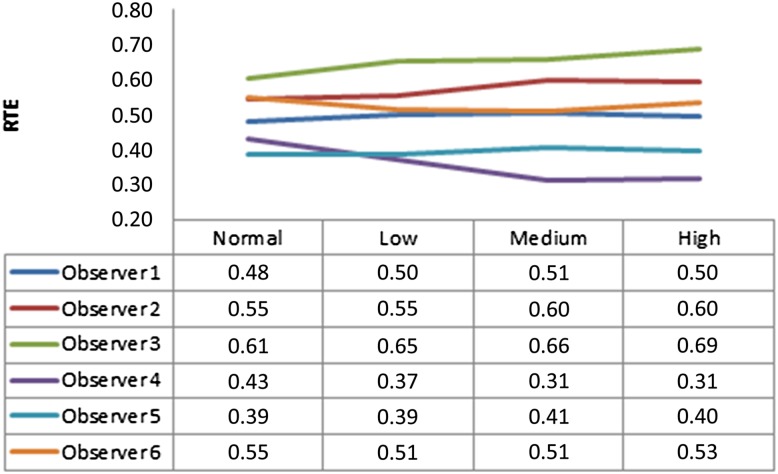
Only second readings of each observer were taken into account. Table 3 shows the effects of defect model, image mode, implant brand and observer. All factors were statistically significant (p < 0.001), except image mode (0.91) and implant brand (0.116). Pairwise interactions were found between periodontal defects and peri-implant defects (p < 0.001), observers (p < 0.001), observer and image mode (p < 0.001), defect model and observer (p < 0.001) and defect model, mode, and observer (p = 0.04). Figure 3 shows treatment effects for defect model (peri-implant defect = 0.57 and periodontal tooth defect = 0.42). This result can be interpreted as observers are more prone to see a defect around implants (with an estimated probability of 57%; this may be false positive or true positive). On the other hand, observers are less prone to see a defect around teeth (with an estimated probability of 42% compared with implants; again this may be false positive or true positive). Figure 4 shows relative treatment effects for observers for each defect model, and Figure 5 shows relative treatment effects for observers for each image mode.
Table 3.
Statistical test results for F2_LD_F1 design
| Effect | ANOVA-type statistic | df | p-value |
| Defect model (periodontal–peri-implant) | 38.37 | 1 | <0.001 |
| Image mode (normal, low, medium and high) | 0.15 | 3 | 0.91 |
| Implant brand (MIS-Oxy) | 2.594 | 1 | 0.116 |
| Observer | 28.95 | 3 | <0.001 |
| Defect model × image mode | 1.24 | 3 | 0.29 |
| Defect model × implant brand | 3.577 | 1 | 0.067 |
| Observer × image mode | 3.74 | 10 | <0.001 |
| Observer × implant brand | 1.821 | 5 | 0.137 |
| Image mode × implant brand | 0.382 | 3 | 0.767 |
| Defect model × observer | 10.41 | 3 | <0.001 |
| Defect model × observer × implant brand | 1.458 | 5 | 0.186 |
| Defect model × image mode × implant brand | 0.485 | 3 | 0.564 |
| Defect model × image mode × observer | 1.94 | 10 | 0.041 |
| Observer × image mode × implant brand | 1.028 | 15 | 0.465 |
| Defect model × observer × image mode × implant brand | 2.483 | 15 | 0.108 |
ANOVA, analysis of variance; df, degrees of freedom.
Type-I error rate was taken as alpha α = 0.05 for testing statistical hypotheses. Italics indicate statistical significance.
MIS-Oxy is manufactured by MIS Implants Technologies Ltd., Shlomi, Israel.
Figure 3.
Treatment effects for defect model (implant: peri-implant defect = 0.57 and tooth: periodontal defect = 0.42). RTE, relative treatment effect
Figure 4.
Relative treatment effects (RTE) for observers for each defect model (implant: peri-implant defect and tooth: periodontal defect)
Figure 5.
Relative treatment effects (RTE) for observers for each image mode [normal: without artefact reduction (AR); low: low-mode AR; medium: medium-mode AR and high: high-mode AR]
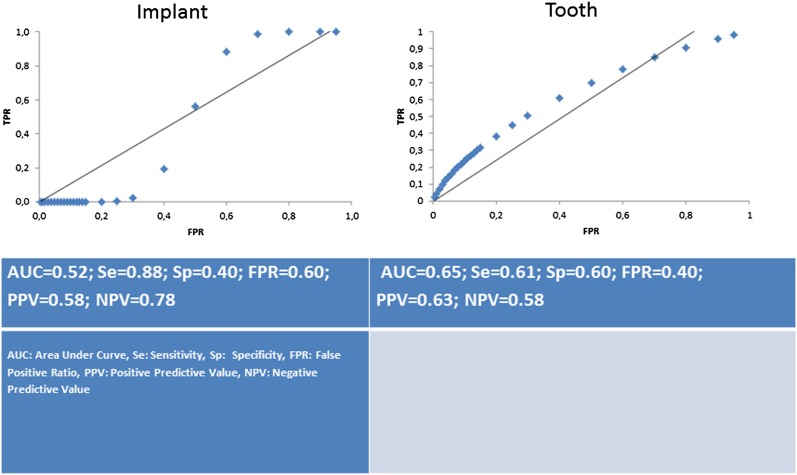
Table 4 shows the AUC values and their standard errors (SEs) for peri-implant defects and periodontal defects for each observer. AUC values ranged from 0.39 to 0.52 for images taken for peri-implant assessment and from 0.45 to 0.71 for images taken for periodontal assessment. For all observers, higher AUC values were obtained for the detection of buccal periodontal defects when compared with peri-implant defects. AUC values for the images taken for peri-implant assessment were very low (lower than 0.50) for all observers except for Observer 6. For Observer 6, the AUC value for the images taken for peri-implant assessment was lower (0.52) than those for the images taken for periodontal assessment (0.65), without statistically significant difference (p > 0.05) (Figure 6).
Table 4.
Area under curve (AUC) values and their standard errors (SE) for peri-implant defect and periodontal defect for each observer
| Observer | Type | AUC–SE |
| 1 | Peri-implant | 0.39–0.09 |
| Periodontal | 0.62–0.07 | |
| 2 | Peri-implant | 0.41–0.08 |
| Periodontal | 0.71–0.09 | |
| 3 | Peri-implant | 0.49–0.22 |
| Periodontal | 0.53–0.13 | |
| 4 | Peri-implant | 0.42–0.06 |
| Periodontal | 0.45–0.39 | |
| 5 | Peri-implant | 0.42–0.19 |
| Periodontal | 0.52–0.77 | |
| 6 | Peri-implant | 0.52–0.05 |
| Periodontal | 0.65–0.08 |
Figure 6.
AUC graphics of Observer 5 for each defect model. AUC, area under curve value; Se, sensitivity; Sp, specificity; FPR, false-positive ratio; PPV, positive predictive value; NPV, negative predictive value for Observer 6
Discussion
Accurate determination of buccal marginal periodontal defects of teeth may assist in the selection of appropriate surgical correction procedures, including grafting. In addition, an accurate and reliable imaging modality in the assessment of peri-implant marginal alveolar bone status is clinically important in terms of post-operative monitoring of stability and selection of remedial treatment. The present study suggested better intraobserver agreement and better observer performance for the diagnosis of buccal periodontal defects when compared with buccal peri-implant defects. Also, the sensitivity and false-positive ratio were higher with images taken for peri-implant assessment than for images taken for periodontal assessment; however; specificity was lower with images taken for peri-implant assessment. This is most likely owing to existence of full-arc implants, which increased the possibility of the occurrence of beam hardening and streak artefacts. In addition, there was no difference between observers’ diagnostic performance with different AR modes used. Under real clinical conditions, patient motion is another source of image artefacts, which was not an issue for this ex vivo research. Motion artefacts appear as double margins around a structure and may increase with increases in scan time, which can be as long as 20–30 s.1 In addition, implant brand had no effect on observer performance in the present research. This result might be owing to the limited number of implants used. Further studies will be conducted using more implants, and different brands are essential in terms of assessing defect visibility around implants.
In a previous study,19 infrabony buccal, lingual and interproximal defects of varying width and height were created using a one-quarter-round dental bur (0.25 mm) in the mandibular premolar and molar regions, similar to the present study. CBCT scanning, periapical radiography and direct measurements using a periodontal probe were compared with an electronic caliper, which was used as a standard reference. All bony defects were identifiable and measurable directly or with CBCT. For buccal and lingual measures, the direct measurement mean difference was 0.53 [−0.51 standard deviation (SD)], and the CBCT mean difference was 0.70 (−0.68 SD). These results were not statistically different (p > 0.09). We used smaller burs and that might be the reason why we could not detect all the periodontal buccal defects contrary to the mentioned study.
Researchers developed a special measurement technique by using a three-dimensional co-ordinate system, which allowed consistent measurement positions of the mesial, central and distal bone levels both for the oral and the vestibular sides of the alveolar crest in a dry human cadaver skull.20 Reliable and reproducible quantification of circumferential periodontal bone loss using CBCT data with standardized resolution of 160 μm could be performed in all three dimensions.20 Quantitative measurements of the periodontal defects were beyond the scope of our research. In the present study, we speculated that beam hardening and scatter artefacts from titanium implants would limit the utility of CBCT for buccal marginal alveolar defect detection. In line with this, we found relatively better detection rates for periodontal defect images when compared with peri-implant defect images. Cavities prepared with burs are normally shaped and well defined, and this could have increased observers’ detection ability. Our results could also be influenced by our experimental set-up in that we only imaged a mandible instead of a full head, the absence of motion artefacts, differential image quality of the CBCT system used and/or the use of experienced clinicians as observers. A previous study21 found that the ProMax 3D unit used in the present study caused more beam-hardening artefacts than a NewTom™ VG CBCT unit (QR Systems, Verona, Italy). Given the higher quality of images produced by the NewTom VG, the authors of the aforementioned study recommended its use when imaging patients with extensive restorations, multiple prostheses and implants.21
Razavi et al22 compared the ability of two different CBCT systems (i-CAT® Next Generation; Imaging Sciences International, Hatfield, PA, and Accuitomo 3D 60 FPDs; J. Morita Mfg. Corp., Kyoto, Japan) in determining the cortical bone thickness adjacent to dental implants and found the system with the lower resolution (i-CAT Next Generation) to be less accurate. Considering the reduced visibility of subtle bone structures when CBCT units employing more than 0.3 mm3 are used, we preferred to use an acquisition parameter (0.2 mm3) less than this apparent threshold.
A study by Mengel et al2 compared the accuracy of intraoral radiography, panoramic radiography, medical CT (ProSpeed SX Power; GE Medical Systems, Solingen, Germany) and a CBCT 3D Accuitomo (J. Morita Mfg. Corp.) to measure peri-implant defects created in a similar way to the technique used in the current study in pig mandibles. They found a mean deviation of 0.17–0.11 mm for the CBCT and 0.18–0.12 mm for the CT scans. Unlike the aforementioned study, we did not conduct any measurements on buccal peri-implant defects.
A similar study by Sirin et al4 compared the detection of peri-implant crestal bone defects of increasing diameter using periapical radiography, direct digital radiography, panoramic radiography, CBCT and multislice CT. They found similar intra- and interobserver agreement levels and lower detection rates for multislice CT with comparable rates for all other modalities. Unlike the aforementioned study, we did not assess decision-making speed or image quality of different radiographical modalities because these variables are relatively subjective and observer dependent.
In the present study, there was no distinction between varying types of CBCT image AR modes, using CBCT images taken at standard acquisition parameters in the detection of simulated buccal periodontal and peri-implant defects. To our knowledge, no previous study assessed various CBCT AR algorithms in the detection of periodontal and/or peri-implant defects. A study by Bechara et al23 assessed two CBCT machines, ProMax and Master 3D® (Vatech, Hwaseong, Republic of Korea), with and without applying an AR algorithm in detecting simulated root fractures in endodontically treated teeth. The highest accuracy was obtained when the ProMax was used without AR. For both machines, accuracy was significantly higher without AR than with AR. Both with and without AR, the ProMax machine was significantly more accurate than the Master 3D machine.23 We could not find statistical differences between any of the built-in AR modes of the Promax 3D Max unit in the detection of simulated buccal peri-implant and buccal periodontal defects.
CBCT delivers far greater effective doses than intraoral imaging. The reported effective dose for the CBCT unit used in the present study is in the range of 28–122 µSv.24 CBCT is advised only in situations where traditional two-dimensional techniques have been unable to provide sufficient reliable information for periodontal assessment2 and immediately postoperatively if implant mobility or altered sensation is reported.25
Conclusion
All CBCT images obtained without and with different AR modes with voxel resolutions of 0.2 mm3 performed similarly in detecting buccal peri-implant and buccal periodontal defects. Buccal marginal peri-implant defects were more difficult to detect than buccal marginal periodontal defects.
References
- 1.Angelopoulos C, Scarfe WC, Farman AG. A comparison of maxillofacial CBCT and medical CT. Atlas Oral Maxillofac Surg Clin North Am 2012; 20: 1–17 10.1016/j.cxom.2011.12.008 [DOI] [PubMed] [Google Scholar]
- 2.Mengel R, Kruse B, Flores de Jacoby L. Digital volume tomography in the diagnosis of peri-implant defects: an in vitro study on native pig mandibles. J Periodontol 2006; 77: 1234–1241 10.1902/jop.2006.050424 [DOI] [PubMed] [Google Scholar]
- 3.Corpas Ldos S, Jacobs R, Quirynen M, Huang Y, Naert I, Duyck J. Peri-implant bone tissue assessment by comparing the outcome of intra-oral radiograph and cone beam computed tomography analyses to the histological standard. Clin Oral Impl Res 2011; 22: 492–499 10.1111/j.1600-0501.2010.02029.x [DOI] [PubMed] [Google Scholar]
- 4.Sirin Y, Horasan S, Yaman D, Basegmez C, Tanyel C, Aral A, et al. Detection of crestal radiolucencies around dental implants: an in vitro experimental study. J Oral Maxillofac Surg 2012; 70: 1540–1550 10.1016/j.joms.2012.02.024 [DOI] [PubMed] [Google Scholar]
- 5.Gröndahl HG, Gröndahl K. Subtraction radiography for the diagnosis of periodontal bone lesions. Oral Surg Oral Med Oral Pathol Oral Radiol 1983; 55: 208–213 [DOI] [PubMed] [Google Scholar]
- 6.Gröndahl K, Gröndahl HG, Olving A. A comparison of Kodak Ektaspeed and Ultraspeed films for the detection of periodontal bone lesions. Dentomaxillofac Radiol 1983; 12: 43–46 [DOI] [PubMed] [Google Scholar]
- 7.du Bois A, Kardachi B, Bartold P. Is there a role for the use of volumetric cone beam computed tomography in periodontics? Aust Dent J 2012; 57: 103–108 10.1111/j.1834-7819.2011.01659.x [DOI] [PubMed] [Google Scholar]
- 8.de Faria Vasconcelos K, Evangelista KM, Rodrigues CD, Estrela C, de Sousa TO, Silva MA. Detection of periodontal bone loss using cone beam CT and intraoral radiography. Dentomaxillofac Radiol 2012; 41: 64–69 10.1259/dmfr/13676777 [DOI] [PMC free article] [PubMed] [Google Scholar]
- 9.Draenert FG, Gebhart F, Berthold M, Gosau M, Wagner W. Evaluation of demineralized bone and bone transplants in vitro and in vivo with cone beam computed tomography imaging. Dentomaxillofac Radiol 2010; 39: 264–269 10.1259/dmfr/147454468 [DOI] [PMC free article] [PubMed] [Google Scholar]
- 10.Kamburoğlu K, Gulsahi A, Genç Y, Paksoy CS. A comparison of peripheral marginal bone loss at dental implants measured with conventional intraoral film and digitized radiographs. J Oral Implantol 2012; 38: 211–219 10.1563/AAID-JOI-D-09-00147 [DOI] [PubMed] [Google Scholar]
- 11.Benavides E, Rios HF, Ganz SD, An CH, Resnik R, Reardon GT, et al Use of cone beam computed tomography in implant dentistry: the International Congress of Oral Implantologists consensus report. Implant Dent 2012; 21: 78–86 [DOI] [PubMed] [Google Scholar]
- 12.Miracle AC, Mukherji SK. Cone beam CT of the head and neck, part 1: physical principles. AJNR Am J Neuroradiol 2009; 30: 1088–1095 10.3174/ajnr.A1653 [DOI] [PMC free article] [PubMed] [Google Scholar]
- 13.Draenert FG, Coppenrath E, Herzog P, Müller S, Mueller-Lisse UG. Beam hardening artefacts occur in dental implant scans with the NewTom cone beam CT but not with the dental 4-row multidetector CT. Dentomaxillofac Radiol 2007; 36: 198–203 10.1259/dmfr/32579161 [DOI] [PubMed] [Google Scholar]
- 14.Cremonini CC, Dumas M, Pannuti CM, Neto JB, Cavalcanti MG, Lima LA. Assessment of linear measurements of bone for implant sites in the presence of metallic artefacts using cone beam computed tomography and multislice computed tomography. Int J Oral Maxillofac Surg 2011; 40: 845–850 10.1016/j.ijom.2011.04.015 [DOI] [PubMed] [Google Scholar]
- 15.Kamburoğlu K, Murat S, Yüksel SP, Cebeci AR, Horasan S. Detection of vertical root fracture using cone-beam computerized tomography: an in vitro assessment. Oral Surg Oral Med Oral Pathol Oral Radiol 2010; 109: e74–e81 10.1016/j.tripleo.2009.09.005 [DOI] [PubMed] [Google Scholar]
- 16.Benic GI, Sancho-Puchades M, Jung RE, Deyhle H, Hämmerle CH. In vitro assessment of artifacts induced by titanium dental implants in cone beam computed tomography. Clin Oral Implants Res 2013; 24: 378–383 10.1111/clr.12048 [DOI] [PubMed] [Google Scholar]
- 17.Schulze R, Heil U, Grob D, Bruellmann DD, Dranischnikow E, Schwanecke U, et al. Artefacts in CBCT: a review. Dentomaxillofac Radiol 2011; 40: 265–273 10.1259/dmfr/30642039 [DOI] [PMC free article] [PubMed] [Google Scholar]
- 18.Ren L, Yin FF, Chetty IJ, Jaffray DA, Jin JY. Feasibility study of a synchronized-moving-grid (SMOG) system to improve image quality in cone-beam computed tomography (CBCT). Med Phys 2012; 39: 5099–5110 10.1118/1.4736826 [DOI] [PubMed] [Google Scholar]
- 19.Misch KA, Yi ES, Sarment DP. Accuracy of cone beam computed tomography for periodontal defect measurements. J Periodontol 2006; 77: 1261–1266 10.1902/jop.2006.050367 [DOI] [PubMed] [Google Scholar]
- 20.Fleiner J, Hannig C, Schulze D, Stricker A, Jacobs R. Digital method for quantification of circumferential periodontal bone level using cone beam CT. Clin Oral Invest 2013; 17: 389–396 10.1007/s00784-012-0715-3 [DOI] [PubMed] [Google Scholar]
- 21.Esmaeili F, Johari M, Haddadi P, Vatankhah M. Beam hardening artifacts: comparison between two cone beam computed tomography scanners. J Dent Res Dent Clin Dent Prospects 2012; 6: 49–53 10.5681/joddd.2012.011 [DOI] [PMC free article] [PubMed] [Google Scholar]
- 22.Razavi T, Palmer RM, Davies J, Wilson R, Palmer PJ. Accuracy of measuring the cortical bone thickness adjacent to dental implants using cone beam computed tomography. Clin Oral Implants Res 2010; 21: 718–725 10.1111/j.1600-0501.2009.01905.x [DOI] [PubMed] [Google Scholar]
- 23.Bechara B, McMahan CA, Moore WS, Noujeim M, Teixeira FB, Geha H. Cone beam CT scans with and without artefact reduction in root fracture detection of endodontically treated teeth. Dentomaxillofac Radiol 2013; 42: 20120245. [DOI] [PMC free article] [PubMed] [Google Scholar]
- 24.Pauwels R, Beinsberger J, Collaert B, Theodorakou C, Rogers J, Walker A, Cockmartin L, Bosmans H, Jacobs R, Bogaerts R, Horner K. SEDENTEXCT Project Consortium. Effective dose range for dental cone beam computed tomography scanners. Eur J Radiol 2012; 81: 267–271 10.1016/j.ejrad.2010.11.028 [DOI] [PubMed] [Google Scholar]
- 25.Tyndall DA, Price JB, Tetradis S, Ganz SD, Hildebolt C, Scarfe WC. Position statement of the American Academy of Oral and Maxillofacial Radiology on selection criteria for the use of radiology in dental implantology with emphasis on cone beam computed tomography. Oral Surg Oral Med Oral Pathol Oral Radiol 2012; 113: 817–826 10.1016/j.oooo.2012.03.005 [DOI] [PubMed] [Google Scholar]


