

Abstract
Objectives:
The SEDENTEXCT Project proposed quality assurance (QA) methods and introduced a QA image quality phantom. A new prototype was recently introduced that may be improved according to previous reports. The purpose of this study is to evaluate image quality in various protocols of three cone beam CT (CBCT) machines using the proposed QA phantom.
Methods:
Using three CBCT machines, nine image quality parameters, including image homogeneity (noise), uniformity, geometrical distortion, pixel intensity value, contrast resolution, spatial resolution [line pair (LP) chart, point spread function (PSF) and modulation transfer function (MTF)] and metal artefacts, were evaluated using a QA phantom proposed by SEDENTEXCT. Exposure parameters, slice thickness and field of view position changed variously, and the number of total protocols was 22.
Results:
Many protocols showed a uniform gray value distribution except in the minimum slice thickness image acquired using 3D Accuitomo 80 (Morita, Kyoto, Japan) and Veraviewepocs 3Df (Morita). Noise levels differed among the protocols. There was no geometric distortion, and the pixel intensity values were correlated with the CT value. Low contrast resolution differed among the protocols, but high contrast resolution performed well in all. Many protocols showed that the maximum line pair was larger than 1 LP mm−1 but smaller than 3 LP mm−1. PSF and MTF did not correlate well with the pixel size. The measured metal artefact areas varied for each device.
Conclusions:
We studied the image quality of three CBCT machines using the SEDENTEXCT phantom. Image quality varied with exposure protocols and machines.
Keywords: cone beam CT, image quality, quality assurance, Radiographic phantom
Introduction
Over the past decade, cone beam CT (CBCT) has been introduced into dental practice. CBCT imaging is generally thought to offer a lower radiation dose and a higher spatial resolution than conventional multidetector (multislice) CT (MDCT). There are many CBCT devices currently on the market, and there are a large variety of exposure parameters, such as tube voltage, tube current, exposure time and rotation arc. There are also many field of view (FOV) sizes.1 These parameters affect the image quality and the exposure dose.2 It is important to evaluate the image quality by standardized and clinically relevant methods. For the past decade, many studies have evaluated one or more aspects of CBCT image quality using various phantoms, some of which used skulls or patient data.3–5 Although these studies may be clinically relevant, it is difficult to standardize the results of studies that used skulls or patient data.6 Other studies used geometric phantoms.7,8 Although it is difficult to relate the results obtained using the geometric phantom method to the clinical situation, geometric phantoms are useful for device comparison and quality control, and they also allow for a degree of standardization.6
Quality assurance (QA) testing is important to ensure the acquisition of consistently adequate diagnostic information while keeping the radiation dose as low as reasonably achievable when diagnostic methods using ionizing radiation are employed.9,10 Standard QA procedure for conventional CT, such as mutidetector CT (MDCT), already exists, and the phantom is commercially available.11 A standard QA method for CBCT was not established until recently. Since 2008, the SEDENTEXCT Project in Europe has focused on enhanced safety and efficacy in the use of CBCT in dental and maxillofacial radiology. One of its objectives is to develop a QA programme, including the development of a tool/tools for QA, and to define exposure protocols. Thus, the SEDENTEXCT Project proposed a QA method and introduced a QA image quality phantom.6,12–14
The purpose of this study is to evaluate the image quality in various protocols of three CBCT machines using a proposed QA phantom.
Materials and methods
Phantom and inserts
The phantom was designed by Leeds Test Objects Ltd (Boroughbridge, UK) as part of the EC project SEDENTEXCT (http://www.sedentexct.eu/).13 This phantom is a head-sized cylindrical polymethyl methacrylate (PMMA) phantom (diameter: 160 mm; height: 162 mm). The base parts (height: 22 mm) of the phantom consist of uniform PMMA. The upper part of the phantom contains seven cylindrical holes (diameter: 35 mm; height: 140 mm) positioned at the centre and periphery and arranged in a regular hexagon (Figure 1). With a total of 13 types of 42 cylindrical inserts (diameter: 35 mm; height: 20 mm) and with the base PMMA parts, a total of 9 image quality parameters can be tested. A list of image quality parameters, including the insets and rows, that are measured by this phantom is shown in Table 1.
Figure 1.
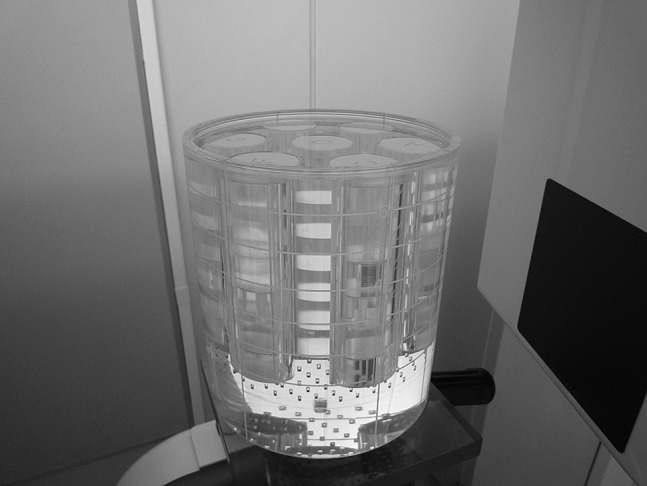
Image quality phantom made by Leeds Test Objects Ltd (Boroughbridge, UK)
Table 1.
List of the parameters for image analysis and inserts
| Parameter | Insert design | Position |
| Image homogeneity (image noise) | Uniform PMMA | The base part of the phantom |
| Image uniformity | Uniform PMMA | The base part of the phantom |
| Geometrical distortion | An array of 2.0 mm diameter, 3.0 mm deep air gaps are uniformly pitched | Between the uniform PMMA and the holes for inserts |
| Pixel intensity value | Five 25 mm diameter material discs (PTFE, Delrin, LDPE, aluminium, air) suspended in PMMA | Row 3 |
| Contrast resolution | 1.0 mm, 2.0 mm, 3.0 mm, 4.0 mm and 5.0 mm diameter rods (PTFE, Delrin, LDPE, aluminium, air) suspended in PMMA | Row 3 |
| Spatial resolution—line pair chart | Alternating aluminium/polymer chart (1.0 LP, 1.7 LP, 2.0 LP, 2.5 LP, 2.8 LP, 4.0 LP and 5.0 LP mm−1). Both xy and z directions | Row 4 |
| Spatial resolution—PSF and MTF | PSF—0.25 mm diameter stainless steel wire suspended in air | Row 4 |
| Spatial resolution—line spread function and MTF | Sharp edge of the PMMA/PTFE interface | Row 4 |
| Metal artefact | A line of three 5.0 mm diameter Ti rods suspended in PMMA | Row 1 |
LDPE, low density polyethylene; MTF, modulation transfer function; PMMA, polymethyl methacrylate; PSF, point spread function; PTFE, polytetrafluoroethylene; Ti, titanium.
All holes other than those mentioned above were filled with the uniform PMMA inserts.
The base parts of the phantom consisted of two parts. In the lower part, image homogeneity and uniformity are measured (Figure 2a). In the upper part, the array of regularly arranged small holes (diameter: 2.0 mm; depth: 3.0 mm) in the PMMA is used to measure geometric distortion (Figure 2b). In Row 1, the lowest section where these holes are made, the inserts are for the measurement of metal artefact (Figure 2c). An inset consists of a line of three 5.0 mm diameter titanium (Ti) rods suspended in PMMA. In Row 3, the inserts are for pixel intensity values and contrast resolution (Figure 2d). The inset for pixel intensity value contains five 25 mm diameter discs, which are made of aluminium, polytetrafluoroethylene (PTFE), Delrin, low-density polyethylene (LDPE) and air. The contrast resolution phantom consists of five inserts; each contains 1.0 mm, 2.0 mm, 3.0 mm, 4.0 mm and 5.0 mm diameter rods made of aluminium, PTEF, Delrin, LDPE or air. In Row 4, the inserts of line pair charts, line spread function and point spread function (PSF) are for measuring spatial resolution (Figure 2e). Line pair (LP) charts are made of alternated aluminium/polymer charts with distances of 1.0 LP, 1.7 LP, 2.0 LP, 2.5 LP, 2.8 LP, 4.0 LP and 5.0 LP mm−1. Both xy and z directions are included. A line spread function inset is on the sharp edge of the PMMA/PTFE interface and that of the PSF is a 0.25 mm diameter stainless steel wire suspended in air. The other holes in each row are filled with uniform PMMA inserts.
Figure 2.

CT axial images of the image quality phantom. (a) Noise/uniformity section. Homogeneous polymethyl methacrylate (PMMA). (b) Geometric distortion section. An array of 2.0 mm diameter, 3.0 mm deep air gaps are uniformly pitched throughout the phantom. (c) Beam hardening artefact. A line of three 5.0 mm diameter titanium rods. (d) Contrast resolution and pixel intensity section. Contrast resolution phantom consists of five pieces. Each piece contains 1.0 mm, 2.0 mm, 3.0 mm, 4.0 mm and 5.0 mm diameter rods made of aluminium, polytetrafluoroethylene (PTFE), Delrin, low-density polyethylene (LDPE) or air. Pixel intensity contains five 25 mm diameter discs, made of PTFE, Delrin, LDPE, aluminium or air. (e) Spatial resolution section. There are line pair charts, line spread function (LPS) and point spread function (PSF) pieces. Line pair charts are made of alternated aluminium/polymer charts with distances of 1.0 LP, 1.7 LP, 2.0 LP, 2.5 LP, 2.8 LP, 4.0 LP and 5.0 LP mm−1. Both xy and z directions are included. An LPS insert is on the sharp edge of the PMMA/PTFE interface and that of the PSF is 0.25 mm diameter stainless steel wire suspended in air
In this study, the spatial resolution was estimated using PSF and line pair charts.
Because the FOV is positioned at the periphery of the patient's head in the clinical situation, target inserts were placed at the periphery of this phantom. To clarify the effect of the FOV position on image quality, some parameters were examined when the FOV was placed at the centre of the phantom.
CBCT apparatus
We used three CBCT devices: CS9300 (Carestream, Rochester, NY), 3D Accuitomo 80 (Morita Kyoto, Japan) and Veraviewepocs 3Df (Morita). Table 2 shows the exposure conditions used in this experiment. The minimum slice thickness of each machine was selected according to the phantom's user manual. For 3D Accuitomo 80 and Veraviewepocs 3Df, the manufacturer-recommended slice thickness was also examined. A multidetector helical CT (MDCT, Hi Speed QXi; GE Healthcare Japan, Tokyo, Japan) was used for comparison of the pixel intensity value.
Table 2.
Cone beam CT and multidetector (multislice) CT devices and exposure protocols
| Device | Protocola | FOV [diameter (cm) × height (cm)] | Scan modeb | Voxel size (μm3) | Tube voltage (kV) | Tube current (mA) | Exposure time (s) | Position of FOVc |
| CS9300 (Carestream, Rochester, NY) | CS_c_0.09_60_2 | 5 × 5 | Half | 90 × 90 × 90 | 60 | 2 | 20 | Centre |
| CS_p_0.09_60_2 | 5 × 5 | Half | 90 × 90 × 90 | 60 | 2 | 20 | Periphery | |
| CS_c_0.09_84_5 | 5 × 5 | Half | 90 × 90 × 90 | 84 | 5 | 20 | Centre | |
| CS_p_0.09_84_5 | 5 × 5 | Half | 90 × 90 × 90 | 84 | 5 | 20 | Periphery | |
| CS_c_0.09_90_10 | 5 × 5 | Half | 90 × 90 × 90 | 90 | 10 | 20 | Centre | |
| CS_p_0.09_90_10 | 5 × 5 | Half | 90 × 90 × 90 | 90 | 10 | 20 | Periphery | |
| CS_c_0.09_84_5_fast | 5 × 5 | Half | 90 × 90 × 90 | 84 | 5 | 12 | Centre | |
| CS_p_0.09_84_5_fast | 5 × 5 | Half | 90 × 90 × 90 | 84 | 5 | 12 | Periphery | |
| 3D Accuitomo 80 (Morita, Kyoto, Japan) | Accuit_p_0.08_90_1 | 4 × 4 | Full | 80 × 80 × 80 | 90 | 1 | 17.5 | Periphery |
| Accuit_p_0.08_90_3 | 4 × 4 | Full | 80 × 80 × 80 | 90 | 3 | 17.5 | Periphery | |
| Accuit_c_0.08_90_5 | 4 × 4 | Full | 80 × 80 × 80 | 90 | 5 | 17.5 | Centre | |
| Accuit_p_0.08_90_5 | 4 × 4 | Full | 80 × 80 × 80 | 90 | 5 | 17.5 | Periphery | |
| Accuit_p_0.08_90_8 | 4 × 4 | Full | 80 × 80 × 80 | 90 | 8 | 17.5 | Periphery | |
| Accuit_p_0.64_90_1 | 4 × 4 | Full | 80 × 80 × 640 | 90 | 1 | 17.5 | Periphery | |
| Accuit_p_0.64_90_3 | 4 × 4 | Full | 80 × 80 × 640 | 90 | 3 | 17.5 | Periphery | |
| Accuit_c_0.64_90_5 | 4 × 4 | Full | 80 × 80 × 640 | 90 | 5 | 17.5 | Centre | |
| Accuit_p_0.64_90_5 | 4 × 4 | Full | 80 × 80 × 640 | 90 | 5 | 17.5 | Periphery | |
| Accuit_p_0.64_90_8 | 4 × 4 | Full | 80 × 80 × 640 | 90 | 8 | 17.5 | Periphery | |
| Veraviewepocs 3Df (Morita) | Vera_c_0.125_90_5 | 4 × 4 | Half | 125 × 125 × 125 | 90 | 5 | 9.4 | Centre |
| Vera_p_0.125_90_5 | 4 × 4 | Half | 125 × 125 × 125 | 90 | 5 | 9.4 | Periphery | |
| Vera_c_1.0_90_5 | 4 × 4 | Half | 125 × 125 × 1000 | 90 | 5 | 9.4 | Centre | |
| Vera_p_1.0_90_5 | 4 × 4 | Half | 125 × 125 × 1000 | 90 | 5 | 9.4 | Periphery | |
| CT (Hi Speed QXi; GE Healthcare Japan, Tokyo, Japan) | MDCT | 16 × – | Helical | 350 × 350 × 625 | 120 | 80 | 0.7/rotation | — |
3D, three-dimensional; FOV, field of view; MDCT, multidetector (multislice) CT.
A selection of protocols was made based on the recommendation of the phantom manual, clinical relevance and the availability of the device.
Scan mode: half is an approximately 180° scan, full is an approximately 360° scan, helical is the helical or spiral mode of the multidetector helical CT.
Position of FOV means the FOV position relative to the phantom; centre is when the centre hole is located at the centre of the FOV in the xy-plane; periphery is when a peripheral hole is located at the centre of the FOV in the xy-plane.
Images obtained using the CBCT and MDCT devices were saved in digital imaging and communications in medicine format. Image J (National Institutes of Health, Bethesda, MD) was used for image display and measurement. For the subjective evaluative parameters, two oral radiologists independently observed and evaluated the images.
Analysis of image quality
Image uniformity and image homogeneity (image noise)
Image uniformity and image homogeneity (image noise) were measured on the images obtained by scanning the base part of the phantom. FOVs that were placed at the centre and at the periphery of the phantom were examined. In the phantom, slice image, five circular regions of interest (ROIs) were placed at the FOV centre and periphery (Figure 3). The ROI diameter was 20% of the FOV diameter. Each ROI was assigned a number (1–5) for the purpose of identification, as shown in Figure 3. The average gray value in each ROI was measured and the difference in the gray value between the ROIs was used as a parameter of image uniformity. For image homogeneity (image noise), the standard deviation of the gray value in ROI 3 was used. Ten axial images at the centre of the FOV in the z-direction were selected, and measurements were then repeated. Similarly, ten coronal images were selected and measured for uniformity in the coronal (z) plain.
Figure 3.

Example of a region of interest (ROI) in the measuring of image uniformity and image homogeneity (image noise). The diameter of the ROI was 20% of the field-of-view diameter. Each ROI was assigned a number (1–5) for the purpose of identification. The difference of the average gray value between ROIs and the standard deviation of gray values in ROI 3 were used as a parameter of image uniformity and image homogeneity (image noise), respectively
Geometrical distortion
The line profile was obtained on the axial image of the phantom's geometric part, and the distance between air gaps was measured (Figure 4).
Figure 4.

A representative axial image of the phantom's geometric part and line profile. Axial image obtained using 3D Accuitomo 80 (Morita, Kyoto, Japan). Line profiles on the image were drawn using ImageJ (National Institutes of Health, Bethesda, MD)
Pixel intensity value
An inset for pixel intensity value was used. This inset was positioned at a periphery hole in the phantom (Figure 2d). Exposure conditions were defaults, and tube currents of 1 mA, 3 mA, and 8 mA were added using the 3D Accuitomo 80. The average gray value of the circular ROI that had a diameter of 75% of the phantom's diameter was obtained using the ImageJ measuring tool. These were then compared with the CT value that was obtained using MDCT in a similar manner (Figure 5). To estimate whether or not the surrounding phantom materials affect the pixel value, we compared the value obtained using the inset default settings, according to the manual, with the value obtained when other holes were occupied by uniform PMMA inserts using 3D Accuitomo 80 and Veraviewepocs 3Df.
Figure 5.

A representative image of the phantom pixel intensity insert. (a) Axial image at the aluminium insert and region of interest; (b) coronal image of the pixel intensity insert. PTFE, polytetrafluoroethylene; LDPE, low-density polyethylene
Contrast resolution
Images of the contrast resolution insert were viewed by two oral radiologists using ImageJ (Figure 6). Image magnification, contrast and brightness were adjusted freely by the observer. The minimum observable rod diameter was determined. When the results differed, they were discussed and consensus was reached. Similar to the pixel intensity value, we compared the value obtained when the inserts were in the default setting, according to the manual, with the value obtained when the other holes were occupied by uniform PMMA inserts using 3D Accuitomo 80 and Veraviewepocs 3Df.
Figure 6.

A representative image of the phantom's contrast resolution inserts. PTFE, polytetrafluoroethylene; LDPE, low-density polyethylene
Spatial resolution—line pair chart
Alternating aluminium/polymer chart inserts (1.0 LP, 1.7 LP, 2.0 LP, 2.5 LP, 2.8 LP, 4.0 LP and 5.0 LP mm−1) were used (Figure 7). Images of the phantom were viewed by two oral radiologists using ImageJ, similar to the contrast resolution. Two inserts of this type were used to evaluate the axial (xy) and coronal (z) planes.
Figure 7.

A representative image of the line pair chart for the axial (xy) plain. Numbers are in LP mm−1
Spatial resolution—PSF and modulation transfer function
The PSF inset was used for this measurement. The centre of the rectangular ROI, which was 128 × 48 pixels, was placed at the wire (Figure 8). Pixel values were integrated in the longitudinal direction to yield a one-dimensional PSF. The resulting distribution was plotted, and the interpolated curve fit the measured full width half maximum (FWHM) using KaleidaGraph 4.1 (Synergy Software, Reading, PA). The modulation transfer function (MTF) was also calculated from one-dimensional PSF using the fast Fourier transform method.15
Figure 8.
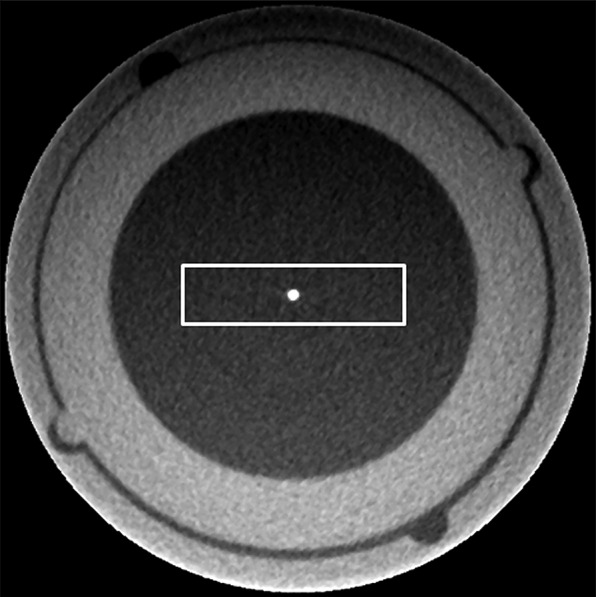
A representative image of the insert for the point spread function. A rectangular region of interest was set at the centre of the wire
Metal artefact
Two types of metal artefact inserts were used. The first type was the three rods aligned parallel to the phantom periphery and the second type was the three rods aligned perpendicular to it. The images of metal artefact insets were transferred to ImageJ (Figure 9a). For the quantification of metal artefacts, the artefact areas were analysed by establishing threshold pixel values for black and white artefacts, according to the method by Chindasombatjaroen et al16 and van der Schaaf et al17 Threshold values were calculated by adding or subtracting three times the background value standard deviation to the background attenuation value of the phantom uniform PMMA area without metal. The areas below and above the threshold values were defined as black (Figure 9b) and white (Figure 9c) artefacts, respectively. For measuring artefact area, we used a circular ROI with a diameter of 34 mm. Within that ROI, black and white artefacts were measured and added, then 58.9 mm2, which was the true area of the three rods in a 5 mm diameter, was subtracted from the artefacts.
Figure 9.

A representative image of the metal artefact insert and measurement of the artefact area. (a) A representative image of the metal artefact insert and region of interest; (b) the area where the pixel values are lower than the threshold. The white area is lower than the average polymethyl methacrylate (PMMA) pixel value—three times the PMMA standard deviation; (c) the area where the pixel values are higher than the threshold. The white area is higher than the average PMMA pixel value plus three times the PMMA standard deviation
Results
The results of image uniformity are shown in Figure 10. In the axial plain, the minimum slice thickness image using 3D Accuitomo 80 and Veraviewepocs 3Df at the periphery position showed a non-uniform gray value distribution. For the 3D Accuitomo, the images at the periphery position (0.64 mm slice thickness) and at the centre position (0.08 mm slice thickness) also showed a slightly uneven gray value distribution. The images of other protocols showed almost uniform gray value distribution. In the coronal direction, images of both the centre and the peripheral positions (0.08 mm slice thickness) using 3D Accuitomo 80 and the peripheral position (0.125 mm thickness) using Veraviewepocs 3Df showed non-uniform gray value distribution (Figure 10b).
Figure 10.

Uniformity of the gray value in the field of view. (a) Axial direction; (b) coronal direction. Abbreviations are the same as in Table 2. ROI, region of interest
Image homogeneity (image noise) is shown in Figure 11. Images of thick slices showed lower noise than thinner slices using the 3D Accuitomo 80 and Veraviewepocs 3Df (Figure 11a). The noise level was different according to the FOV position in the thin slices of 3D Accuitomo 80 and Veraviewepocs 3Df. Using CS9300, a large exposure dose showed low noise and the FOV position did not affect the noise level (Figure 11b). The results for noise in the coronal and sagittal planes were similar to the results shown in Figure 11 for the axial plane and are therefore not presented.
Figure 11.

Image homogeneity (noise). (a) Noise in axial images; (b) noise variations by exposure parameters in CS9300 (Carestream, Rochester, NY). Abbreviations are the same as in Table 2
Geometrical distortion
The average distances between the gaps are shown in Table 3. All protocols except the CS9300 fast mode had no distinct geometric distortion.
Table 3.
Geometric distortion: average distance between gaps
| CT apparatus | Exposure conditions (kV, mA, s) | Voxel size (μm3) | Distances average (mm) | Min–max |
| CS9300 | 60, 2, 20 | 90 × 90 × 90 | 10.05 | 9.90–10.30 |
| 84, 5, 20 | 10.04 | 10.00–10.10 | ||
| 90, 10, 20 | 10.04 | 10.00–10.10 | ||
| 84, 5, 12 | 10.19 | 10.10–10.20 | ||
| 3D Accuitomo 80 (Morita) | 84, 5, 17.5 | 80 × 80 × 640 | 10.08 | 10.00–10.10 |
| 80 × 80 × 80 | 10.09 | 10.00–10.20 | ||
| Veraviewepocs 3Df (Morita) | 84, 5, 9.4 | 125 × 125 × 1000 | 10.14 | 10.00–10.30 |
| 125 × 125 × 125 | 10.13 | 10.00–10.30 |
3D, three-dimensional; max, maximum; min, minimum.
Pixel intensity value
Figure 12 shows the pixel intensity value results. The CBCT pixel intensity values showed strong correlation with the CT value (Figure 12a). The surrounding materials of the phantom did not have any effect on the pixel intensity values at the recommended exposure dose (Figure 12b).
Figure 12.

Cone beam CT (CBCT) pixel intensity values. (a) The CBCT pixel intensity values correlate with the CT value; (b) effect of the surrounding materials on CBCT pixel intensity value. In Figure 12a, abbreviations are the same as in Table 2. In Figure 12b, “default” is when the inserts were in the default setting according to the manual. “wPMMA” is when other holes were occupied by uniform polymethyl methacrylate (PMMA) inserts. Other abbreviations are the same as in Table 2
Contrast resolution
Figure 13 shows representative images of each rod inset which were obtained using 3D Accuitomo 80. Table 4 shows the minimum observed diameter of each rod for all materials except air and aluminium because these two materials showed a 1 mm minimum observable diameter in all protocols. The minimum observable diameter was 1 mm or 2 mm in many protocols. For each device, the larger the exposure dose, the smaller the minimum diameter.
Figure 13.

Example images of rod inserts. The protocol Accuit_p_0.08_90_5 is shown in Table 2. (a) Aluminium, (b) polytetrafluoroethylene, (c) Delrin, (d) low-density polyethylene and (e) air
Table 4.
Observed minimum diameter of contrast phantom
| Device | Protocol | Observed minimum diameter (mm) of each rod material | ||
| LDPE | Delrin | PTFE | ||
| CS9300 (Carestream, Rochester, NY) | CS_p_0.09_60_2 | × | × | 2 |
| CS_p_0.09_84_5 | 1 | 2 | 1 | |
| CS_p_0.09_90_5 | 1 | 2 | 1 | |
| CS_p_0.09_84_5_fast | 1 | 2 | 1 | |
| 3D Accuitomo 80 (Morita, Kyoto, Japan) | Accuit_p_0.64_90_5_wPMMA | 1 | 1 | 1 |
| Accuit_p_0.64_90_1_default | 1 | 2 | 1 | |
| Accuit_p_0.64_90_3,5,8_default | 1 | 1 | 1 | |
| Accuit_p_0.08_90_5_wPMMA | 1 | 1 | 1 | |
| Accuit_p_0.08_90_1_default | 1 | × | 1 | |
| Accuit_p_0.08_90_3,5_default | 1 | 2 | 1 | |
| Accuit_p_0.08_90_8_default | 1 | 1 | 1 | |
| Veraviewepocs 3Df (Morita) | Vera_p_1.0_90_5_wPMMA | 1 | 2 | 1 |
| Vera_p_1.0_90_1,3,5,8_default | 1 | 2 | 1 | |
| Vera_p_0.125_90_5_wPMMA | 1 | 2 | 1 | |
| Vera_p_0.125_90_1_default | 2 | × | 1 | |
| Vera_p_0.125_90_3_default | 1 | 3 | 1 | |
| Vera_p_0.125_90_5,8_default | 1 | 2 | 1 | |
LPDE, low-density polyethylene; PMMA, polymethyl methacrylate; PTFE, polytetrafluoroethylene.
“default” is when the inserts are in the default setting according to the manual. “wPMMA” is when other holes were occupied by uniform PMMA inserts. Other abbreviations are the same as in Table 2, except that the tube current is combined when the results were the same. × indicates that all rods (1–5 mm) cannot be observed.
Spatial resolution—line pair chart
Table 5 summarises the results of line pair inset observations from each protocol. Many protocols showed that the maximum line pair was larger than 1 LP mm−1 but all protocols showed that it was less than 3 LP mm−1. There was no difference between the results of the default inset arrangement and those when other holes were occupied with uniform PMMA (wPMMA).
Table 5.
Maximum distinguishable line pair in each protocol
| Device | Protocol | Voxel size (μm3) | Maximum distinguishable line pair (LP mm−1) | |
| xy plain | z plain | |||
| CS9300 (Carestream, Rochester, NY) | CS_p_0.09_60_2 | 90 × 90 × 90 | 1.7 | 1 |
| CS_p_0.09_84_5 | 2.5 | 2 | ||
| CS_p_0.09_90_5 | 2.8 | 2 | ||
| CS_p_0.09_84_5_fast | 2.5 | 2 | ||
| 3D Accuitomo 80 (Morita, Tokyo, Japan) | Accuit_p_0.64_90_5_wPMMA | 80 × 80 × 640 | 2 | 0 |
| Accuit_p_0.64_90_5_default | 2 | 0 | ||
| Accuit_p_0.08_90_5_wPMMA | 80 × 80 × 80 | 2 | 2.5 | |
| Accuit_p_0.08_90_5_default | 2.5 | 2 | ||
| Veraviewepocs 3Df (Morita) | Vera_p_1.0_90_5_wPMMA | 125 × 125 × 1000 | 1.7 | 0 |
| Vera_p_1.0_90_5_default | 1.7 | 0 | ||
| Vera_p_0.125_90_5_wPMMA | 125 × 125 × 125 | 1.7 | 2 | |
| Vera_p_0.125_90_5_default | 1 | 1.7 | ||
PMMA, polymethyl methacrylate.
“default” is when the inserts were in the default setting according to the manual. “wPMMA” is when the other holes were occupied by uniform PMMA inserts. Other abbreviations are the same as in Table 2.
Spatial resolution—PSF and MTF
The comparison of FWHM against the pixel size is shown in Figure 14. Pixel size did not correlate with the FWHM. Using Accuitomo, the default inset setting was different than when the other holes were occupied with uniform PMMA. The MTFs of using four protocols of three devices are shown in Figure 15a. The protocol with the smallest voxel size (Accuit_p_0.08_90_5) did not show the highest MTF response. In Figure 15b, the results of the default setting were slightly different than the wPMMA using Accuit_p_0.08_90_5.
Figure 14.

Pixel size and full width half maximum (FWHM). “default” is when the inserts were in the default setting according to the manual. “wPMMA” is when other holes were occupied by uniform PMMA inserts. Other abbreviations are same as in Table 2
Figure 15.

Modulation transfer function (MTF) of cone beam CT devices. (a) MTF of four protocols in three devices; (b) MTF with “default” and “wPMMA” settings. In Figure 15a, abbreviations are the same as in Table 2. In Figure 15b, “default” is when the inserts are in the default setting according to the manual. “wPMMA” is when other holes were occupied by uniform PMMA inserts. Other abbreviations are the same as in Table 2
Metal artefact
A representative image of a metal artefact inset is shown in Figure 16. In these images, contrast and brightness did not alter from the default setting. Measured metal artefact areas are shown in Figure 17. As shown in Figure 17, there was no difference between the rod directions using CS9300 and a little difference between the rod directions using 3D Accuitomo 80. Using CS9300, a high-dose protocol showed a large metal artefact area.
Figure 16.

Example images of a metal artefact. In these images, contrast and brightness were not changed from the default setting. (a) CS_p_0.09_60_2_ho, (b) CS_p_0.09_84_5_ho, (c) CS_p_0.09_90_10_ho, (d) CS_p_0.09_84_5_fast_ho, (e) Accuit_p_0.08_90_5_ho, (f) Accuit_p_0.64_90_5_ho, (g) Vera_p_0.125_90_5_ho, (h) Vera_p_1.0_90_5_ho. ho: rods aligned parallel to the phantom periphery; va: rods aligned perpendicular to it. Other abbreviations are the same as in Table 2
Figure 17.

Metal artefact area protocol changes ho: rods aligned parallel to the phantom periphery; va: rods aligned perpendicular to it. Other abbreviations are the same as in Table 2
Discussion
QA of CBCT is performed to ensure that consistently adequate diagnostic information is acquired while the radiation dose is kept as low as reasonably achievable. The SEDENTEXCT Project in the European Union recommended that the QA program be composed mainly of six subjects.13 These six subjects were performance of the X-ray tube and generator, quantitative assessment of image quality, display screen performance, patient dose assessment, clinical image quality assessment and clinical audit. Quantitative assessment of image quality consistently requires a well-designed phantom for this purpose. The SEDENTEXCT Project also proposed the phantom.12
The images at the peripheral FOV, obtained using 3D Accuitomo 80 and Veraviewepocs 3Df in the thin slice mode, were heterogeneous. The reason for this is not clear. When the FOV was positioned at the periphery, the length of X-ray that passes through the phantom varies. When the X-ray pass length is different, the beam hardening effect is also different. In addition, the dose distribution at the detector plain (projection data) shows various levels. These two devices are thought to have automatic sensitivity correction. This correction method is changed projected X-ray data separately before reconstruction. Low-dose projection datum is corrected strongly, whereas high-dose projection datum is corrected slightly. These beam hardening and correction of projection data may affect the image uniformity.
Geometrical distortion was at an acceptable level on the basis of voxel size except in the fast mode of CS9300 (CS_p_0.09_84_5_fast). This might be caused by a relatively small projection number rather than by the normal mode.
The pixel intensity value of each protocol showed a linear correlation with the CT value obtained using MDCT, but not with 3D Accuitomo 80 90 kV 1 mA (Accuit_p_0.08_90_1). In this protocol case, the exposure dose was very low within our experimental protocols. As mentioned above, the exposure correction of each projection datum might cause a divergence in linear correlation. The observed linear correlation is not suggested to be maintained in the clinical situation because the circumstances affect the pixel values.18,19 In routine QA protocol, the default inset position is allowed because the linearity of the default position does not differ obviously from that with PMMA.
In the contrast resolution phantom, small diameter (1 mm or 2 mm) rods made of LDPE, Delrin and PTEF were not observed in some protocols. This suggests that the contrast resolution phantom made of LDPE, Delrin and PTEF is useful to distinguish between the performances of the devices' contrast resolution. In a device, the minimum rods that were visible were influenced by the radiation dose. High contrast resolution rods (aluminium and air) were observed in all protocols. From these results, and as reported by Pauwels et al,6 contrast resolution is affected by contrast spatial resolution and noise. However, in some protocols, if a minimum diameter (1 mm) was observed, then the protocol capacity was greater than phantom; thus, it is better that the phantom contains smaller diameter rods, such as those 0.5 mm in diameter.
Results of the line pair chart observation were consistent with, but more detailed than, those reported by Pauwels et al.6 This was because the phantom used in the present study was newer than that used by Pauwels et al. The line pair chart of our used phantom was divided into smaller parts between 1 LP mm−1 and 3 LP mm−1.
FWHM and MTF did not correlate with pixel size. These results were consistent with those of Pauwels et al.6 Using the 3D Accuitomo 80, the inset surrounding conditions when the rest of the holes were in the default arrangement or occupied only by PMMA inserts influenced the results.
We used the method described by van der Schaaf et al17 to evaluate the metal artefact. This method quantifies the metal effect in the area where the pixel value is over or under the mean gray value of the background by ±3 times the standard deviation. This method evaluates the extent of the affected area but does not evaluate the extent of pixel value change. Pauwels et al used the standard deviation of the background itself.14 Using the CS9300, an increase in the radiation dose resulted in a large metal artefact area. This may the result of a difference in the standard deviation of the background (PMMA), especially in the case of 60 kV 2 mA. The standard deviations at 60 kV 2 mA, 84 kV 5 mA and 90 kV 10 mA were 5.73, 0.92 and 0.61, respectively. The reason why the metal artefact differs at 84 kV 5 mA and 90 kV 10 mA is not clear. The metal artefact in a high-noise image may be subjectively unnoticeable compared with that in a low-noise image. The method described by van der Schaaf et al may correspond to this subjective phenomenon. Because the phantom we used contained only a metal artefact inset made of Ti, we could not evaluate the extent to which different materials would affect the metal artefact.
The radiation dose usually affects the image quality. In practice, it is important to decide the CBCT exposure condition according to the “as low as reasonably achievable” (ALARA) principle.20 We varied the exposure protocols in three CBCT machines. The exposure dose differed with different protocols and may vary with different machines. Further studies are necessary to determine the relation of image quality with accurate exposure dose or effective dose.
The SEDENTEXCT Project recommended the process and duration of a QA procedure.13 In this report, the quantitative image quality performances are image density value (pixel intensity value), uniformity and artefact, noise, spatial resolution (line pair chart, MTF), contrast detail (contrast resolution) and geometric accuracy. The parameters can be divided into two priority categories: essential and recommended. Essential parameters are uniformity, artefact, spatial resolution and geometric accuracy, whereas the others are recommended. The suggested testing frequency is monthly or yearly; image density value, uniformity and artefact are recommended for monthly testing and the others are recommended for yearly testing. All the above assessments can be evaluated using this phantom. Analysing software is not provided together with the phantom. We used ImageJ, which is open-source software and can be made into a plug-in and a macro. We made a macro for measurement, but it was difficult and time consuming. It would be useful to supply a macro or software for measurement together with phantom because not everyone is familiar with a macro program.
In conclusion, we studied the image quality of three CBCT machines using an SEDENTEXCT phantom. Image quality varied with exposure protocols and machines.
References
- 1.Scarfe WC, Li Z, Aboelmaaty W, Scott SA, Farman AG. Maxillofacial cone beam computed tomography: essence, elements and steps to interpretation. Aust Dent J 2012; 57: 46–60 10.1111/j.1834-7819.2011.01657.x [DOI] [PubMed] [Google Scholar]
- 2.Pauwels R, Beinsberger J, Collaert B, Theodorakou C, Rogers J, Walker A, et al Effective dose range for dental cone beam computed tomography scanners. Eur J Radiol 2012; 81: 267–271 10.1016/j.ejrad.2010.11.028 [DOI] [PubMed] [Google Scholar]
- 3.Liang X, Jacobs R, Hassan B, Li L, Pauwels R, Corpas L, et al A comparative evaluation of Cone Beam Computed Tomography (CBCT) and Multi-Slice CT (MSCT) Part I. On subjective image quality. Eur J Radiol 2010; 75: 265–269 10.1016/j.ejrad.2009.03.042 [DOI] [PubMed] [Google Scholar]
- 4.Loubele M, Van Assche N, Carpentier K, Maes F, Jacobs R, van Steenberghe D, Suetens P. Comparative localized linear accuracy of small-field cone-beam CT and multislice CT for alveolar bone measurements. Oral Surg Oral Med Oral Pathol Oral Radiol Endod 2008; 105: 512–518 10.1016/j.tripleo.2007.05.004 [DOI] [PubMed] [Google Scholar]
- 5.Loubele M, Maes F, Schutyser F, Marchal G, Jacobs R, Suetens P. Assessment of bone segmentation quality of cone-beam CT versus multislice spiral CT: a pilot study. Oral Surg Oral Med Oral Pathol Oral Radiol Endod 2006; 102: 225–234 10.1016/j.tripleo.2005.10.039 [DOI] [PubMed] [Google Scholar]
- 6.Pauwels R, Beinsberger J, Stamatakis H, Tsiklakis K, Walker A, Bosmans H, et al Comparison of spatial and contrast resolution for cone-beam computed tomography scanners. Oral Surg Oral Med Oral Pathol Oral Radiol 2012; 114: 127–135 10.1016/j.oooo.2012.01.020 [DOI] [PubMed] [Google Scholar]
- 7.Suomalainen A, Kiljunen T, Käser Y, Peltola J, Kortesniemi M. Dosimetry and image quality of four dental cone beam computed tomography scanners compared with multislice computed tomography scanners. Dentomaxillofac Radiol 2009; 38: 367–378 10.1259/dmfr/15779208 [DOI] [PubMed] [Google Scholar]
- 8.Loubele M, Jacobs R, Maes F, Denis K, White S, Coudyzer W, et al Image quality vs radiation dose of four cone beam computed tomography scanners. Dentomaxillofac Radiol 2008; 37: 309–318 10.1259/dmfr/16770531 [DOI] [PubMed] [Google Scholar]
- 9.NRPB Guidelines on radiology standards for primary dental care: report by the Royal College of Radiologists and the National Radiological Protection Board. Oxford, UK: NRPB National Radiological Protection Board; 1994 [DOI] [PubMed] [Google Scholar]
- 10.European Commission Radiation Protection 136 European guidelines on radiation protection in dental radiology. The safe use of radiographs in dental practice. Belgium: European Communities; 2004 [Google Scholar]
- 11.International Electrotechnical Commission IEC 60601-2-44:2009+A1. Geneva, Switzerland: International Electrotechnical Commission; 2012 [Google Scholar]
- 12.Pauwels R, Stamatakis H, Manousaridis G, Walker A, Michielsen K, Bosmans H, et al Development and applicability of a quality control phantom for dental cone-beam CT. J Appl Clin Med Phys 2011; 12: 3478. [DOI] [PMC free article] [PubMed] [Google Scholar]
- 13.The SEDENTEXCT Project Radiation protection: cone beam CT for dental and maxillofacial radiology. Evidence based guidelines. Geneva, Switzerland: European Commission; 2011. Available from: http://wwwsedentexcteu/guidelines [Google Scholar]
- 14.Pauwels R, Stamatakis H, Bosmans H, Bogaerts R, Jacobs R, Horner K, et al Quantification of metal artifacts on cone beam computed tomography images. Clin Oral Implants Res Dec 2011. Epub ahead of print 10.1111/j.1600-0501.2011.02382.x [DOI] [PubMed] [Google Scholar]
- 15.Jaffray DA. Cone-beam computed tomography with a flat-panel imager: initial performance characterization. Med Phys 2000; 27: 1311–1323 [DOI] [PubMed] [Google Scholar]
- 16.Chindasombatjaroen J, Kakimoto N, Murakami S, Maeda Y, Furukawa S. Quantitative analysis of metallic artifacts caused by dental metals: comparison of cone-beam and multi-detector row CT scanners. Oral Radiol (0911-6028) 2011; 27: 114–120 [Google Scholar]
- 17.van der Schaaf I, van Leeuwen M, Vlassenbroek A, Velthuis B. Minimizing clip artifacts in multi CT angiography of clipped patients. AJNR Am J Neuroradiol 2006; 27: 60–66 [PMC free article] [PubMed] [Google Scholar]
- 18.Araki K, Okano T. The effect of surrounding conditions on pixel value of cone beam computed tomography. Clin Oral Implants Res Nov 2011. Epub ahead of print 10.1111/j.1600-0501.2011.02373.x [DOI] [PubMed] [Google Scholar]
- 19.Nackaerts O, Maes F, Yan H, Couto Souza P, Pauwels R, Jacobs R. Analysis of intensity variability in multislice and cone beam computed tomography. Clin Oral Implants Res 2011; 22: 873–879 10.1111/j.1600-0501.2010.02076.x [DOI] [PubMed] [Google Scholar]
- 20.Loubele M, Bogaerts R, Van Dijck E, Pauwels R, Vanheusden S, Suetens P, et al. Comparison between effective radiation dose of CBCT and MSCT scanners for dentomaxillofacial applications. Eur J Radiol 2009; 71: 461–468 10.1016/j.ejrad.2008.06.002 [DOI] [PubMed] [Google Scholar]